dredging sound levels, numerical modelling and eia · dredging sound levels, numerical modelling...
TRANSCRIPT

ABSTRACT
This paper was initially presented at the CEDA Dredging Days in November 2015 and was included in the conference proceedings. It is reprinted here in an adapted version with permission.
Underwater sound from anthropogenic sources and its potential adverse effects on the marine environment is a topic of much global interest. In recent years, there is recognition that sound from some shipping and dredging activities could have impact on the marine environment, particularly in deep sea areas where low frequency sound can travel long distances.
Dredging activities emit underwater sound in the marine environment. Monitoring of sound from dredging equipment is occasionally carried out for an individual project and usually only to support research. Because of the way in which sound interacts with the marine environment, the propagation of sound from individual dredging vessels will vary depending on the activity and location of the dredging. The level of sound at the dredger, termed the source level, will also vary between dredgers due to a range of different environmental and mechanical factors. Thus, applying this
monitoring information to other projects is not always straightforward.
The article presents an overview of known sound source levels for various dredging equipment and activities and it describes a method used to extrapolate source levels based on the pump power when a source level has not been directly measured. Furthermore, the article explains how information can be used to predict the propagation of sound from dredging activities using numerical modelling tools for Environmental Impact Assessment (EIA) purposes.
INTRODUCTION
Interest in underwater sound from anthropogenic sources and its potential adverse effects on the marine environment has been increasing in recent years, driven by increases in shipping and coastal and offshore development. This interest is also driven by the introduction of legislation relating to
underwater sound emissions and its potential effects, e.g., the European Union Marine Strategy Framework Directive (MSFD). Also, the potential impacts of sound from shipping, dredging and other maritime activities on the marine environment are being recognised.
Guidance on the levels of sound, the potential effects on the marine environment and mitigation measures that could be employed has been developed for myriad marine activities. However, apart from position papers from dredging associations, there is little guidance on the effects of sound from dredging on the marine environment or how to assess, monitor or mitigate for any potential effects. Monitoring of sound emitted by dredging has been carried out but most of this information is not available in the public domain. This makes it challenging to assess the potential impacts of underwater sound from dredging vessels. The potential effects of dredging sounds on marine life are also not well understood and work is underway to identify and quantify these for use in Environmental Impact Assessments (EIA) and establishment of guidelines.
Assessments of the potential effects of anthropogenic sound on the marine environment often rely on predictive numerical modelling techniques to
DREDGING SOUND LEVELS, NUMERICAL MODELLING AND EIA
DIANE JONES AND KERRY MARTEN
Dredging Sound Levels, Numerical Modelling and EIA 21
Above: A dredger vessel undertaking construction work
at the Maasvlakte 2 project. Underwater sound
monitoring was conducted during activities from
dredgers during this project providing data on source
levels of these activities

22 Terra et Aqua | Number 144 | September 2016
determine the distance sound will travel and how high the Received Level (RL) will be. To achieve this, the source level of the anthropogenic sound is required, along with a suitable numerical model. Using the measured source level of a particular dredging vessel to predict sound propagation is preferable, but for practical reasons this information is not always available during the EIA stage and a substitute value will be required. Equally, the selection of a suitable numerical model can be challenging as it is not always clear how a model calculates the propagation of sound or which oceanographic factors it accounts for. There is very little guidance on how to choose a substitute value or a suitable numerical model, although a recent good practice guide from the UK (Robinson et al., 2014) does offer some information.
This article presents a brief summary on underwater sound from dredging activities gathered from publicly available studies carried out to date. It is apparent from this literature review that there are significant differences in the ways in which underwater sound data is collected. This makes comparison or critique of the measurement methods and calculations challenging. The article also presents a discussion on how source levels, measured or predicted, can be used in numerical models to predict the propagation of sound from dredging activities and how this can be related to effects on the marine environment. Furthermore, a novel method of extrapolating source levels from dredging activities when they are not known is explained.
SOUND FROM DREDGINGAs with all sources of underwater sound, the source level of the dredging activity is
variable and can be affected by many factors which include the sediment type that is being dredged, the water depth, salinity and seasonal phenomena such as thermoclines (Robinson et al., 2014 and Jensen et al., 2000). These factors will also affect the propagation of sound from dredging activities and along with ambient sound already present, will influence the distance at which dredger sounds can be detected (Jensen et al., 2000 and Reine and Dickerson, 2014). Different types of dredgers also emit different levels of sound, which will further vary, depending on the activity being undertaken such as sediment extraction and rainbowing (Reine and Dickerson, 2014 and Reine et al., 2012a).
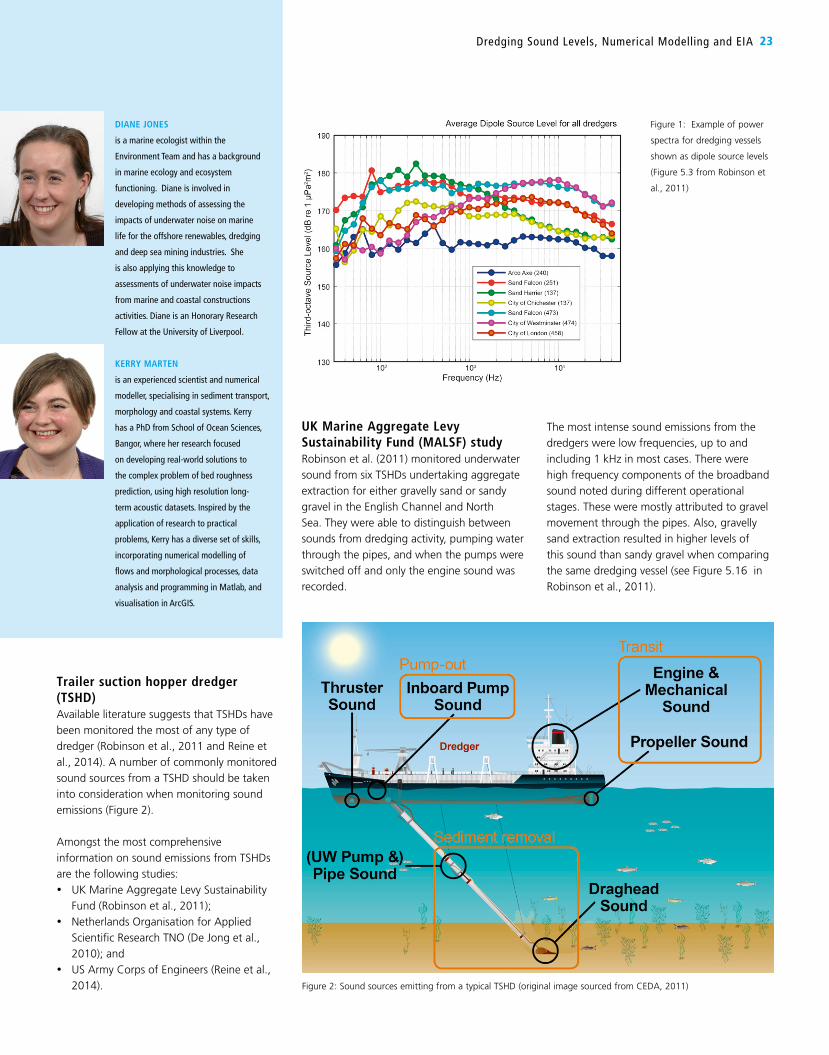
Sound is expressed as either broadband or the level at a particular frequency. Broadband sound encompasses all of the energy from the frequencies within a given bandwidth e.g. 250-500 Hz. In addition, knowing the bandwidth of the recording instruments used in a study will aid in understanding sound emissions from any given source. Sound emissions can also be presented as discrete (or individual) frequencies rather than as broadband and the level of sound detected per frequency is often represented graphically as the power spectral density (PSD) – the spread of power over the frequency range recorded (Figure 1).
Thus far, four types of dredging vessels have been monitored for underwater sound emissions: trailer suction hopper dredger (TSHD), cutter suction dredger (CSD), backhoe dredger and clam/bucket dredger (Dickerson et al., 2001; Reine et al., 2014; Reine et al., 2012b and Reine et al., 2012a). A brief summary is presented (for a more in depth review see Jones et al., 2015). Not all of the data on sound from dredgers is comparable – only two studies for TSHDs are directly comparable (Robinson et al., 2011 and De Jong et al., 2010) as they utilise the same methods to collect data and calculate source levels. Studies of other TSHDs and dredger types were not conducted in the same manner and it would be unwise to directly compare information because of these differences. Many of the studies have, however, presented the raw data which could be used for further detailed analysis.
GLOSSARY*Term ExplanationAmbient sound The sound present in the marine environment due to wind, waves, surf,
animal sound and other sources not related to the project.Attenuation The weakening or reducing the amplitude of a sound caused by absorption in
the water and sediment, spreading of the sound.Bandwidth The difference between upper and lower band edge frequencies
(Δ f = fup - flow)dB re 1 µPa The decibel scale used in underwater acoustics is referenced to 1 µPa (in air it
is referenced to 20 µPa, the threshold of human hearing).EU European UnionPower Spectral Density (PSD)
The spectral density of the wave, when multiplied by an appropriate factor, will give the power carried by the wave, per unit frequency, known as the power spectral density (PSD) of the signal. Power spectral density is commonly expressed in watts per Hertz (W/Hz).
Received Level (RL)
The sound pressure level (SPL) received by a species for a given frequency and source level. Given as rms dB re 1µPa.
Root Mean Square (RMS)
RMS of a time-varying quantity is obtained by squaring the amplitude at each instant, obtaining the average of the squared values over the interval of interest, and then taking the square root of this average. For a sine wave, if you multiply the RMS value by the square root of 2 (1.414), you get the peak value of the wave. The RMS value, also called the effective value of the sound pressure, is the best measure of ordinary continuous sound.
Sound Pressure Level (SPL)
The pressure of sound for a given frequency.
Source level (SL)
Source levels for underwater sound are usually quoted as the source level 1m from the sound source. Measuring the received level at a distance from the source and estimating the transmission loss over that distance can be used to calculate source level at 1m, but only if measurements are available. Units are usually given as dB re 1 µPa2S.
*An ISO document is in preparation to standardise the terminology used when describing underwater sound and the
units which should be used to express these metrics. As such, these definitions are subject to change
Dredging Sound Levels, Numerical Modelling and EIA 23
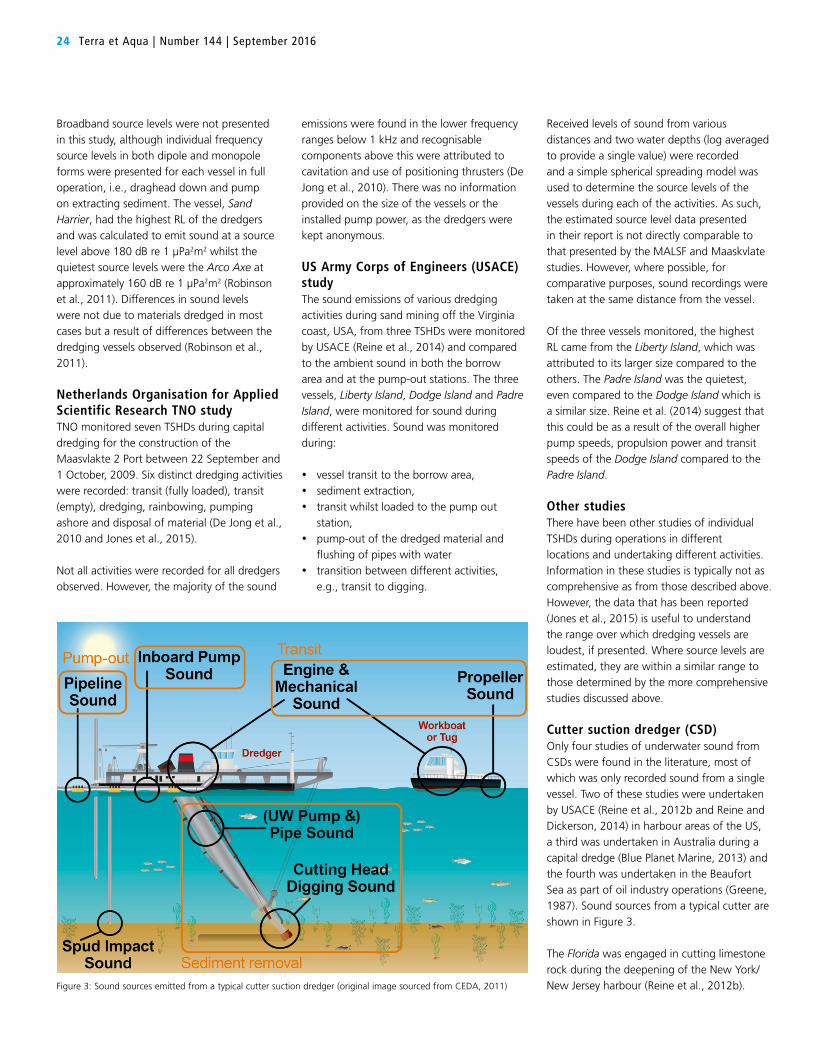
Trailer suction hopper dredger (TSHD)Available literature suggests that TSHDs have been monitored the most of any type of dredger (Robinson et al., 2011 and Reine et al., 2014). A number of commonly monitored sound sources from a TSHD should be taken into consideration when monitoring sound emissions (Figure 2).
Amongst the most comprehensive information on sound emissions from TSHDs are the following studies:• UK Marine Aggregate Levy Sustainability
Fund (Robinson et al., 2011); • Netherlands Organisation for Applied
Scientific Research TNO (De Jong et al., 2010); and
• US Army Corps of Engineers (Reine et al., 2014).
UK Marine Aggregate Levy Sustainability Fund (MALSF) studyRobinson et al. (2011) monitored underwater sound from six TSHDs undertaking aggregate extraction for either gravelly sand or sandy gravel in the English Channel and North Sea. They were able to distinguish between sounds from dredging activity, pumping water through the pipes, and when the pumps were switched off and only the engine sound was recorded.
The most intense sound emissions from the dredgers were low frequencies, up to and including 1 kHz in most cases. There were high frequency components of the broadband sound noted during different operational stages. These were mostly attributed to gravel movement through the pipes. Also, gravelly sand extraction resulted in higher levels of this sound than sandy gravel when comparing the same dredging vessel (see Figure 5.16 in Robinson et al., 2011).
Figure 1: Example of power
spectra for dredging vessels
shown as dipole source levels
(Figure 5.3 from Robinson et
al., 2011)
DIANE JONES
is a marine ecologist within the
Environment Team and has a background
in marine ecology and ecosystem
functioning. Diane is involved in
developing methods of assessing the
impacts of underwater noise on marine
life for the offshore renewables, dredging
and deep sea mining industries. She
is also applying this knowledge to
assessments of underwater noise impacts
from marine and coastal constructions
activities. Diane is an Honorary Research
Fellow at the University of Liverpool.
KERRY MARTEN
is an experienced scientist and numerical
modeller, specialising in sediment transport,
morphology and coastal systems. Kerry
has a PhD from School of Ocean Sciences,
Bangor, where her research focused
on developing real-world solutions to
the complex problem of bed roughness
prediction, using high resolution long-
term acoustic datasets. Inspired by the
application of research to practical
problems, Kerry has a diverse set of skills,
incorporating numerical modelling of
flows and morphological processes, data
analysis and programming in Matlab, and
visualisation in ArcGIS.
Figure 2: Sound sources emitting from a typical TSHD (original image sourced from CEDA, 2011)
Received levels of sound from various distances and two water depths (log averaged to provide a single value) were recorded and a simple spherical spreading model was used to determine the source levels of the vessels during each of the activities. As such, the estimated source level data presented in their report is not directly comparable to that presented by the MALSF and Maaskvlate studies. However, where possible, for comparative purposes, sound recordings were taken at the same distance from the vessel.
Of the three vessels monitored, the highest RL came from the Liberty Island, which was attributed to its larger size compared to the others. The Padre Island was the quietest, even compared to the Dodge Island which is a similar size. Reine et al. (2014) suggest that this could be as a result of the overall higher pump speeds, propulsion power and transit speeds of the Dodge Island compared to the Padre Island.
Other studiesThere have been other studies of individual TSHDs during operations in different locations and undertaking different activities. Information in these studies is typically not as comprehensive as from those described above. However, the data that has been reported (Jones et al., 2015) is useful to understand the range over which dredging vessels are loudest, if presented. Where source levels are estimated, they are within a similar range to those determined by the more comprehensive studies discussed above.
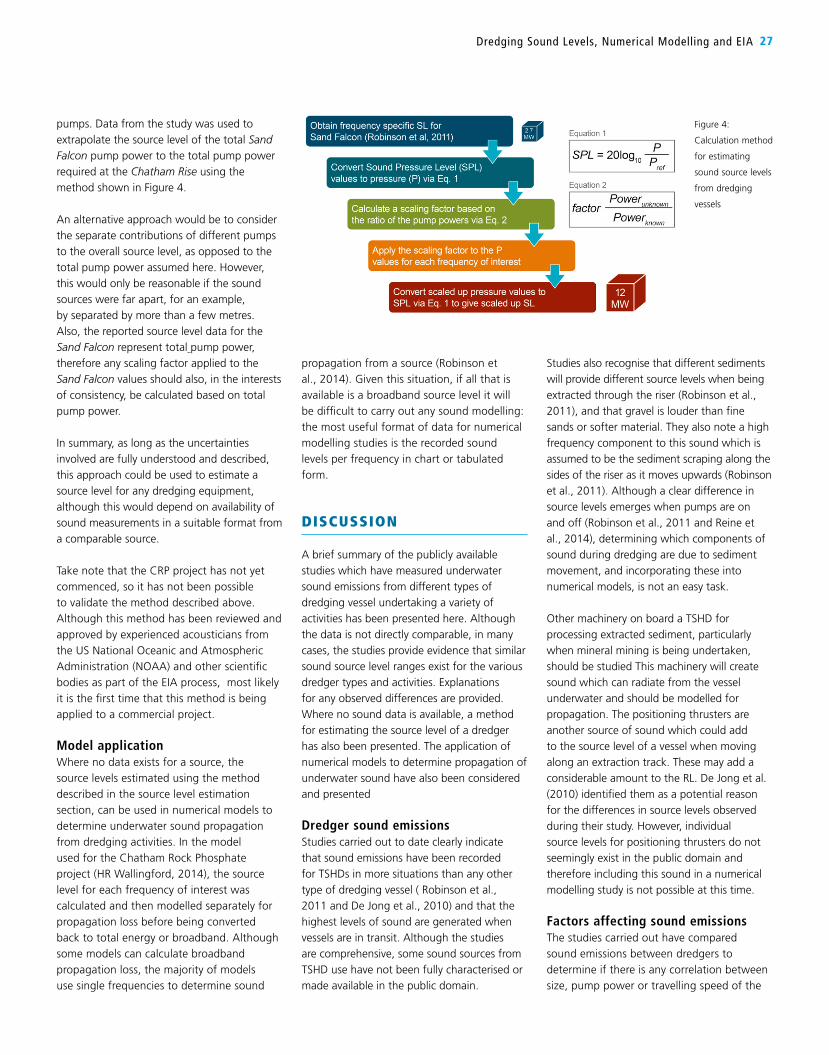
Cutter suction dredger (CSD)Only four studies of underwater sound from CSDs were found in the literature, most of which was only recorded sound from a single vessel. Two of these studies were undertaken by USACE (Reine et al., 2012b and Reine and Dickerson, 2014) in harbour areas of the US, a third was undertaken in Australia during a capital dredge (Blue Planet Marine, 2013) and the fourth was undertaken in the Beaufort Sea as part of oil industry operations (Greene, 1987). Sound sources from a typical cutter are shown in Figure 3.
The Florida was engaged in cutting limestone rock during the deepening of the New York/New Jersey harbour (Reine et al., 2012b).
Broadband source levels were not presented in this study, although individual frequency source levels in both dipole and monopole forms were presented for each vessel in full operation, i.e., draghead down and pump on extracting sediment. The vessel, Sand Harrier, had the highest RL of the dredgers and was calculated to emit sound at a source level above 180 dB re 1 µPa2m2 whilst the quietest source levels were the Arco Axe at approximately 160 dB re 1 µPa2m2 (Robinson et al., 2011). Differences in sound levels were not due to materials dredged in most cases but a result of differences between the dredging vessels observed (Robinson et al., 2011).
Netherlands Organisation for Applied Scientific Research TNO studyTNO monitored seven TSHDs during capital dredging for the construction of the Maasvlakte 2 Port between 22 September and 1 October, 2009. Six distinct dredging activities were recorded: transit (fully loaded), transit (empty), dredging, rainbowing, pumping ashore and disposal of material (De Jong et al., 2010 and Jones et al., 2015).
Not all activities were recorded for all dredgers observed. However, the majority of the sound
24 Terra et Aqua | Number 144 | September 2016
emissions were found in the lower frequency ranges below 1 kHz and recognisable components above this were attributed to cavitation and use of positioning thrusters (De Jong et al., 2010). There was no information provided on the size of the vessels or the installed pump power, as the dredgers were kept anonymous.
US Army Corps of Engineers (USACE) studyThe sound emissions of various dredging activities during sand mining off the Virginia coast, USA, from three TSHDs were monitored by USACE (Reine et al., 2014) and compared to the ambient sound in both the borrow area and at the pump-out stations. The three vessels, Liberty Island, Dodge Island and Padre Island, were monitored for sound during different activities. Sound was monitored during:
• vessel transit to the borrow area, • sediment extraction, • transit whilst loaded to the pump out
station, • pump-out of the dredged material and
flushing of pipes with water • transition between different activities,
e.g., transit to digging.
Figure 3: Sound sources emitted from a typical cutter suction dredger (original image sourced from CEDA, 2011)

The ambient sound in the area was 97-131 dB re 1µPa rms, and the authors assumed a spreading loss of 15LogR when calculating source levels of the dredger. This provided an overall source level of 175 dB re 1µPa @1 m, 44-78 dB louder than the ambient levels. Low frequency sound of relevance to sensitive fish species was considered and compared to total energy across all frequencies recorded. For a 50-1000 Hz band, source levels were 3.5 dB lower than when all frequencies were considered. For 100-400 Hz band, source levels were 9.9 dB lower. No explanation is given for this difference.
Overall, source levels for CSDs appear to range from 157.5-187 dB re 1µPa@1m depending on the vessel size, activity being undertaken and the environmental conditions at the time of monitoring. This is in line with TSHD activities, although the levels for cutters have not been gathered in the same manner and any comparisons should be treated with caution.
Backhoe dredger (BD)There are only two studies in the available literature discussing the sound emissions from backhoe dredgers – one by USACE (Reine et al., 2012a) and one by SubAcoustech (Nedwell et al., 2008). The latter study reports the source levels for overall dredging activity, the bucket striking the seabed,
excavation of sediment and vessel movement during dredging works at Lerwick Harbour, Shetland in the UK (Nedwell et al., 2008). The former study reports highlighted the following:
• engine/generator sounds,• movement of the hydraulic ram, • barge loading with sediment, • anchoring of the dredge spuds and
walking with the spuds of the New York during the removal of limestone gravel in the New York/New Jersey harbour which had previously been cut by the cutter dredger Florida (Reine et al., 2012a).
Although these two studies recorded sound emissions from only one vessel, the information gathered appears comprehensive and covers many of the activities that backhoe dredgers undertake. However, it is likely that different methods were employed to collect and extrapolate source levels, so direct comparisons between the data are not recommended. The data presented are summarised in Table I.
Bucket/Clamshell dredgerOnly one study was found in the available literature for sound emissions from a bucket/clamshell dredger, in which two vessels
were studied (Dickerson et al., 2001), the Viking and the Crystal Gayle. The Viking was engaged in navigation channel deepening, removing coarse sand and gravel; the Crystal Gayle was carrying out maintenance dredging of unconsolidated sediments. The majority of the sounds recorded were in the 20-1,000 Hz frequency range. Only the sound of the bucket striking the seabed was recorded for the Crystal Gayle, returning a peak received level of 107 dB re 1 µPa @150m for 91.5 Hz. More activities of the Viking were recorded (Table II).
UNDERWATER SOUND AND EIAUnderstanding how far the sound from dredging activities will travel underwater and how loud it will be at specific distances, helps environmental practitioners to interpret and assess potential environmental impacts. Numerical modelling of underwater sound propagation is often employed to provide this information for the purposes of EIA (World Organisation of Dredging Associations, 2013).
Numerical modellingPredicting the propagation of underwater sound from a dredger can be carried out using either simple spherical or cylindrical spreading equations or more sophisticated models which take into account a wider range of oceanographic factors such as parabolic equation and ray trace. Having source levels for sound is key to this modelling and these are extrapolated from recorded data using numerical techniques such as simple spreading. For example, this could be using the equation N.Log(R), where R is the distance from the source at which the sound was measured and N is a value between 10 and 20 (Robinson et al., 2014).
Source levels of sound from ships, including dredgers, are presented as either monopole or dipole formats. For a monopole source level, the sound is assumed to propagate at the same intensity in all directions simultaneously, i.e., it is omnidirectional. A dipole level is assumed to be two sources infinitesimally close to each other and operating at the same frequency (Robinson et al., 2011). As the water surface acts as a reflector for ships – which means that the dredger source is very close to a reflected source – the source levels from dredgers are best presented in a dipole format. However, the monopole format is more commonly used
Dredging Sound Levels, Numerical Modelling and EIA 25
Vessel Activity Received level and distance from source dB re 1µPa RMS
Estimated source level dB re 1µPa @1m
Other information
New York Engine noise - 167 Not detected more than 350m from source
New York Sediment extraction
- 179 Not detected more than 175m from source
New York Anchoring of spuds
- 172 Not detected more than 220m from source
New York Spud “walking” - 175New York Barge loading - 166 Not detected more than
170m from sourceNew York Hydraulic ram - 164 Not detected more than
330m from sourceManu Pekka Ship generators
and mechanism movement
140-145 @7m 154 -
Manu Pekka Bucket extraction of sediment
145-162 @7m 163 -
Table I: Summary of backhoe dredger sound emissions during operations

26 Terra et Aqua | Number 144 | September 2016
in the majority of propagation models as it can be computationally intense to model dipole propagation because, once in the acoustic far field, the two sound sources (ship and water surface) will appear to be a single source. This means that propagation of sound in the near field around a dredger is difficult to predict unless sophisticated modelling is undertaken.
MODEL PARAMETERS AND APPLICATIONA monopole source level is determined using a spreading model which takes into account the interaction of sound with the seabed and water surface and absorption by the water (Robinson et al., 2014). As the formula N.Log(R) does not take these factors into account this method should not be used, unless the value of N is 20 when used for deep sea source level estimation (Robinson et al., 2014). Understanding whether a source level has been presented as a monopole or dipole form before it can be used is important. Otherwise, there is a risk of underestimating low frequency source
levels and overestimating high frequencies (Robinson et al., 2011). It is possible to convert from one format to the other (Robinson et al., 2011; De Jong et al., 2010 and Ainslie, 2010).
The local bathymetry, sediment type, and water temperature and salinity will affect how sound propagates through water. Additionally, the absorption of sound through water varies with frequency and needs to be accounted for in a model, as does reflection from the sea bed and water surface. Therefore, a model must be parameterised with these oceanographic factors, which may mean that different models could be used to determine propagation from a single source.
Etter (2012) identified the various model types and the most suitable applications for them (Table III). However, these are flexible, as tools can be developed which will account for factors such as changing absorption with frequency, whilst the model alone may not have done so.
Source level estimation Although there have been numerous studies of underwater sound emissions from dredging vessels, it is inevitable that not every dredging vessel has been characterised. For some dredger types such as the backhoe, information is lacking. Information is also lacking as related to sound emissions from dredgers operating in deep water, e.g., greater than 100m, which is increasingly of interest as sea bed mineral deposits are located in deeper ocean areas. Obtaining this source level information is key to carrying out sound propagation modelling for EIA purposes as well as for carrying out a qualitative assessment of the potential effects of dredger sounds on marine life if modelling is not undertaken. Whilst it may be possible to use a substitute source level for a similar sized dredger undertaking similar activities, this is not always the case. A method to estimate the source level of dredger activities is required.
CASE STUDYSource level estimation for deep-sea miningA method for estimating source levels was developed for underwater sound emissions of deep sea dredging for the Chatham Rock Phosphate (CRP) project, to be conducted on the Chatham Rise, a seamount-like feature offshore of New Zealand (HR Wallingford, 2014).The project entailed extraction of phosphate nodules in water depths of up to 400m. This required a new type of pump that would be placed near the seabed rather than on the dredger to power the sediment removal. Provision of sufficient power to transport mined material 400m to the dredger required an estimated total pump power of up to 12 MW. This would be achieved by combining pumps, including up to two dredge pumps, a jet pump and associated thrusters. There are no known sound recordings of such high power pump configurations, in air or underwater. Consequently, the source levels were derived using information on pump source levels for the Sand Falcon available in the MALSF report of Robinson et al. (2011). The Sand Falcon had the largest pump power of the dredgers assessed in the MALSF study with a total of 2.7 MW from two dredge
Model Type
ApplicationsShallow water Deep water
Low frequency High frequency Low frequency High frequency
RI RD RI RD RI RD RI RD
Ray Theory ○ ○ ◘ ● ◘ ◘ ● ●
Normal Mode ● ◘ ● ◘ ● ◘ ◘ ○
Full-field ● ◘ ● ◘ ● ◘ ◘ ◘
Parabolic Equation ◘ ● ◘ ◘ ◘ ● ◘ ◘
Key
● - Modelling approach is both applicable (physically) and practical
(computationally)
◘ - Limitations in accuracy or in speed of execution
○ - Neither applicable or practical
Low frequency < 500Hz
High frequency >500Hz
RI = Range independent
RD = Range dependent
Table III: Applications of various acoustic model types, based on Etter (2012)
Activity Received level dB re 1µPa
Bottom contact of bucket 124 @150 m
Digging of sediment 113 @150 m
Bucket closing 99 @150 m
Winch in/out of bucket 116 @150 m
Material dropped onto barge 108 @150 m (material onto empty barge)
Emptying barge 108 @316 m
Table II: Summary of sound emissions from the bucket dredger Viking during channel deepening
Studies also recognise that different sediments will provide different source levels when being extracted through the riser (Robinson et al., 2011), and that gravel is louder than fine sands or softer material. They also note a high frequency component to this sound which is assumed to be the sediment scraping along the sides of the riser as it moves upwards (Robinson et al., 2011). Although a clear difference in source levels emerges when pumps are on and off (Robinson et al., 2011 and Reine et al., 2014), determining which components of sound during dredging are due to sediment movement, and incorporating these into numerical models, is not an easy task.
Other machinery on board a TSHD for processing extracted sediment, particularly when mineral mining is being undertaken, should be studied This machinery will create sound which can radiate from the vessel underwater and should be modelled for propagation. The positioning thrusters are another source of sound which could add to the source level of a vessel when moving along an extraction track. These may add a considerable amount to the RL. De Jong et al. (2010) identified them as a potential reason for the differences in source levels observed during their study. However, individual source levels for positioning thrusters do not seemingly exist in the public domain and therefore including this sound in a numerical modelling study is not possible at this time.
Factors affecting sound emissionsThe studies carried out have compared sound emissions between dredgers to determine if there is any correlation between size, pump power or travelling speed of the
propagation from a source (Robinson et al., 2014). Given this situation, if all that is available is a broadband source level it will be difficult to carry out any sound modelling: the most useful format of data for numerical modelling studies is the recorded sound levels per frequency in chart or tabulated form.
DISCUSSION
A brief summary of the publicly available studies which have measured underwater sound emissions from different types of dredging vessel undertaking a variety of activities has been presented here. Although the data is not directly comparable, in many cases, the studies provide evidence that similar sound source level ranges exist for the various dredger types and activities. Explanations for any observed differences are provided. Where no sound data is available, a method for estimating the source level of a dredger has also been presented. The application of numerical models to determine propagation of underwater sound have also been considered and presented
Dredger sound emissionsStudies carried out to date clearly indicate that sound emissions have been recorded for TSHDs in more situations than any other type of dredging vessel ( Robinson et al., 2011 and De Jong et al., 2010) and that the highest levels of sound are generated when vessels are in transit. Although the studies are comprehensive, some sound sources from TSHD use have not been fully characterised or made available in the public domain.
Dredging Sound Levels, Numerical Modelling and EIA 27
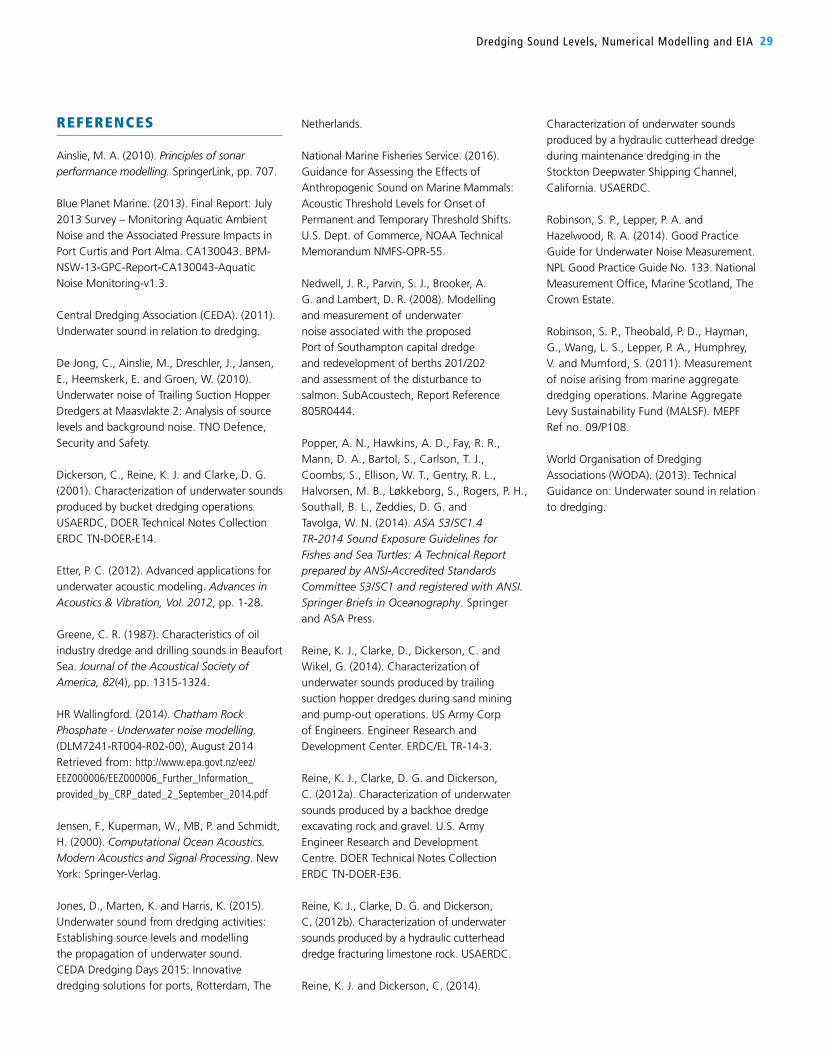
pumps. Data from the study was used to extrapolate the source level of the total Sand Falcon pump power to the total pump power required at the Chatham Rise using the method shown in Figure 4.
An alternative approach would be to consider the separate contributions of different pumps to the overall source level, as opposed to the total pump power assumed here. However, this would only be reasonable if the sound sources were far apart, for an example, by separated by more than a few metres. Also, the reported source level data for the Sand Falcon represent total pump power, therefore any scaling factor applied to the Sand Falcon values should also, in the interests of consistency, be calculated based on total pump power.
In summary, as long as the uncertainties involved are fully understood and described, this approach could be used to estimate a source level for any dredging equipment, although this would depend on availability of sound measurements in a suitable format from a comparable source.
Take note that the CRP project has not yet commenced, so it has not been possible to validate the method described above. Although this method has been reviewed and approved by experienced acousticians from the US National Oceanic and Atmospheric Administration (NOAA) and other scientific bodies as part of the EIA process, most likely it is the first time that this method is being applied to a commercial project.
Model applicationWhere no data exists for a source, the source levels estimated using the method described in the source level estimation section, can be used in numerical models to determine underwater sound propagation from dredging activities. In the model used for the Chatham Rock Phosphate project (HR Wallingford, 2014), the source level for each frequency of interest was calculated and then modelled separately for propagation loss before being converted back to total energy or broadband. Although some models can calculate broadband propagation loss, the majority of models use single frequencies to determine sound
Figure 4:
Calculation method
for estimating
sound source levels
from dredging
vessels

28 Terra et Aqua | Number 144 | September 2016
seems to be dipole broadband, carrying out numerical modelling of propagation is limited to even fewer studies.
Determining which sound sources on a dredger should be modelled is also an important consideration. In the study carried out by HR Wallingford (2014) at Chatham Rise, dredger pumps on the seabed were comprised of several units mounted on a frame 25m above the sea floor. Each of the units would be a sound source. However the design of the frame meant that each of the pumps would be relatively close together and as such would appear to be a single source in the acoustic far field. Therefore, extrapolating the source level for the pumps on the seabed amalgamated all of the sources on the frame into a single sound source for use in the modelling study.
If several sound sources are operating at the same time on board a dredger then it could be argued that they should be counted as a single sound source and not separately modelled. For example, the thrusters on a dredger may be close to the propulsion system and may therefore be indistinguishable from each other, at least to the acoustic far field. The same applies to the sound of pumps and sediment moving through a riser, although this may depend on the length of the riser.
If the vessel is operating in deep water, it is important to determine the depth at which the sound source will be operating (Robinson et al., 2014). The effect on monopole source levels of different water depths, even by a few metres, can be significant at lower frequencies, particularly in the bandwidth of 200-1000 Hz (see Robinson et al., 2011). As such, establishing the depth of the source is essential to determining the correct source levels and for parameterising the model for realistic propagation of sound. As the effect of source depth is most pronounced at lower frequencies, this is particularly important for evaluating the effects on species which are most sensitive to sound in this band, e.g., fish, baleen whales (Popper et al., 2014 and National Marine Fisheries Service, 2016).
The lack of monopole source levels in the literature can be a limiting factor when numerical modelling of dredger sound is required (Robinson et al., 2014). Only two of the studies discussed here reported monopole source levels and provided frequency specific spectra which could be used in numerical modelling ( Robinson et al., 2011 and De Jong et al., 2010). Most studies provide frequency spectra in a dipole format, if at all, which can be converted using the relationship determined by Ainslie (2010). As the most common form of reporting source levels
vessels and sound levels emitted (De Jong et al., 2010 and Robinson et al., 2011). Water depth and sediment types were also taken into consideration in some cases. Robinson et al. (2011) identified sediment type extracted as the main factor affecting estimated source levels from dredgers, rather than the length of the dredger. However, Reine et al. (2014) noted that the Liberty Island, the largest of the three vessels monitored, was also the loudest for the majority of dredging activities studied. They attributed this to the length of the vessel. However, pump power, propulsion power and speed of the dredger when in transit may also affect source levels recorded rather than size of vessels ( Reine et al., 2014). In summary, there is considerable uncertainty over which aspects of a dredging vessel have the greatest effect on sound source levels.
Water depth and sediment type will affect the distance at which the sound from dredging, particularly low frequencies, will be detectable, as will the local ambient sound. In particular, sound will travel further in deep water and in areas of coarse seabed sediments compared to shallow water and soft seabed sediments. A quieter area may seem to be impacted more as a result of the lack of other sounds which maskthe sound from dredging activities. For example, engine sounds from dredging activities in the busy harbour of New York were not detectable beyond 330m from the source (Reine et al., 2012a), whereas the sound of dredging vessels in the quiet of the Beaufort Sea was determined to be detectable between 14-30km from the source. In fact, the dredger in New York harbour was calculated to be louder than the one in the Beaufort Sea but the sound was masked due to the local ambient sound being higher.
Sound modellingNumerical models to determine sound propagation of dredgers are often used in EIA. Using the most appropriate model for the study in question, and determining the source levels to use in the model, can be a difficult task, particularly if the source level of the sound is not yet known. There are several different sound sources on a dredger to take into account when assessing underwater sound propagation.
CONCLUSIONS
Considerable work is underway to establish a standard method of reporting sound emissions from dredging activities, which sound sources to monitor, and how to monitor them. Broadband dipole sound source information is very difficult to use in a numerical model for determining potential impacts. It is, however, useful for comparing the sound emissions between dredgers and other types of vessels as long as the method used to determine the source level and the units in which they are expressed are comparable.
Further work on the less studied dredger types (backhoe, cutter and bucket) would be advantageous to increase the amount
of data available for use in numerical modelling for an EIA. Even though it has been established that mathematical methods to extrapolate a source level can be used for numerical modelling and are accepted by regulators, this is not an ideal situation for any study as it introduces a level of uncertainty to the predicted propagations. It is, therefore, important that work continues on determining the sound emissions from lesser known sound sources on board dredging vessels as well as emerging dredging equipment. This will ultimately contribute to enabling the sound from dredging activities to be accurately modelled and effectively assessed.
Dredging Sound Levels, Numerical Modelling and EIA 29
Ainslie, M. A. (2010). Principles of sonar performance modelling. SpringerLink, pp. 707.
Blue Planet Marine. (2013). Final Report: July 2013 Survey – Monitoring Aquatic Ambient Noise and the Associated Pressure Impacts in Port Curtis and Port Alma. CA130043. BPM-NSW-13-GPC-Report-CA130043-Aquatic Noise Monitoring-v1.3.
Central Dredging Association (CEDA). (2011). Underwater sound in relation to dredging.
De Jong, C., Ainslie, M., Dreschler, J., Jansen, E., Heemskerk, E. and Groen, W. (2010). Underwater noise of Trailing Suction Hopper Dredgers at Maasvlakte 2: Analysis of source levels and background noise. TNO Defence, Security and Safety.
Dickerson, C., Reine, K. J. and Clarke, D. G. (2001). Characterization of underwater sounds produced by bucket dredging operations. USAERDC, DOER Technical Notes Collection ERDC TN-DOER-E14.
Etter, P. C. (2012). Advanced applications for underwater acoustic modeling. Advances in Acoustics & Vibration, Vol. 2012, pp. 1-28.
Greene, C. R. (1987). Characteristics of oil industry dredge and drilling sounds in Beaufort Sea. Journal of the Acoustical Society of America, 82(4), pp. 1315-1324.
HR Wallingford. (2014). Chatham Rock Phosphate - Underwater noise modelling. (DLM7241-RT004-R02-00), August 2014 Retrieved from: http://www.epa.govt.nz/eez/EEZ000006/EEZ000006_Further_Information_provided_by_CRP_dated_2_September_2014.pdf
Jensen, F., Kuperman, W., MB, P. and Schmidt, H. (2000). Computational Ocean Acoustics. Modern Acoustics and Signal Processing. New York: Springer-Verlag.
Jones, D., Marten, K. and Harris, K. (2015). Underwater sound from dredging activities: Establishing source levels and modelling the propagation of underwater sound. CEDA Dredging Days 2015: Innovative dredging solutions for ports, Rotterdam, The
Netherlands.
National Marine Fisheries Service. (2016). Guidance for Assessing the Effects of Anthropogenic Sound on Marine Mammals: Acoustic Threshold Levels for Onset of Permanent and Temporary Threshold Shifts. U.S. Dept. of Commerce, NOAA Technical Memorandum NMFS-OPR-55.
Nedwell, J. R., Parvin, S. J., Brooker, A. G. and Lambert, D. R. (2008). Modelling and measurement of underwater noise associated with the proposed Port of Southampton capital dredge and redevelopment of berths 201/202 and assessment of the disturbance to salmon. SubAcoustech, Report Reference 805R0444.
Popper, A. N., Hawkins, A. D., Fay, R. R., Mann, D. A., Bartol, S., Carlson, T. J., Coombs, S., Ellison, W. T., Gentry, R. L., Halvorsen, M. B., Løkkeborg, S., Rogers, P. H., Southall, B. L., Zeddies, D. G. and Tavolga, W. N. (2014). ASA S3/SC1.4 TR-2014 Sound Exposure Guidelines for Fishes and Sea Turtles: A Technical Report prepared by ANSI-Accredited Standards Committee S3/SC1 and registered with ANSI. Springer Briefs in Oceanography. Springer and ASA Press.
Reine, K. J., Clarke, D., Dickerson, C. and Wikel, G. (2014). Characterization of underwater sounds produced by trailing suction hopper dredges during sand mining and pump-out operations. US Army Corp of Engineers. Engineer Research and Development Center. ERDC/EL TR-14-3.
Reine, K. J., Clarke, D. G. and Dickerson, C. (2012a). Characterization of underwater sounds produced by a backhoe dredge excavating rock and gravel. U.S. Army Engineer Research and Development Centre. DOER Technical Notes Collection ERDC TN-DOER-E36.
Reine, K. J., Clarke, D. G. and Dickerson, C. (2012b). Characterization of underwater sounds produced by a hydraulic cutterhead dredge fracturing limestone rock. USAERDC.
Reine, K. J. and Dickerson, C. (2014).
Characterization of underwater sounds produced by a hydraulic cutterhead dredge during maintenance dredging in the Stockton Deepwater Shipping Channel, California. USAERDC.
Robinson, S. P., Lepper, P. A. and Hazelwood, R. A. (2014). Good Practice Guide for Underwater Noise Measurement. NPL Good Practice Guide No. 133. National Measurement Office, Marine Scotland, The Crown Estate.
Robinson, S. P., Theobald, P. D., Hayman, G., Wang, L. S., Lepper, P. A., Humphrey, V. and Mumford, S. (2011). Measurement of noise arising from marine aggregate dredging operations. Marine Aggregate Levy Sustainability Fund (MALSF). MEPF Ref no. 09/P108.
World Organisation of Dredging Associations (WODA). (2013). Technical Guidance on: Underwater sound in relation to dredging.
REFERENCES