driven - moreirajablonski.com · 2 financial performance ($ millions) finning international inc. is...
TRANSCRIPT
DRIVENFINNING INTERNATIONAL INC. 2005 ANNUAL REPORT
� MONETARY AMOUNTS IN THIS ANNUAL REPORT ARE IN CANADIAN DOLLARS UNLESS OTHERWISE NOTED.
TO OUTPERFORM
TO OUTPERFORMFINNING AT A GLANCE 02
FINANCIAL HIGHLIGHTS 04
LETTEr To SHArEHoLdErS 06
CHAIrmAN’S LETTEr 10
FINANCIAL mANAGEmENT 12
FINNING CANAdA 14
- FoCUS oN oIL SANdS 16
oEm rEmANUFACTUrING 19
FINNING SoUTH AmErICA 20
- FoCUS oN CoPPEr mINING 22
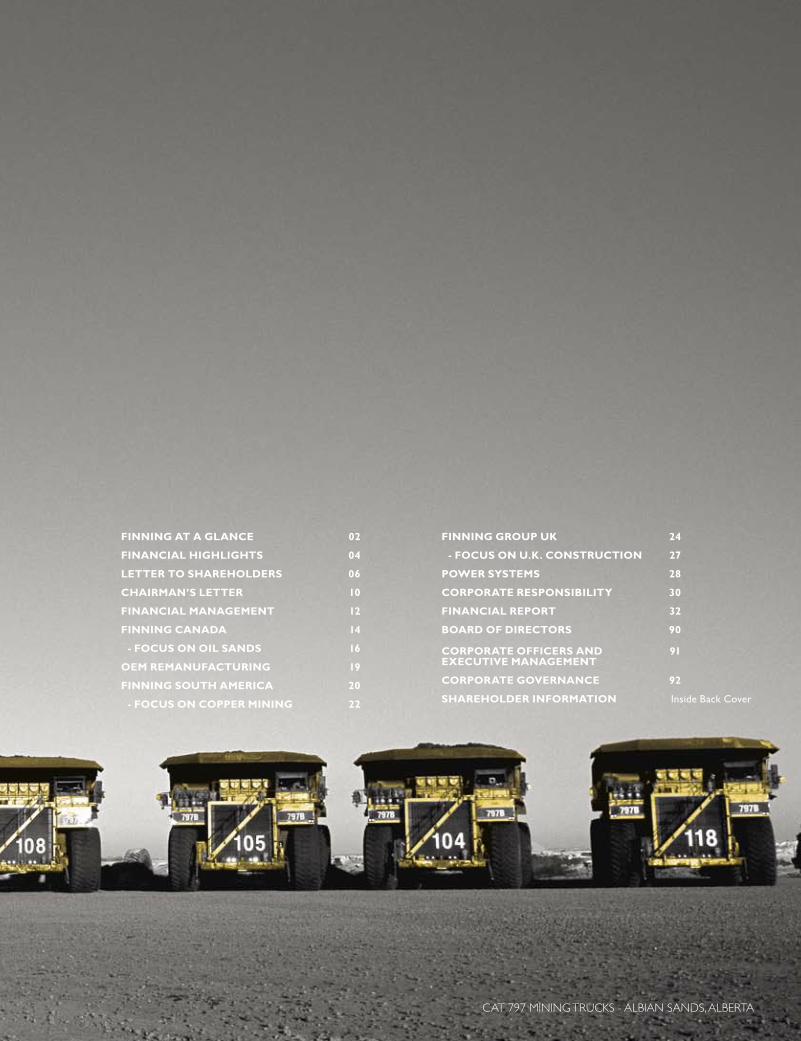
CAT 797 MINING TRUCKS - ALBIAN SANDS, ALBERTA
FINNING GroUP UK 24
- FoCUS oN U.K. CoNSTrUCTIoN 27
PowEr SySTEmS 28
CorPorATE rESPoNSIbILITy 30
FINANCIAL rEPorT 32
boArd oF dIrECTorS 90
CorPorATE oFFICErS ANd 91 EXECUTIVE mANAGEmENT
CorPorATE GoVErNANCE 92
SHArEHoLdEr INFormATIoN Inside �ack Cover
2
Financial Performance ($ millions)
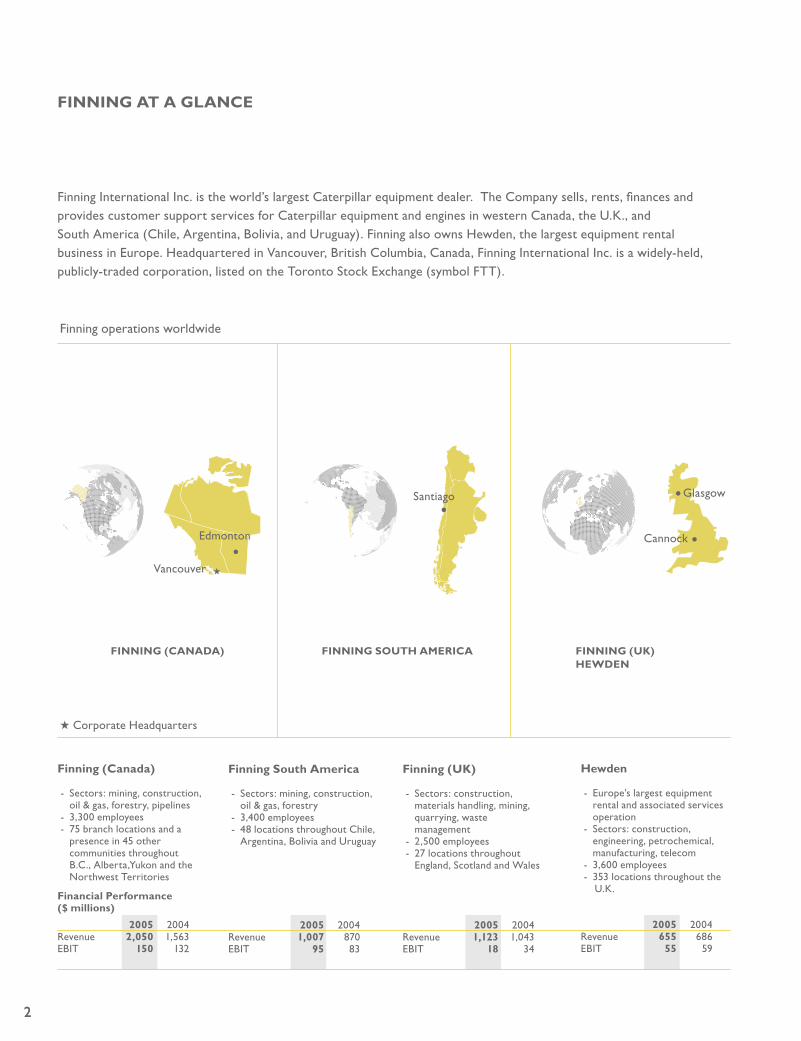
Finning International Inc. is the world’s largest Caterpillar equipment dealer. The Company sells, rents, finances and provides customer support services for Caterpillar equipment and engines in western Canada, the U.K., and South America (Chile, Argentina, �olivia, and Uruguay). Finning also owns Hewden, the largest equipment rental business in Europe. Headquartered in Vancouver, �ritish Columbia, Canada, Finning International Inc. is a widely-held, publicly-traded corporation, listed on the Toronto Stock Exchange (symbol FTT).
Finning (Canada)
- Sectors: mining, construction, oil & gas, forestry, pipelines - 3,300 employees - 75 branch locations and a presence in 45 other communities throughout �.C., Alberta,Yukon and the Northwest Territories
2005 2004Revenue 2,050 1,563 E�IT 150 132
Finning (UK)
- Sectors: construction, materials handling, mining, quarrying, waste management - 2,500 employees - 27 locations throughout England, Scotland and Wales
2005 2004Revenue 1,123 1,043 E�IT 18 34
Finning South America
- Sectors: mining, construction, oil & gas, forestry - 3,400 employees - 48 locations throughout Chile, Argentina, �olivia and Uruguay
2005 2004Revenue 1,007 870 E�IT 95 83
Hewden
- Europe’s largest equipment rental and associated services operation - Sectors: construction, engineering, petrochemical, manufacturing, telecom - 3,600 employees - 353 locations throughout the U.K.
2005 2004Revenue 655 686 E�IT 55 59
FINNING (CANAdA) FINNING SoUTH AmErICA FINNING (UK)HEwdEN
Vancouver
Finning operations worldwide
Edmonton
Glasgow
Cannock
Santiago
2
FINNING AT A GLANCE
H
H Corporate Headquarters
3
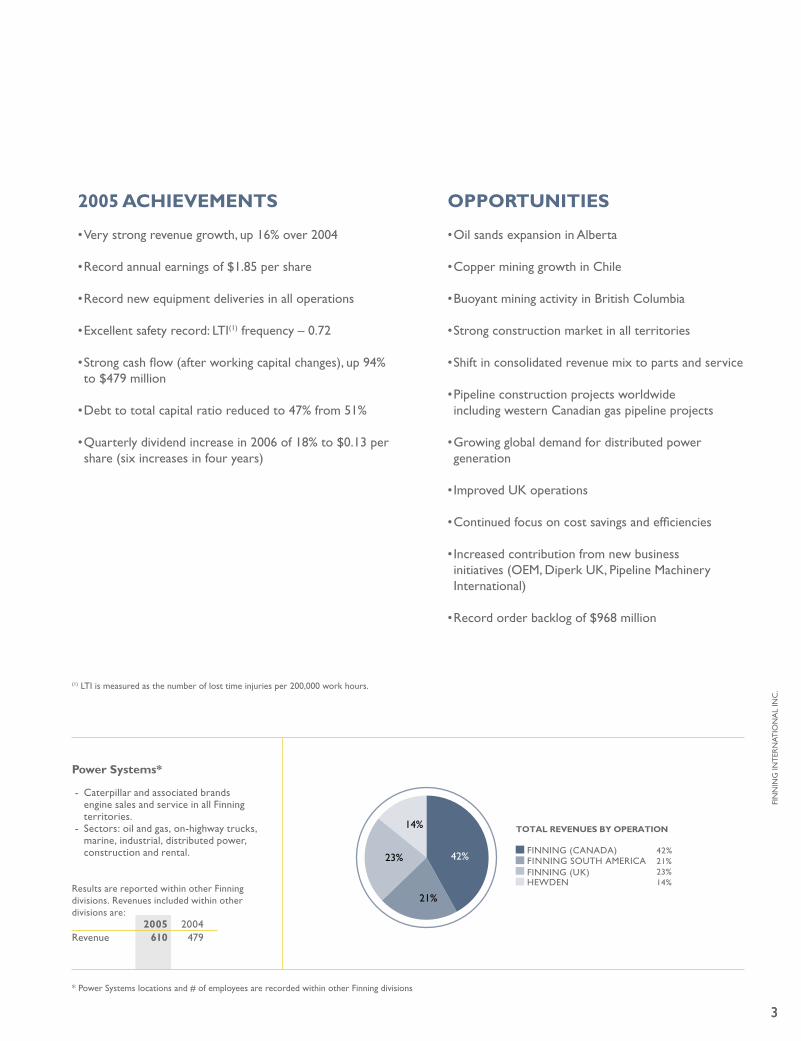
TOTAL REVENUES BY OPERATION
FINNING (CANADA) 42%
FINNING (UK)21%FINNING SOUTH AMERICA23%
HEWDEN 14%
42%
21%
14%
23%
2005 ACHIEVEmENTS
• Very strong revenue growth, up 16% over 2004
• Record annual earnings of $1.85 per share
• Record new equipment deliveries in all operations
• Excellent safety record: LTI(1) frequency – 0.72
• Strong cash flow (after working capital changes), up 94% to $479 million
• Debt to total capital ratio reduced to 47% from 51%
• Quarterly dividend increase in 2006 of 18% to $0.13 per share (six increases in four years)
* Power Systems locations and # of employees are recorded within other Finning divisions
oPPorTUNITIES
• Oil sands expansion in Alberta
• Copper mining growth in Chile
• �uoyant mining activity in �ritish Columbia
• Strong construction market in all territories
• Shift in consolidated revenue mix to parts and service
• Pipeline construction projects worldwide including western Canadian gas pipeline projects
• Growing global demand for distributed power generation
• Improved UK operations
• Continued focus on cost savings and efficiencies
• Increased contribution from new business initiatives (OEM, Diperk UK, Pipeline Machinery International)
• Record order backlog of $968 million
Power Systems*
- Caterpillar and associated brands engine sales and service in all Finning territories. - Sectors: oil and gas, on-highway trucks, marine, industrial, distributed power, construction and rental.
Results are reported within other Finning divisions. Revenues included within other divisions are: 2005 2004Revenue 610 479
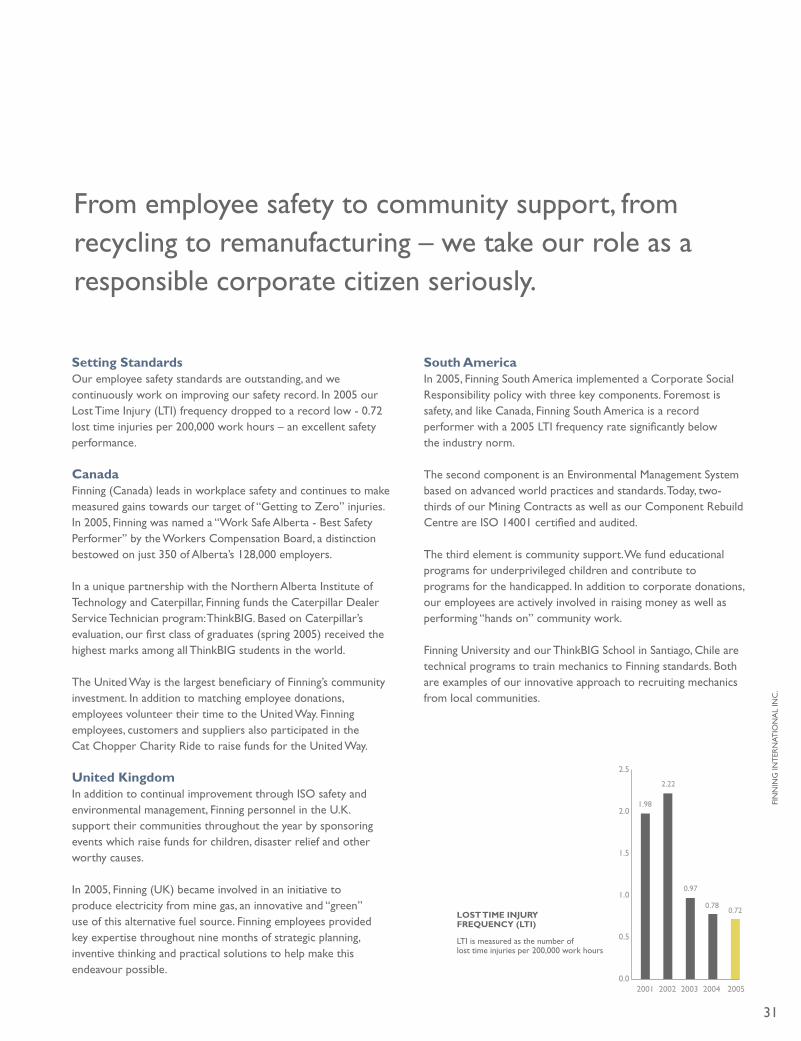
(1) LTI is measured as the number of lost time injuries per 200,000 work hours.
3
FIN
NIN
G IN
TER
NAT
ION
AL
INC
.
5.0
4.0
3.0
2.0
1.0
0.02001 2002 2003 2004 2005 2001 2002 2003 2004 2005 2001 2002 2003 2004 2005 2001 2002 2003 2004 2005
3.59
4.16
4.83
3.213.25
242
104
2.00
1.50
1.00
0.50
0.00
1.37
1.72 1.71
1.45
1.85
132 132
115
164
278
255266
285
REVENUE ($ BILLIONS) EBIT ($ MILLIONS)Earnings Before Interest & Taxes
BASIC EPS ($)Earnings Per Share
NET INCOME ($ MILLIONS)
0
50
100
150
200
0
50
100
150
200
250
300
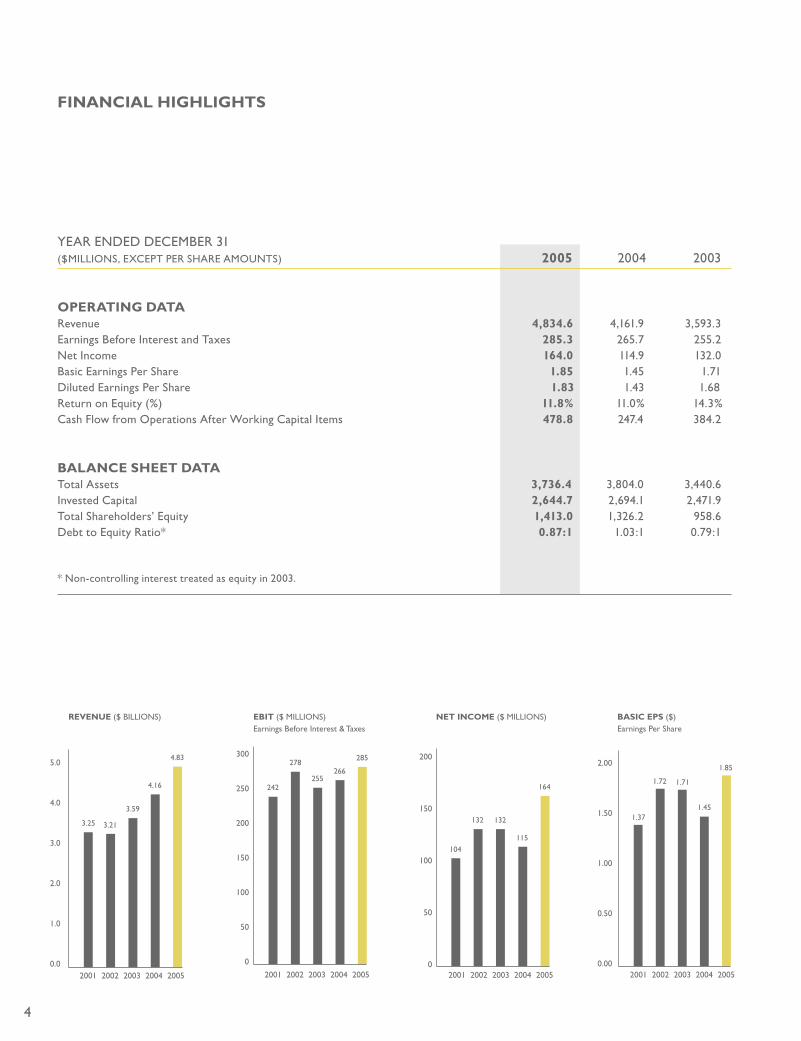
YEAR ENDED DECEM�ER 31 ($MILLIONS, EXCEPT PER SHARE AMOUNTS) 2005 2004 2003
oPErATING dATARevenue 4,834.6 4,161.9 3,593.3Earnings �efore Interest and Taxes 285.3 265.7 255.2Net Income 164.0 114.9 132.0�asic Earnings Per Share 1.85 1.45 1.71Diluted Earnings Per Share 1.83 1.43 1.68Return on Equity (%) 11.8% 11.0% 14.3%Cash Flow from Operations After Working Capital Items 478.8 247.4 384.2
bALANCE SHEET dATATotal Assets 3,736.4 3,804.0 3,440.6Invested Capital 2,644.7 2,694.1 2,471.9Total Shareholders’ Equity 1,413.0 1,326.2 958.6Debt to Equity Ratio* 0.87:1 1.03:1 0.79:1
* Non-controlling interest treated as equity in 2003.
FINANCIAL HIGHLIGHTS
4

In 2005, Finning continued to set the pace with record revenues of $4.8 billion and solid market share gains. We achieved another year of very high levels of new equipment sales further expanding the population of Caterpillar equipment in all our territories. This large and growing fleet is the foundation for significant parts, service and product support opportunities which will drive increasing profitability for Finning in the future.
5
FIN
NIN
G IN
TER
NAT
ION
AL
INC
.

Doug WhiteheadPRESIDENT & CEO
“Our business is underpinned by two fundamental goals: to provide unrivalled customer service and, in the context of prudent financial management, to generate superior returns for our shareholders.”
LETTEr To SHArEHoLdErS
TO EXCEL
6
To our shareholders:
2005 proved another milestone year for Finning in terms of new equipment orders and revenue growth, while at the same time testing our ability to operate efficiently given such high customer demand and the challenges we had to overcome to meet that demand.
Overall, we met those challenges successfully, resulting in another very strong year - an achievement that directly reflects the efforts of Finning employees and their dedication and inventiveness in every aspect of our business. I am proud of our “can do” culture and ability to respond to challenging conditions and changing customer needs. This resolve to never become complacent is key to the success to which we are driven.
Tracking progress Highlights of 2005 include an outstanding performance by our Canadian operations, followed closely by the very strong results from our South American group. �oth regions generated returns on capital that exceeded our risk-adjusted target returns and set absolute profit records. Performance from our UK operations generated mixed results in 2005. Hewden continued its steady recovery, working diligently to build a customer-focused rental business, which will be supported by new information technology. This will enable first-class customer service as well as management access to timely information to increase our efficiency in directing a large-scale business in a very competitive marketplace.
In the UK Caterpillar dealership, 2005 was an improved year for our Power Systems and Construction Equipment divisions, which rebounded from 2004 with record deliveries of new machinery. Unfortunately, the Materials Handling (fork lift) business in the U.K. did not perform well, due to very competitive market conditions and internal systems challenges that resulted in reduced business volumes, higher costs and lower profitability.
To address this under-performance, we have revised our business plan, made senior management changes and are working with our key supplier. In addition, we are considering a new information technology system that will make our Materials Handling division
more cost-efficient and improve customer service. Addressing the overall performance of our Materials Handling business in the U.K. is our primary objective for 2006.
meeting demand Strong demand for equipment and parts in our markets, as well as globally, not only increased our order book volume, it also led to tight supply. In response, while Caterpillar worked hard to ramp up production, each Finning operating unit exerted considerable effort and expense to meet customer needs.
We utilized rental fleets extensively to help customers avoid downtime. We sourced used equipment to satisfy short-term demand. We also stepped up Finning’s capabilities for remanufacturing in Canada and South America. Our OEM Remanufacturing facility in Edmonton is now complete and fully operational. Our relationship with Caterpillar is stronger than ever. As our key business partner, and with Finning as the world’s largest Cat dealer, mutual support and cooperation remain vital. This proved clearly evident in our joint development of a new strategic plan for our UK Caterpillar dealership, which is discussed in further detail in the UK section of this report.
Equally important, the commitment of Finning employees to all customers in every sector ensures that outstanding service continues to be the hallmark of our corporate culture.
driving opportunityFinning continues to benefit from an unprecedented commodity up-cycle that shows no indication of slowing. As our customers in mining and oil and gas respond to rising global demand, we are winning a growing share of contracts for equipment, maintenance and support services. As these industries prosper, their success spreads to related businesses and drives construction in both the private and public sectors. As a result, our order book remains extremely strong at $968 million, up 16% over year-end 2004 levels, a clear signal that 2006 is shaping up to be a very good year.
7
FIN
NIN
G IN
TER
NAT
ION
AL
INC
.
2000 2001 2002 2003 2004 200550
100
150
200
250
300
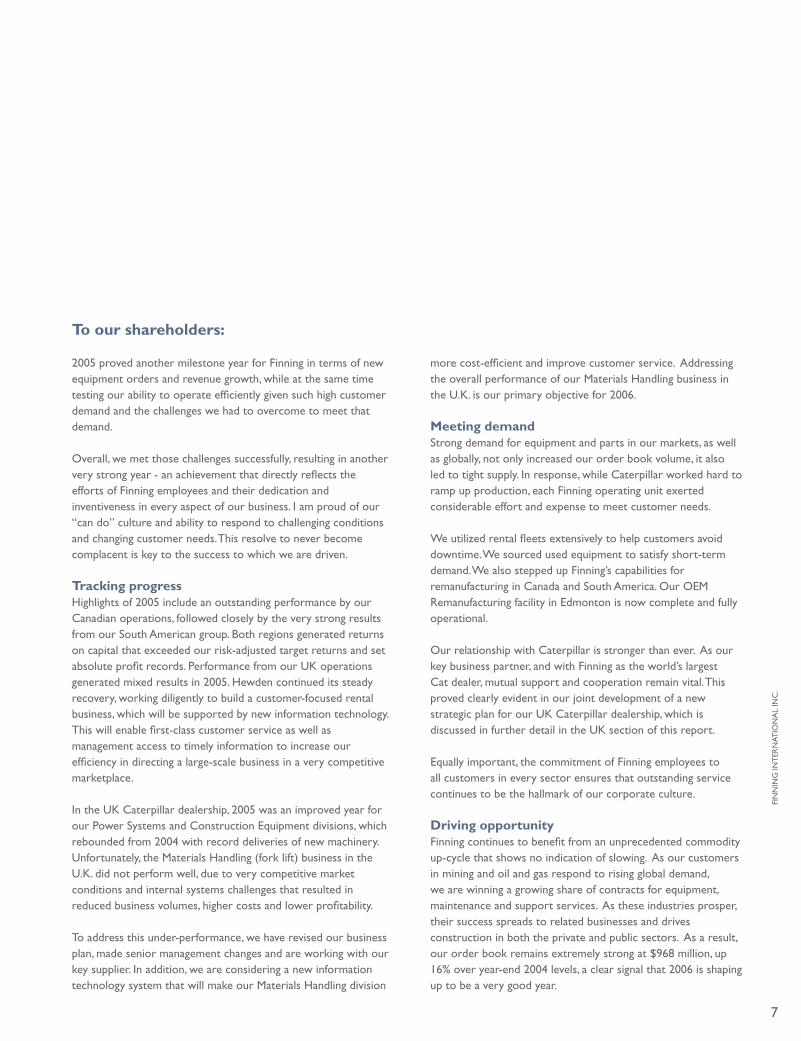
RELATIVE PRICE PERFORMANCEFINNING INTERNATIONAL INC. VS. S&P/TSX COMPOSITE INDEXDec. 31, 2000 to Dec. 31, 2005
Finning International Inc. S&P/TSX Composite Index
8
2005 return to Shareholders
In 2005, Finning’s common shares provided shareholders with a capital gain of 6% and dividends totaling $0.44 per share. Total return to shareholders was over 7%.
Share value (excluding dividend) has grown at an annual compound growth rate as follows:
5 years - 24%10 years - 14%20 years - 12%
For several years, we have experienced a surge in new equipment sales, considerably adding to the size of the Cat fleets in our markets. This translates into future opportunity: as warranties expire and equipment comes due for maintenance, we expect these fleets to drive a growing stream of higher margin parts and service revenue for Finning. This will ensure that Canada and South America will continue to contribute significantly to our corporate-wide growth as we go forward.
Fuelling growthCanada is expected to once again report record results bolstered by high commodity prices, thriving resource and construction based businesses, and improved results from our newer ventures. Western Canadian economic forecasts remain robust, creating strong demand for new and used equipment, rentals, parts and customer support services. The oil sands sector in particular presents tremendous future opportunities for Finning. In South America, record copper and gold prices continue to drive new mine openings and higher demand for new equipment. Tax and royalty revenues are bolstering local economies resulting in increased spending on infrastructure and private sector construction. Finning operations will continue to capitalize on this growth, together with increasing profitability in parts and service.
While economic activity in the U.K. is expected to remain at reasonable levels in 2006, competition will continue to be challenging in all our lines of business.
Hewden will continue to advance its key projects, including the installation of a new management information system and the implementation of a lower capital-cost, customer-facing structure.
In the UK Caterpillar dealership, the Construction Equipment division will benefit from growing demand from new coal mines in Scotland and Wales, however general and infrastructure construction will remain the primary markets.
Overall, revenue growth in Finning (UK) and Hewden is expected to be modest in 2006, yet focus on expense control should see profitability improve in each operation. To support the main elements of our UK business in the future, we are now implementing a joint strategic plan with Caterpillar designed to enable the dealership to double market share in key product lines and reach median levels of profitability for Cat dealers.
Finning’s global Power Systems revenues continue to grow with significant market gains in marine and electric power generation applications, as well as unprecedented demand from the gas compression industry in Canada. “Green energy” initiatives globally are also expected to fuel Power Systems opportunities in the future.
LETTEr To SHArEHoLdErS
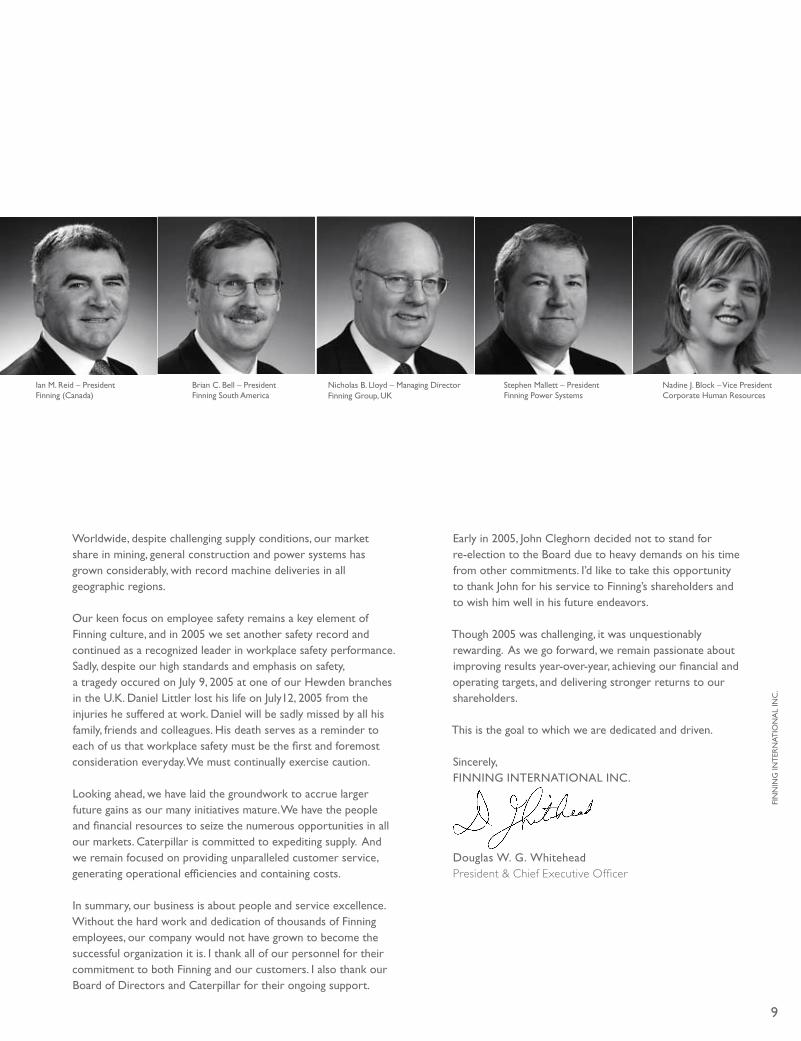
�rian C. �ell – President Finning South America
Stephen Mallett – President Finning Power Systems
Nicholas �. Lloyd – Managing Director Finning Group, UK
Ian M. Reid – President Finning (Canada)
Nadine J. �lock – Vice President Corporate Human Resources
Worldwide, despite challenging supply conditions, our market share in mining, general construction and power systems has grown considerably, with record machine deliveries in all geographic regions.
Our keen focus on employee safety remains a key element of Finning culture, and in 2005 we set another safety record and continued as a recognized leader in workplace safety performance.Sadly, despite our high standards and emphasis on safety, a tragedy occured on July 9, 2005 at one of our Hewden branches in the U.K. Daniel Littler lost his life on July12, 2005 from the injuries he suffered at work. Daniel will be sadly missed by all his family, friends and colleagues. His death serves as a reminder to each of us that workplace safety must be the first and foremost consideration everyday. We must continually exercise caution. Looking ahead, we have laid the groundwork to accrue larger future gains as our many initiatives mature. We have the people and financial resources to seize the numerous opportunities in all our markets. Caterpillar is committed to expediting supply. And we remain focused on providing unparalleled customer service, generating operational efficiencies and containing costs. In summary, our business is about people and service excellence. Without the hard work and dedication of thousands of Finning employees, our company would not have grown to become the successful organization it is. I thank all of our personnel for their commitment to both Finning and our customers. I also thank our �oard of Directors and Caterpillar for their ongoing support.
Early in 2005, John Cleghorn decided not to stand for re-election to the �oard due to heavy demands on his time from other commitments. I’d like to take this opportunity to thank John for his service to Finning’s shareholders and to wish him well in his future endeavors.
Though 2005 was challenging, it was unquestionably rewarding. As we go forward, we remain passionate about improving results year-over-year, achieving our financial and operating targets, and delivering stronger returns to our shareholders.
This is the goal to which we are dedicated and driven.
Sincerely,FINNING INTERNATIONAL INC.
Douglas W. G. WhiteheadPresident & Chief Executive Officer
9
FIN
NIN
G IN
TER
NAT
ION
AL
INC
.
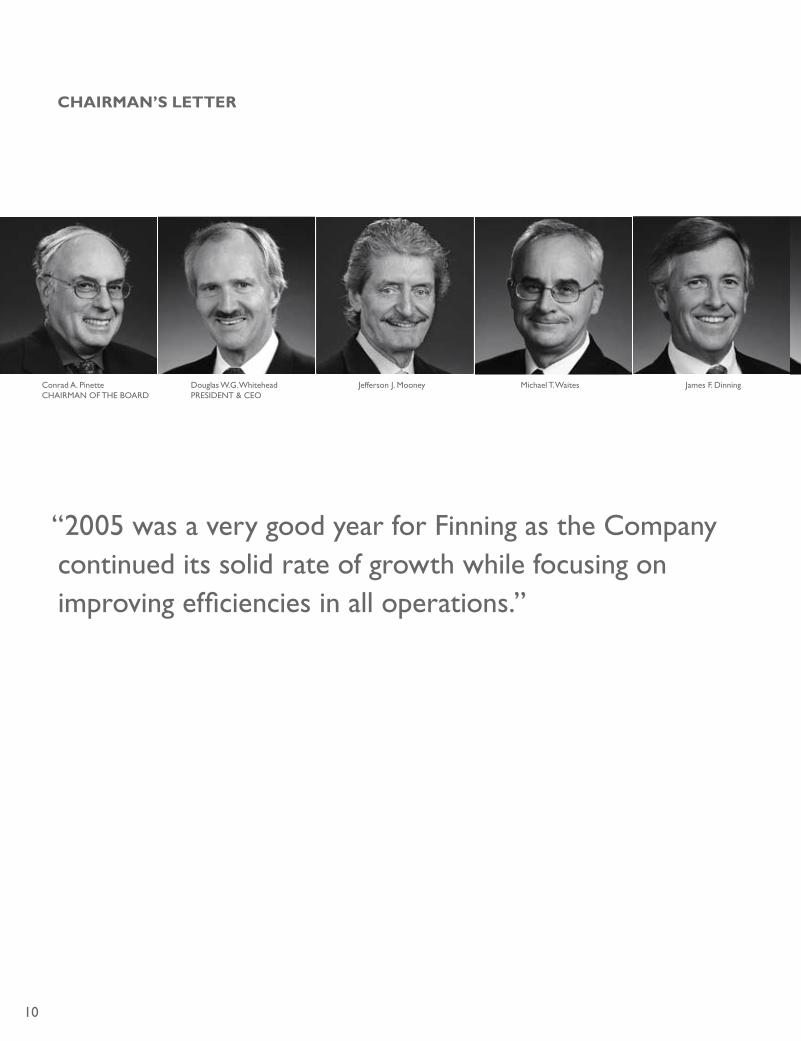
Douglas W.G. WhiteheadPRESIDENT & CEO
Michael T. WaitesConrad A. PinetteCHAIRMAN OF THE �OARD
Jefferson J. Mooney
CHAIrmAN’S LETTEr
James F. Dinning
“2005 was a very good year for Finning as the Company continued its solid rate of growth while focusing on improving efficiencies in all operations.”
10
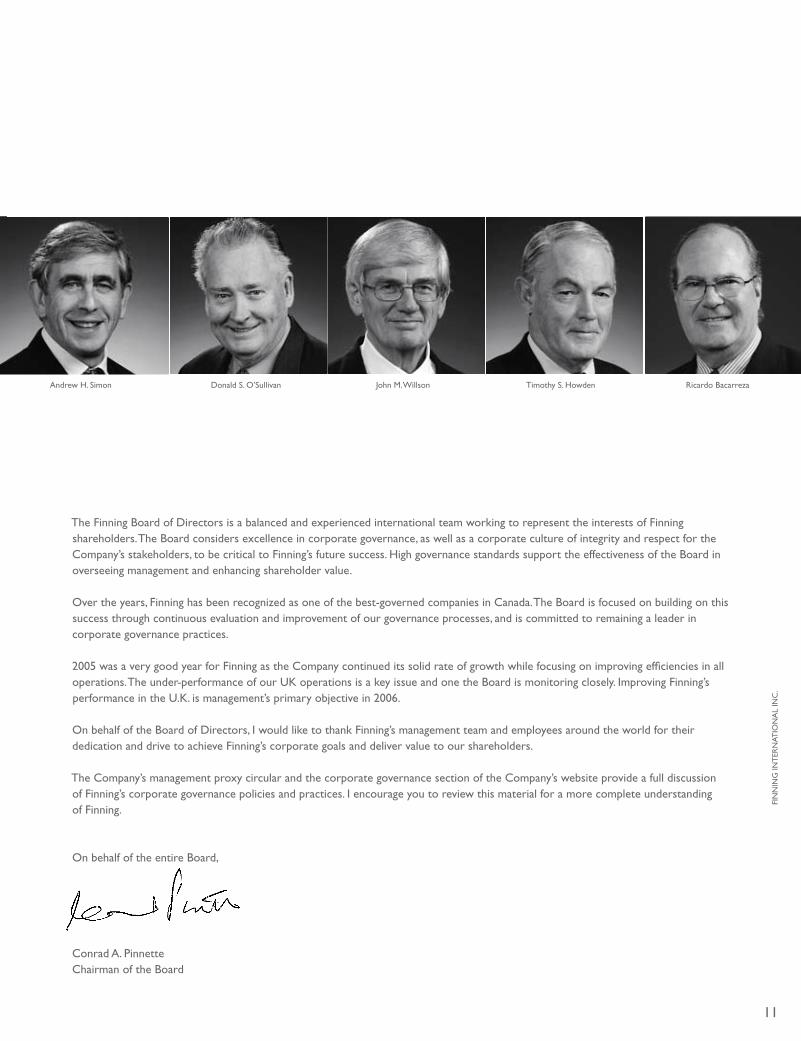
John M. WillsonDonald S. O’Sullivan Timothy S. HowdenAndrew H. Simon Ricardo �acarreza
The Finning �oard of Directors is a balanced and experienced international team working to represent the interests of Finning shareholders. The �oard considers excellence in corporate governance, as well as a corporate culture of integrity and respect for the Company’s stakeholders, to be critical to Finning’s future success. High governance standards support the effectiveness of the �oard in overseeing management and enhancing shareholder value.
Over the years, Finning has been recognized as one of the best-governed companies in Canada. The �oard is focused on building on this success through continuous evaluation and improvement of our governance processes, and is committed to remaining a leader in corporate governance practices.
2005 was a very good year for Finning as the Company continued its solid rate of growth while focusing on improving efficiencies in all operations. The under-performance of our UK operations is a key issue and one the �oard is monitoring closely. Improving Finning’s performance in the U.K. is management’s primary objective in 2006.
On behalf of the �oard of Directors, I would like to thank Finning’s management team and employees around the world for their dedication and drive to achieve Finning’s corporate goals and deliver value to our shareholders.
The Company’s management proxy circular and the corporate governance section of the Company’s website provide a full discussion of Finning’s corporate governance policies and practices. I encourage you to review this material for a more complete understanding of Finning.
On behalf of the entire �oard,
Conrad A. PinnetteChairman of the �oard
11
FIN
NIN
G IN
TER
NAT
ION
AL
INC
.

FINANCIAL mANAGEmENT
Finning’s financial health continues to be very good. We have responded well to the financial pressures created by the dramatic growth of 2004 and 2005.
12
2005 earnings reach record levels.Our 2005 reported earnings grew to $1.85 per share reflecting the strong performance of our Canadian and South American operations. Earnings per share, while at record levels, were below our expectations due to a number of factors: • Finning (UK) results were lower than expected;• the Canadian dollar was stronger than expected; and• the rise in our stock price in the third quarter of 2005 triggered long-term incentive plan expenses that impacted our earnings to a higher degree than anticipated.
2005 cash flow is greatly improved.Cash flow after changes in working capital increased to over $475 million, almost two times the previous year’s amount, due to a strong focus on more efficient use of working capital. Each of our operating units was successful in controlling new equipment inventories, improving cash cycle times and implementing capital efficiencies.
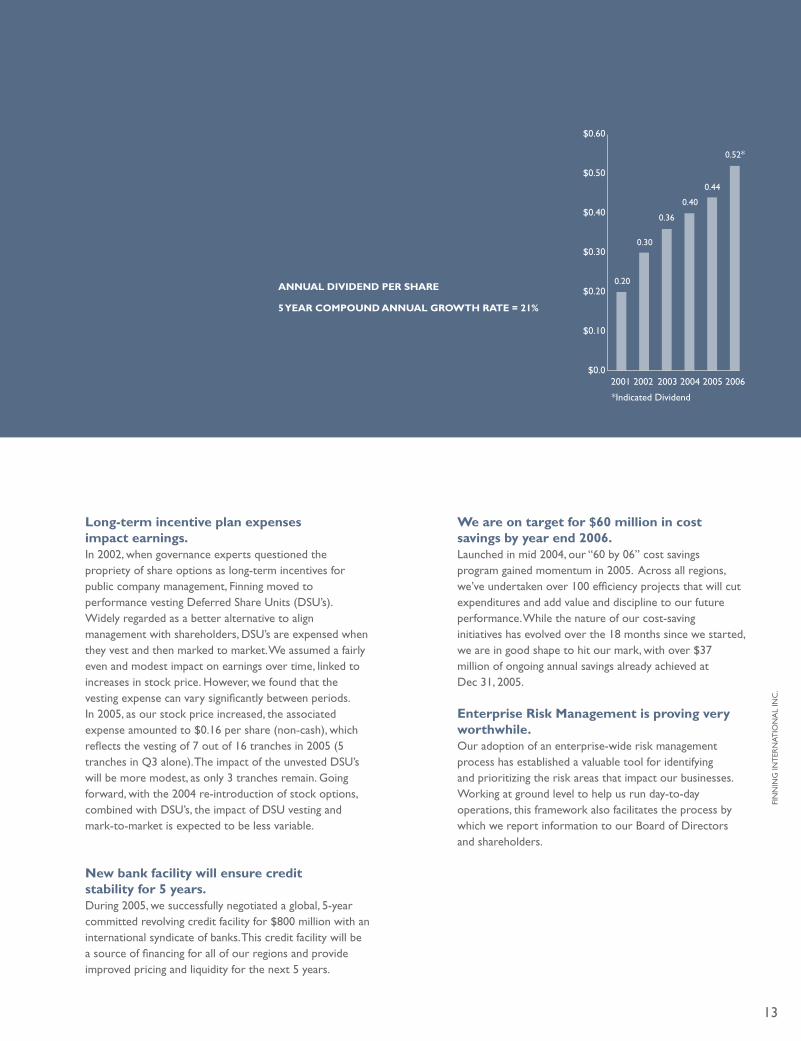
Shareholder dividends rose for the sixth time in four years. Quarterly dividends paid to shareholders increased from $0.10 to $0.11 per share in 2005, and again to $0.13 per share in early 2006. Finning remains committed to providing our shareholders with an attractive and growing dividend as part of the overall annual return. To the extent that earnings growth allows, we plan to continue increasing shareholder dividends.
Tighter corporate governance requirements will be met on time.We continue to meet the stringent governance requirements of new legislation. We have met all the certification stipulations to date and are well on our way to meet the next level of requirements. The onus to comply with the Canadian Securities Administrators Multilateral Instrument 52-109 while running everyday business is a challenge, but we prevail and are set to meet the ultimate level of requirements. The Company has appropriate disclosure controls and procedures in place to ensure all material information is disclosed on a timely basis.
$0.0
$0.10
$0.20
$0.30
$0.40
$0.50
$0.60
2001 2002 2003 2004 2005 2006
ANNUAL DIVIDEND PER SHARE
5 YEAR COMPOUND ANNUAL GROWTH RATE = 21%
0.20
0.30
0.36
0.40
0.44
0.52*
*Indicated Dividend
Long-term incentive plan expenses impact earnings.In 2002, when governance experts questioned the propriety of share options as long-term incentives for public company management, Finning moved to performance vesting Deferred Share Units (DSU’s). Widely regarded as a better alternative to align management with shareholders, DSU’s are expensed when they vest and then marked to market. We assumed a fairly even and modest impact on earnings over time, linked to increases in stock price. However, we found that the vesting expense can vary significantly between periods. In 2005, as our stock price increased, the associated expense amounted to $0.16 per share (non-cash), which reflects the vesting of 7 out of 16 tranches in 2005 (5 tranches in Q3 alone). The impact of the unvested DSU’s will be more modest, as only 3 tranches remain. Going forward, with the 2004 re-introduction of stock options, combined with DSU’s, the impact of DSU vesting and mark-to-market is expected to be less variable.
13
Enterprise risk management is proving very worthwhile.Our adoption of an enterprise-wide risk management process has established a valuable tool for identifying and prioritizing the risk areas that impact our businesses. Working at ground level to help us run day-to-day operations, this framework also facilitates the process by which we report information to our �oard of Directors and shareholders.
we are on target for $60 million in cost savings by year end 2006.Launched in mid 2004, our “60 by 06” cost savings program gained momentum in 2005. Across all regions, we’ve undertaken over 100 efficiency projects that will cut expenditures and add value and discipline to our future performance. While the nature of our cost-saving initiatives has evolved over the 18 months since we started, we are in good shape to hit our mark, with over $37 million of ongoing annual savings already achieved at Dec 31, 2005.
New bank facility will ensure credit stability for 5 years.During 2005, we successfully negotiated a global, 5-year committed revolving credit facility for $800 million with an international syndicate of banks. This credit facility will be a source of financing for all of our regions and provide improved pricing and liquidity for the next 5 years.
FIN
NIN
G IN
TER
NAT
ION
AL
INC
.
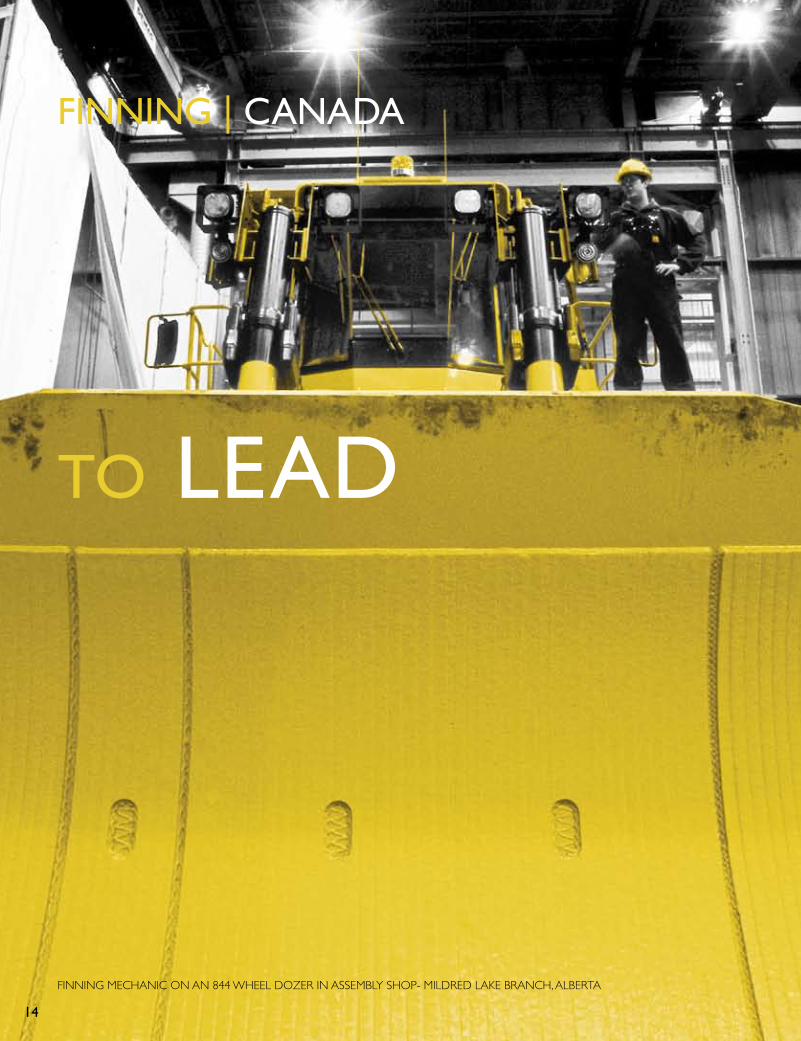
FINNING MECHANIC ON AN 844 WHEEL DOZER IN ASSEMBLY SHOP- MILDRED LAKE BRANCH, ALBERTA
FINNING | CANADA
TO LEAD
14

2005 Performance Finning (Canada) had a very successful year, capitalizing on increased demand from customers across all sectors. Continued strength in commodity prices and healthy economies in �.C. and Alberta supported very robust activity in mining, construction, oil and gas and forestry.
Another year of strong equipment sales added to the large and growing population of Cat equipment in western Canada, provid-ing significant growth opportunities for product support services in future years. While managing increased volumes of business in all operations, Finning (Canada) set a new safety record in 2005 to remain a recognized leader in industry safety.
Tackling ChallengesIncreased worldwide demand for Cat equipment and parts led to supply shortages in some product categories. To mitigate new equipment availability issues, Finning (Canada) devised innovative strategies to meet customer needs including selling a portion of its rental fleet as well as sourcing and selling record amounts of quality used equipment.
Increased need for skilled service personnel also presented a challenge, calling for renewed focus on recruiting initiatives. Our new “People Strategy” is aimed at attracting, developing and engaging quality people to grow the business and service our customers.
Future momentum The western Canadian economy is forecast to remain strong and commodity prices are expected to stay at attractive levels throughout 2006. As a result, Finning (Canada) is anticipating another very good year for new equipment sales and increased parts and service business from the growing population of ma-chines in its territories.
Expansion of the Alberta oil sands industry and �.C.’s mining sector, together with growing housing starts and construction projects related to the 2010 Olympics, as well as numerous infrastructure initiatives, all point to favourable market conditions and opportunities for 2006 and years to come.
A corporate crown jewel, this territory alone generates annual revenues exceeding $2 billion.
miningThis sector saw very strong growth in 2005 due to rising commodity prices, driven by growing global demand and limited supply. All indicators point to continued strength in mining, and we expect to benefit from rising demand for parts and service on equipment already operating in the field. ConstructionRecord expenditures for housing and commercial construction and major infrastructure projects in western Canada led to a very successful year for all lines of Cat construction equipment. Proposed construction expenditures for 2006 will see Finning gain further ground with excellent opportunities to build on this year’s wins.
Conventional oil & GasApproximately 22,000 wells were drilled in western Canada in 2005, and a higher number is expected for 2006. We anticipate strong demand for gas compression engines and mobile equipment through 2006 and beyond.
ForestryThe �.C. interior softwood lumber industry had a strong year in 2005 due to higher prices for lumber and accelerated harvesting to counter the widespread impact of the pine beetle infestation. These factors are expected to continue to positively influence demand for equipment in �.C.’s interior forestry sector.
Cat rental StoresWith 27 stores in �.C. and Alberta, we are now a major player in the small equipment rental industry. 2005 was a very successful year, with revenues up 56% and profitability exceeding expectations. Finning plans to open two new Cat Rental Stores in 2006 and will continue to focus on cost efficiencies and increased asset utilization.
PipelinesAs a partner with a 25% interest in PipeLine Machinery International (PLM), the global Cat pipeline equipment dealership, Finning has the opportunity to become involved as a supplier to pipeline construction projects worldwide. Several major pipeline projects have been proposed for western Canada and are expected to proceed in the 2007 to 2011 time period.
15
FIN
NIN
G IN
TER
NAT
ION
AL
INC
.

ALBERTA
Edmonton
Fort McMurray
Athabas
ca Rive
r
NORTHWEST TERRITORIES
BRIT
ISH
CO
LUM
BIA
SASK
ATC
HEW
AN
UNITED STATES
Mildred Lake
ATHABASCA DEPOSIT
0
50
100
150
200
250
300
350
COMPARATIVE OIL RESERVES(2)
CANADA conventionalUS conventionalALBERTA OIL SANDS established reservesSAUDI ARABIAALBERTA OIL SANDS ultimately recoverable reserves
(billions of barrels)
322
177
265
311
FOCUS ON THE OIL SANDS
The Alberta oil sands – “the biggest known oil reserve in the world” is expected to attract an estimated $87 billion worth of investment over the next decade(1).
renewed energyIn 2005 the vast potential of the Canadian oil sands became world news. With oil prices reaching and exceeding the US $60 per barrel range for an extended period, the economic value of this Canadian resource became widely recognized. Finning saw the long-term potential of this region a decade ago and prudently began to capitalize on emerging oil sands production.
There are an estimated 1.7 trillion barrels of bitumen in place in the oil sands’ three major areas, which encompass nearly 80,000 square kilometres – Athabasca/Fort McMurray, Cold Lake and Peace River. 177 billion barrels are classified as established recoverable reserves, second only to Saudi Arabia.
Existing projects produced about one million barrels of oil per day in 2005, a 67% increase over production levels of five years ago. As global energy demands escalate and conventional supply is unable to keep up, sustaining oil prices at or above US $40 per barrel, the oil sands output is expected to triple within the next decade. This level of production has the potential to provide
16
797 MINING TRUCKS - ALBIAN SANDS, ALBERTA
(1) Government of Alberta (2) Alberta Energy and Utilities �oard
797 MINING TRUCKS - ALBIAN SANDS, ALBERTA
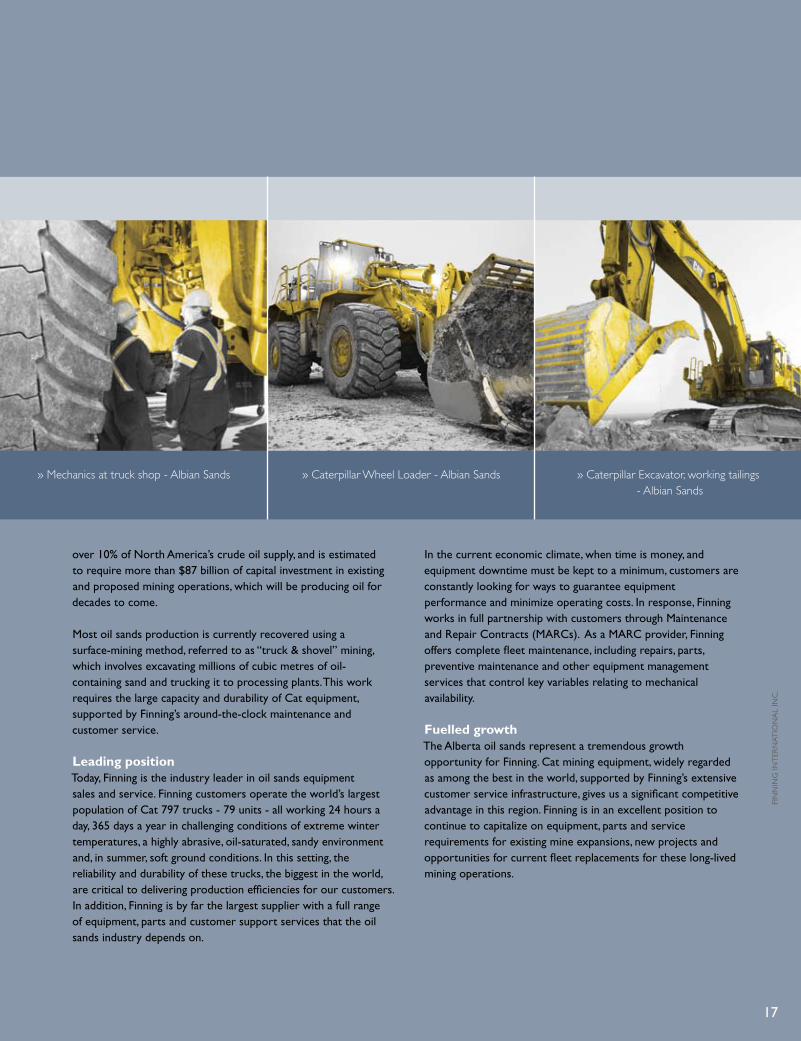
over 10% of North America’s crude oil supply, and is estimated to require more than $87 billion of capital investment in existing and proposed mining operations, which will be producing oil for decades to come.
Most oil sands production is currently recovered using a surface-mining method, referred to as “truck & shovel” mining, which involves excavating millions of cubic metres of oil- containing sand and trucking it to processing plants. This work requires the large capacity and durability of Cat equipment, supported by Finning’s around-the-clock maintenance and customer service.
Leading positionToday, Finning is the industry leader in oil sands equipment sales and service. Finning customers operate the world’s largest population of Cat 797 trucks - 79 units - all working 24 hours a day, 365 days a year in challenging conditions of extreme winter temperatures, a highly abrasive, oil-saturated, sandy environment and, in summer, soft ground conditions. In this setting, the reliability and durability of these trucks, the biggest in the world, are critical to delivering production efficiencies for our customers. In addition, Finning is by far the largest supplier with a full range of equipment, parts and customer support services that the oil sands industry depends on.
» Mechanics at truck shop - Albian Sands » Caterpillar Wheel Loader - Albian Sands » Caterpillar Excavator, working tailings - Albian Sands
17
In the current economic climate, when time is money, and equipment downtime must be kept to a minimum, customers are constantly looking for ways to guarantee equipment performance and minimize operating costs. In response, Finning works in full partnership with customers through Maintenance and Repair Contracts (MARCs). As a MARC provider, Finning offers complete fleet maintenance, including repairs, parts, preventive maintenance and other equipment management services that control key variables relating to mechanical availability.
Fuelled growth The Alberta oil sands represent a tremendous growth opportunity for Finning. Cat mining equipment, widely regarded as among the best in the world, supported by Finning’s extensive customer service infrastructure, gives us a significant competitive advantage in this region. Finning is in an excellent position to continue to capitalize on equipment, parts and service requirements for existing mine expansions, new projects and opportunities for current fleet replacements for these long-lived mining operations.
FIN
NIN
G IN
TER
NAT
ION
AL
INC
.

623,690 kg (1,375,000 lb)67 km/h (42 mph)3,550 hp7.6 metres (24.9 ft)14.5 metres (47.5 ft)9.8 metres (32 ft)6,814 litres (1,800 gal)400 tonnes4 metres (13 ft) high15,000 kg (33,000 lb)
EMPTY WEIGHTMAX SPEED HORSE POWERHEIGHT (empty)LENGTHWIDTHFUEL CAPACITYLOAD CAPACITYTIRE DIMENSIONSTIRE WEIGHT
CATERPILLAR 797B MINING TRUCKFAST FACTS
96535655272726340
797 TRUCKS*793 TRUCKS 777-789 TRUCKSD10 & D11 TRACTORSD8-D9 TRACTORS24H GRADERS16H GRADERSTOTAL
CATERPILLAR FLEET IN THE OIL SANDS
FOCUS ON THE OIL SANDS CONTINUED
Finning oil sands employees: 3072005 oil sands mining revenue: $310 million
18
» 797 Mining Trucks - Albian Sands » Mildred Lake parts warehouse » Mechanic - Mildred Lake truck shop
*Includes trucks to be delivered in 2006

In 2005, Finning International finalized a significant strategic investment to support customers who depend on very large Caterpillar equipment. Over $70 million was invested in a state-of-the-art, 286,000 sq. ft. component remanufacturing facility in Edmonton. Completed in mid 2005, OEM Remanufacturing (OEM) is now fully operational, providing customers across western Canada with access to a large and reliable supply of remanufactured Caterpillar engines, powertrain and hydraulic components for large equipment.
OEM is one of North America’s most advanced engine and power train component remanufacturing companies. Remanufacturing services are complemented by a comprehensive exchange program of quality remanufactured components enhancing the quality of customer service.
Finning International’s new component remanufacturing business supplies cost competitive components to Finning and other industrial customers.
Assembled components are fully tested at full horsepower, torque, rpm (revolutions per minute) and hydraulic pressure to accurately simulate field operating conditions.
OEM provides Finning customers with a wide supply of “like new” components which lowers the overall cost of owning and operating Caterpillar equipment.
OEM’s new facility was designed with considerable expansion capacity to meet the growing future demand for remanufacturing services in the natural resources industry in western Canada, as well as customers beyond Finning’s dealership territory.
OEM REMANUFACTURING
» OEM Remanufacturing - Edmonton » Mechanics in engine shop - OEM » OEM machine shop - Edmonton
19
FIN
NIN
G IN
TER
NAT
ION
AL
INC
.

FINNING | SOUTH AMERICA
LAS REJAS BRANCH - SANTIAGO, CHILE
20
TO ADVANCE
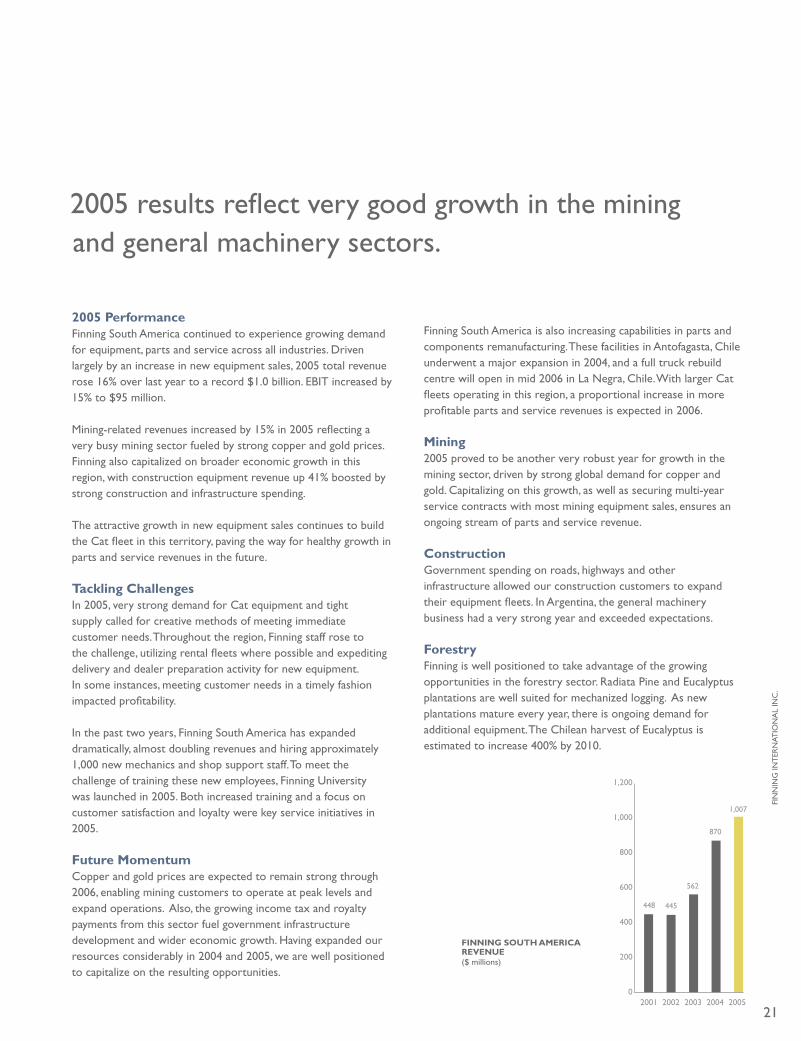
0
200
400
600
800
1,000
1,200
2001 2002 2003 2004 2005
448 445
562
870
1,007
FINNING SOUTH AMERICAREVENUE ($ millions)
2005 results reflect very good growth in the mining and general machinery sectors.
2005 PerformanceFinning South America continued to experience growing demand for equipment, parts and service across all industries. Driven largely by an increase in new equipment sales, 2005 total revenue rose 16% over last year to a record $1.0 billion. E�IT increased by 15% to $95 million.
Mining-related revenues increased by 15% in 2005 reflecting a very busy mining sector fueled by strong copper and gold prices. Finning also capitalized on broader economic growth in this region, with construction equipment revenue up 41% boosted by strong construction and infrastructure spending.
The attractive growth in new equipment sales continues to build the Cat fleet in this territory, paving the way for healthy growth in parts and service revenues in the future.
Tackling ChallengesIn 2005, very strong demand for Cat equipment and tight supply called for creative methods of meeting immediate customer needs. Throughout the region, Finning staff rose to the challenge, utilizing rental fleets where possible and expediting delivery and dealer preparation activity for new equipment. In some instances, meeting customer needs in a timely fashion impacted profitability.
In the past two years, Finning South America has expanded dramatically, almost doubling revenues and hiring approximately 1,000 new mechanics and shop support staff. To meet the challenge of training these new employees, Finning University was launched in 2005. �oth increased training and a focus on customer satisfaction and loyalty were key service initiatives in 2005.
Future momentumCopper and gold prices are expected to remain strong through 2006, enabling mining customers to operate at peak levels and expand operations. Also, the growing income tax and royalty payments from this sector fuel government infrastructure development and wider economic growth. Having expanded our resources considerably in 2004 and 2005, we are well positioned to capitalize on the resulting opportunities.
Finning South America is also increasing capabilities in parts and components remanufacturing. These facilities in Antofagasta, Chile underwent a major expansion in 2004, and a full truck rebuild centre will open in mid 2006 in La Negra, Chile. With larger Cat fleets operating in this region, a proportional increase in more profitable parts and service revenues is expected in 2006.
mining2005 proved to be another very robust year for growth in the mining sector, driven by strong global demand for copper and gold. Capitalizing on this growth, as well as securing multi-year service contracts with most mining equipment sales, ensures an ongoing stream of parts and service revenue.
ConstructionGovernment spending on roads, highways and other infrastructure allowed our construction customers to expand their equipment fleets. In Argentina, the general machinery business had a very strong year and exceeded expectations.
ForestryFinning is well positioned to take advantage of the growing opportunities in the forestry sector. Radiata Pine and Eucalyptus plantations are well suited for mechanized logging. As new plantations mature every year, there is ongoing demand for additional equipment. The Chilean harvest of Eucalyptus is estimated to increase 400% by 2010.
21
FIN
NIN
G IN
TER
NAT
ION
AL
INC
.
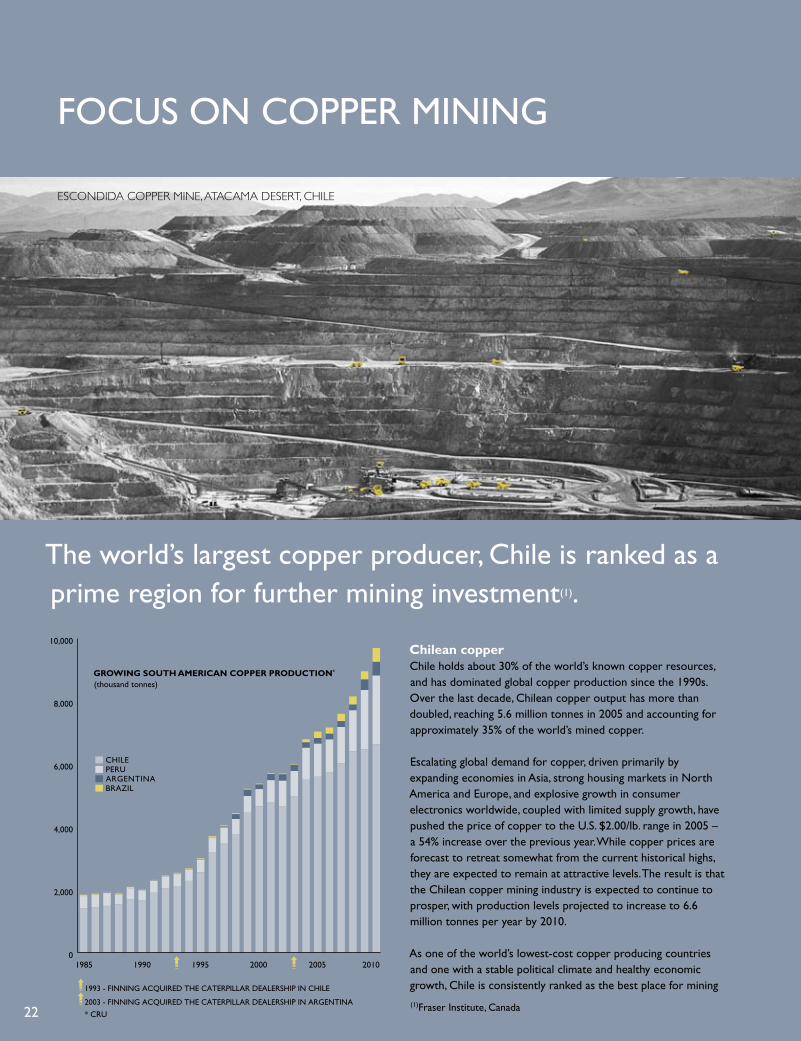
0
2,000
4,000
6,000
8,000
10,000
1985 1990 1995 2000 2005 2010
* CRU
CHILEPERUARGENTINABRAZIL
(thousand tonnes)GROWING SOUTH AMERICAN COPPER PRODUCTION*
1993 - FINNING ACQUIRED THE CATERPILLAR DEALERSHIP IN CHILE
2003 - FINNING ACQUIRED THE CATERPILLAR DEALERSHIP IN ARGENTINA
FOCUS ON COPPER MINING
Chilean copper Chile holds about 30% of the world’s known copper resources, and has dominated global copper production since the 1990s. Over the last decade, Chilean copper output has more than doubled, reaching 5.6 million tonnes in 2005 and accounting for approximately 35% of the world’s mined copper.
Escalating global demand for copper, driven primarily by expanding economies in Asia, strong housing markets in North America and Europe, and explosive growth in consumer electronics worldwide, coupled with limited supply growth, have pushed the price of copper to the U.S. $2.00/lb. range in 2005 – a 54% increase over the previous year. While copper prices are forecast to retreat somewhat from the current historical highs, they are expected to remain at attractive levels. The result is that the Chilean copper mining industry is expected to continue to prosper, with production levels projected to increase to 6.6 million tonnes per year by 2010.
As one of the world’s lowest-cost copper producing countries and one with a stable political climate and healthy economic growth, Chile is consistently ranked as the best place for mining
The world’s largest copper producer, Chile is ranked as a prime region for further mining investment(1).
22
ESCONDIDA COPPER MINE, ATACAMA DESERT, CHILE
(1)Fraser Institute, Canada
FOCUS ON COPPER MINING
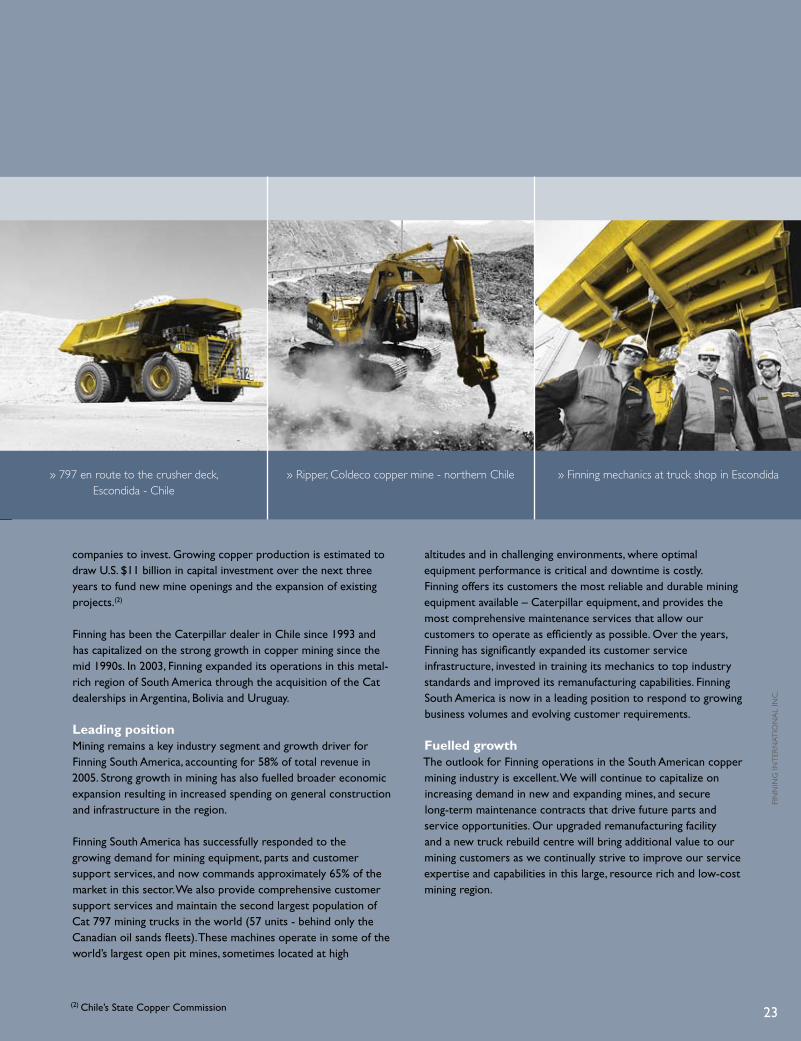
» Ripper, Coldeco copper mine - northern Chile » Finning mechanics at truck shop in Escondida» 797 en route to the crusher deck, Escondida - Chile
companies to invest. Growing copper production is estimated to draw U.S. $11 billion in capital investment over the next three years to fund new mine openings and the expansion of existing projects.(2)
Finning has been the Caterpillar dealer in Chile since 1993 and has capitalized on the strong growth in copper mining since the mid 1990s. In 2003, Finning expanded its operations in this metal-rich region of South America through the acquisition of the Cat dealerships in Argentina, �olivia and Uruguay.
Leading positionMining remains a key industry segment and growth driver for Finning South America, accounting for 58% of total revenue in 2005. Strong growth in mining has also fuelled broader economic expansion resulting in increased spending on general construction and infrastructure in the region.
Finning South America has successfully responded to the growing demand for mining equipment, parts and customer support services, and now commands approximately 65% of the market in this sector. We also provide comprehensive customer support services and maintain the second largest population of Cat 797 mining trucks in the world (57 units - behind only the Canadian oil sands fleets). These machines operate in some of the world’s largest open pit mines, sometimes located at high
altitudes and in challenging environments, where optimal equipment performance is critical and downtime is costly. Finning offers its customers the most reliable and durable mining equipment available – Caterpillar equipment, and provides the most comprehensive maintenance services that allow our customers to operate as efficiently as possible. Over the years, Finning has significantly expanded its customer service infrastructure, invested in training its mechanics to top industry standards and improved its remanufacturing capabilities. Finning South America is now in a leading position to respond to growing business volumes and evolving customer requirements.
Fuelled growth The outlook for Finning operations in the South American copper mining industry is excellent. We will continue to capitalize on increasing demand in new and expanding mines, and secure long-term maintenance contracts that drive future parts and service opportunities. Our upgraded remanufacturing facility and a new truck rebuild centre will bring additional value to our mining customers as we continually strive to improve our service expertise and capabilities in this large, resource rich and low-cost mining region.
(2) Chile’s State Copper Commission 23
FIN
NIN
G IN
TER
NAT
ION
AL
INC
.

24
TELEHANDLER - WEMBLEY STADIUM CONSTRUCTION SITE
FINNING | GROUP UK
TO CONTEND
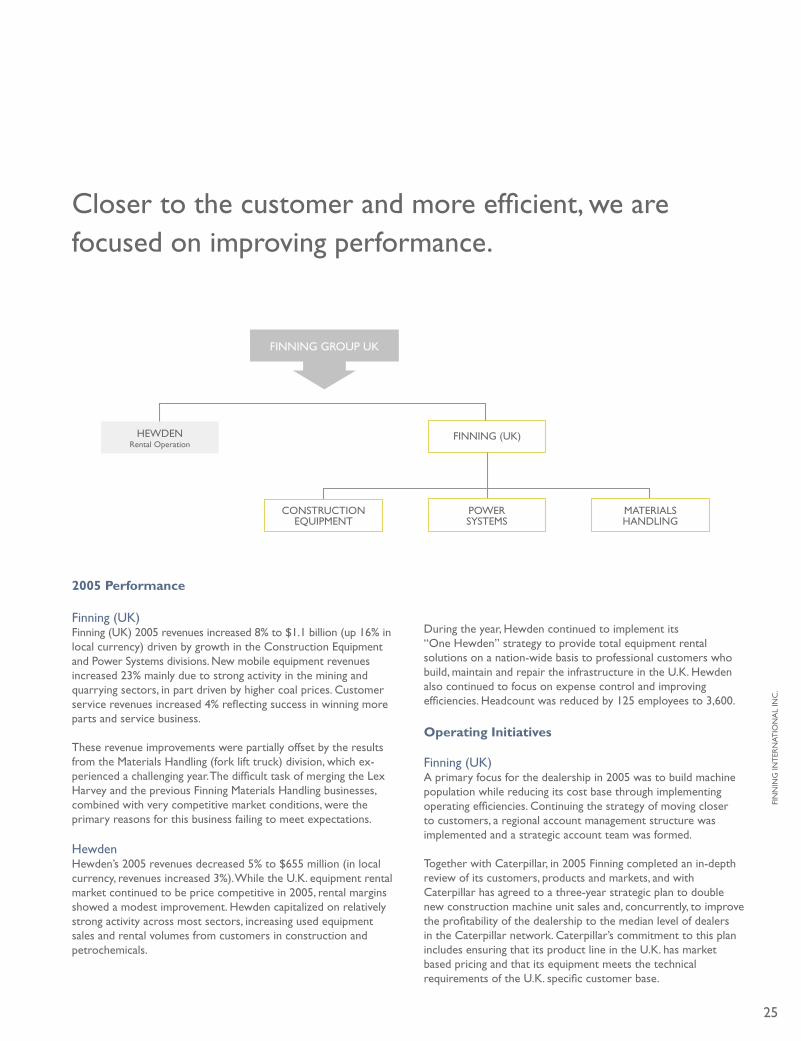
FINNING GROUP UK
HEWDENRental Operation
FINNING (UK)
POWER SYSTEMS
MATERIALS HANDLING
CONSTRUCTION EQUIPMENT
2005 Performance
Finning (UK)Finning (UK) 2005 revenues increased 8% to $1.1 billion (up 16% in local currency) driven by growth in the Construction Equipment and Power Systems divisions. New mobile equipment revenues increased 23% mainly due to strong activity in the mining and quarrying sectors, in part driven by higher coal prices. Customer service revenues increased 4% reflecting success in winning more parts and service business.
These revenue improvements were partially offset by the results from the Materials Handling (fork lift truck) division, which ex-perienced a challenging year. The difficult task of merging the Lex Harvey and the previous Finning Materials Handling businesses, combined with very competitive market conditions, were the primary reasons for this business failing to meet expectations.
HewdenHewden’s 2005 revenues decreased 5% to $655 million (in local currency, revenues increased 3%). While the U.K. equipment rental market continued to be price competitive in 2005, rental margins showed a modest improvement. Hewden capitalized on relatively strong activity across most sectors, increasing used equipment sales and rental volumes from customers in construction and petrochemicals.
During the year, Hewden continued to implement its “One Hewden” strategy to provide total equipment rental solutions on a nation-wide basis to professional customers who build, maintain and repair the infrastructure in the U.K. Hewden also continued to focus on expense control and improving efficiencies. Headcount was reduced by 125 employees to 3,600.
operating Initiatives
Finning (UK)A primary focus for the dealership in 2005 was to build machine population while reducing its cost base through implementing operating efficiencies. Continuing the strategy of moving closer to customers, a regional account management structure was implemented and a strategic account team was formed.
Together with Caterpillar, in 2005 Finning completed an in-depth review of its customers, products and markets, and with Caterpillar has agreed to a three-year strategic plan to double new construction machine unit sales and, concurrently, to improve the profitability of the dealership to the median level of dealers in the Caterpillar network. Caterpillar’s commitment to this plan includes ensuring that its product line in the U.K. has market based pricing and that its equipment meets the technical requirements of the U.K. specific customer base.
Closer to the customer and more efficient, we are focused on improving performance.
25
FIN
NIN
G IN
TER
NAT
ION
AL
INC
.
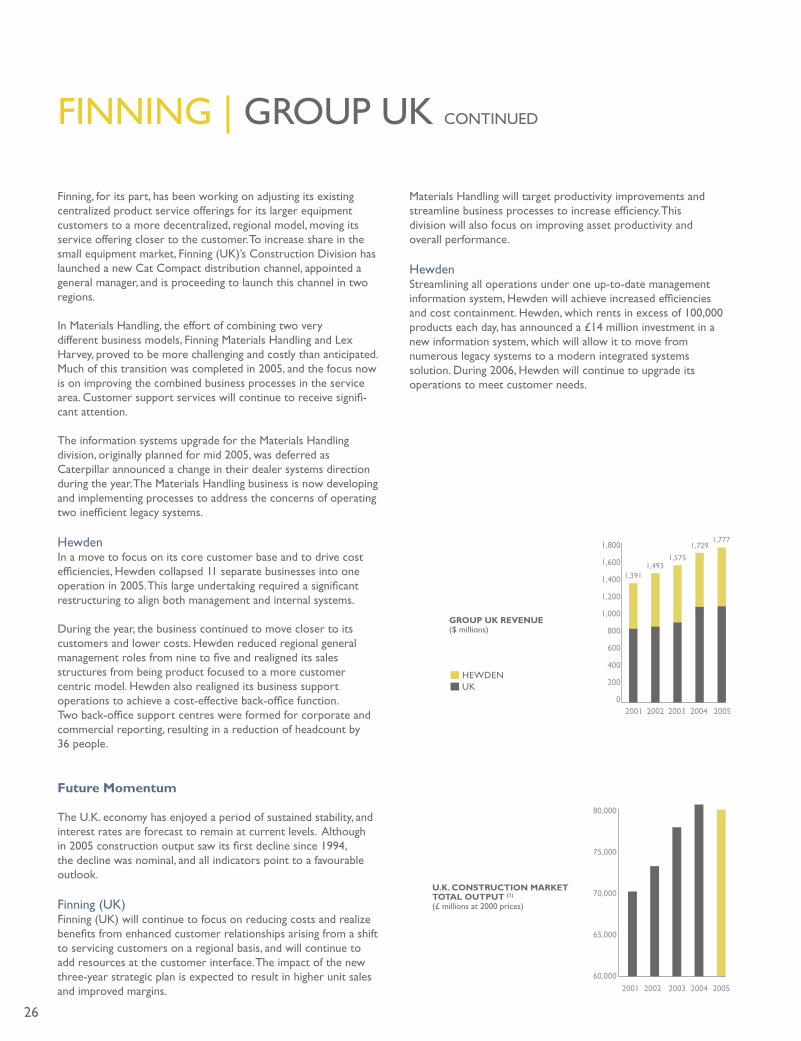
2001 2002 2003 2004 2005
U.K. CONSTRUCTION MARKET TOTAL OUTPUT (1)
(£ millions at 2000 prices)
60,000
65,000
70,000
75,000
80,000
UKHEWDEN
2001 2002 2003 2004 2005
GROUP UK REVENUE($ millions)
1,3911,493
1,575
1,7291,777
0
200
400
600
800
1,000
1,200
1,400
1,600
1,800
FINNING | GROUP UK CONTINUED
Finning, for its part, has been working on adjusting its existing centralized product service offerings for its larger equipment customers to a more decentralized, regional model, moving its service offering closer to the customer. To increase share in the small equipment market, Finning (UK)’s Construction Division has launched a new Cat Compact distribution channel, appointed a general manager, and is proceeding to launch this channel in two regions.
In Materials Handling, the effort of combining two very different business models, Finning Materials Handling and Lex Harvey, proved to be more challenging and costly than anticipated. Much of this transition was completed in 2005, and the focus now is on improving the combined business processes in the service area. Customer support services will continue to receive signifi-cant attention.
The information systems upgrade for the Materials Handling division, originally planned for mid 2005, was deferred as Caterpillar announced a change in their dealer systems direction during the year. The Materials Handling business is now developing and implementing processes to address the concerns of operating two inefficient legacy systems.
Hewden In a move to focus on its core customer base and to drive cost efficiencies, Hewden collapsed 11 separate businesses into one operation in 2005. This large undertaking required a significant restructuring to align both management and internal systems.
During the year, the business continued to move closer to its customers and lower costs. Hewden reduced regional general management roles from nine to five and realigned its sales structures from being product focused to a more customer centric model. Hewden also realigned its business support operations to achieve a cost-effective back-office function. Two back-office support centres were formed for corporate and commercial reporting, resulting in a reduction of headcount by 36 people.
Future momentum
The U.K. economy has enjoyed a period of sustained stability, and interest rates are forecast to remain at current levels. Although in 2005 construction output saw its first decline since 1994, the decline was nominal, and all indicators point to a favourable outlook.
Finning (UK)Finning (UK) will continue to focus on reducing costs and realize benefits from enhanced customer relationships arising from a shift to servicing customers on a regional basis, and will continue to add resources at the customer interface. The impact of the new three-year strategic plan is expected to result in higher unit sales and improved margins.
Materials Handling will target productivity improvements and streamline business processes to increase efficiency. This division will also focus on improving asset productivity and overall performance.
HewdenStreamlining all operations under one up-to-date management information system, Hewden will achieve increased efficiencies and cost containment. Hewden, which rents in excess of 100,000 products each day, has announced a £14 million investment in a new information system, which will allow it to move from numerous legacy systems to a modern integrated systems solution. During 2006, Hewden will continue to upgrade its operations to meet customer needs.
26

27(1) U.K. Department of Trade & Industry(2) 1 billion = 1,000,000,000
FOCUS ON U.K. CONSTRUCTION
27
The total U.K. construction market is estimated to be worth approximately £80 billion(2) annually. Growth has been strong, with annual growth rates over the past 10 years in the range of 2.0 - 2.5%. Future construction investment is expected to grow through both publicly and privately funded initiatives. The 2012 Summer Olympics awarded to London will also generate considerable future opportunities.
Leading positionThe expanding U.K. construction industry is a key market opportunity for Finning, which serves two types of construction customers: Hewden provides a one-stop solution for customers who choose to rent their equipment, and the Construction Equipment division of Finning (UK) offers equipment, parts and support services to customers expanding and replacing their own fleets.
In a climate of rising costs, it is important for construction companies to find a “one-stop shop” where they can source all their equipment needs and are guaranteed dealer support to ensure reliable, cost-effective equipment performance. Finning works with customers to provide solutions that minimize costs and maximize productivity and equipment availability.
Fuelled growthThe growth potential for Finning Group UK in the construction industry is excellent, driven by public/private housing, industrial/commercial building, repair and maintenance work and infrastructure construction.
Over the next ten years, the U.K. is projected to be one of the few countries in the European Union with population growth. Demographic and social trends increase the number of house-holds leading to a housing shortage. Currently, there is an annual shortfall of 70,000 units. Construction of housing is forecast to increase by 39% to an estimated £25.5 billion by 2010.
In 2001, the government set out a 10-year, £180 billion plan to improve the transport infrastructure within the U.K. To date, many of these projects have failed to get off the ground due to planning and legal delays. However, many large, high-value road and rail network projects are now forecast to proceed within the next few years.
In 2004, the U.K. government announced a “school renewal program” to replace or renovate all of England’s secondary schools over the next 15 years at a cost of £45 billion.
Other opportunities include a £16 billion program whereby U.K. water utilities will invest in their supply pipes, sewers and treatment works by upgrading or replacing the existing infrastructure.
Many high-profile initiatives will require public/private partner-ships and private financing, resulting in requirements for equipment supply from a wider range of construction companies.
Construction is the largest customer segment for Finning’s operations in the U.K. Finning Group UK is well positionedto take advantage of the opportunities presented by this large market.
The U.K. construction industry is one of the strongest in the world, with output ranked in the global top ten.(1)
» Cat Excavator - Heathrow, Terminal 5 » Articulated Dump Truck - Heathrow » Heathrow, Terminal 5 construction
FIN
NIN
G IN
TER
NAT
ION
AL
INC
.
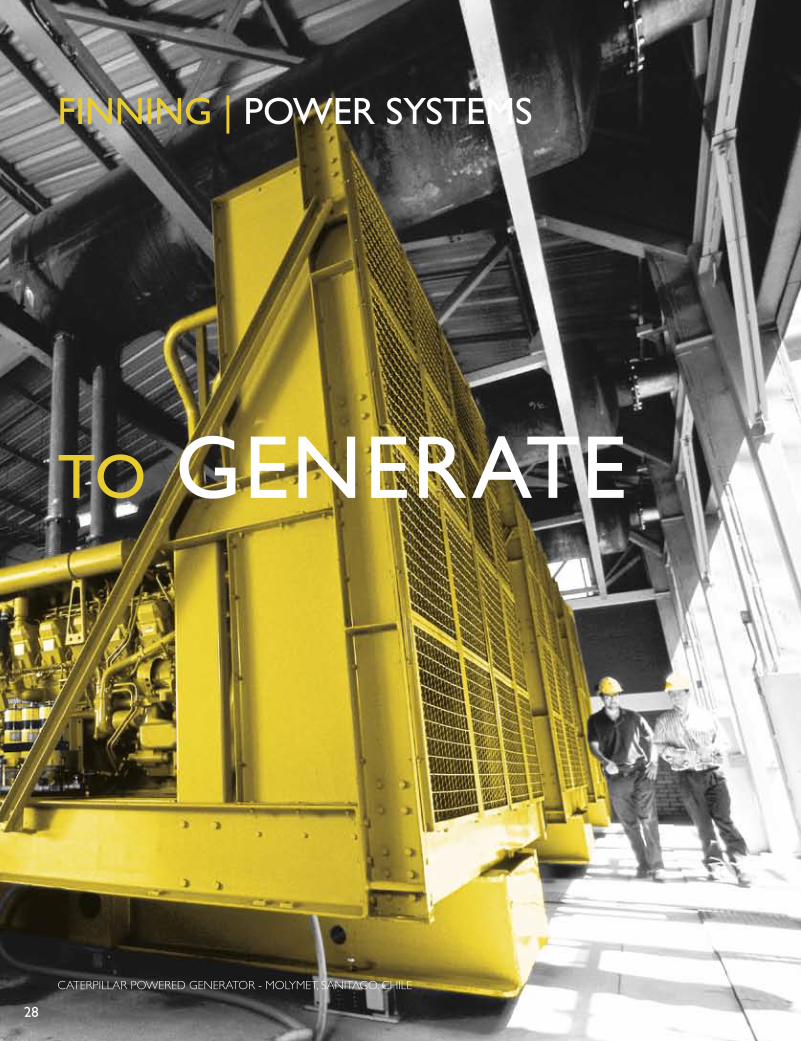
FINNING | POWER SYSTEMS
28
CATERPILLAR POWERED GENERATOR - MOLYMET, SANITAGO, CHILE
TO GENERATE

0
100
200
300
400
500
600
700
2001 2002 2003 2004 2005
POWER SYSTEMS REVENUE($ millions)
POWER SYSTEMS RESULTS ARE REPORTED WITHIN OTHER FINNING DIVISIONS
358
456479
610
363
2005 Performance2005 proved a very successful year for the Power Systems busi-ness with revenues and E�IT both up approximately 27% over 2004. Strong demand for engines for gas compression and electric power generation applications, and support services across all sectors, contributed to higher revenues and market share gains in most product lines.
Tackling ChallengesTight supply conditions for certain engine models increased delivery times and challenged our staff in meeting customer needs. Power Systems operations in western Canada and South America were also faced with a shortage of skilled technicians to support the growing demand for customer service.
In addition, while the start-up Diperk UK operations continued to build sales volumes in 2005, they were unable to generate sufficient revenue to make a positive contribution to E�IT. Future momentumWe expect continuing strong demand for gas compression engines from western Canada, as compression requirements ramp up in both existing and new wells to supply rising demand for natural gas. The electric power generation and marine original equipment manufacturer sectors in the U.K. continue to see demand growth. In South America, electric power generation initiatives will drive the Power Systems business in that region.
Given high energy prices, global trends toward alternative fuel sources will continue to support solid growth in generating power from alternative fuels, creating future opportunities for Finning’s UK Power Systems business. One example is the U.K. government’s target to generate 10% of the country’s energy from “green” sources by 2010.
In 2005, Finning increased its ownership of Energyst �.V., a Pan-European power rental company jointly owned by Finning, Caterpillar and 10 European Cat dealers. Finning is now the largest shareholder with a 24.4% interest. During the year, a new management team was appointed, and operations became profitable. The revised ownership structure and new management are expected to enable Energyst to broaden its markets in Europe and generate additional revenue and positive contributions to profitability.
29
The Power Systems division supplies engines and related customer services across all Finning territories.
CanadaThe western Canadian Power Systems operations benefited significantly from the expansion of the petroleum industry in �.C. and Alberta as high natural gas prices resulted in increased drilling activity and demand for compression in 2005.
The “on-highway” truck business, supplying parts and service to Cat powered trucks, saw attractive growth in 2005. Finning also secured a contract to supply marine engines to �.C. Ferry Corporation, and was awarded the contract to provide all on-site power generation equipment for De �eers Canada Inc.’s Snap Lake underground diamond mining project in the Northwest Territories.
United KingdomThe U.K. is the most diversified market for Power Systems. Opportunities are driven by industrial and marine applications, as well as conventional electric generation and “green” electric power initiatives. Going forward, we expect a growing contribution from Energyst’s operations and improved returns from Diperk UK.
South AmericaThe key drivers in South America are mining and construction, ranging from generator sets for construction customers in urban centres to remote power plants for mining customers in the Andes. Opportunities also include emerging requirements for energy conservation and environmental management systems by mining customers. Future opportunities will also arise as the gas reserves in Argentina, and to a lesser extent �olivia, are developed.
FIN
NIN
G IN
TER
NAT
ION
AL
INC
.

30
OIL SAMPLE TESTING LABORATORY - COMPONENT REBUILD CENTRE, ANTOFAGASTA, CHILE
CorPorATE rESPoNSIbILITy
TO UPHOLD
CorPorATE rESPoNSIbILTy
0.0
0.5
1.0
1.5
2.0
2.5
2001 2002 2003 2004 2005
2.22
1.98
0.97
0.780.72
LTI is measured as the number oflost time injuries per 200,000 work hours
LOST TIME INJURY FREQUENCY (LTI)
31
From employee safety to community support, from recycling to remanufacturing – we take our role as a responsible corporate citizen seriously.
Setting StandardsOur employee safety standards are outstanding, and we continuously work on improving our safety record. In 2005 our Lost Time Injury (LTI) frequency dropped to a record low - 0.72 lost time injuries per 200,000 work hours – an excellent safety performance.
CanadaFinning (Canada) leads in workplace safety and continues to make measured gains towards our target of “Getting to Zero” injuries. In 2005, Finning was named a “Work Safe Alberta - �est Safety Performer” by the Workers Compensation �oard, a distinction bestowed on just 350 of Alberta’s 128,000 employers.
In a unique partnership with the Northern Alberta Institute of Technology and Caterpillar, Finning funds the Caterpillar Dealer Service Technician program: Think�IG. �ased on Caterpillar’s evaluation, our first class of graduates (spring 2005) received the highest marks among all Think�IG students in the world.
The United Way is the largest beneficiary of Finning’s community investment. In addition to matching employee donations, employees volunteer their time to the United Way. Finning employees, customers and suppliers also participated in the Cat Chopper Charity Ride to raise funds for the United Way.
United KingdomIn addition to continual improvement through ISO safety and environmental management, Finning personnel in the U.K. support their communities throughout the year by sponsoring events which raise funds for children, disaster relief and other worthy causes.
In 2005, Finning (UK) became involved in an initiative to produce electricity from mine gas, an innovative and “green” use of this alternative fuel source. Finning employees provided key expertise throughout nine months of strategic planning, inventive thinking and practical solutions to help make this endeavour possible.
South AmericaIn 2005, Finning South America implemented a Corporate Social Responsibility policy with three key components. Foremost is safety, and like Canada, Finning South America is a record performer with a 2005 LTI frequency rate significantly below the industry norm.
The second component is an Environmental Management System based on advanced world practices and standards. Today, two-thirds of our Mining Contracts as well as our Component Rebuild Centre are ISO 14001 certified and audited.
The third element is community support. We fund educational programs for underprivileged children and contribute to programs for the handicapped. In addition to corporate donations, our employees are actively involved in raising money as well as performing “hands on” community work.
Finning University and our Think�IG School in Santiago, Chile are technical programs to train mechanics to Finning standards. �oth are examples of our innovative approach to recruiting mechanics from local communities.
FIN
NIN
G IN
TER
NAT
ION
AL
INC
.
FINANCIAL REPORT
MANAGEMENT’S DISCUSSION AND ANALYSIS 33
MANAGEMENT’S REPORT TO THE SHAREHOLDERS 58
AUDITORS’ REPORT 59
CONSOLIDATED FINANCIAL STATEMENTS 60
TEN YEAR FINANCIAL SUMMARY 88
32
33
FINANCIAL REPORT
This discussion and analysis of Finning International Inc. (Finning or the Company) should be read in conjunction with the consolidated financial statements and accompanying notes. The results reported herein have been prepared in accordance with Canadian generally accepted accounting principles (GAAP) and are presented in Canadian dollars unless otherwise stated.
RESULTS OF OPERATIONS
FoUrTH qUArTEr oVErVIEw (% OF REVENUE)
($ MILLIONS) q4 2005 Q4 2004 q4 2005 Q4 2004
Revenue $ 1,184.0 $ 1,075.2Gross profit 337.3 311.1 28.5% 28.9%Selling, general & administrative expenses 274.7 250.2 23.2% 23.3%Other expenses 0.9 0.2 0.1% 0.0%Earnings before interest and taxes (E�IT) 61.7 60.7 5.2% 5.6%Finance costs 17.8 45.3 1.5% 4.2%Provision for income taxes 7.7 (7.3) 0.6% (0.7)%Non-controlling interests – 2.6 – 0.2%Net income $ 36.2 $ 20.1 3.1% 1.9%
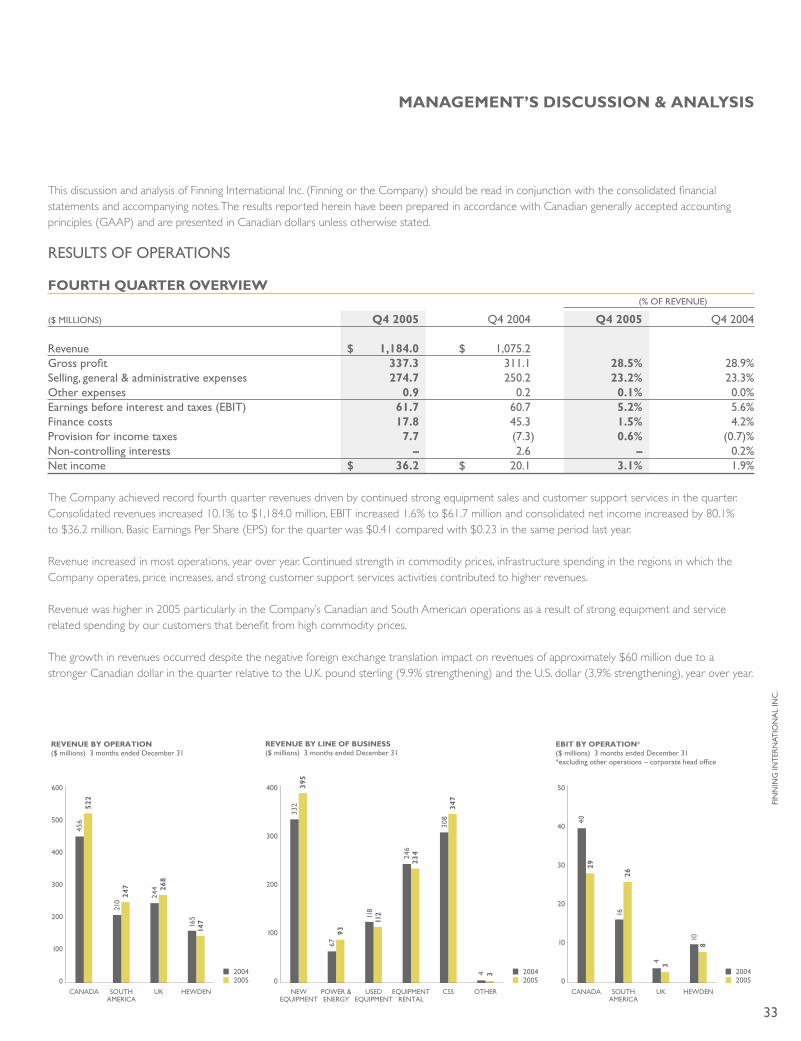
The Company achieved record fourth quarter revenues driven by continued strong equipment sales and customer support services in the quarter. Consolidated revenues increased 10.1% to $1,184.0 million, EBIT increased 1.6% to $61.7 million and consolidated net income increased by 80.1% to $36.2 million. Basic Earnings Per Share (EPS) for the quarter was $0.41 compared with $0.23 in the same period last year.
Revenue increased in most operations, year over year. Continued strength in commodity prices, infrastructure spending in the regions in which the Company operates, price increases, and strong customer support services activities contributed to higher revenues.
Revenue was higher in 2005 particularly in the Company’s Canadian and South American operations as a result of strong equipment and service related spending by our customers that benefit from high commodity prices.
The growth in revenues occurred despite the negative foreign exchange translation impact on revenues of approximately $60 million due to a stronger Canadian dollar in the quarter relative to the U.K. pound sterling (9.9% strengthening) and the U.S. dollar (3.9% strengthening), year over year.
REVENUE BY OPERATION ($ millions) 3 months ended December 31
CANADA UK HEWDENSOUTHAMERICA
600
500
400
300
200
100
0
456
522
210
247
244 26
8
165
147
20052004
REVENUE BY LINE OF BUSINESS($ millions) 3 months ended December 31
NEWEQUIPMENT
POWER & ENERGY
EQUIPMENTRENTAL
USEDEQUIPMENT
400
300
200
100
0
332
395
6793
118
112
246
234
CSS
308
347
OTHER
4 3
20052004
EBIT BY OPERATION*($ millions) 3 months ended December 31*excluding other operations – corporate head office
CANADA UK HEWDENSOUTHAMERICA
50
40
30
20
10
0
4029
1626
4 3
108
20052004
mANAGEmENT’S dISCUSSIoN & ANALySIS
FIN
NIN
G IN
TER
NAT
ION
AL
INC
.
34
From a line of business perspective, strong demand for new equipment and customer support services in the fourth quarter of 2005 was partially offset by lower rental revenues from the UK Materials Handling business. 2005 revenues exceeded 2004 revenues notwithstanding the 2004 sale of the majority of the Company’s leased assets to Caterpillar Financial Services Limited which resulted in an additional $60 million of equipment sales revenue in the fourth quarter of 2004. Excluding the impact of foreign exchange and the sale of leased assets, revenues in local currency increased by 37% in Canada; 22% in the UK operations and 21% in South America, while Hewden remained at similar levels to last year’s quarter.
Gross profit of $337.3 million in the quarter increased 8.4% over the same period last year. As a percentage of revenue, gross profit decreased slightly over last year primarily due to a higher proportion of 2005 revenues from new equipment sales which experience lower margins than the rental and customer support services line of business.
EBIT increased $1.0 million, year over year, with the strong performance in the Company’s South American operations partially offset by higher costs and lower contribution from the UK Materials Handling business in the fourth quarter of 2005. Costs were higher in the Canadian operating segment to support the Company’s start-up operation, OEM Remanufacturing, which, while in production in the fourth quarter of 2005, was impacted by Finning (Canada)’s labour stoppage and also incurred higher start-up costs. In 2005, the Canadian operating segment’s EBIT was also negatively impacted by approximately $5.6 million of additional costs due to a labour strike at Finning (Canada) which lasted approximately 6 weeks. In 2004, Finning (Canada) sold its leased assets which contributed $6.4 million to EBIT.
In addition, EBIT from operations were impacted year over year due to the stronger Canadian dollar relative to both the U.S. dollar and the U.K. pound sterling currencies, and the Chilean peso which strengthened relative to the Canadian dollar. The Chilean peso strengthened approximately 8% over the fourth quarter of 2004 and resulted in higher selling, general and administrative (SG&A) costs from our South American operations when translated into Canadian dollars. EBIT for the fourth quarter was approximately $8.0 million lower than last year as a result of these foreign currency movements.
Long-term incentive plan (LTIP) costs were lower in the fourth quarter of 2005. The common share price movement in the fourth quarter of 2005 generated income of $2.8 million, whereas an increase in the common share price in the fourth quarter of 2004 triggered the vesting of deferred share units and resulted in an expense of $6.7 million.
In local currencies, and excluding the impact of the lease asset sales, LTIP and strike costs, EBIT reflects stronger operational performances from the Company’s Canadian and South American operations year over year, partially offset by a weaker performance from the Company’s UK Materials Handling business.
Net income improved 80.1% in the fourth quarter of 2005 reflecting lower financing costs due to the refinancing of the non-controlling interests in Hewden in November 2004.
Cash flow after changes in working capital for the quarter was $135.2 million, a significant improvement from cash flow of $1.4 million generated in the same period last year. This was primarily due to stabilizing working capital requirements in the last two quarters of 2005 as management continues to focus on improving cash cycle times and operating efficiencies. In the fourth quarter of 2005 the Company continued to invest in inventories to support strong customer demand and product availability issues, although at a lower growth rate than the prior year.
The Company made a net investment in rental assets of $29.3 million during the fourth quarter of 2005, a decrease of $40.4 million from the same period in 2004. Rental assets were utilized in 2005 to support customer demand where product availability issues arose and fewer rental assets were purchased by the UK Materials Handling business due to lower demand. As a result of these items and despite the fourth quarter 2004 sale of the majority of the Canadian leased assets, cash flow from operating activities was $98.7 million in 2005 compared to a use of cash of $16.1 million in 2004.
Normalized resultsCertain revenue and expense items that were not reflective of the underlying performance of the Company’s ongoing operations were removed from reported results prepared in accordance with GAAP in Canada. See Schedule 1 for a summary of normalized items and a reconciliation of normalized results to published results. Excluding items that do not reflect the Company’s ongoing operations, Normalized EBIT for the quarter was $62.5 million or 2.6% higher than the fourth quarter of 2004. Normalized Net Income was $37.0 million (2004: $34.5 million) while Normalized EPS was $0.41, comparable to the fourth quarter of 2004 ($0.42 per share).
mANAGEmENT’S dISCUSSIoN & ANALySIS
35
ANNUAL oVErVIEw (% OF REVENUE)
($ MILLIONS) 2005 2004 2005 2004
Revenue $ 4,834.6 $ 4,161.9Gross profit 1,391.1 1,243.7 28.8% 29.9%Selling, general & administrative expenses 1,103.5 964.3 22.8% 23.2%Other expenses 2.3 13.7 0.1% 0.3%Earnings before interest and taxes 285.3 265.7 5.9% 6.4%Finance costs 76.9 118.1 1.6% 2.8%Provision for income taxes 44.4 17.6 0.9% 0.4%Non-controlling interests – 15.1 – 0.4%Net income $ 164.0 $ 114.9 3.4% 2.8%
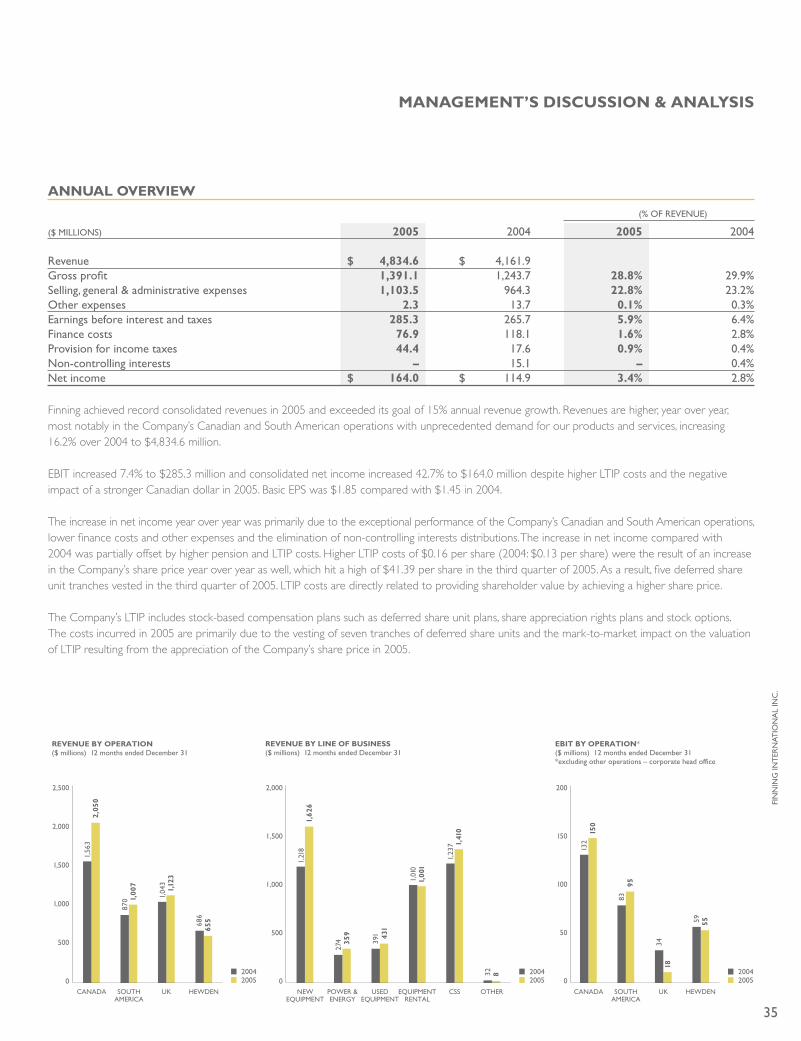
Finning achieved record consolidated revenues in 2005 and exceeded its goal of 15% annual revenue growth. Revenues are higher, year over year, most notably in the Company’s Canadian and South American operations with unprecedented demand for our products and services, increasing 16.2% over 2004 to $4,834.6 million.
EBIT increased 7.4% to $285.3 million and consolidated net income increased 42.7% to $164.0 million despite higher LTIP costs and the negative impact of a stronger Canadian dollar in 2005. Basic EPS was $1.85 compared with $1.45 in 2004.
The increase in net income year over year was primarily due to the exceptional performance of the Company’s Canadian and South American operations, lower finance costs and other expenses and the elimination of non-controlling interests distributions. The increase in net income compared with 2004 was partially offset by higher pension and LTIP costs. Higher LTIP costs of $0.16 per share (2004: $0.13 per share) were the result of an increase in the Company’s share price year over year as well, which hit a high of $41.39 per share in the third quarter of 2005. As a result, five deferred share unit tranches vested in the third quarter of 2005. LTIP costs are directly related to providing shareholder value by achieving a higher share price.
The Company’s LTIP includes stock-based compensation plans such as deferred share unit plans, share appreciation rights plans and stock options. The costs incurred in 2005 are primarily due to the vesting of seven tranches of deferred share units and the mark-to-market impact on the valuation of LTIP resulting from the appreciation of the Company’s share price in 2005.
REVENUE BY OPERATION($ millions) 12 months ended December 31
CANADA UK HEWDENSOUTHAMERICA
2,500
2,000
1,500
1,000
500
0
1,56
32,
050
870 1,
007
1,04
31,
123
686
655
20052004
EBIT BY OPERATION*($ millions) 12 months ended December 31*excluding other operations – corporate head office
CANADA UK HEWDENSOUTHAMERICA
200
150
100
50
0
132
150
8395
3418
59 55
20052004
REVENUE BY LINE OF BUSINESS($ millions) 12 months ended December 31
NEWEQUIPMENT
POWER &ENERGY
EQUIPMENTRENTAL
USEDEQUIPMENT
2,000
1,500
1,000
500
0
1,21
81,
626
274 35
9
391 43
1
1,01
01,
001
CSS
1,23
7 1,41
0
OTHER
32 8
20052004
mANAGEmENT’S dISCUSSIoN & ANALySIS
FIN
NIN
G IN
TER
NAT
ION
AL
INC
.
36
Other expenses were lower by $11.4 million in 2005 partially due to the $7.9 million pre-tax settlement of a legal claim in 2004 in the U.K. Finance costs in 2005 were lower compared with 2004 due to foreign exchange and $22.3 million of costs associated with the redemption of non-controlling interests.
The Company is committed to improving its cost structure and continues to progress its plan to reduce annualized costs by $60 million by the end of 2006.
Finning’s business is geographically diversified and the Company conducts business in multiple currencies, the most significant of which are the U.S. dollar, the Canadian dollar, the U.K. pound sterling and the Chilean peso. The most significant foreign exchange impact on the Company’s net income is the translation of foreign currency based earnings into Canadian dollars. Compared to the prior year, the strengthening of the Canadian dollar against the U.S. dollar and U.K. pound sterling decreased EBIT and net income by $27.9 million and $15.1 million, respectively.
Finning’s order book of $968 million continues at extremely strong levels, up 15.9% from the December 2004 levels of $835 million.
Order book, or backlog, represents the retail value of equipment units ordered by customers for future deliveries and is a measure used by Company management to forecast future revenues. Notwithstanding the strong backlog levels, the Company is dependent on Caterpillar for the timely supply of equipment and parts to fulfill these deliveries. Caterpillar has reported that while they have increased production at some of their manufacturing facilities to meet the increase in demand for their products, they continue to place certain of their models under managed distribution in North America. In addition, Caterpillar continues to face material supply chain constraints for large mining products, in particular a continued tire shortage, thereby increasing the delivery time for these products. Caterpillar is focusing on its production processes to improve order fulfillment and supply chain efficiencies. The Company continues to work closely with Caterpillar and customers to ensure that demand for product can be met. Where supply constraints occur, the Company has been utilizing its rental assets and used equipment to meet demand.
For the year ended December 31, 2005 cash flow after working capital items of $478.8 million was almost double that of the same period in 2004 as a result of stabilizing working capital. The Company decreased net spending on rental assets by 29.6% with a net investment of $310.7 million in 2005 (2004: $441.4 million). In 2004, the Company continued with its strategy to sell its lease portfolio to Caterpillar Financial Services Limited and by the end of 2004 had divested virtually its entire lease portfolio. Cash flow from operating activities was $158.3 million compared to a use of cash of $117.2 million in the same period of 2004.
In November 2004, the Company issued 10 million common shares for proceeds, net of issue costs and income taxes, of $296.8 million, which were used to fund a portion of the cost of refinancing the $425.0 million non-controlling interests in Hewden.
RESULTS �Y �USINESS SEGMENTThe Company and its subsidiaries have operated primarily in one principal business during the year, that being the selling, servicing, renting and financing of heavy equipment and related products in various markets worldwide as noted below.
Operating units are as follows:
• Canadian operations: British Columbia, Alberta, the Yukon Territory, the Northwest Territories, and a portion of Nunavut.• South American operations: Chile, Argentina, Uruguay and Bolivia.• UK operations: England, Scotland, Wales, Falkland Islands and the Channel Islands.• Hewden operations: Equipment rental in England, Scotland, Wales and Jersey.• Other operations: corporate head office.
mANAGEmENT’S dISCUSSIoN & ANALySIS
37
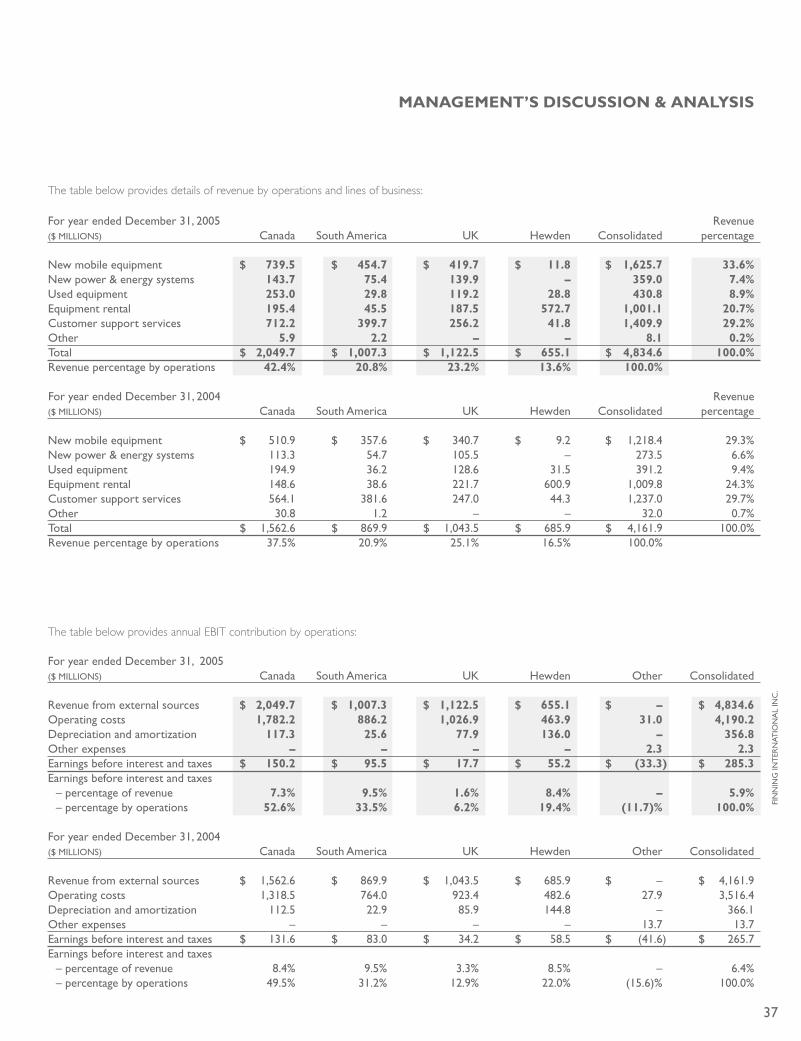
The table below provides details of revenue by operations and lines of business:
For year ended December 31, 2005 Revenue ($ MILLIONS) Canada South America UK Hewden Consolidated percentage
New mobile equipment $ 739.5 $ 454.7 $ 419.7 $ 11.8 $ 1,625.7 33.6%New power & energy systems 143.7 75.4 139.9 – 359.0 7.4%Used equipment 253.0 29.8 119.2 28.8 430.8 8.9%Equipment rental 195.4 45.5 187.5 572.7 1,001.1 20.7%Customer support services 712.2 399.7 256.2 41.8 1,409.9 29.2%Other 5.9 2.2 – – 8.1 0.2%Total $ 2,049.7 $ 1,007.3 $ 1,122.5 $ 655.1 $ 4,834.6 100.0%Revenue percentage by operations 42.4% 20.8% 23.2% 13.6% 100.0%
For year ended December 31, 2004 Revenue ($ MILLIONS) Canada South America UK Hewden Consolidated percentage
New mobile equipment $ 510.9 $ 357.6 $ 340.7 $ 9.2 $ 1,218.4 29.3%New power & energy systems 113.3 54.7 105.5 – 273.5 6.6%Used equipment 194.9 36.2 128.6 31.5 391.2 9.4%Equipment rental 148.6 38.6 221.7 600.9 1,009.8 24.3%Customer support services 564.1 381.6 247.0 44.3 1,237.0 29.7%Other 30.8 1.2 – – 32.0 0.7%Total $ 1,562.6 $ 869.9 $ 1,043.5 $ 685.9 $ 4,161.9 100.0%Revenue percentage by operations 37.5% 20.9% 25.1% 16.5% 100.0%
The table below provides annual EBIT contribution by operations:
For year ended December 31, 2005 ($ MILLIONS) Canada South America UK Hewden Other Consolidated
Revenue from external sources $ 2,049.7 $ 1,007.3 $ 1,122.5 $ 655.1 $ – $ 4,834.6Operating costs 1,782.2 886.2 1,026.9 463.9 31.0 4,190.2Depreciation and amortization 117.3 25.6 77.9 136.0 – 356.8Other expenses – – – – 2.3 2.3Earnings before interest and taxes $ 150.2 $ 95.5 $ 17.7 $ 55.2 $ (33.3) $ 285.3Earnings before interest and taxes – percentage of revenue 7.3% 9.5% 1.6% 8.4% – 5.9% – percentage by operations 52.6% 33.5% 6.2% 19.4% (11.7)% 100.0%
For year ended December 31, 2004 ($ MILLIONS) Canada South America UK Hewden Other Consolidated
Revenue from external sources $ 1,562.6 $ 869.9 $ 1,043.5 $ 685.9 $ – $ 4,161.9Operating costs 1,318.5 764.0 923.4 482.6 27.9 3,516.4Depreciation and amortization 112.5 22.9 85.9 144.8 – 366.1Other expenses – – – – 13.7 13.7Earnings before interest and taxes $ 131.6 $ 83.0 $ 34.2 $ 58.5 $ (41.6) $ 265.7Earnings before interest and taxes – percentage of revenue 8.4% 9.5% 3.3% 8.5% – 6.4% – percentage by operations 49.5% 31.2% 12.9% 22.0% (15.6)% 100.0%
mANAGEmENT’S dISCUSSIoN & ANALySIS
FIN
NIN
G IN
TER
NAT
ION
AL
INC
.
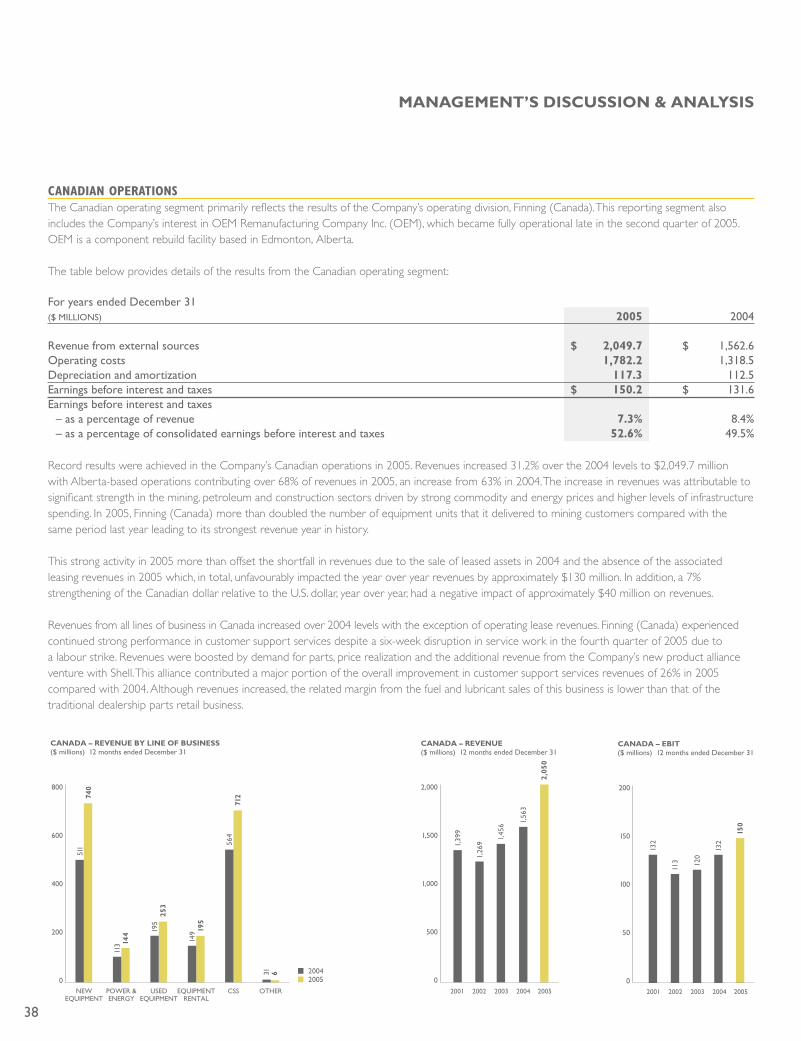
38
Canadian OperatiOnsThe Canadian operating segment primarily reflects the results of the Company’s operating division, Finning (Canada). This reporting segment also includes the Company’s interest in OEM Remanufacturing Company Inc. (OEM), which became fully operational late in the second quarter of 2005. OEM is a component rebuild facility based in Edmonton, Alberta.
The table below provides details of the results from the Canadian operating segment:
For years ended December 31 ($ MILLIONS) 2005 2004
Revenue from external sources $ 2,049.7 $ 1,562.6Operating costs 1,782.2 1,318.5Depreciation and amortization 117.3 112.5Earnings before interest and taxes $ 150.2 $ 131.6Earnings before interest and taxes – as a percentage of revenue 7.3% 8.4% – as a percentage of consolidated earnings before interest and taxes 52.6% 49.5%
Record results were achieved in the Company’s Canadian operations in 2005. Revenues increased 31.2% over the 2004 levels to $2,049.7 million with Alberta-based operations contributing over 68% of revenues in 2005, an increase from 63% in 2004. The increase in revenues was attributable to significant strength in the mining, petroleum and construction sectors driven by strong commodity and energy prices and higher levels of infrastructure spending. In 2005, Finning (Canada) more than doubled the number of equipment units that it delivered to mining customers compared with the same period last year leading to its strongest revenue year in history.
This strong activity in 2005 more than offset the shortfall in revenues due to the sale of leased assets in 2004 and the absence of the associated leasing revenues in 2005 which, in total, unfavourably impacted the year over year revenues by approximately $130 million. In addition, a 7% strengthening of the Canadian dollar relative to the U.S. dollar, year over year, had a negative impact of approximately $40 million on revenues.
Revenues from all lines of business in Canada increased over 2004 levels with the exception of operating lease revenues. Finning (Canada) experienced continued strong performance in customer support services despite a six-week disruption in service work in the fourth quarter of 2005 due to a labour strike. Revenues were boosted by demand for parts, price realization and the additional revenue from the Company’s new product alliance venture with Shell. This alliance contributed a major portion of the overall improvement in customer support services revenues of 26% in 2005 compared with 2004. Although revenues increased, the related margin from the fuel and lubricant sales of this business is lower than that of the traditional dealership parts retail business.
CANADA – REVENUE($ millions) 12 months ended December 31
2,000
1,500
1,000
500
0
1,39
9
1,26
9
1,45
6 1,56
3
2,05
0
2001 2002 20042003 2005
CANADA – REVENUE BY LINE OF BUSINESS($ millions) 12 months ended December 31
NEWEQUIPMENT
POWER & ENERGY
EQUIPMENTRENTAL
USEDEQUIPMENT
800
600
400
200
0
511
740
113 14
4 195
253
149 19
5
CSS
564
712
OTHER
31 6
20052004
CANADA – EBIT($ millions) 12 months ended December 31
200
150
100
50
0
132
113 12
0
132
150
2001 2002 20042003 2005
mANAGEmENT’S dISCUSSIoN & ANALySIS
39
Rental revenues increased over the 2004 comparable period as a result of a larger rental fleet. The growth in the rental fleet reflects the increased demand for the Cat Rental Store businesses in 2005 and continued strong customer demand to rent equipment with an end of term option to purchase.
New equipment backlog continues to be strong and includes a significant number of mining trucks of all sizes, as well as a large number of mining support equipment orders. Backlog reflects the strong activity in the mining, petroleum, construction and government sectors in which the Canadian operations operate.
In Canada, higher gross profits were achieved due to strong customer demand and price realization, but decreased as a percentage of revenue. This was mainly due to a change in the mix of revenues in 2005 to more equipment sales, which attract a lower margin than the rental and customer support services businesses, as well as lower margins contributed by the ancillary Shell alliance business and the absence of the higher leasing business margins. This reduction was partially offset by improved equipment margins due to strong demand and improved rental margins as a result of the Cat Rental Store growth in 2005.
The record revenue experienced by the Canadian operating segment in 2005 was partially offset by higher SG&A costs. Variable costs were higher in 2005 to support the increased volumes and to meet customer demands. Customer service demand increased due to new maintenance contracts entered into in 2005. As a result, Canadian operations added revenue-generating employees and staff to support the higher level of demand. As well, the start-up of the component rebuild business of OEM increased SG&A expense levels for the Canadian operating segment. Headcount for the Canadian operating segment increased by approximately 250 or 8% over 2004. Other key factors affecting the SG&A increase in 2005 compared with 2004 include:
• Finning (Canada) incurred additional costs to maintain operations during a six-week labour strike which commenced in October 2005 by the International Association of Machinists and Aerospace Workers – Local Lodge 99, representing Finning (Canada) employees in Alberta and Northwest Territories. On December 5, 2005, an agreement was reached on a three-year collective agreement which will expire April 30, 2008. The strike resulted in higher costs of $5.6 million for security, freight and delivery as well as costs related to replacement workers.
• Higher costs incurred in the start-up business of OEM.• Higher pension and LTIP costs.
The Canadian operations have numerous initiatives underway to reduce SG&A costs and has implemented various 6-Sigma projects to facilitate further cost efficiencies.
Record revenues in the Canadian operations, partially offset by higher SG&A, costs translated into a strong contribution to EBIT of $150.2 million in 2005 compared with $131.6 million in 2004.
Finning (Canada)’s collective bargaining agreement with the International Association of Machinists and Aerospace Workers, Vancouver Lodge 692, covering approximately 800 unionized employees located in British Columbia, expires on April 14, 2006. The Company is committed to the collective bargaining process and to concluding a fair contract for its employees and for Finning.
In 2005, Finning (Canada) was selected by Caterpillar to be one of four Caterpillar dealers forming a new global Caterpillar dealership, PipeLine Machinery International (PLM). PLM is now operational and serving the global pipeline construction industry by supplying Caterpillar pipeline products to international customers who specialize in large diameter pipeline projects. Global energy demand is expected to drive an increase in worldwide construction activity in the future and Finning’s 25% interest in PLM provides an opportunity to participate in this growth.
mANAGEmENT’S dISCUSSIoN & ANALySIS
FIN
NIN
G IN
TER
NAT
ION
AL
INC
.

40
sOuth ameriCaThe Company’s South American operations include the results of its Caterpillar dealerships in Chile, Argentina, Uruguay and Bolivia.
The table below provides details of the results from the South American operations:
For years ended December 31 ($ MILLIONS) 2005 2004
Revenue from external sources $ 1,007.3 $ 869.9Operating costs 886.2 764.0Depreciation and amortization 25.6 22.9Earnings before interest and taxes $ 95.5 $ 83.0Earnings before interest and taxes – as a percentage of revenue 9.5% 9.5% – as a percentage of consolidated earnings before interest and taxes 33.5% 31.2%
Revenues in 2005, for the first time ever, exceeded the $1 billion level and increased 15.8%, despite the negative impact of a strengthening Canadian dollar relative to the U.S. dollar. In local currency (U.S. dollar), Finning South America revenues increased 24% reflecting strong machine deliveries to mining and construction customers. This is a result of the strong commodity cycle and high metals prices driven by global demand and strong economic growth in the countries in which Finning South America operates. Finning’s expectation is that commodity prices will continue to be strong in 2006 which should encourage more investment in mining and infrastructure spending. Finning South America experienced growth in most lines of business in 2005, particularly in new equipment sales. Growth was also experienced in customer support services to meet the demands of an increasing number of new mining maintenance and repair contracts and higher construction rental activity supported by a larger rental fleet.
New equipment order backlog was higher than last year and shows ongoing strength as significant new mining contracts continue to be secured to more than offset orders being delivered to customers.
Gross profit increased in 2005 over 2004, reflecting the strong demand for the Company’s products and favourable performance of customer support contracts.
SOUTH AMERICA – REVENUE($ millions) 12 months ended December 31
1,500
1,000
500
0
448
445
562
870
1,00
7
2001 2002 20042003 2005
SOUTH AMERICA – REVENUE BY LINE OF BUSINESS($ millions) 12 months ended December 31
NEWEQUIPMENT
POWER & ENERGY
EQUIPMENTRENTAL
USEDEQUIPMENT
500
400
300
200
100
0
357
455
5575
36 30
39 45
CSS
382 40
0
OTHER
1 2
20052004
SOUTH AMERICA – EBIT($ millions) 12 months ended December 31
100
80
60
40
20
0
39
45
60
83
95
2001 2002 20042003 2005
mANAGEmENT’S dISCUSSIoN & ANALySIS
41
SG&A costs were higher in 2005 compared with 2004. Variable selling costs were higher, year over year, to support the incremental business volumes experienced in 2005. Other key factors affecting the SG&A increase in 2005 compared with 2004 include:
• Higher LTIP costs.• Higher costs to support increased volumes and to meet customer demands. Customer service demand has increased due to new maintenance
contracts entered into in the last year. As a result, South America added revenue-generating employees and staff to support the higher level of demand in South America and net headcount increased by approximately 282 or 7.5% from one year ago.
Finning South America has numerous initiatives underway to reduce SG&A costs and has implemented various 6-Sigma projects to facilitate further cost efficiencies. In the fourth quarter of 2005, the Company’s South American operations reorganized selected areas of their operations and reduced headcount by approximately 100 employees from 2004 levels. These reductions are anticipated to save costs into the future by approximately $2.4 million per year.
Record revenues partially offset by higher SG&A costs translated into a strong contribution to EBIT of $95.5 million in 2005 compared with $83.0 million in 2004.
mANAGEmENT’S dISCUSSIoN & ANALySIS
FIN
NIN
G IN
TER
NAT
ION
AL
INC
.
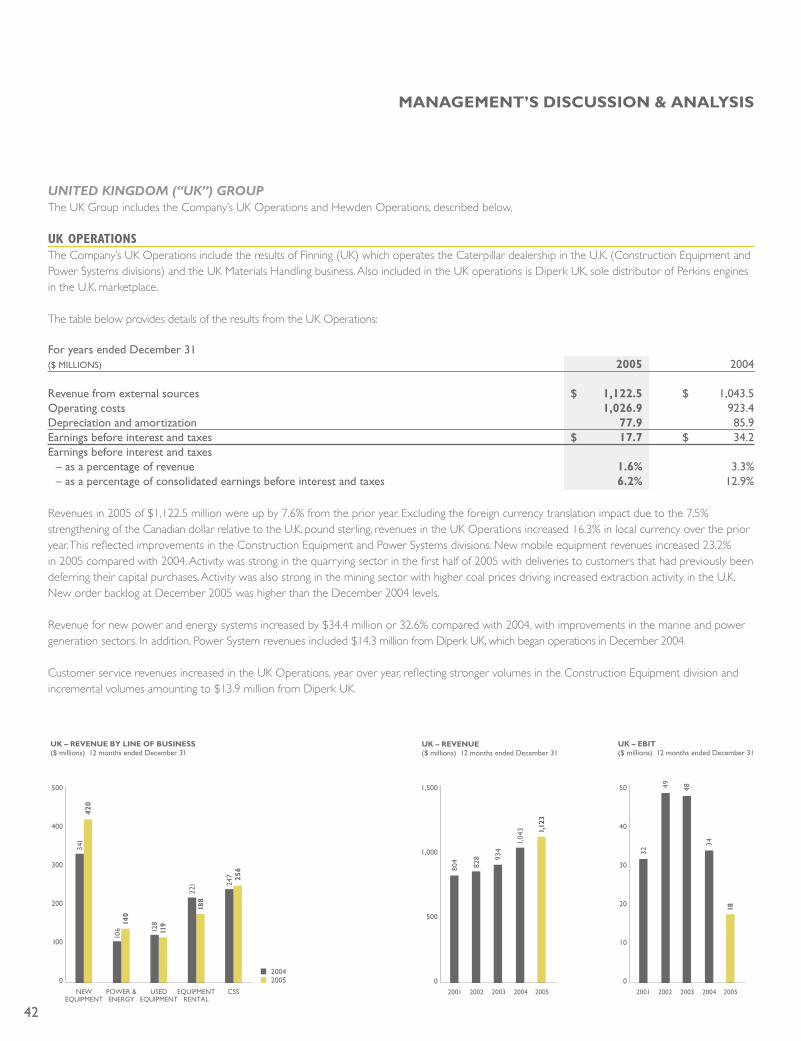
42
uNited KiNgdom (“uK”) groupThe UK Group includes the Company’s UK Operations and Hewden Operations, described below.
uK OperatiOnsThe Company’s UK Operations include the results of Finning (UK) which operates the Caterpillar dealership in the U.K. (Construction Equipment and Power Systems divisions) and the UK Materials Handling business. Also included in the UK operations is Diperk UK, sole distributor of Perkins engines in the U.K. marketplace.
The table below provides details of the results from the UK Operations:
For years ended December 31 ($ MILLIONS) 2005 2004
Revenue from external sources $ 1,122.5 $ 1,043.5Operating costs 1,026.9 923.4Depreciation and amortization 77.9 85.9Earnings before interest and taxes $ 17.7 $ 34.2Earnings before interest and taxes – as a percentage of revenue 1.6% 3.3% – as a percentage of consolidated earnings before interest and taxes 6.2% 12.9%
Revenues in 2005 of $1,122.5 million were up by 7.6% from the prior year. Excluding the foreign currency translation impact due to the 7.5% strengthening of the Canadian dollar relative to the U.K. pound sterling, revenues in the UK Operations increased 16.3% in local currency over the prior year. This reflected improvements in the Construction Equipment and Power Systems divisions. New mobile equipment revenues increased 23.2% in 2005 compared with 2004. Activity was strong in the quarrying sector in the first half of 2005 with deliveries to customers that had previously been deferring their capital purchases. Activity was also strong in the mining sector with higher coal prices driving increased extraction activity in the U.K. New order backlog at December 2005 was higher than the December 2004 levels.
Revenue for new power and energy systems increased by $34.4 million or 32.6% compared with 2004, with improvements in the marine and power generation sectors. In addition, Power System revenues included $14.3 million from Diperk UK, which began operations in December 2004.
Customer service revenues increased in the UK Operations, year over year, reflecting stronger volumes in the Construction Equipment division and incremental volumes amounting to $13.9 million from Diperk UK.
UK – REVENUE BY LINE OF BUSINESS($ millions) 12 months ended December 31
NEWEQUIPMENT
POWER & ENERGY
EQUIPMENTRENTAL
USEDEQUIPMENT
500
400
300
200
100
0
341
420
106
140
128
119
221
188
CSS
247 25
6
20052004
UK – EBIT($ millions) 12 months ended December 31
50
40
30
20
10
0
32
49 48
34
18
2001 2002 20042003 2005
UK – REVENUE($ millions) 12 months ended December 31
1,500
1,000
500
0
804
828 93
4
1,04
3 1,12
3
2001 2002 20042003 2005
mANAGEmENT’S dISCUSSIoN & ANALySIS
43
These improvements were offset by the results of the Materials Handling division of the UK Operation, which experienced a difficult year. In addition to operating in a very competitive marketplace, a number of other factors influenced performance. Combining two very different business models, Finning Materials Handling with Lex Harvey, has proven to be a challenging and costly process that to date has not been fully successful. Information systems upgrades that were originally planned were deferred which has caused the business to operate with two inefficient legacy systems that are challenging to integrate. 2005 saw a higher proportion of customers finance their long-term contracts externally. This increased new equipment sales revenue in 2005 but also had the effect of reducing the Division’s long term rental fleet and related rental revenues. At December 31, 2005, the Materials Handling long-term rental fleet was approximately 11,000 units, down 7% from the end of 2004. Rental revenues also decreased in 2005 partially due to a slowing demand for short-term rental of Materials Handling fleet units. As a result, the short-term rental fleet for Materials Handling has been reduced to 2,500 units at the end of December 2005 compared with 3,000 at December 2004. Efforts are ongoing to improve the results of the Materials Handling division. Senior management changes have been implemented. As well, in late 2005, Finning introduced several special programs providing its Materials Handling customers with favourable financing terms and manufacturer supported pricing incentives. The benefits of these programs were only beginning to materialize in the last few months of the year. In January 2006, the Materials Handling division of the UK Operations was selected as the preferred supplier to provide approximately 130 warehouse lift trucks to DSG International, a large international company. This is a significant new customer with opportunity for growth.
Gross profit in 2005 for the UK Operations was lower in absolute dollars due to the stronger Canadian dollar. In local currency, gross profit increased 4% over last year but gross profit margins were lower in 2005. This is partially due to a higher proportion of revenue from sales of equipment, which typically earn lower margins than other lines of business, and lower margin percentages achieved in the competitive U.K. marketplace. Other factors influencing the lower gross profit margins were lower rental fleet revenues and higher fleet maintenance costs of the Materials Handling business and lower margins achieved by the new Diperk UK business. There has been some improvement in the absolute gross margin contribution achieved by the Construction Equipment and Power Systems divisions while they work on improving their market share, but at lower percentage margins reflecting the competitiveness of the U.K. marketplace. Management at Finning (UK) continues to focus on improving margins in all areas, cost control and working with Caterpillar to improve market share.
The UK Operations also experienced higher SG&A costs. Key factors affecting the SG&A increase in 2005 compared with 2004 include:
• Higher operating costs due to continued systems inefficiencies.• Higher costs due to the start-up phase of Diperk UK.• Higher pension, LTIP and other people related costs.
The increase in SG&A in 2005 compared with 2004 was partially offset by the favourable foreign exchange impact due to a stronger Canadian dollar relative to the U.K. pound sterling.
Management has identified a number of significant opportunities to reduce costs, including projects already underway at Finning (UK), including reducing the costs associated with their DBSi information system, pension and other areas. Finning (UK) and affected employees have agreed to change employee pensionable benefits which will now increase broadly in line with inflation. This change will be effective early in 2006 and is anticipated to decrease pension expense for Finning (UK) by approximately $5.5 million annually. In February 2006, Finning (UK) implemented a restructuring plan that will result in a reduction in headcount by approximately 50 people to reduce employment related costs by approximately $3 million going forward.
The UK Operations contributed $17.7 million of EBIT in 2005 compared with $34.2 million in 2004, reflecting the impact on revenues, margins and SG&A discussed above.
To support the effort in the U.K. to grow market share in all sectors and improve profitability, Finning (UK) has agreed to a three-year strategic plan with Caterpillar. The plan is based on a mutual commitment to double the present market share and concurrently to improve the profitability of the dealership to the median level of dealers in the Caterpillar dealer network. Caterpillar, for its part, has agreed to ensure that its products in the U.K. will have market based pricing and that its equipment will at least have parity in terms of key technical capabilities and specifications. Finning, for its part, has agreed to adjust its existing centralized product service offerings for its larger equipment to a more decentralized, regional model, moving its service offering closer to the customer. In addition, Finning has agreed to launch a new “Cat Compact” distribution channel for the smaller equipment in the product line. In support of this strategic plan, certain product lines have seen adjustments to pricing levels. Also, in 2005 Caterpillar announced a global alliance with JLG Industries Inc. to produce a full line of Caterpillar branded telehandlers by late 2006. This is a key product for Finning as telehandlers are the largest market segments in the U.K. equipment market. Finning in turn has appointed a general manager for the new Cat Compact channel and is proceeding to pilot 2 regions of the new distribution channel.
mANAGEmENT’S dISCUSSIoN & ANALySIS
FIN
NIN
G IN
TER
NAT
ION
AL
INC
.
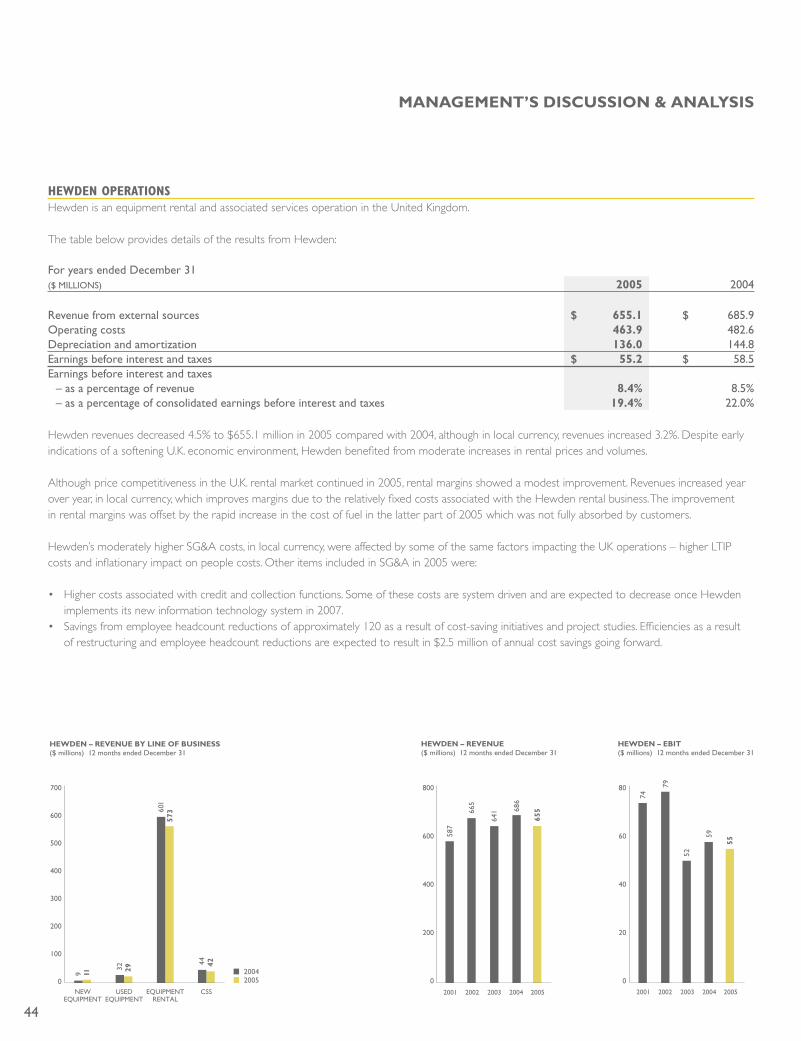
44
hewden OperatiOnsHewden is an equipment rental and associated services operation in the United Kingdom.
The table below provides details of the results from Hewden:
For years ended December 31 ($ MILLIONS) 2005 2004
Revenue from external sources $ 655.1 $ 685.9Operating costs 463.9 482.6Depreciation and amortization 136.0 144.8Earnings before interest and taxes $ 55.2 $ 58.5Earnings before interest and taxes – as a percentage of revenue 8.4% 8.5% – as a percentage of consolidated earnings before interest and taxes 19.4% 22.0%
Hewden revenues decreased 4.5% to $655.1 million in 2005 compared with 2004, although in local currency, revenues increased 3.2%. Despite early indications of a softening U.K. economic environment, Hewden benefited from moderate increases in rental prices and volumes.
Although price competitiveness in the U.K. rental market continued in 2005, rental margins showed a modest improvement. Revenues increased year over year, in local currency, which improves margins due to the relatively fixed costs associated with the Hewden rental business. The improvement in rental margins was offset by the rapid increase in the cost of fuel in the latter part of 2005 which was not fully absorbed by customers.
Hewden’s moderately higher SG&A costs, in local currency, were affected by some of the same factors impacting the UK operations – higher LTIP costs and inflationary impact on people costs. Other items included in SG&A in 2005 were:
• Higher costs associated with credit and collection functions. Some of these costs are system driven and are expected to decrease once Hewden implements its new information technology system in 2007.
• Savings from employee headcount reductions of approximately 120 as a result of cost-saving initiatives and project studies. Efficiencies as a result of restructuring and employee headcount reductions are expected to result in $2.5 million of annual cost savings going forward.
HEWDEN – REVENUE ($ millions) 12 months ended December 31
800
600
400
200
0
587
665
641 68
6
655
2001 2002 20042003 2005
HEWDEN – REVENUE BY LINE OF BUSINESS($ millions) 12 months ended December 31
NEWEQUIPMENT
EQUIPMENTRENTAL
USEDEQUIPMENT
700
600
500
400
300
200
100
0
9 11
32 29
601
573
CSS
44 42
20052004
HEWDEN – EBIT($ millions) 12 months ended December 31
80
60
40
20
0
74
79
52
59
55
2001 2002 20042003 2005
mANAGEmENT’S dISCUSSIoN & ANALySIS

45
To further improve revenues and operational results, Hewden has initiated several inter-related projects to improve financial performance and become more efficient in meeting the needs of a core customer base, with a streamlined product offering and a more strategically structured distribution channel. This is expected, in conjunction with its new information technology system, to increase asset utilization and reduce costs. Project costs relating to these initiatives are expected to continue in 2006 and 2007.
Hewden contributed $55.2 million of EBIT in 2005 compared with $58.5 million in 2004, reflecting the impact on revenues, margins and SG&A discussed above, together with the adverse impact of a stronger Canadian dollar when translating Hewden’s results from U.K. pound sterling. In local currency, EBIT increased 2.1%.
Other expensesOther expenses are shown separately on the income statement to allow an easier comparison of the performance of the Company’s ongoing operations to the corresponding period in the prior year. As a result of these items, the Company recorded a pre-tax expense of $2.3 million in 2005, compared to a pre-tax expense of $13.7 million for the corresponding period in 2004. See Schedule 1 for a complete listing of these items.
The major items were:
In 2005:• Restructuring and project costs incurred in all operations of $12.4 million primarily due to: – Project costs in the UK operation for business model redesign and in the Hewden operation for its key initiatives which focus on its core
customer base, narrowing its product offering and simplifying its operational organization so as to increase asset utilization and reduce costs. These expenditures, which began in 2004 in the Hewden operation, are expected to continue into 2007.
– Restructuring relating to the outsourcing of Finning (Canada)’s parts warehousing to Tracker Logistics. In the first quarter of 2005, Finning (Canada) entered into a five-year renewable contract with Edmonton, Alberta based Tracker Logistics, to outsource the majority of the warehousing activities of its Edmonton-based parts distribution centre. The contract, subject to volumes handled, represents commitments of approximately $9.0 million per annum.
– Restructuring related to centralizing certain functions to be shared throughout the South American operations and realigning of other positions to better service customers, with a headcount reduction of approximately 100 employees and a resulting charge of $2.3 million.
• Sale of the Company’s investment in Maxim Power Corp. as part of a strategy to divest non-core assets. The Company recorded a $1.8 million gain on the sale of this investment.
• Gain on sale of surplus properties in the U.K. and Canada of $8.3 million.
In 2004:• The Company settled Hewden legal claims for damages arising from the collapse of a tower crane at the Canary Wharf site in the U.K. on May
21, 2000, which was prior to the Company’s acquisition of Hewden in 2001. The impact of the settlement, net of previous accruals, was a pre-tax charge of $7.9 million.
• Restructuring and project costs of $16.0 million primarily due to: – The implementation of Hewden’s key initiatives in 2004. – Finning (Canada)’s restructuring to take advantage of growth opportunities, reduce its cost base and to cover redundancy costs in preparation
of outsourcing its component rebuild service work to OEM. – Finning (UK)’s downsizing of specialized services and a restructuring of its component rebuild centre.• Recognition of the $3.8 million unamortized portion of the deferred gain from the sale of the Canadian Materials Handling business in 2001.• Gain on sale of surplus properties in the U.K. and Canada of $6.8 million.
mANAGEmENT’S dISCUSSIoN & ANALySIS
FIN
NIN
G IN
TER
NAT
ION
AL
INC
.

46
earnings befOre interest and taxes (ebit)On a consolidated basis, EBIT increased by 7.4% to $285.3 million in 2005 with record EBIT levels achieved in Canada and South America. The increase in gross profit of $147.4 million in 2005 was somewhat offset by higher SG&A costs. The increased SG&A expense reflects higher LTIP costs, pension costs and increased headcount to meet business growth and customer service demand. EBIT was also lower in 2005 as a result of the strengthening Canadian dollar relative to the U.S. dollar and U.K. pound sterling. The foreign exchange variance is mainly due to translating results from country operations that are based on a foreign currency into Canadian dollars. EBIT as a percentage of revenue decreased from 6.4% in 2004 to 5.9% in 2005.
Major components of the annual EBIT variance were:
($ MILLIONS)
2004 annual EbIT $ 265.7 Net growth in operations, particularly Canada and South America 98.9 Start-up businesses (7.3) Higher pension expense (5.9) Lower UK Materials Handling contribution (17.0) Foreign exchange impact (27.9) Higher long-term incentive plan costs (6.3) Canada lease sale in 2004 (20.8) Canada strike (5.6) Net change in other expenses (see note 2 to the Consolidated Financial Statements) 11.52005 annual EbIT $ 285.3
finanCe COstsFinance costs for the year ended December 31, 2005 of $76.9 million were 34.9% lower than last year primarily due to the following:
• Lower average long-term borrowing rates in 2005 as term debt matured in 2004 and was refinanced at lower rates.• Costs incurred in 2004 related to the redemption of the non-controlling interests which was used to finance a portion of the Hewden Stuart
acquisition. Redemption of the non-controlling interests resulted in a charge of $22.3 million in 2004, which included costs to unwind related hedging arrangements and the accelerated write-off of associated deferred financing costs.
• Favourable foreign exchange impact of translating U.K. pound sterling and U.S. denominated finance costs in 2005 with a stronger Canadian dollar.
These decreases were partially offset by higher debt levels in 2005 and higher short-term interest rates. Debt levels increased in most operations in 2005 to fund the higher investment in working capital and rental assets. Debt levels were also higher in 2005 due to a full year’s impact of the refinancing of the non-controlling interests in late 2004 partially with debt.
EBIT BY OPERATION*($ millions) 12 months ended December 31*excluding other operations – corporate head office
CANADA UK HEWDENSOUTHAMERICA
200
150
100
50
0
132
150
8395
3418
59 55
20052004
mANAGEmENT’S dISCUSSIoN & ANALySIS
47
prOvisiOn fOr inCOme taxesThe 2005 annual income tax expense was $44.4 million (21.3% effective tax rate) compared with $17.6 million (13.2% effective tax rate) for 2004, primarily as a result of a higher level of income and more earnings originating in the higher Canadian tax jurisdiction relative to total earnings than in 2004. Tax expense was also lower in 2004 partially due to favourable tax assessments received which did not recur in 2005. Management anticipates that for 2006, the consolidated effective tax rate will approximate 22-25%.
nOn-COntrOlling interestsThe Company formed a partnership in 2001 for the purpose of raising capital to fund the acquisition of Hewden. Private investors invested $425.0 million into the partnership in return for non-controlling partnership interests. The financial position, results of operations and cash flows of the partnership were consolidated with the results of the Company from the date of the partnership’s inception. On November 24, 2004, Finning redeemed the non-controlling partnership interests held by the private investors for $425.0 million. The removal of the third party interests in Hewden provided increased flexibility in implementing the various initiatives designed to unlock the full value of its businesses in the U.K. and enhance the Company’s ability to grow its business. The refinancing of the non-controlling interests was funded principally through a common share equity offering in November 2004, which raised proceeds, net of issue costs and income taxes, of $296.8 million, and short-term borrowings on the Company’s bank credit facilities. In December 2004, the Company repaid these short-term bank borrowings by issuing a 7-year, $150.0 million unsecured medium term note (MTN).
The distribution to the non-controlling partnership interests in 2004 (up to November 24, 2004, the date of redemption) was $15.1 million, representing a yield of 4.0%.
net inCOmeNet income increased 42.7% to $164.0 million in 2005 compared with $114.9 million in 2004 reflecting the strong contributions from the Canadian and South American operations, lower finance costs, the absence of non-controlling interests and lower other expenses. 2005 results were tempered by the unfavourable foreign exchange impact of approximately $15.1 million after-tax, primarily due to translating foreign sourced earnings, and the higher LTIP costs of $4.7 million after-tax. Basic earnings per share increased to $1.85 in 2005 compared to $1.45 in the prior year.
ACCOUNTING ESTIMATES AND CONTINGENCIESManagement’s discussion and analysis of the Company’s financial condition and results of operations are based on the Company’s consolidated financial statements, which have been prepared in accordance with Canadian GAAP. The Company’s significant accounting policies are contained in note 1 to the consolidated financial statements. Certain of these policies require management to make estimates and assumptions that affect the reported amounts of assets, liabilities, revenues, expenses and disclosure of contingent assets and liabilities. These policies may require particularly subjective and complex judgments to be made as they relate to matters that are inherently uncertain and because the likelihood that materially different amounts could be reported under different conditions or using different assumptions. We have discussed the development, selection and application of our key accounting policies, and the critical accounting estimates and assumptions they involve, with the Audit Committee of the Board of Directors. The more significant estimates include: fair values for goodwill impairment tests, reserves for warranty, provisions for income tax, employee future benefits and costs associated with maintenance and repair contracts.
During the year, the Company performed an assessment of goodwill by estimating the fair value of operations to which the goodwill relates using the present value of expected discounted future cash flows, which resulted in no impairment in 2005. The Company performs impairment tests on its goodwill balances on an annual basis or as warranted by events or circumstances. A significant portion of recorded goodwill relates to Hewden Stuart plc, acquired in 2001.
Due to the size, complexity and nature of the Company’s operations, various legal and tax matters are pending. In the opinion of management, none of these matters will have a material effect on the Company’s consolidated financial position or results of operations.
mANAGEmENT’S dISCUSSIoN & ANALySIS
FIN
NIN
G IN
TER
NAT
ION
AL
INC
.
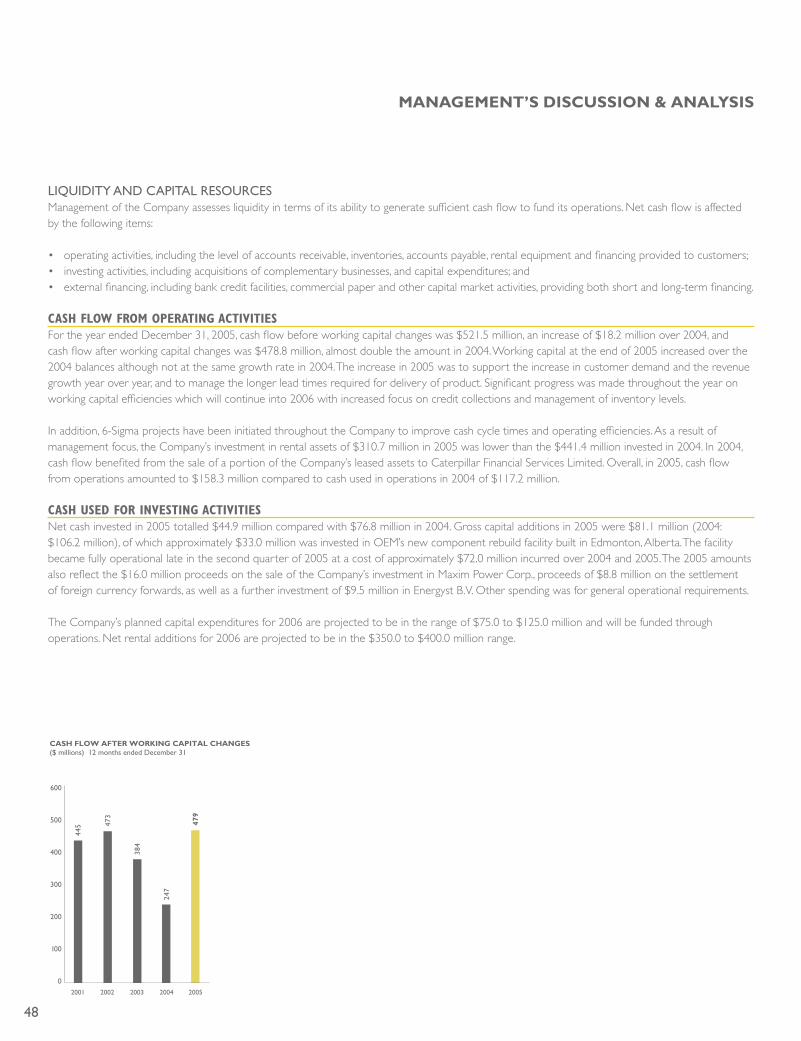
48
LIQUIDITY AND CAPITAL RESOURCESManagement of the Company assesses liquidity in terms of its ability to generate sufficient cash flow to fund its operations. Net cash flow is affected by the following items:
• operating activities, including the level of accounts receivable, inventories, accounts payable, rental equipment and financing provided to customers;• investing activities, including acquisitions of complementary businesses, and capital expenditures; and• external financing, including bank credit facilities, commercial paper and other capital market activities, providing both short and long-term financing.
Cash flOw frOm Operating aCtivitiesFor the year ended December 31, 2005, cash flow before working capital changes was $521.5 million, an increase of $18.2 million over 2004, and cash flow after working capital changes was $478.8 million, almost double the amount in 2004. Working capital at the end of 2005 increased over the 2004 balances although not at the same growth rate in 2004. The increase in 2005 was to support the increase in customer demand and the revenue growth year over year, and to manage the longer lead times required for delivery of product. Significant progress was made throughout the year on working capital efficiencies which will continue into 2006 with increased focus on credit collections and management of inventory levels.
In addition, 6-Sigma projects have been initiated throughout the Company to improve cash cycle times and operating efficiencies. As a result of management focus, the Company’s investment in rental assets of $310.7 million in 2005 was lower than the $441.4 million invested in 2004. In 2004, cash flow benefited from the sale of a portion of the Company’s leased assets to Caterpillar Financial Services Limited. Overall, in 2005, cash flow from operations amounted to $158.3 million compared to cash used in operations in 2004 of $117.2 million.
Cash used fOr investing aCtivitiesNet cash invested in 2005 totalled $44.9 million compared with $76.8 million in 2004. Gross capital additions in 2005 were $81.1 million (2004: $106.2 million), of which approximately $33.0 million was invested in OEM’s new component rebuild facility built in Edmonton, Alberta. The facility became fully operational late in the second quarter of 2005 at a cost of approximately $72.0 million incurred over 2004 and 2005. The 2005 amounts also reflect the $16.0 million proceeds on the sale of the Company’s investment in Maxim Power Corp., proceeds of $8.8 million on the settlement of foreign currency forwards, as well as a further investment of $9.5 million in Energyst B.V. Other spending was for general operational requirements.
The Company’s planned capital expenditures for 2006 are projected to be in the range of $75.0 to $125.0 million and will be funded through operations. Net rental additions for 2006 are projected to be in the $350.0 to $400.0 million range.
CASH FLOW AFTER WORKING CAPITAL CHANGES ($ millions) 12 months ended December 31
600
500
400
300
200
100
0
445 47
3
384
247
479
2001 2002 20042003 2005
mANAGEmENT’S dISCUSSIoN & ANALySIS
49
finanCing aCtivitiesTo complement the internally generated funds from operating and investing activities, the Company has approximately $1,376.0 million in unsecured credit facilities. Included in this amount is a new five-year global syndicated bank credit facility entered into in 2005 which replaced existing Canadian bank lines. At the year-end, approximately $199 million was drawn on these credit facilities.
Longer-term capital resources are provided by direct access to capital markets. The Company is rated by both Standard & Poor’s (S&P) and Dominion Bond Rating Service (DBRS). In 2005, the Company’s short-term debt rating was upgraded to R-1 (low) and its long-term debt rating was reconfirmed at BBB (high) by DBRS. In addition, the Company’s long-term debt rating was reconfirmed at BBB+ by S&P. Since the short-term rating upgrade by DBRS, the Company has utilized the Canadian commercial paper market as its principal source of short-term funding. The Company’s commercial paper program has a maximum authorized limit of $500 million, and is backstopped by the global syndicated credit facility.
As at December 31, 2005, the Company’s short and long-term borrowings totalled $1,231.7 million, a decrease of $136.2 million compared to December 31, 2004 levels. This reflects lower overall debt in foreign currency ($70.4 million) as well as the impact of translating foreign denominated debt into Canadian dollars ($65.8 million).
During 2004, the Company repaid its $75.0 million 8.35% debenture and its $150.0 million 7.75% MTN, both of which matured, with short-term borrowings on its bank credit facilities.
In December 2004, Finning issued a 7-year, $150 million unsecured MTN. The MTN has a coupon interest rate of 4.64% per annum, payable semi-annually commencing June 14, 2005. The MTN was priced at 99.97% of its principal amount to yield 4.645% per annum. Proceeds were used to repay existing bank indebtedness.
Dividends paid to shareholders were $39.1 million, $7.9 million higher than 2004 due to an increase in the quarterly dividend rate from $0.10 to $0.11 per share announced in early 2005 and the higher number of common shares outstanding in 2005 due primarily to the equity issue in December 2004.
In November 2004, the Company issued 10 million common shares at a price of $30.50 per common share for total gross proceeds of $305.0 million. The proceeds, net of issue costs and income taxes, of $296.8 million were used to fund a portion of the cost of refinancing the $425.0 million non-controlling partnership interests in Hewden. Share capital increased from $557.7 million at December 31, 2004 to $568.1 million at the end of 2005, reflecting the exercise of stock options of approximately 0.8 million common shares for $10.4 million.
In 2004, under a normal course issuer bid that expired December 7, 2004, Finning repurchased approximately 0.3 million common shares. These shares were repurchased at an average price of $29.15 for an aggregate cost of $9.6 million, which was allocated to reduce share capital by $1.1 million and retained earnings by $8.5 million. No common shares were repurchased in 2005.
As a result of management’s confidence in the future earnings for the Company and its ongoing commitment to the return of value to its shareholders, the Company increased its quarterly dividend in February 2004, by one cent to ten cents per common share and in February 2005, by one cent to eleven cents per common share. The Company’s Board of Directors approved a further increase in Finning’s quarterly dividend in February 2006 by two cents to thirteen cents per common share.
mANAGEmENT’S dISCUSSIoN & ANALySIS
FIN
NIN
G IN
TER
NAT
ION
AL
INC
.
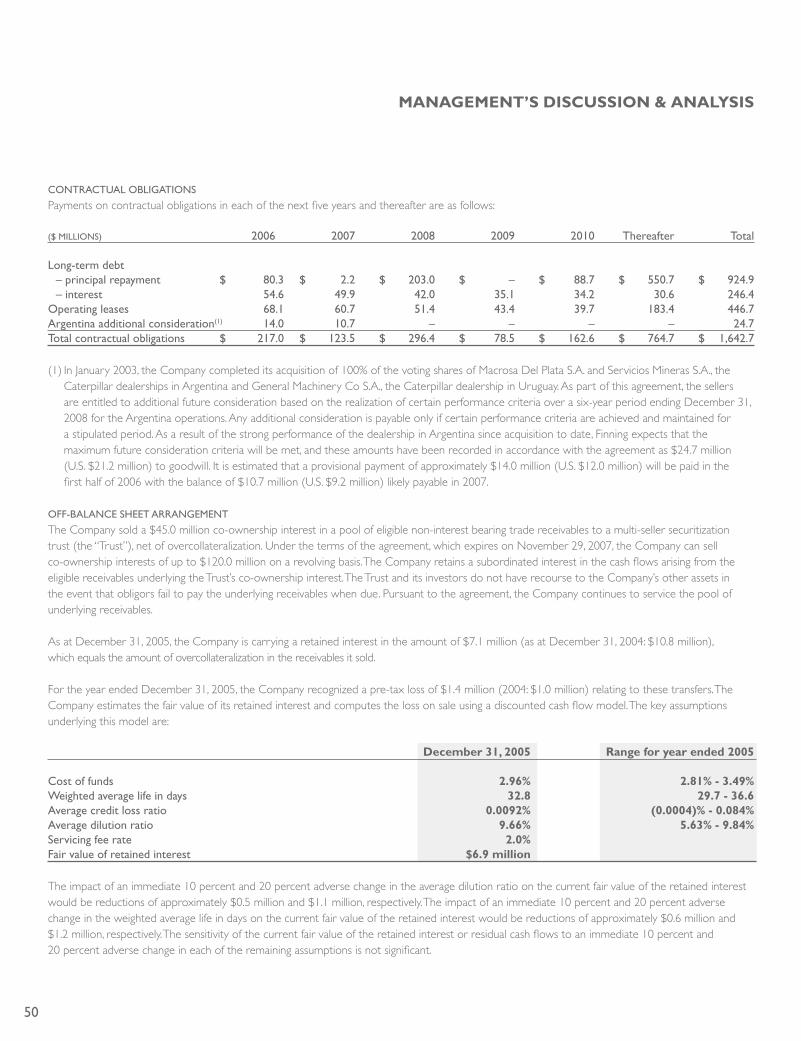
50
CONTRACTUAL O�LIGATIONS
Payments on contractual obligations in each of the next five years and thereafter are as follows:
($ MILLIONS) 2006 2007 2008 2009 2010 Thereafter Total
Long-term debt – principal repayment $ 80.3 $ 2.2 $ 203.0 $ – $ 88.7 $ 550.7 $ 924.9 – interest 54.6 49.9 42.0 35.1 34.2 30.6 246.4Operating leases 68.1 60.7 51.4 43.4 39.7 183.4 446.7Argentina additional consideration(1) 14.0 10.7 – – – – 24.7Total contractual obligations $ 217.0 $ 123.5 $ 296.4 $ 78.5 $ 162.6 $ 764.7 $ 1,642.7
(1) In January 2003, the Company completed its acquisition of 100% of the voting shares of Macrosa Del Plata S.A. and Servicios Mineras S.A., the Caterpillar dealerships in Argentina and General Machinery Co S.A., the Caterpillar dealership in Uruguay. As part of this agreement, the sellers are entitled to additional future consideration based on the realization of certain performance criteria over a six-year period ending December 31, 2008 for the Argentina operations. Any additional consideration is payable only if certain performance criteria are achieved and maintained for a stipulated period. As a result of the strong performance of the dealership in Argentina since acquisition to date, Finning expects that the maximum future consideration criteria will be met, and these amounts have been recorded in accordance with the agreement as $24.7 million (U.S. $21.2 million) to goodwill. It is estimated that a provisional payment of approximately $14.0 million (U.S. $12.0 million) will be paid in the first half of 2006 with the balance of $10.7 million (U.S. $9.2 million) likely payable in 2007.
OFF-�ALANCE SHEET ARRANGEMENT
The Company sold a $45.0 million co-ownership interest in a pool of eligible non-interest bearing trade receivables to a multi-seller securitization trust (the “Trust”), net of overcollateralization. Under the terms of the agreement, which expires on November 29, 2007, the Company can sell co-ownership interests of up to $120.0 million on a revolving basis. The Company retains a subordinated interest in the cash flows arising from the eligible receivables underlying the Trust’s co-ownership interest. The Trust and its investors do not have recourse to the Company’s other assets in the event that obligors fail to pay the underlying receivables when due. Pursuant to the agreement, the Company continues to service the pool of underlying receivables.
As at December 31, 2005, the Company is carrying a retained interest in the amount of $7.1 million (as at December 31, 2004: $10.8 million), which equals the amount of overcollateralization in the receivables it sold.
For the year ended December 31, 2005, the Company recognized a pre-tax loss of $1.4 million (2004: $1.0 million) relating to these transfers. The Company estimates the fair value of its retained interest and computes the loss on sale using a discounted cash flow model. The key assumptions underlying this model are:
december 31, 2005 range for year ended 2005
Cost of funds 2.96% 2.81% - 3.49%Weighted average life in days 32.8 29.7 - 36.6Average credit loss ratio 0.0092% (0.0004)% - 0.084%Average dilution ratio 9.66% 5.63% - 9.84%Servicing fee rate 2.0%Fair value of retained interest $6.9 million
The impact of an immediate 10 percent and 20 percent adverse change in the average dilution ratio on the current fair value of the retained interest would be reductions of approximately $0.5 million and $1.1 million, respectively. The impact of an immediate 10 percent and 20 percent adverse change in the weighted average life in days on the current fair value of the retained interest would be reductions of approximately $0.6 million and $1.2 million, respectively. The sensitivity of the current fair value of the retained interest or residual cash flows to an immediate 10 percent and 20 percent adverse change in each of the remaining assumptions is not significant.
mANAGEmENT’S dISCUSSIoN & ANALySIS
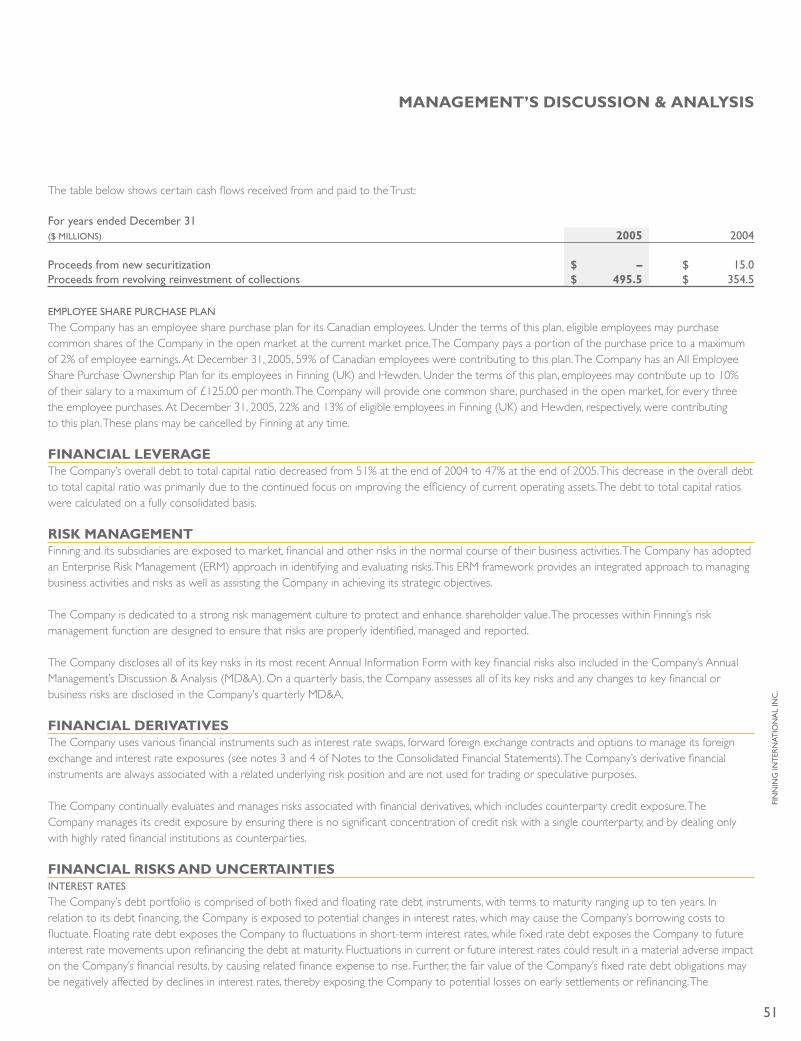
51
The table below shows certain cash flows received from and paid to the Trust:
For years ended December 31 ($ MILLIONS) 2005 2004
Proceeds from new securitization $ – $ 15.0Proceeds from revolving reinvestment of collections $ 495.5 $ 354.5
EMPLOYEE SHARE PURCHASE PLAN
The Company has an employee share purchase plan for its Canadian employees. Under the terms of this plan, eligible employees may purchase common shares of the Company in the open market at the current market price. The Company pays a portion of the purchase price to a maximum of 2% of employee earnings. At December 31, 2005, 59% of Canadian employees were contributing to this plan. The Company has an All Employee Share Purchase Ownership Plan for its employees in Finning (UK) and Hewden. Under the terms of this plan, employees may contribute up to 10% of their salary to a maximum of £125.00 per month. The Company will provide one common share, purchased in the open market, for every three the employee purchases. At December 31, 2005, 22% and 13% of eligible employees in Finning (UK) and Hewden, respectively, were contributing to this plan. These plans may be cancelled by Finning at any time.
FINANCIAL LEVErAGEThe Company’s overall debt to total capital ratio decreased from 51% at the end of 2004 to 47% at the end of 2005. This decrease in the overall debt to total capital ratio was primarily due to the continued focus on improving the efficiency of current operating assets. The debt to total capital ratios were calculated on a fully consolidated basis.
rISK mANAGEmENTFinning and its subsidiaries are exposed to market, financial and other risks in the normal course of their business activities. The Company has adopted an Enterprise Risk Management (ERM) approach in identifying and evaluating risks. This ERM framework provides an integrated approach to managing business activities and risks as well as assisting the Company in achieving its strategic objectives.
The Company is dedicated to a strong risk management culture to protect and enhance shareholder value. The processes within Finning’s risk management function are designed to ensure that risks are properly identified, managed and reported.
The Company discloses all of its key risks in its most recent Annual Information Form with key financial risks also included in the Company’s Annual Management’s Discussion & Analysis (MD&A). On a quarterly basis, the Company assesses all of its key risks and any changes to key financial or business risks are disclosed in the Company’s quarterly MD&A.
FINANCIAL dErIVATIVESThe Company uses various financial instruments such as interest rate swaps, forward foreign exchange contracts and options to manage its foreign exchange and interest rate exposures (see notes 3 and 4 of Notes to the Consolidated Financial Statements). The Company’s derivative financial instruments are always associated with a related underlying risk position and are not used for trading or speculative purposes.
The Company continually evaluates and manages risks associated with financial derivatives, which includes counterparty credit exposure. The Company manages its credit exposure by ensuring there is no significant concentration of credit risk with a single counterparty, and by dealing only with highly rated financial institutions as counterparties.
FINANCIAL rISKS ANd UNCErTAINTIESINTEREST RATES
The Company’s debt portfolio is comprised of both fixed and floating rate debt instruments, with terms to maturity ranging up to ten years. In relation to its debt financing, the Company is exposed to potential changes in interest rates, which may cause the Company’s borrowing costs to fluctuate. Floating rate debt exposes the Company to fluctuations in short-term interest rates, while fixed rate debt exposes the Company to future interest rate movements upon refinancing the debt at maturity. Fluctuations in current or future interest rates could result in a material adverse impact on the Company’s financial results, by causing related finance expense to rise. Further, the fair value of the Company’s fixed rate debt obligations may be negatively affected by declines in interest rates, thereby exposing the Company to potential losses on early settlements or refinancing. The
mANAGEmENT’S dISCUSSIoN & ANALySIS
FIN
NIN
G IN
TER
NAT
ION
AL
INC
.

52
Company minimizes its interest rate risk by balancing its portfolio of fixed and floating rate debt, as well as managing the term to maturity of its debt portfolio. At certain times the Company utilizes derivative instruments such as interest rate swaps to adjust the balance of fixed and floating rate debt to appropriately determined levels.
CREDIT RISK
The Company has a large diversified customer base, and is not dependent on any single customer or group of customers. Although there is usually no significant concentration of credit risk related to the Company’s position in trade accounts or notes receivable, the Company does have a certain degree of credit exposure arising from its foreign exchange and interest rate derivative contracts. There is a risk that counterparties to these derivative contracts may default on their obligations. However, the Company minimizes this risk by ensuring there is no excessive concentration of credit risk with any single counterparty, by active credit management and monitoring, and by dealing only with highly rated financial institutions.
FINANCING ARRANGEMENTS
The Company will require capital to finance its future growth and to refinance its outstanding debt obligations as they come due for repayment. If the cash generated from the Company’s business, together with the credit available under existing bank facilities, is not sufficient to fund future capital requirements, the Company will require additional debt or equity financing in the capital markets. The Company’s ability to access capital markets on terms that are acceptable will be dependent upon prevailing market conditions, as well as the Company’s future financial condition. Further, the Company’s ability to increase its debt financing may be limited by its financial covenants or its credit rating objectives. Although the Company does not anticipate any difficulties in raising funds in the future, there can be no assurance that capital will be available on suitable terms and conditions, or that borrowing costs and credit ratings will not be adversely affected. In addition, the Company’s current financing arrangements contain certain restrictive covenants that may impact the Company’s future operating and financial flexibility.
COMMODITY PRICES
The Company’s sales are affected by fluctuations in commodity prices. In Canada, commodity price movements in the forestry, metals, coal and petroleum sectors can have an impact on customers’ demands for equipment and customer service. In Chile and Argentina, significant fluctuations in the price of copper and gold can have similar effects, and customers base their decisions on the long-term outlook for metals. In the U.K., lower prices for thermal coal may reduce equipment demand in that sector.
FOREIGN EXCHANGE EXPOSURE
The Company is geographically diversified, with significant investments in several different countries. The Company transacts business in multiple currencies, the most significant of which are the U.S. dollar, the Canadian dollar, the U.K. pound sterling, the Chilean peso, and the European euro. As a result, the Company has a certain degree of foreign currency exposure with respect to items denominated in foreign currencies. The three main types of foreign exchange risk of the Company can be categorized as follows:
Investment In ForeIgn operatIons
All of the Company’s foreign operations are considered self-sustaining. Accordingly, assets and liabilities are translated into Canadian dollars using the exchange rates in effect at the balance sheet dates. Any unrealized translation gains and losses are deferred and included in a separate component of shareholders’ equity. These cumulative currency translation adjustments are recognized in income when there has been a reduction in the net investment in the foreign operations.
It is the Company’s objective to minimize its net foreign investments exposure. The Company has hedged a significant portion of its foreign investments through foreign currency denominated loans and other derivative contracts (forward contracts and cross currency swaps). Any exchange gains or losses arising from the translation of the hedge instruments are deferred and accounted for in the cumulative currency translation adjustment account. A 5% hypothetical strengthening of the Canadian dollar relative to all other currencies from the December 2005 month end rates, assuming the same current level of hedging instruments, would result in a deferred unrealized loss of approximately $35.0 million.
transactIon exposure
Many of the Company’s operations purchase, sell, rent and lease products throughout the world using different currencies. This potential mismatch of currencies creates transactional exposure at the operational level, which may affect the Company’s profitability as exchange rates fluctuate. It may also impact the Company’s competitive position as relative currency movements affect the business practices and/or pricing strategies of the Company’s competitors.
mANAGEmENT’S dISCUSSIoN & ANALySIS
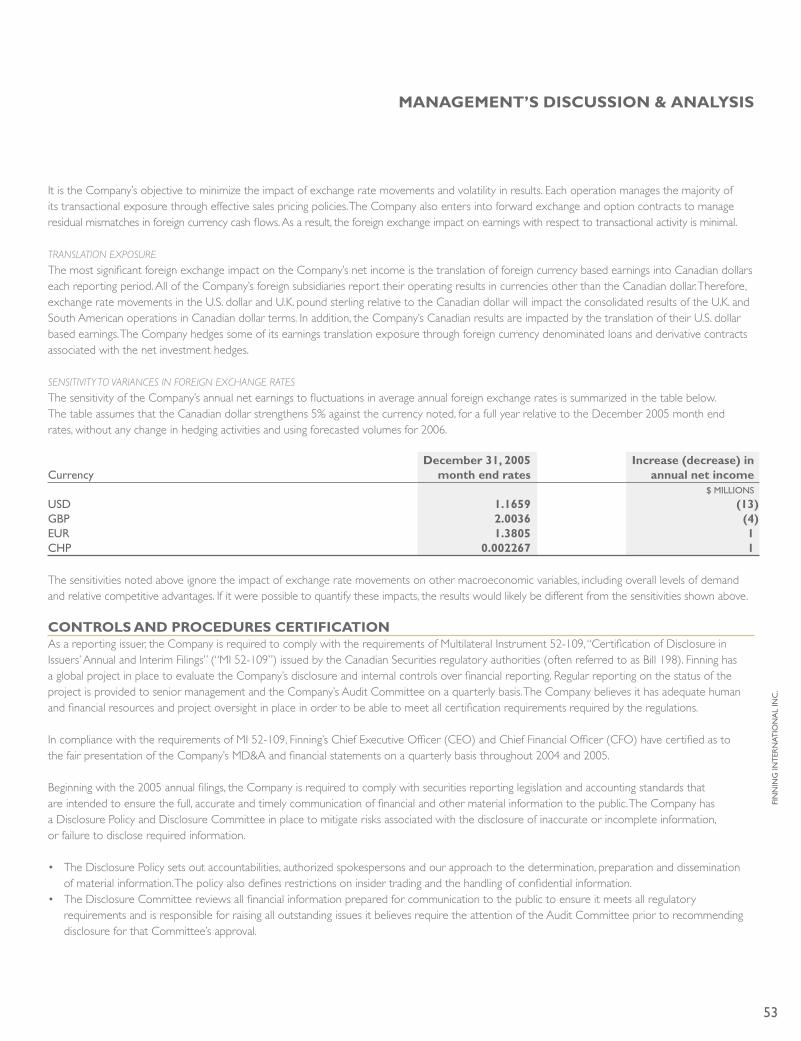
53
It is the Company’s objective to minimize the impact of exchange rate movements and volatility in results. Each operation manages the majority of its transactional exposure through effective sales pricing policies. The Company also enters into forward exchange and option contracts to manage residual mismatches in foreign currency cash flows. As a result, the foreign exchange impact on earnings with respect to transactional activity is minimal.
translatIon exposure
The most significant foreign exchange impact on the Company’s net income is the translation of foreign currency based earnings into Canadian dollars each reporting period. All of the Company’s foreign subsidiaries report their operating results in currencies other than the Canadian dollar. Therefore, exchange rate movements in the U.S. dollar and U.K. pound sterling relative to the Canadian dollar will impact the consolidated results of the U.K. and South American operations in Canadian dollar terms. In addition, the Company’s Canadian results are impacted by the translation of their U.S. dollar based earnings. The Company hedges some of its earnings translation exposure through foreign currency denominated loans and derivative contracts associated with the net investment hedges.
sensItIvIty to varIances In ForeIgn exchange rates
The sensitivity of the Company’s annual net earnings to fluctuations in average annual foreign exchange rates is summarized in the table below. The table assumes that the Canadian dollar strengthens 5% against the currency noted, for a full year relative to the December 2005 month end rates, without any change in hedging activities and using forecasted volumes for 2006.
december 31, 2005 Increase (decrease) in Currency month end rates annual net income $ MILLIONS
USD 1.1659 (13)G�P 2.0036 (4)EUR 1.3805 1CHP 0.002267 1
The sensitivities noted above ignore the impact of exchange rate movements on other macroeconomic variables, including overall levels of demand and relative competitive advantages. If it were possible to quantify these impacts, the results would likely be different from the sensitivities shown above.
CoNTroLS ANd ProCEdUrES CErTIFICATIoNAs a reporting issuer, the Company is required to comply with the requirements of Multilateral Instrument 52-109, “Certification of Disclosure in Issuers’ Annual and Interim Filings” (“MI 52-109”) issued by the Canadian Securities regulatory authorities (often referred to as Bill 198). Finning has a global project in place to evaluate the Company’s disclosure and internal controls over financial reporting. Regular reporting on the status of the project is provided to senior management and the Company’s Audit Committee on a quarterly basis. The Company believes it has adequate human and financial resources and project oversight in place in order to be able to meet all certification requirements required by the regulations.
In compliance with the requirements of MI 52-109, Finning’s Chief Executive Officer (CEO) and Chief Financial Officer (CFO) have certified as to the fair presentation of the Company’s MD&A and financial statements on a quarterly basis throughout 2004 and 2005.
Beginning with the 2005 annual filings, the Company is required to comply with securities reporting legislation and accounting standards that are intended to ensure the full, accurate and timely communication of financial and other material information to the public. The Company has a Disclosure Policy and Disclosure Committee in place to mitigate risks associated with the disclosure of inaccurate or incomplete information, or failure to disclose required information.
• The Disclosure Policy sets out accountabilities, authorized spokespersons and our approach to the determination, preparation and dissemination of material information. The policy also defines restrictions on insider trading and the handling of confidential information.
• The Disclosure Committee reviews all financial information prepared for communication to the public to ensure it meets all regulatory requirements and is responsible for raising all outstanding issues it believes require the attention of the Audit Committee prior to recommending disclosure for that Committee’s approval.
mANAGEmENT’S dISCUSSIoN & ANALySIS
FIN
NIN
G IN
TER
NAT
ION
AL
INC
.

54
In compliance with MI 52-109, the Company’s CEO and CFO, or the person performing those functions, (“Certifying Officers”) have reviewed and certified the consolidated financial statements for the year ended December 31, 2005, together with other financial information included in annual securities filings. Under the supervision and with the participation of Finning’s management, the Company conducted an evaluation of its disclosure controls and procedures. Based on this evaluation, the Company’s Certifying Officers have also certified that disclosure controls and procedures have been put in place, and that these controls and procedures provide reasonable assurance that all information considered necessary for appropriate disclosure has been accumulated and communicated to management on a timely basis and disclosed in the annual filing.
SELECTEd qUArTErLy INFormATIoN($ MILLIONS, EXCEPT FOR SHARE AND OPTION DATA)
2005 2004 q4 q3 q2 q1 Q4 Q3 Q2 Q1
Revenue Canada $ 521.5 $ 531.1 $ 509.5 $ 487.6 $ 456.2 $ 381.5 $ 363.1 $ 361.8 South America 246.9 258.9 274.3 227.2 210.1 256.0 203.1 200.7 UK 268.3 264.9 313.3 276.0 244.4 268.4 290.7 240.0 Hewden 147.3 170.8 174.4 162.6 164.5 180.0 175.7 165.7Total revenue $ 1,184.0 $ 1,225.7 $ 1,271.5 $ 1,153.4 $ 1,075.2 $ 1,085.9 $ 1,032.6 $ 968.2Net income $ 36.2 $ 44.8 $ 45.6 $ 37.4 $ 20.1 $ 43.1 $ 27.8 $ 23.9Earnings per common share �asic $ 0.41 $ 0.50 $ 0.52 $ 0.42 $ 0.23 $ 0.56 $ 0.35 $ 0.31 Diluted $ 0.40 $ 0.50 $ 0.51 $ 0.42 $ 0.23 $ 0.55 $ 0.35 $ 0.30Total assets $ 3,736.4 $ 3,754.3 $ 3,916.8 $ 3,905.3 $ 3,804.0 $ 3,683.6 $ 3,744.2 $ 3,555.0Long-term debt Current $ 80.3 $ 6.3 $ 4.1 $ 5.1 $ 6.5 $ 156.3 $ 158.7 $ 159.1 Non-current 844.6 843.0 866.6 885.3 889.6 738.9 767.3 765.9Total long-term debt $ 924.9 $ 849.3 $ 870.7 $ 890.4 $ 896.1 $ 895.2 $ 926.0 $ 925.0Cash dividends paid per common share $ 0.11 $ 0.11 $ 0.11 $ 0.11 $ 0.10 $ 0.10 $ 0.10 $ 0.10Common shares outstanding (000’s) 89,202 89,138 88,906 88,608 88,390 78,037 77,849 77,937Options outstanding (000’s) 1,474 1,545 1,810 1,812 2,016 2,359 2,546 2,564
NEw ACCoUNTING ProNoUNCEmENTSThe Company is not aware of any accounting pronouncements that would have an impact on our consolidated financial statements in 2006.
mANAGEmENT’S dISCUSSIoN & ANALySIS
55
mArKET oUTLooKFinning’s success is linked to local economic conditions in the regions where it has operations. In addition, global economic conditions which have a direct bearing on demand for commodities such as oil, copper, coal and gold, in turn influence the heavy equipment buying decisions of many of Finning’s key customers in western Canada and South America. The U.K. markets are largely driven by the overall level of “build, repair, maintain” construction activity.
In addition to new equipment sales, as the size of the Caterpillar fleet in Finning’s geographic regions grows, a larger proportion of the Company’s business will be driven by more stable, higher-margin parts and service revenue. This revenue stream is less sensitive to commodity prices and in some instances is countercyclical as equipment owners will keep their equipment longer in less buoyant economic times and as a result, require more parts and service on the older equipment.
Global economic conditions remain good. Demand for energy and the key mineral commodities remains strong and supply increases appear to be modest. As a result, commodity prices are expected to remain firm for the near future and the outlook for Finning’s business in western Canada and South America is expected to continue to be very good.
Finning (Canada)’s resource based customers are prospering. General construction spending is at very high levels and government spending on infrastructure projects is increasing. Finning (Canada)’s positive outlook is reflected in the record level of sales and earnings and the strong order backlog.
Similarly, in South America the strong commodity markets, in particular strong copper prices, are also leading to very good financial results by the Company’s customers in this region. Capital spending by mining customers continues at a strong pace, and general construction markets are also strong. In Argentina, the economy is experiencing inflationary pressure on wage rates, however to date, the Company has experienced minimal impact on its results by adjusting its salary structure and passing on price increases to its customers.
Business conditions in the U.K. continue to be somewhat uncertain. After a weaker 2005, expectations are for a modest improvement in 2006. A recent interest rate cut has modestly stimulated housing markets and this is expected to have a beneficial impact on construction activity, which will impact operations at Finning (UK) and Hewden. Currently, construction activity continues at moderate levels.
Hewden continues to review its structure and implement changes in order to improve customer service and profitability as well as simplify the organizational structure. However, competitive pressures continue to impact the Company’s operations in the U.K. A realignment of certain back office functions at Hewden and the implementation of a new information system that will enhance the quality of its customer services and reduce transaction costs are underway as is a revised plan to create strategically located rental centres surrounded by smaller satellite rental stores.
In the UK dealership operations, management together with Caterpillar have agreed on an extensive project to increase the dealership’s profitability while increasing Caterpillar’s market share in the U.K. Finning (UK) will expand its service offering for small and compact machines in the U.K. market and Caterpillar has agreed to product line changes and pricing changes that will make its product line better suited for U.K. markets and more price competitive with U.K. competitors.
Finning (UK) has delayed the systems integration of the Lex Harvey business and as a result, the Materials Handling business continues to experience inefficiencies. Information technology alternatives are under consideration and the Company is examining potential improvements in its service delivery. Discussions continue with the supplier of the materials handling equipment to negotiate more competitive pricing. Finning (UK) management is focusing on improving margins in all areas, achieving efficiencies and controlling costs.
The company-wide plan to reduce costs by $60 million by the end of 2006 is on track and the Company expects to have its cost savings fully in place by January 1, 2007. To date, the Company has completed projects that will generate over $37 million of annual savings.
The Company’s results are impacted by the stronger Canadian dollar compared to the U.S. dollar and the U.K. pound sterling in the translation of foreign currency earnings. The Company anticipates that its 2006 results will be negatively impacted as a result of translating foreign currency based earnings should the strength of the Canadian dollar continue against the U.S. dollar and the U.K. pound sterling.
The Company’s order backlog is at record levels and the Company’s key customers are for the most part, very profitable and growing. The current economic environment, commodity pricing and launched and pending cost efficiency initiatives, taken together, provide a positive outlook for the Company’s medium to long-term growth opportunities.
February 15, 2006
mANAGEmENT’S dISCUSSIoN & ANALySIS
FIN
NIN
G IN
TER
NAT
ION
AL
INC
.
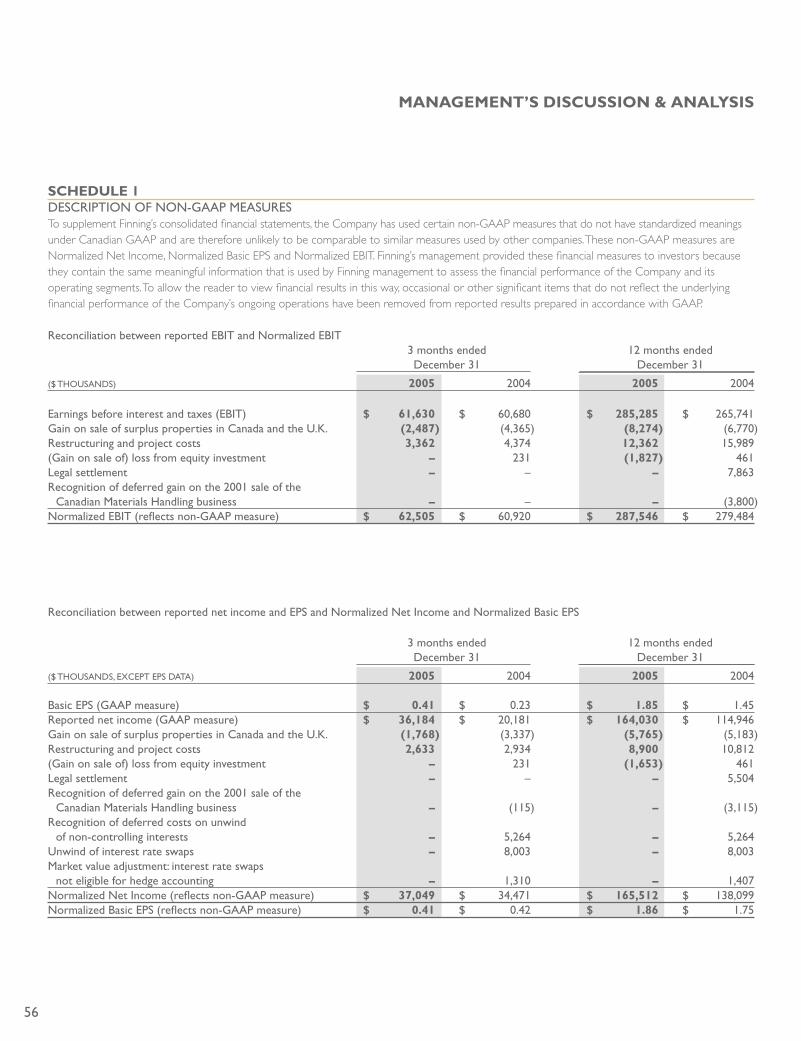
56
SCHEdULE 1DESCRIPTION OF NON-GAAP MEASURESTo supplement Finning’s consolidated financial statements, the Company has used certain non-GAAP measures that do not have standardized meanings under Canadian GAAP and are therefore unlikely to be comparable to similar measures used by other companies. These non-GAAP measures are Normalized Net Income, Normalized Basic EPS and Normalized EBIT. Finning’s management provided these financial measures to investors because they contain the same meaningful information that is used by Finning management to assess the financial performance of the Company and its operating segments. To allow the reader to view financial results in this way, occasional or other significant items that do not reflect the underlying financial performance of the Company’s ongoing operations have been removed from reported results prepared in accordance with GAAP.
Reconciliation between reported E�IT and Normalized E�IT 3 months ended 12 months ended December 31 December 31
($ THOUSANDS) 2005 2004 2005 2004
Earnings before interest and taxes (E�IT) $ 61,630 $ 60,680 $ 285,285 $ 265,741Gain on sale of surplus properties in Canada and the U.K. (2,487) (4,365) (8,274) (6,770)Restructuring and project costs 3,362 4,374 12,362 15,989(Gain on sale of) loss from equity investment – 231 (1,827) 461Legal settlement – – – 7,863Recognition of deferred gain on the 2001 sale of the Canadian Materials Handling business – – – (3,800)Normalized E�IT (reflects non-GAAP measure) $ 62,505 $ 60,920 $ 287,546 $ 279,484
Reconciliation between reported net income and EPS and Normalized Net Income and Normalized �asic EPS
3 months ended 12 months ended December 31 December 31
($ THOUSANDS, EXCEPT EPS DATA) 2005 2004 2005 2004
�asic EPS (GAAP measure) $ 0.41 $ 0.23 $ 1.85 $ 1.45Reported net income (GAAP measure) $ 36,184 $ 20,181 $ 164,030 $ 114,946Gain on sale of surplus properties in Canada and the U.K. (1,768) (3,337) (5,765) (5,183)Restructuring and project costs 2,633 2,934 8,900 10,812(Gain on sale of) loss from equity investment – 231 (1,653) 461Legal settlement – – – 5,504Recognition of deferred gain on the 2001 sale of the Canadian Materials Handling business – (115) – (3,115)Recognition of deferred costs on unwind of non-controlling interests – 5,264 – 5,264Unwind of interest rate swaps – 8,003 – 8,003Market value adjustment: interest rate swaps not eligible for hedge accounting – 1,310 – 1,407Normalized Net Income (reflects non-GAAP measure) $ 37,049 $ 34,471 $ 165,512 $ 138,099Normalized �asic EPS (reflects non-GAAP measure) $ 0.41 $ 0.42 $ 1.86 $ 1.75
mANAGEmENT’S dISCUSSIoN & ANALySIS
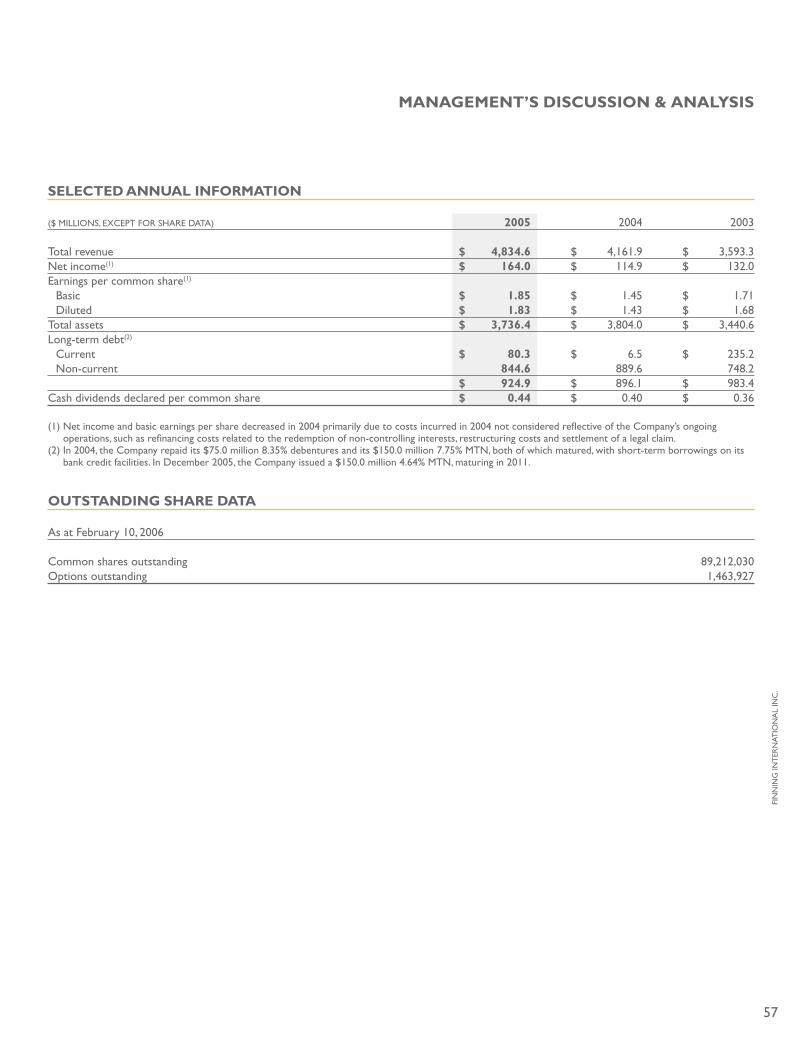
57
SELECTEd ANNUAL INFormATIoN
($ MILLIONS, EXCEPT FOR SHARE DATA) 2005 2004 2003
Total revenue $ 4,834.6 $ 4,161.9 $ 3,593.3Net income(1) $ 164.0 $ 114.9 $ 132.0Earnings per common share(1)
�asic $ 1.85 $ 1.45 $ 1.71 Diluted $ 1.83 $ 1.43 $ 1.68Total assets $ 3,736.4 $ 3,804.0 $ 3,440.6Long-term debt(2)
Current $ 80.3 $ 6.5 $ 235.2 Non-current 844.6 889.6 748.2 $ 924.9 $ 896.1 $ 983.4Cash dividends declared per common share $ 0.44 $ 0.40 $ 0.36
(1) Net income and basic earnings per share decreased in 2004 primarily due to costs incurred in 2004 not considered reflective of the Company’s ongoing operations, such as refinancing costs related to the redemption of non-controlling interests, restructuring costs and settlement of a legal claim.
(2) In 2004, the Company repaid its $75.0 million 8.35% debentures and its $150.0 million 7.75% MTN, both of which matured, with short-term borrowings on its bank credit facilities. In December 2005, the Company issued a $150.0 million 4.64% MTN, maturing in 2011.
oUTSTANdING SHArE dATA
As at February 10, 2006
Common shares outstanding 89,212,030Options outstanding 1,463,927
mANAGEmENT’S dISCUSSIoN & ANALySIS
FIN
NIN
G IN
TER
NAT
ION
AL
INC
.
58
The accompanying Consolidated Financial Statements and Management’s Discussion and Analysis (MD&A) are the responsibility of Finning International Inc.’s management. The Consolidated Financial Statements have been prepared in accordance with accounting principles generally accepted in Canada which recognize the necessity of relying on some of management’s best estimates and informed judgements. Financial information included elsewhere in this Annual Report is consistent with that in the financial statements.
The Company maintains an accounting system and related controls to provide management with reasonable assurance that transactions are executed and recorded in accordance with its authorizations, that assets are properly safeguarded and accounted for, and that financial records are reliable for preparation of financial statements.
The Company’s independent auditors, Deloitte & Touche LLP, have audited the Consolidated Financial Statements, as reflected in their report for 2005.
The Board of Directors oversees management’s responsibilities for the Consolidated Financial Statements primarily through the activities of its Audit Committee. The Audit Committee of the Board of Directors is composed solely of directors who are neither officers nor employees of the Company. The Committee meets regularly during the year with management of the Company and the Company’s independent auditors to review the Company’s interim and annual financial statements and MD&A. The Audit Committee also reviews internal accounting controls, risk management, internal and external audit results and accounting principles and practices. The Audit Committee is responsible for approving the remuneration and terms of engagement of the Company’s independent auditors. The Audit Committee also meets with the independent auditors, without management present, to discuss the results of their audit and the quality of financial reporting. On a quarterly basis, the Audit Committee reports its findings to the Board of Directors, and recommends approval of the interim and annual Consolidated Financial Statements.
The Consolidated Financial Statements and MD&A have, in management’s opinion, been properly prepared within reasonable limits of materiality and within the framework of the accounting policies summarized in Note 1 of the Notes to the Consolidated Financial Statements.
D.W.G. WhiteheadPresident and Chief Executive Officer
February 15, 2006Vancouver, BC, Canada
mANAGEmENT’S rEPorT To THE SHArEHoLdErS
59
To THE SHArEHoLdErS oF FINNING INTErNATIoNAL INC.:
We have audited the consolidated balance sheets of Finning International Inc. (a Canadian corporation) as at December 31, 2005 and 2004 and the consolidated statements of income, retained earnings and cash flow for each of the years in the two year period ended December 31, 2005. These Consolidated Financial Statements are the responsibility of the Company’s management. Our responsibility is to express an opinion on these Consolidated Financial Statements based on our audits.
We conducted our audits in accordance with Canadian generally accepted auditing standards. Those standards require that we plan and perform an audit to obtain reasonable assurance whether the Consolidated Financial Statements are free of material misstatement. An audit includes examining, on a test basis, evidence supporting the amounts and disclosures in the Consolidated Financial Statements. An audit also includes assessing the accounting principles used and significant estimates made by management, as well as evaluating the overall Consolidated Financial Statement presentation.
In our opinion, these Consolidated Financial Statements present fairly, in all material respects, the financial position of the Company as at December 31, 2005 and 2004, and the results of its operations and its cash flow for each of the years in the two year period ended December 31, 2005 in accordance with Canadian generally accepted accounting principles.
DELOITTE & TOUCHE LLP, Chartered AccountantsFebruary 15, 2006Vancouver, BC, Canada
AUdITorS’ rEPorT
FIN
NIN
G IN
TER
NAT
ION
AL
INC
.

60
For the years ended December 31 ($ THOUSANDS, EXCEPT SHARE AND PER SHARE AMOUNTS) 2005 2004
Revenue New mobile equipment $ 1,625,669 $ 1,218,432 New power and energy systems 359,002 273,456 Used equipment 430,840 391,239 Equipment rental 1,001,124 1,009,760 Customer support services 1,409,854 1,237,046 Finance, operating leases and other 8,089 31,974 Total revenue 4,834,578 4,161,907
Cost of sales 3,443,455 2,918,160Gross profit 1,391,123 1,243,747
Selling, general and administrative expenses 1,103,577 964,263
Other expenses (Note 2) 2,261 13,743Earnings before interest, taxes and non-controlling interests 285,285 265,741
Finance costs (Notes 3 and 4) 76,863 118,100Income before provision for income taxes and non-controlling interests 208,422 147,641
Provision for income taxes (Note 5) 44,392 17,546
Non-controlling interests (Note 6) – 15,149Net income $ 164,030 $ 114,946
Retained earnings, beginning of year $ 850,321 $ 775,113Net income 164,030 114,946Dividends on common shares (39,097) (31,181)Premium on repurchase of common shares (Note 7) – (8,557)Retained earnings, end of year $ 975,254 $ 850,321
Earnings per share (Note 9) �asic $ 1.85 $ 1.45 Diluted $ 1.83 $ 1.43
Weighted average number of shares outstanding 88,851,343 79,018,683
CoNSoLIdATEd STATEmENTS oF INComE ANd rETAINEd EArNINGS
The accompanying Notes to the Consolidated Financial Statements are an integral part of these statements.
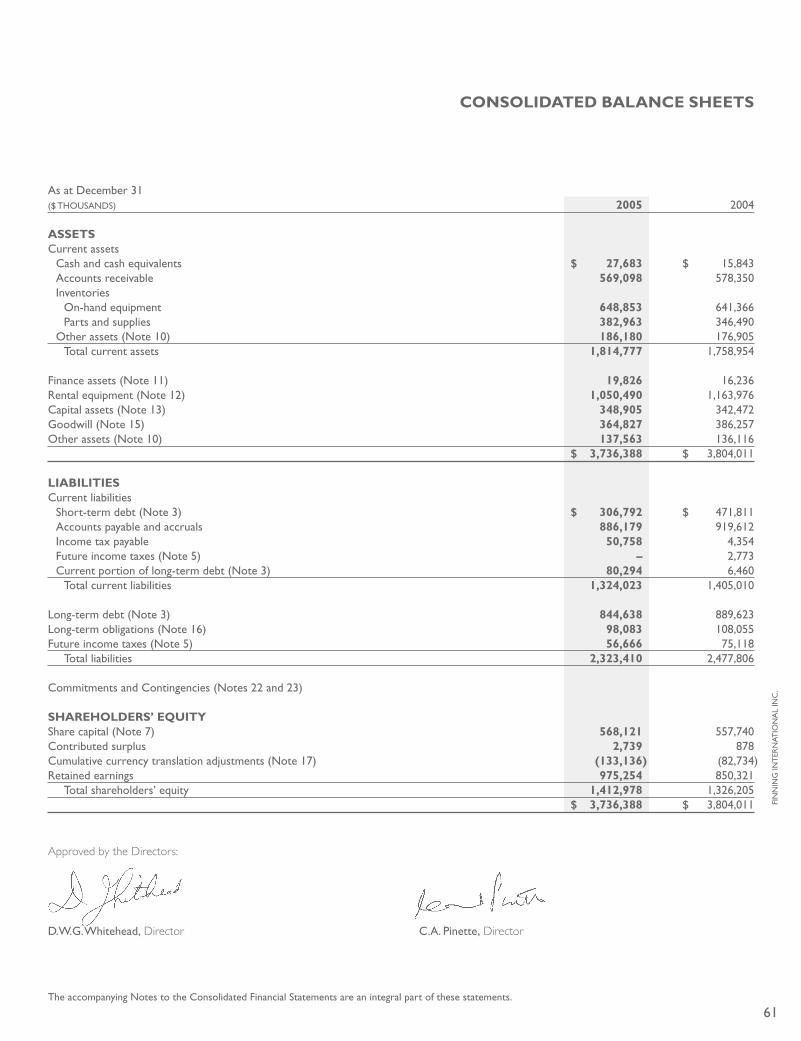
61
As at December 31 ($ THOUSANDS) 2005 2004
ASSETSCurrent assets Cash and cash equivalents $ 27,683 $ 15,843 Accounts receivable 569,098 578,350 Inventories On-hand equipment 648,853 641,366 Parts and supplies 382,963 346,490 Other assets (Note 10) 186,180 176,905 Total current assets 1,814,777 1,758,954
Finance assets (Note 11) 19,826 16,236Rental equipment (Note 12) 1,050,490 1,163,976Capital assets (Note 13) 348,905 342,472Goodwill (Note 15) 364,827 386,257Other assets (Note 10) 137,563 136,116 $ 3,736,388 $ 3,804,011
LIAbILITIESCurrent liabilities Short-term debt (Note 3) $ 306,792 $ 471,811 Accounts payable and accruals 886,179 919,612 Income tax payable 50,758 4,354 Future income taxes (Note 5) – 2,773 Current portion of long-term debt (Note 3) 80,294 6,460 Total current liabilities 1,324,023 1,405,010
Long-term debt (Note 3) 844,638 889,623Long-term obligations (Note 16) 98,083 108,055Future income taxes (Note 5) 56,666 75,118 Total liabilities 2,323,410 2,477,806
Commitments and Contingencies (Notes 22 and 23)
SHArEHoLdErS’ EqUITyShare capital (Note 7) 568,121 557,740Contributed surplus 2,739 878Cumulative currency translation adjustments (Note 17) (133,136) (82,734)Retained earnings 975,254 850,321 Total shareholders’ equity 1,412,978 1,326,205 $ 3,736,388 $ 3,804,011
Approved by the Directors:
D.W.G. Whitehead, Director C.A. Pinette, Director
CoNSoLIdATEd bALANCE SHEETS
The accompanying Notes to the Consolidated Financial Statements are an integral part of these statements.
FIN
NIN
G IN
TER
NAT
ION
AL
INC
.
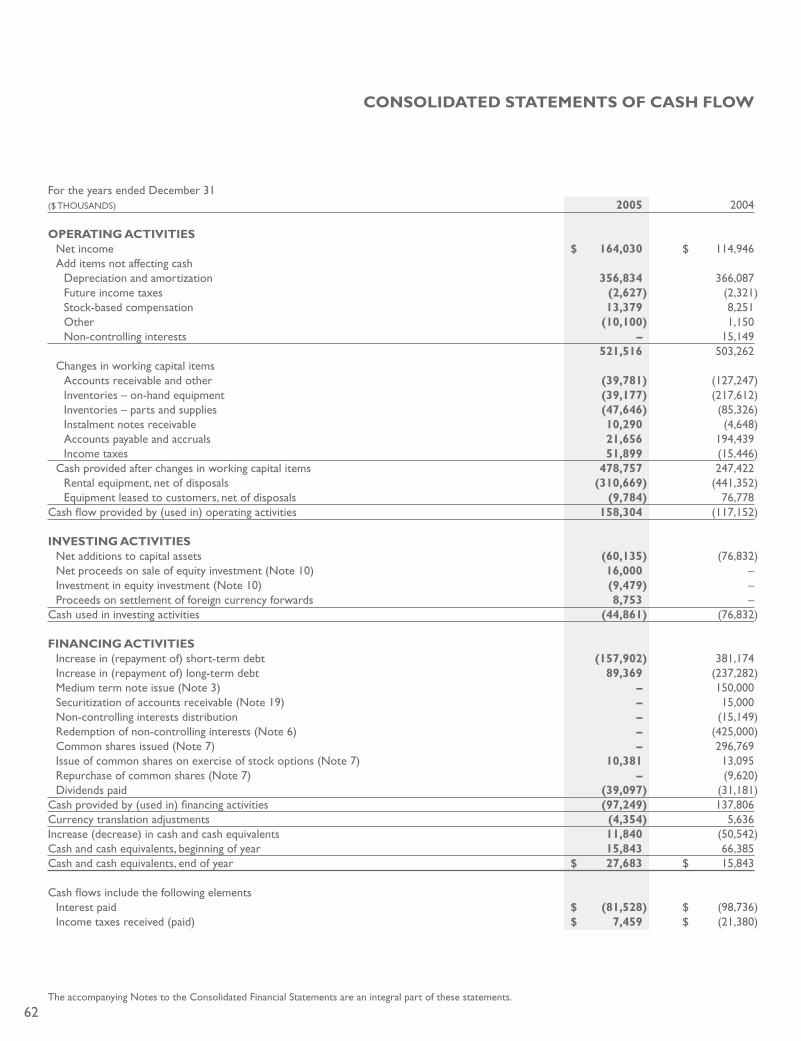
62
For the years ended December 31 ($ THOUSANDS) 2005 2004
oPErATING ACTIVITIES Net income $ 164,030 $ 114,946 Add items not affecting cash Depreciation and amortization 356,834 366,087 Future income taxes (2,627) (2,321) Stock-based compensation 13,379 8,251 Other (10,100) 1,150 Non-controlling interests – 15,149 521,516 503,262 Changes in working capital items Accounts receivable and other (39,781) (127,247) Inventories – on-hand equipment (39,177) (217,612) Inventories – parts and supplies (47,646) (85,326) Instalment notes receivable 10,290 (4,648) Accounts payable and accruals 21,656 194,439 Income taxes 51,899 (15,446) Cash provided after changes in working capital items 478,757 247,422 Rental equipment, net of disposals (310,669) (441,352) Equipment leased to customers, net of disposals (9,784) 76,778Cash flow provided by (used in) operating activities 158,304 (117,152)
INVESTING ACTIVITIES Net additions to capital assets (60,135) (76,832) Net proceeds on sale of equity investment (Note 10) 16,000 – Investment in equity investment (Note 10) (9,479) – Proceeds on settlement of foreign currency forwards 8,753 –Cash used in investing activities (44,861) (76,832)
FINANCING ACTIVITIES Increase in (repayment of) short-term debt (157,902) 381,174 Increase in (repayment of) long-term debt 89,369 (237,282) Medium term note issue (Note 3) – 150,000 Securitization of accounts receivable (Note 19) – 15,000 Non-controlling interests distribution – (15,149) Redemption of non-controlling interests (Note 6) – (425,000) Common shares issued (Note 7) – 296,769 Issue of common shares on exercise of stock options (Note 7) 10,381 13,095 Repurchase of common shares (Note 7) – (9,620) Dividends paid (39,097) (31,181)Cash provided by (used in) financing activities (97,249) 137,806Currency translation adjustments (4,354) 5,636Increase (decrease) in cash and cash equivalents 11,840 (50,542)Cash and cash equivalents, beginning of year 15,843 66,385Cash and cash equivalents, end of year $ 27,683 $ 15,843
Cash flows include the following elements Interest paid $ (81,528) $ (98,736) Income taxes received (paid) $ 7,459 $ (21,380)
The accompanying Notes to the Consolidated Financial Statements are an integral part of these statements.
CoNSoLIdATEd STATEmENTS oF CASH FLow
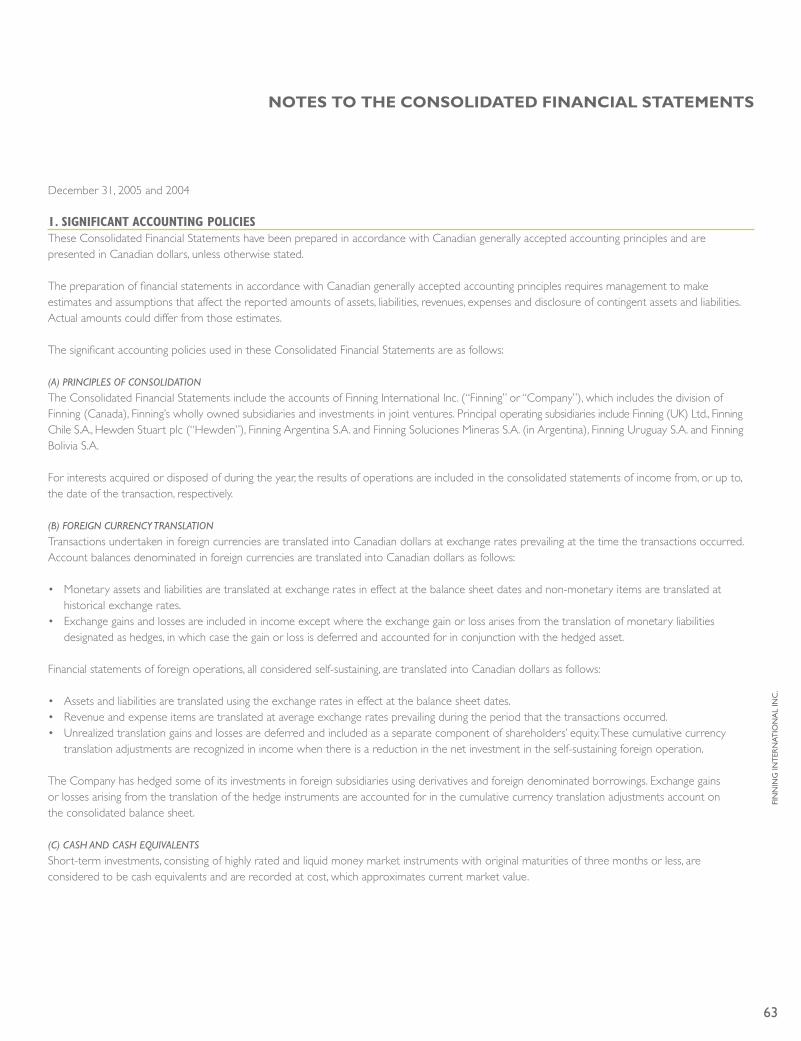
63
December 31, 2005 and 2004
1. signifiCant aCCOunting pOliCiesThese Consolidated Financial Statements have been prepared in accordance with Canadian generally accepted accounting principles and are presented in Canadian dollars, unless otherwise stated.
The preparation of financial statements in accordance with Canadian generally accepted accounting principles requires management to make estimates and assumptions that affect the reported amounts of assets, liabilities, revenues, expenses and disclosure of contingent assets and liabilities. Actual amounts could differ from those estimates.
The significant accounting policies used in these Consolidated Financial Statements are as follows:
(a) PrinciPles of consolidation
The Consolidated Financial Statements include the accounts of Finning International Inc. (“Finning” or “Company”), which includes the division of Finning (Canada), Finning’s wholly owned subsidiaries and investments in joint ventures. Principal operating subsidiaries include Finning (UK) Ltd., Finning Chile S.A., Hewden Stuart plc (“Hewden”), Finning Argentina S.A. and Finning Soluciones Mineras S.A. (in Argentina), Finning Uruguay S.A. and Finning Bolivia S.A.
For interests acquired or disposed of during the year, the results of operations are included in the consolidated statements of income from, or up to, the date of the transaction, respectively.
(b) foreign currency translation
Transactions undertaken in foreign currencies are translated into Canadian dollars at exchange rates prevailing at the time the transactions occurred. Account balances denominated in foreign currencies are translated into Canadian dollars as follows:
• Monetary assets and liabilities are translated at exchange rates in effect at the balance sheet dates and non-monetary items are translated at historical exchange rates.
• Exchange gains and losses are included in income except where the exchange gain or loss arises from the translation of monetary liabilities designated as hedges, in which case the gain or loss is deferred and accounted for in conjunction with the hedged asset.
Financial statements of foreign operations, all considered self-sustaining, are translated into Canadian dollars as follows:
• Assets and liabilities are translated using the exchange rates in effect at the balance sheet dates.• Revenue and expense items are translated at average exchange rates prevailing during the period that the transactions occurred.• Unrealized translation gains and losses are deferred and included as a separate component of shareholders’ equity. These cumulative currency
translation adjustments are recognized in income when there is a reduction in the net investment in the self-sustaining foreign operation.
The Company has hedged some of its investments in foreign subsidiaries using derivatives and foreign denominated borrowings. Exchange gains or losses arising from the translation of the hedge instruments are accounted for in the cumulative currency translation adjustments account on the consolidated balance sheet.
(c) cash and cash equivalents
Short-term investments, consisting of highly rated and liquid money market instruments with original maturities of three months or less, are considered to be cash equivalents and are recorded at cost, which approximates current market value.
NoTES To THE CoNSoLIdATEd FINANCIAL STATEmENTS
FIN
NIN
G IN
TER
NAT
ION
AL
INC
.
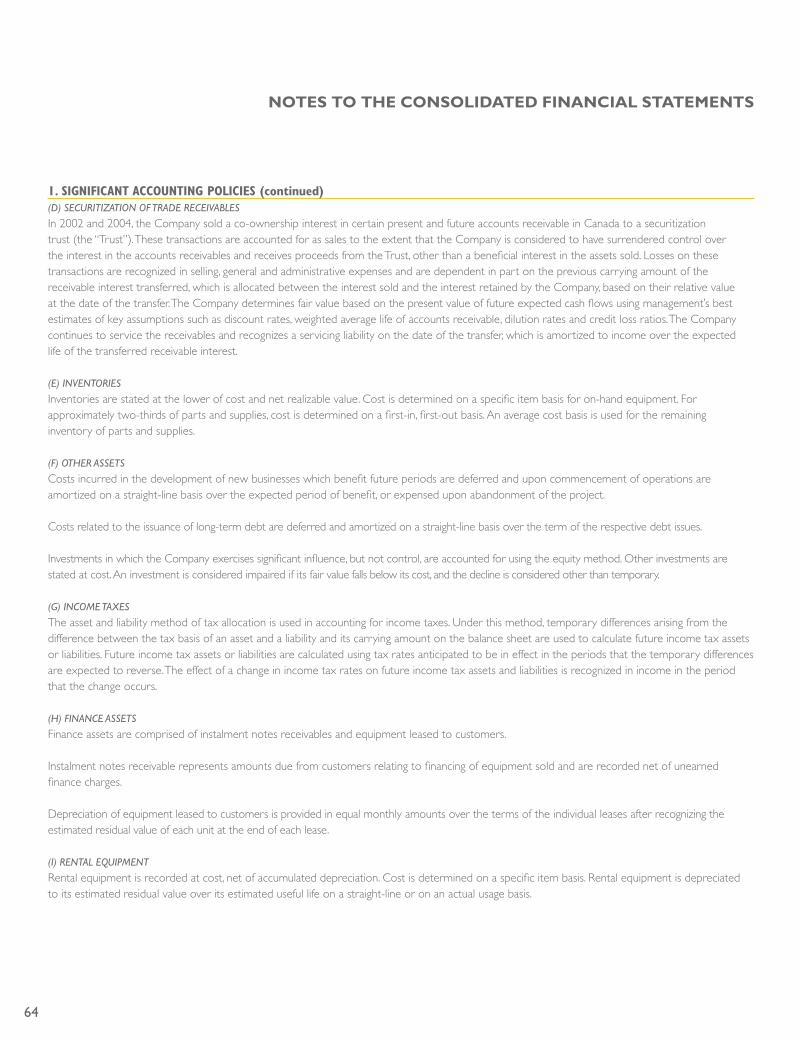
64
1. signifiCant aCCOunting pOliCies (continued)(d) securitization of trade receivables
In 2002 and 2004, the Company sold a co-ownership interest in certain present and future accounts receivable in Canada to a securitization trust (the “Trust”). These transactions are accounted for as sales to the extent that the Company is considered to have surrendered control over the interest in the accounts receivables and receives proceeds from the Trust, other than a beneficial interest in the assets sold. Losses on these transactions are recognized in selling, general and administrative expenses and are dependent in part on the previous carrying amount of the receivable interest transferred, which is allocated between the interest sold and the interest retained by the Company, based on their relative value at the date of the transfer. The Company determines fair value based on the present value of future expected cash flows using management’s best estimates of key assumptions such as discount rates, weighted average life of accounts receivable, dilution rates and credit loss ratios. The Company continues to service the receivables and recognizes a servicing liability on the date of the transfer, which is amortized to income over the expected life of the transferred receivable interest.
(e) inventories
Inventories are stated at the lower of cost and net realizable value. Cost is determined on a specific item basis for on-hand equipment. For approximately two-thirds of parts and supplies, cost is determined on a first-in, first-out basis. An average cost basis is used for the remaining inventory of parts and supplies.
(f) other assets
Costs incurred in the development of new businesses which benefit future periods are deferred and upon commencement of operations are amortized on a straight-line basis over the expected period of benefit, or expensed upon abandonment of the project.
Costs related to the issuance of long-term debt are deferred and amortized on a straight-line basis over the term of the respective debt issues.
Investments in which the Company exercises significant influence, but not control, are accounted for using the equity method. Other investments are stated at cost. An investment is considered impaired if its fair value falls below its cost, and the decline is considered other than temporary.
(g) income taxes
The asset and liability method of tax allocation is used in accounting for income taxes. Under this method, temporary differences arising from the difference between the tax basis of an asset and a liability and its carrying amount on the balance sheet are used to calculate future income tax assets or liabilities. Future income tax assets or liabilities are calculated using tax rates anticipated to be in effect in the periods that the temporary differences are expected to reverse. The effect of a change in income tax rates on future income tax assets and liabilities is recognized in income in the period that the change occurs.
(h) finance assets
Finance assets are comprised of instalment notes receivables and equipment leased to customers.
Instalment notes receivable represents amounts due from customers relating to financing of equipment sold and are recorded net of unearned finance charges.
Depreciation of equipment leased to customers is provided in equal monthly amounts over the terms of the individual leases after recognizing the estimated residual value of each unit at the end of each lease.
(i) rental equiPment
Rental equipment is recorded at cost, net of accumulated depreciation. Cost is determined on a specific item basis. Rental equipment is depreciated to its estimated residual value over its estimated useful life on a straight-line or on an actual usage basis.
NoTES To THE CoNSoLIdATEd FINANCIAL STATEmENTS

65
(j) caPital assets
Land, buildings and equipment are recorded at cost, net of accumulated depreciation.
Buildings and equipment are depreciated over their estimated useful lives on either a declining balance or straight-line basis using the following annual rates:
�uildings 2% - 5% General equipment 10% - 33% Automotive equipment 20% - 33%
Intangible assets with indefinite lives are not amortized. Intangible assets with finite lives are amortized on a straight-line basis over their estimated useful lives to a maximum period of ten years.
(k) goodwill
Goodwill represents the excess cost of an investment over the fair value of the net assets acquired and is not amortized.
(l) asset imPairment
The Company reviews both long-lived assets to be held and used and identifiable intangible assets with finite lives whenever events or changes in circumstances indicate that the carrying amount of such assets may not be fully recoverable. Determination of recoverability is based on an estimate of undiscounted future cash flows resulting from the use of the asset and its eventual disposition. Measurement of an impairment loss for long-lived assets and certain identifiable intangible assets that management expects to hold and use is based on the fair value of the assets, whereas assets to be disposed of are reported at the lower of carrying amount or fair value less estimated selling costs. During 2005, the Company recognized asset impairment charges as described in Note 13. As at December 31, 2005, the Company determined that there were no other triggering events requiring an impairment analysis.
Goodwill and intangible assets with indefinite lives are subject to an annual assessment for impairment primarily by applying a fair value-based test at the reporting unit level. The fair value is estimated using the present value of expected discounted future cash flows. The Company also considers projected future operating results, trends and other circumstances in making such evaluations. An impairment loss would be recognized to the extent the carrying amount of goodwill exceeds the fair value of goodwill.
(m) leases
Leases entered into are classified as either capital or operating leases. Leases where all of the benefits and risks of ownership of property rest with the Company are accounted for as capital leases. Equipment under capital lease is depreciated on the same basis as capital assets. Gains or losses resulting from sale/leaseback transactions are deferred and amortized in proportion to the amortization of the leased asset. Rental payments under operating leases are expensed as incurred.
(n) asset retirement obligations
The Company recognizes its obligations to account for the retirement of certain tangible long-lived assets. The fair value of a liability for an asset retirement obligation is recognized in the period in which it is incurred if a reasonable estimate of fair value can be made. The associated asset retirement costs are capitalized as part of the carrying amount of the long-lived asset and then amortized over its estimated useful life. In subsequent periods, the asset retirement obligation is adjusted for the passage of time and any changes in the amount or timing of the underlying future cash flows through charges to earnings. A gain or loss may be incurred upon settlement of the liability.
NoTES To THE CoNSoLIdATEd FINANCIAL STATEmENTS
FIN
NIN
G IN
TER
NAT
ION
AL
INC
.

66
1. signifiCant aCCOunting pOliCies (continued)(o) revenue recognition
Revenue recognition, with the exception of cash sales, includes obtaining a written arrangement in the form of a contract or purchase order with the customer. A fixed or determinable sales price is established with the customer whereby ultimate collection of the revenue is reasonably assured. Revenue is recognized as performance requirements are achieved in accordance with the following:
• Revenue from sales of equipment is recognized at the time title to the equipment and significant risks of ownership passes to the customer, which is generally at the time of shipment of the product to the customer;
• Revenue from power and energy systems includes construction contracts with customers that involve the design, installation and assembly of power and energy equipment systems. Revenue is recognized on a percentage of completion basis proportionate to the work that has been completed which is based on associated costs incurred;
• Revenue from equipment rentals and operating leases is recognized in accordance with the terms of the relevant agreement with the customer, either evenly over the term of that agreement or on a usage basis such as the number of hours that the equipment is used; and
• Revenue from customer support services includes sales of parts and servicing of equipment. For sales of parts, revenue is recognized when the part is shipped to the customer or when the part is installed in the customer’s equipment. For servicing of equipment, revenue is recognized as the service work is performed. Customer support services are also offered to customers in the form of long-term maintenance and repair contracts. For these contracts, revenue is recognized on a percentage of completion basis proportionate to the service work that has been performed based on the parts and labour service provided. Parts revenue is recognized based on parts list price and service revenue is recognized based on standard billing labour rates. At the completion of the contract, any remaining deferred revenue on the contract is recognized as revenue. Any losses estimated during the term of the contract are recognized when identified. For the materials handling business, revenue from long-term maintenance and repair contracts is recognized on a straight-line basis over the life of the contract.
(P) stock-based comPensation
The Company has stock option plans and other stock-based compensation plans for directors and certain eligible employees which are described in Note 8. Stock-based awards are measured and recognized using a fair value-based method of accounting.
For stock options granted after January 1, 2003, fair value is determined on the grant date of the stock option and recorded as compensation expense over the vesting period, with a corresponding increase to contributed surplus. For stock options granted prior to January 1, 2003, the Company recorded no compensation expense and will continue to use the intrinsic value-based method of accounting for stock options. When stock options are exercised, the proceeds received by the Company, together with the amount recorded in contributed surplus, are credited to share capital.
Compensation expense, which arises from fluctuations in the market price of the Company’s common shares underlying other stock-based compensation plans, is recorded in selling, general and administrative expenses in the consolidated statement of income with a corresponding accrual in long-term obligations or accounts payable and accruals on the consolidated balance sheet.
(q) derivative financial instruments
The Company utilizes derivative financial instruments in the management of its foreign currency and interest rate exposures. The Company uses financial instruments such as interest rate swaps, cross-currency swaps, forward foreign exchange contracts and options as hedges against actual underlying exposures. These instruments are always associated with a related risk position and are not used for trading or speculative purposes. The Company’s policy is to utilize derivative financial instruments for hedging purposes only.
The Company formally documents all relationships between hedging instruments and hedged items, as well as its risk management objective and strategy for undertaking various hedge transactions. This process includes linking all derivatives to specific assets and liabilities on the balance sheet or to specific firm commitments or forecasted transactions. The Company also formally assesses, both at the hedge’s inception and on an ongoing basis, whether the derivatives that are used in hedging transactions are effective in offsetting changes in fair values or cash flows of hedged items. When derivative instruments have been designated as a hedge and are highly effective in offsetting the identified risk characteristics of the specified hedge exposure, hedge accounting is applied to these derivative instruments. Hedge accounting requires that gains, losses, revenue and expenses of a hedging item be recognized in the same period that the associated gains, losses, revenue and expenses of the hedged item are recognized. Realized and unrealized gains or losses associated with derivative instruments, which have been terminated for hedge accounting purposes or cease to be effective prior to maturity, are deferred in current liabilities on the balance sheet and recognized in income in the period in which the underlying hedged
NoTES To THE CoNSoLIdATEd FINANCIAL STATEmENTS
67
transaction is recognized. In the event a designated hedged item is sold, extinguished or matures prior to the termination of the related derivative instrument, any realized or unrealized gain or loss on such derivative instrument is recognized in income.
ForeIgn exchange
The Company hedges the foreign currency exposure on its net investment in foreign self-sustaining operations by entering into offsetting forward exchange contracts and cross-currency swap contracts, when it is deemed appropriate. Foreign exchange translation gains and losses on derivative financial instruments used to hedge foreign net investments are recorded as assets or liabilities, as appropriate, and recognized in the cumulative currency translation account on the balance sheet, offsetting the respective translation gains and losses recognized on the underlying foreign net investments. The forward premium or discount on forward foreign exchange contracts is amortized as an adjustment of interest expense over the term of the forward contract.
The Company also enters into foreign exchange contracts to hedge purchase commitments and accounts payable denominated in foreign currencies. Foreign exchange translation gains and losses on forward contracts used to hedge purchase commitments are recognized as an adjustment of the purchase cost when the purchase is recorded.
Interest rates
The Company enters into interest rate swaps to manage the fixed and floating interest rate exposures in its debt portfolio. The Company designates its interest rate swap agreements as hedges of the underlying debt or cash flows. Interest expense on the debt is adjusted to include the payments made or received under the interest rate swaps. As a result, hedge accounting treatment for interest rate swaps results in interest expense on the related debt being reflected at hedged rates rather than the original contractual interest rates.
(r) emPloyee future benefits
The Company and its subsidiaries offer a number of benefit plans that provide pension and other benefits to many of its employees in the Canadian and the UK operations. These plans include defined benefit and defined contribution plans.
The Company’s South American employees do not participate in employer pension plans but are covered by country specific legislation with respect to indemnity plans. The Company accrues its obligations to employees under these indemnity plans based on the actuarial valuation of anticipated payments to employees.
The Company accrues its obligations under employee benefit plans and the related costs, net of plan assets.
Defined benefit plans: For the purpose of calculating the expected return on plan assets, those assets are valued at market value. The cost of pensions and other retirement benefits is determined by independent actuaries using the projected benefit method prorated on service and management’s best estimates of expected plan investment performance and salary escalation rate.
Past service costs from plan amendments are deferred and amortized on a straight-line basis over the expected average remaining service life of employees active at the date of amendment.
Actuarial gains and losses arise from the difference between the actual and expected long-term rate of return on plan assets for a period, or from changes in actuarial assumptions used to determine the accrued benefit obligation. The excess of the net accumulated actuarial gains or losses over 10% of the greater of the benefit obligation and the market value of the plan assets is amortized on a straight-line basis over the expected average remaining service life of the active employees covered by the plans.
On January 1, 2000, the Company adopted the new Canadian Institute of Chartered Accountants accounting standard on employee future benefits using the prospective application method. The Company is amortizing the transitional obligation on a straight-line basis over 13 years in Canada and Hewden plans and over 14 years in the Finning (UK) plan, which was the average remaining service period of employees expected to receive benefits under the benefit plan as of January 1, 2000.
Defined contribution plans: The cost of pension benefits includes the current service cost based on a fixed percentage of member earnings for the year.
(s) comParative figures
Certain comparative figures have been reclassified to conform to the 2005 presentation.
NoTES To THE CoNSoLIdATEd FINANCIAL STATEmENTS
FIN
NIN
G IN
TER
NAT
ION
AL
INC
.
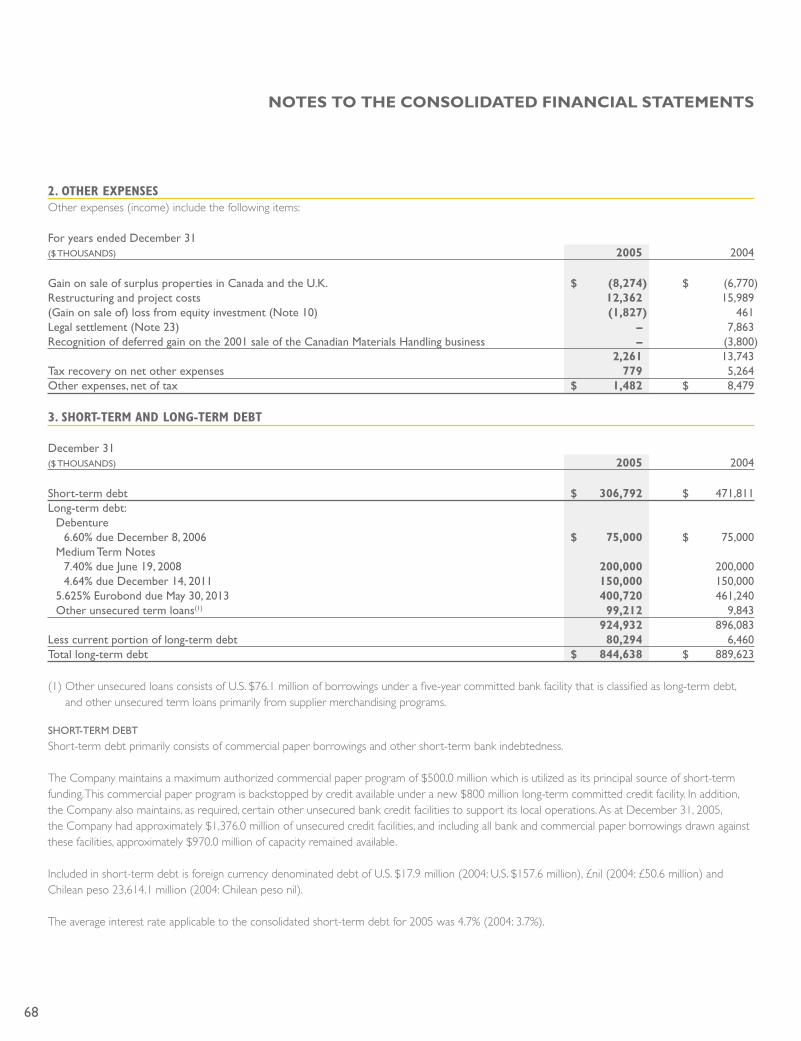
68
2. Other expensesOther expenses (income) include the following items:
For years ended December 31 ($ THOUSANDS) 2005 2004
Gain on sale of surplus properties in Canada and the U.K. $ (8,274) $ (6,770)Restructuring and project costs 12,362 15,989(Gain on sale of) loss from equity investment (Note 10) (1,827) 461Legal settlement (Note 23) – 7,863Recognition of deferred gain on the 2001 sale of the Canadian Materials Handling business – (3,800) 2,261 13,743Tax recovery on net other expenses 779 5,264Other expenses, net of tax $ 1,482 $ 8,479
3. shOrt-term and lOng-term debt
December 31 ($ THOUSANDS) 2005 2004
Short-term debt $ 306,792 $ 471,811Long-term debt: Debenture 6.60% due December 8, 2006 $ 75,000 $ 75,000 Medium Term Notes 7.40% due June 19, 2008 200,000 200,000 4.64% due December 14, 2011 150,000 150,000 5.625% Eurobond due May 30, 2013 400,720 461,240 Other unsecured term loans(1) 99,212 9,843 924,932 896,083Less current portion of long-term debt 80,294 6,460Total long-term debt $ 844,638 $ 889,623
(1) Other unsecured loans consists of U.S. $76.1 million of borrowings under a five-year committed bank facility that is classified as long-term debt, and other unsecured term loans primarily from supplier merchandising programs.
SHORT-TERM DE�T
Short-term debt primarily consists of commercial paper borrowings and other short-term bank indebtedness.
The Company maintains a maximum authorized commercial paper program of $500.0 million which is utilized as its principal source of short-term funding. This commercial paper program is backstopped by credit available under a new $800 million long-term committed credit facility. In addition, the Company also maintains, as required, certain other unsecured bank credit facilities to support its local operations. As at December 31, 2005, the Company had approximately $1,376.0 million of unsecured credit facilities, and including all bank and commercial paper borrowings drawn against these facilities, approximately $970.0 million of capacity remained available.
Included in short-term debt is foreign currency denominated debt of U.S. $17.9 million (2004: U.S. $157.6 million), £nil (2004: £50.6 million) and Chilean peso 23,614.1 million (2004: Chilean peso nil).
The average interest rate applicable to the consolidated short-term debt for 2005 was 4.7% (2004: 3.7%).
NoTES To THE CoNSoLIdATEd FINANCIAL STATEmENTS

69
LONG-TERM DE�T
During the year, the Company entered into an $800 million unsecured syndicated revolving credit facility which replaced all of its Canadian bilateral bank lines. The facility has a five year committed term with a one year extension option. The facility is available in multiple borrowing jurisdictions and may be drawn by a number of the Company’s principal operating subsidiaries. Borrowings under this facility are available in multiple currencies and at various floating rates of interest.
The Company’s Canadian dollar denominated debenture and medium term notes are unsecured, and interest is payable semi-annually with principal due on maturity. The Company’s £200.0 million Eurobond is unsecured, and interest is payable annually with principal due on maturity. The Eurobond is subject to early redemption at the option of the Company.
In December 2004, the Company issued a 7-year $150.0 million unsecured Medium Term Note (MTN). The MTN has a coupon interest rate of 4.64% per annum, paid semi-annually. The MTN was priced at 99.97% of its principal amount to yield 4.645% per annum. Proceeds from the issuance were used to repay existing bank indebtedness.
COVENANTS
The Company is required to maintain a certain debt to capitalization level covenant with respect to its bank credit facilities. As at December 31, 2005, the Company is in compliance with these covenants.
LONG-TERM DE�T REPAYMENTS
Principal repayments on long-term debt in each of the next five years and thereafter are as follows:
($ THOUSANDS)
2006 $ 80,2942007 2,2242008 202,9662009 –2010 88,725Thereafter 550,723 $ 924,932
FINANCE EXPENSE
Finance costs as shown on the consolidated statement of income is comprised of the following elements:
For years ended December 31 ($ THOUSANDS) 2005 2004
Interest on debt securities: Short-term debt $ 27,729 $ 15,519 Long-term debt 51,380 59,846 79,109 75,365Interest on swap contracts (1,099) 16,283Mark to market valuation changes on interest rate swaps not eligible for hedge accounting and the unwind of those interest rate swaps – 14,514Amortization of deferred debt costs, other finance related expenses and sundry interest earned (1,147) 11,938 $ 76,863 $ 118,100
In December 2004, the Company unwound its interest rate swaps that were not eligible for hedge accounting treatment and recorded a settlement loss of $14.5 million.
NoTES To THE CoNSoLIdATEd FINANCIAL STATEmENTS
FIN
NIN
G IN
TER
NAT
ION
AL
INC
.

70
4. finanCial instrumentsFOREIGN EXCHANGE
The Company has an exposure to foreign currency exchange rates primarily because the net assets and earnings of certain investments are denominated in foreign currencies. The Company utilizes perpetual cross-currency swaps and forward contracts to hedge a portion of the foreign exchange exposure relating to these net investments. The Company also uses forward foreign exchange contracts to hedge foreign exchange exposure to certain other liabilities, firm commitments or forecasted transactions.
INTEREST COSTS
The Company monitors its debt portfolio mix of fixed and variable rate instruments and at times, will use forward interest rate agreements, swaps and collars to manage this balance of fixed and floating rate debt. At December 31, 2005 the Company has entered into a fixed to floating interest rate swap, with a notional value of $100.0 million (2004: $100.0 million).
FAIR VALUES
The following fair value information is provided solely to comply with financial instrument disclosure requirements. The Company cautions readers in the interpretation of the impact of these estimated fair values. The fair value of financial instruments is determined by reference to quoted market prices for actual or similar instruments, where available, or by estimates derived using present value or other valuation techniques. The fair value of accounts receivable, notes receivable, short-term debt, accounts payable and accruals approximates their recorded values due to the short-term maturities of these instruments.
The fair values of the derivatives below have been estimated using year-end market information as at December 31, 2005 and 2004. These fair values approximate the amount the Company would receive or pay to terminate the contracts:
Notional Term to Fair Value ($ OR £ THOUSANDS) Value Maturity Receive (Pay)
2005Interest ratesInterest rate swaps (CAD $ pay floating, receive fixed) $ 100,000 2.5 years $ 1,041
Foreign ExchangeCross Currency Interest Rate Swap Sell £ (buy CAD $); pay £ fixed / receive CAD $ fixed(1) £ 150,000 perpetual $ 25,497Forward �uy U.S. $ (sell CAD $) U.S. $ 237,170 1-12 months $ (3,362)Forward �uy CLP (sell U.S. $) U.S. $ 24,000 1-12 months $ 1,739Forward Sell £ (buy CAD $)(2) £ 80,000 perpetual $ 4,147
2004Interest ratesInterest rate swaps (CAD $ pay floating, receive fixed) $ 100,000 3.5 years $ 3,258
Foreign ExchangeCross Currency Interest Rate Swap Sell £, (buy CAD $); pay £ fixed / receive CAD $ fixed £ 228,000 perpetual $ (18,957)Forward �uy U.S. $ (sell CAD $) U.S. $ 173,545 1-12 months $ (5,557)Forward Sell CLP (buy U.S. $) U.S. $ 322 1 month $ (57)Forward �uy Euro (sell £) £ 576 10 months $ 42Forward Sell £ (buy CAD $)(2) £ 95,560 perpetual $ (10,540)
(1) The perpetual cross currency interest rate swaps hedge a portion of the Company’s net investment in Hewden. At December 31, 2005, $27.6 million of the positive fair value, representing the mark-to-spot rate gain on the forward foreign exchange component of the swap, has been recognized on the balance sheet in long-term other assets and offset to cumulative currency translation adjustments (2004: a mark-to-spot rate loss of $27.0 million was recognized on the balance sheet in long-term obligations and offset to cumulative currency translation adjustments).
(2) The forward foreign exchange contract hedges a portion of the Company’s net investment in Finning (UK). At December 31, 2005, $4.4 million of the positive fair value, representing the mark-to-spot rate gain on the contract, has been recognized on the balance sheet in long-term other assets and offset to cumulative currency translation adjustments (2004: $11.0 million was recorded in current liabilities).
NoTES To THE CoNSoLIdATEd FINANCIAL STATEmENTS
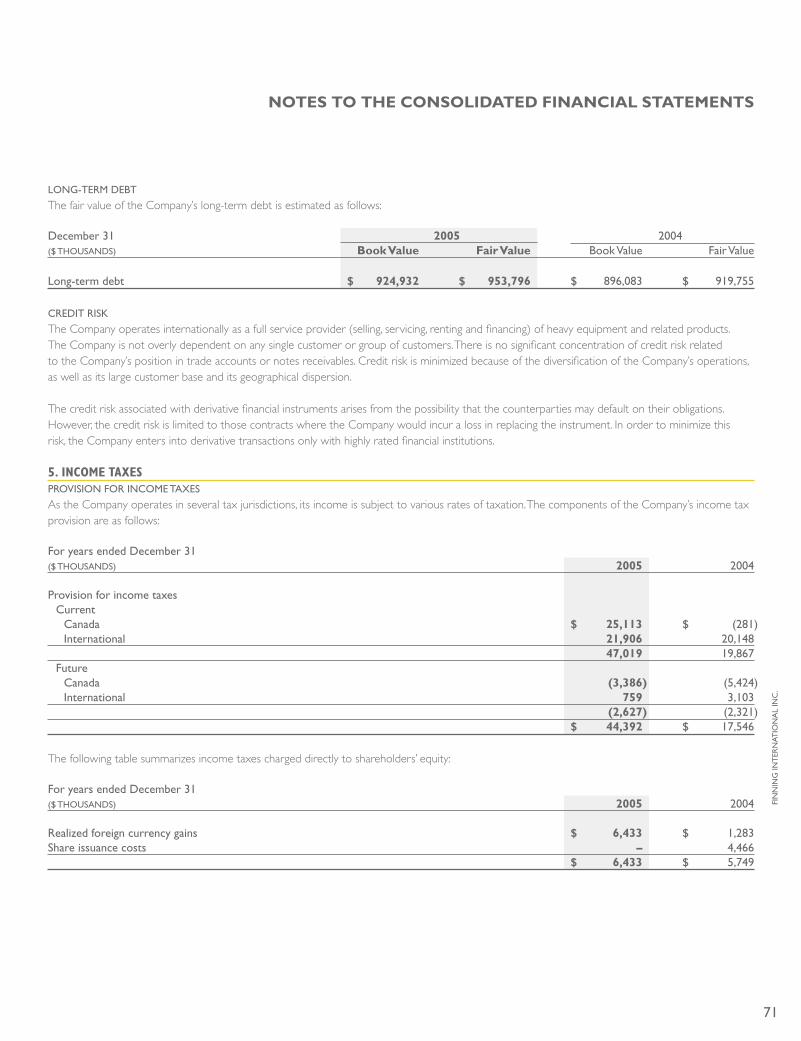
71
LONG-TERM DE�T
The fair value of the Company’s long-term debt is estimated as follows:
December 31 2005 2004($ THOUSANDS) book Value Fair Value �ook Value Fair Value
Long-term debt $ 924,932 $ 953,796 $ 896,083 $ 919,755
CREDIT RISK
The Company operates internationally as a full service provider (selling, servicing, renting and financing) of heavy equipment and related products. The Company is not overly dependent on any single customer or group of customers. There is no significant concentration of credit risk related to the Company’s position in trade accounts or notes receivables. Credit risk is minimized because of the diversification of the Company’s operations, as well as its large customer base and its geographical dispersion.
The credit risk associated with derivative financial instruments arises from the possibility that the counterparties may default on their obligations. However, the credit risk is limited to those contracts where the Company would incur a loss in replacing the instrument. In order to minimize this risk, the Company enters into derivative transactions only with highly rated financial institutions.
5. inCOme taxesPROVISION FOR INCOME TAXES
As the Company operates in several tax jurisdictions, its income is subject to various rates of taxation. The components of the Company’s income tax provision are as follows:
For years ended December 31 ($ THOUSANDS) 2005 2004
Provision for income taxes Current Canada $ 25,113 $ (281) International 21,906 20,148 47,019 19,867 Future Canada (3,386) (5,424) International 759 3,103 (2,627) (2,321) $ 44,392 $ 17,546
The following table summarizes income taxes charged directly to shareholders’ equity:
For years ended December 31 ($ THOUSANDS) 2005 2004
Realized foreign currency gains $ 6,433 $ 1,283Share issuance costs – 4,466 $ 6,433 $ 5,749
NoTES To THE CoNSoLIdATEd FINANCIAL STATEmENTS
FIN
NIN
G IN
TER
NAT
ION
AL
INC
.
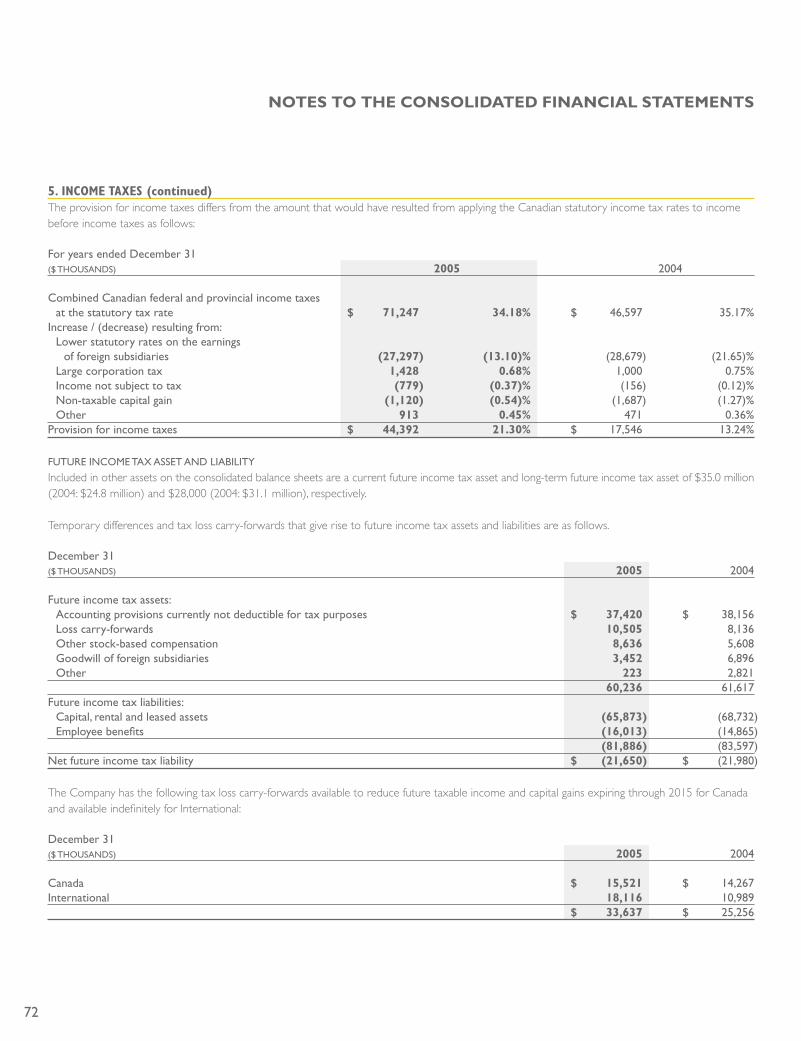
72
5. inCOme taxes (continued)The provision for income taxes differs from the amount that would have resulted from applying the Canadian statutory income tax rates to income before income taxes as follows:
For years ended December 31 ($ THOUSANDS) 2005 2004
Combined Canadian federal and provincial income taxes at the statutory tax rate $ 71,247 34.18% $ 46,597 35.17%Increase / (decrease) resulting from: Lower statutory rates on the earnings of foreign subsidiaries (27,297) (13.10)% (28,679) (21.65)% Large corporation tax 1,428 0.68% 1,000 0.75% Income not subject to tax (779) (0.37)% (156) (0.12)% Non-taxable capital gain (1,120) (0.54)% (1,687) (1.27)% Other 913 0.45% 471 0.36%Provision for income taxes $ 44,392 21.30% $ 17,546 13.24%
FUTURE INCOME TAX ASSET AND LIA�ILITY
Included in other assets on the consolidated balance sheets are a current future income tax asset and long-term future income tax asset of $35.0 million (2004: $24.8 million) and $28,000 (2004: $31.1 million), respectively.
Temporary differences and tax loss carry-forwards that give rise to future income tax assets and liabilities are as follows.
December 31 ($ THOUSANDS) 2005 2004
Future income tax assets: Accounting provisions currently not deductible for tax purposes $ 37,420 $ 38,156 Loss carry-forwards 10,505 8,136 Other stock-based compensation 8,636 5,608 Goodwill of foreign subsidiaries 3,452 6,896 Other 223 2,821 60,236 61,617Future income tax liabilities: Capital, rental and leased assets (65,873) (68,732) Employee benefits (16,013) (14,865) (81,886) (83,597)Net future income tax liability $ (21,650) $ (21,980)
The Company has the following tax loss carry-forwards available to reduce future taxable income and capital gains expiring through 2015 for Canada and available indefinitely for International:
December 31 ($ THOUSANDS) 2005 2004
Canada $ 15,521 $ 14,267International 18,116 10,989 $ 33,637 $ 25,256
NoTES To THE CoNSoLIdATEd FINANCIAL STATEmENTS
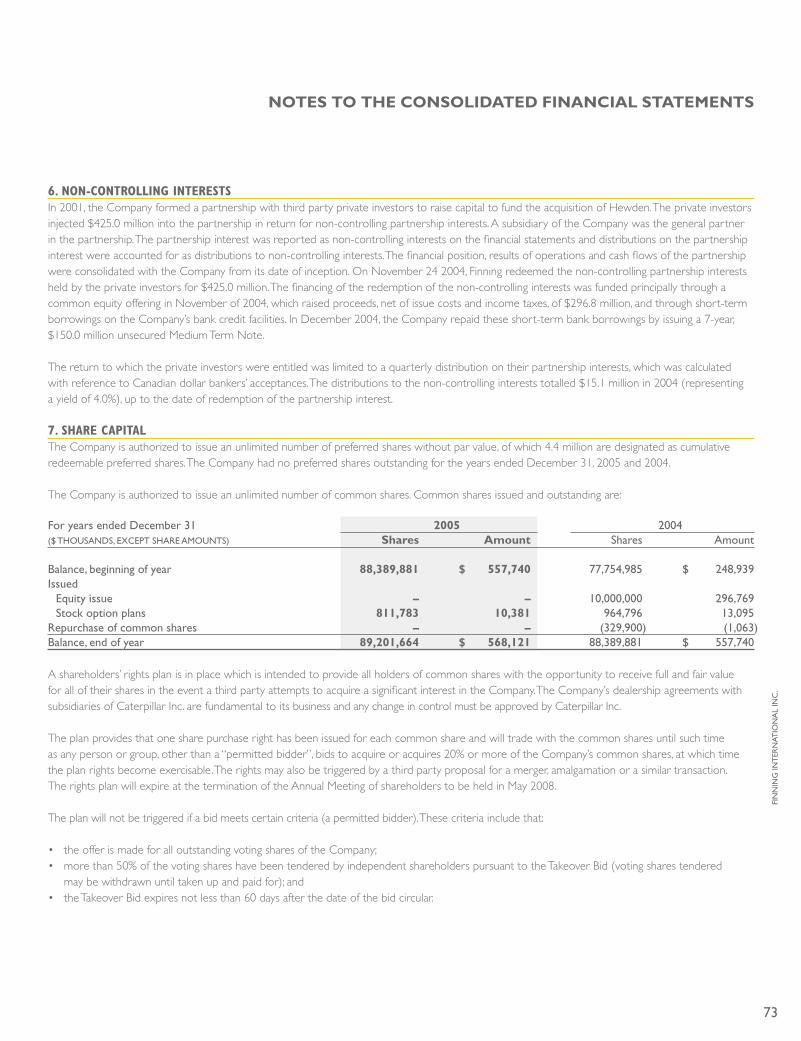
73
6. nOn-COntrOlling interestsIn 2001, the Company formed a partnership with third party private investors to raise capital to fund the acquisition of Hewden. The private investors injected $425.0 million into the partnership in return for non-controlling partnership interests. A subsidiary of the Company was the general partner in the partnership. The partnership interest was reported as non-controlling interests on the financial statements and distributions on the partnership interest were accounted for as distributions to non-controlling interests. The financial position, results of operations and cash flows of the partnership were consolidated with the Company from its date of inception. On November 24 2004, Finning redeemed the non-controlling partnership interests held by the private investors for $425.0 million. The financing of the redemption of the non-controlling interests was funded principally through a common equity offering in November of 2004, which raised proceeds, net of issue costs and income taxes, of $296.8 million, and through short-term borrowings on the Company’s bank credit facilities. In December 2004, the Company repaid these short-term bank borrowings by issuing a 7-year, $150.0 million unsecured Medium Term Note.
The return to which the private investors were entitled was limited to a quarterly distribution on their partnership interests, which was calculated with reference to Canadian dollar bankers’ acceptances. The distributions to the non-controlling interests totalled $15.1 million in 2004 (representing a yield of 4.0%), up to the date of redemption of the partnership interest.
7. share CapitalThe Company is authorized to issue an unlimited number of preferred shares without par value, of which 4.4 million are designated as cumulative redeemable preferred shares. The Company had no preferred shares outstanding for the years ended December 31, 2005 and 2004.
The Company is authorized to issue an unlimited number of common shares. Common shares issued and outstanding are:
For years ended December 31 2005 2004($ THOUSANDS, EXCEPT SHARE AMOUNTS) Shares Amount Shares Amount
�alance, beginning of year 88,389,881 $ 557,740 77,754,985 $ 248,939Issued Equity issue – – 10,000,000 296,769 Stock option plans 811,783 10,381 964,796 13,095Repurchase of common shares – – (329,900) (1,063)�alance, end of year 89,201,664 $ 568,121 88,389,881 $ 557,740
A shareholders’ rights plan is in place which is intended to provide all holders of common shares with the opportunity to receive full and fair value for all of their shares in the event a third party attempts to acquire a significant interest in the Company. The Company’s dealership agreements with subsidiaries of Caterpillar Inc. are fundamental to its business and any change in control must be approved by Caterpillar Inc.
The plan provides that one share purchase right has been issued for each common share and will trade with the common shares until such time as any person or group, other than a “permitted bidder”, bids to acquire or acquires 20% or more of the Company’s common shares, at which time the plan rights become exercisable. The rights may also be triggered by a third party proposal for a merger, amalgamation or a similar transaction. The rights plan will expire at the termination of the Annual Meeting of shareholders to be held in May 2008.
The plan will not be triggered if a bid meets certain criteria (a permitted bidder). These criteria include that:
• the offer is made for all outstanding voting shares of the Company;• more than 50% of the voting shares have been tendered by independent shareholders pursuant to the Takeover Bid (voting shares tendered
may be withdrawn until taken up and paid for); and• the Takeover Bid expires not less than 60 days after the date of the bid circular.
NoTES To THE CoNSoLIdATEd FINANCIAL STATEmENTS
FIN
NIN
G IN
TER
NAT
ION
AL
INC
.
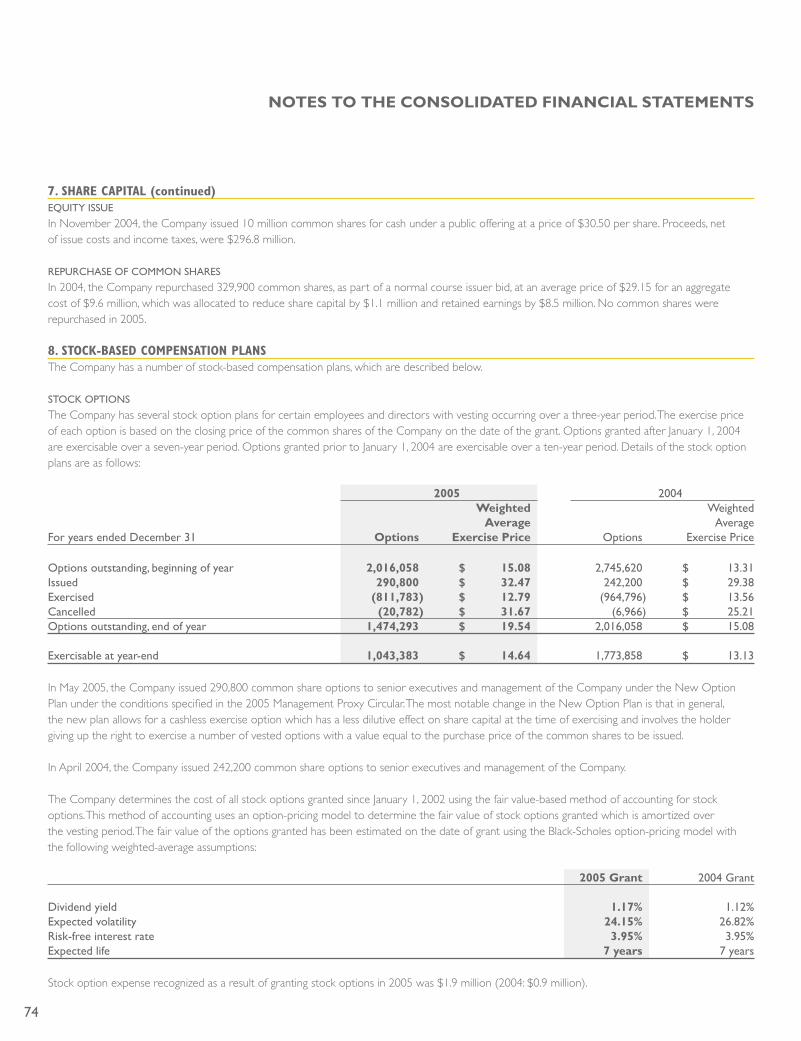
74
7. share Capital (continued)EQUITY ISSUE
In November 2004, the Company issued 10 million common shares for cash under a public offering at a price of $30.50 per share. Proceeds, net of issue costs and income taxes, were $296.8 million.
REPURCHASE OF COMMON SHARES
In 2004, the Company repurchased 329,900 common shares, as part of a normal course issuer bid, at an average price of $29.15 for an aggregate cost of $9.6 million, which was allocated to reduce share capital by $1.1 million and retained earnings by $8.5 million. No common shares were repurchased in 2005.
8. stOCK-based COmpensatiOn plansThe Company has a number of stock-based compensation plans, which are described below.
STOCK OPTIONS
The Company has several stock option plans for certain employees and directors with vesting occurring over a three-year period. The exercise price of each option is based on the closing price of the common shares of the Company on the date of the grant. Options granted after January 1, 2004 are exercisable over a seven-year period. Options granted prior to January 1, 2004 are exercisable over a ten-year period. Details of the stock option plans are as follows:
2005 2004 weighted Weighted Average Average For years ended December 31 options Exercise Price Options Exercise Price
Options outstanding, beginning of year 2,016,058 $ 15.08 2,745,620 $ 13.31Issued 290,800 $ 32.47 242,200 $ 29.38Exercised (811,783) $ 12.79 (964,796) $ 13.56Cancelled (20,782) $ 31.67 (6,966) $ 25.21Options outstanding, end of year 1,474,293 $ 19.54 2,016,058 $ 15.08
Exercisable at year-end 1,043,383 $ 14.64 1,773,858 $ 13.13
In May 2005, the Company issued 290,800 common share options to senior executives and management of the Company under the New Option Plan under the conditions specified in the 2005 Management Proxy Circular. The most notable change in the New Option Plan is that in general, the new plan allows for a cashless exercise option which has a less dilutive effect on share capital at the time of exercising and involves the holder giving up the right to exercise a number of vested options with a value equal to the purchase price of the common shares to be issued.
In April 2004, the Company issued 242,200 common share options to senior executives and management of the Company.
The Company determines the cost of all stock options granted since January 1, 2002 using the fair value-based method of accounting for stock options. This method of accounting uses an option-pricing model to determine the fair value of stock options granted which is amortized over the vesting period. The fair value of the options granted has been estimated on the date of grant using the Black-Scholes option-pricing model with the following weighted-average assumptions:
2005 Grant 2004 Grant
Dividend yield 1.17% 1.12%Expected volatility 24.15% 26.82%Risk-free interest rate 3.95% 3.95%Expected life 7 years 7 years
Stock option expense recognized as a result of granting stock options in 2005 was $1.9 million (2004: $0.9 million).
NoTES To THE CoNSoLIdATEd FINANCIAL STATEmENTS
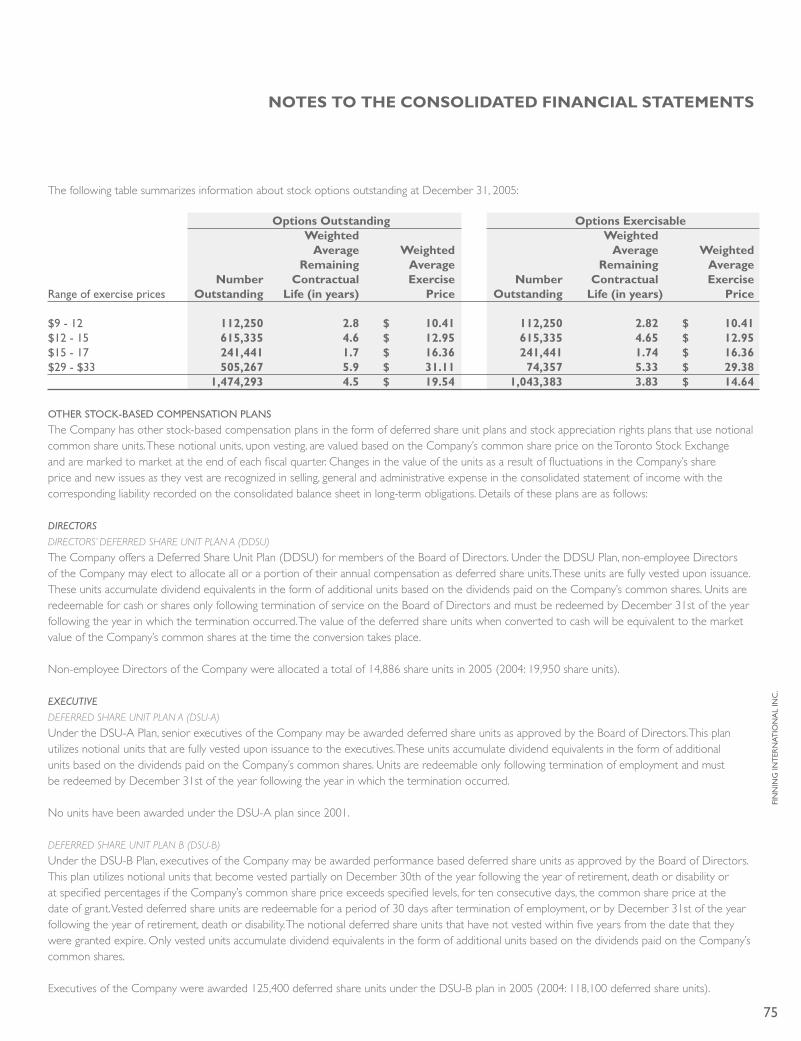
75
The following table summarizes information about stock options outstanding at December 31, 2005:
options outstanding options Exercisable weighted weighted Average weighted Average weighted remaining Average remaining Average Number Contractual Exercise Number Contractual Exercise Range of exercise prices outstanding Life (in years) Price outstanding Life (in years) Price
$9 - 12 112,250 2.8 $ 10.41 112,250 2.82 $ 10.41$12 - 15 615,335 4.6 $ 12.95 615,335 4.65 $ 12.95$15 - 17 241,441 1.7 $ 16.36 241,441 1.74 $ 16.36$29 - $33 505,267 5.9 $ 31.11 74,357 5.33 $ 29.38 1,474,293 4.5 $ 19.54 1,043,383 3.83 $ 14.64
OTHER STOCK-�ASED COMPENSATION PLANS
The Company has other stock-based compensation plans in the form of deferred share unit plans and stock appreciation rights plans that use notional common share units. These notional units, upon vesting, are valued based on the Company’s common share price on the Toronto Stock Exchange and are marked to market at the end of each fiscal quarter. Changes in the value of the units as a result of fluctuations in the Company’s share price and new issues as they vest are recognized in selling, general and administrative expense in the consolidated statement of income with the corresponding liability recorded on the consolidated balance sheet in long-term obligations. Details of these plans are as follows:
directors
DIrectors’ DeFerreD share unIt plan a (DDsu)
The Company offers a Deferred Share Unit Plan (DDSU) for members of the Board of Directors. Under the DDSU Plan, non-employee Directors of the Company may elect to allocate all or a portion of their annual compensation as deferred share units. These units are fully vested upon issuance. These units accumulate dividend equivalents in the form of additional units based on the dividends paid on the Company’s common shares. Units are redeemable for cash or shares only following termination of service on the Board of Directors and must be redeemed by December 31st of the year following the year in which the termination occurred. The value of the deferred share units when converted to cash will be equivalent to the market value of the Company’s common shares at the time the conversion takes place.
Non-employee Directors of the Company were allocated a total of 14,886 share units in 2005 (2004: 19,950 share units).
executive
DeFerreD share unIt plan a (Dsu-a)
Under the DSU-A Plan, senior executives of the Company may be awarded deferred share units as approved by the Board of Directors. This plan utilizes notional units that are fully vested upon issuance to the executives. These units accumulate dividend equivalents in the form of additional units based on the dividends paid on the Company’s common shares. Units are redeemable only following termination of employment and must be redeemed by December 31st of the year following the year in which the termination occurred.
No units have been awarded under the DSU-A plan since 2001.
DeFerreD share unIt plan B (Dsu-B)
Under the DSU-B Plan, executives of the Company may be awarded performance based deferred share units as approved by the Board of Directors. This plan utilizes notional units that become vested partially on December 30th of the year following the year of retirement, death or disability or at specified percentages if the Company’s common share price exceeds specified levels, for ten consecutive days, the common share price at the date of grant. Vested deferred share units are redeemable for a period of 30 days after termination of employment, or by December 31st of the year following the year of retirement, death or disability. The notional deferred share units that have not vested within five years from the date that they were granted expire. Only vested units accumulate dividend equivalents in the form of additional units based on the dividends paid on the Company’s common shares.
Executives of the Company were awarded 125,400 deferred share units under the DSU-B plan in 2005 (2004: 118,100 deferred share units).
NoTES To THE CoNSoLIdATEd FINANCIAL STATEmENTS
FIN
NIN
G IN
TER
NAT
ION
AL
INC
.
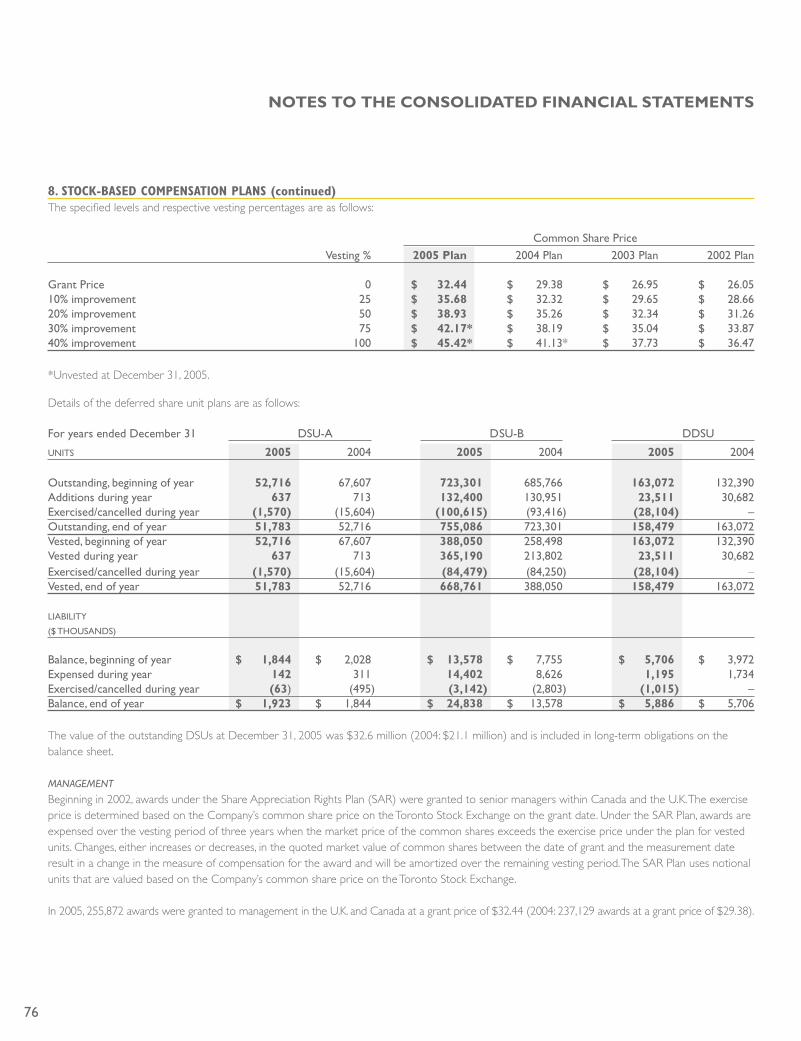
76
8. stOCK-based COmpensatiOn plans (continued)The specified levels and respective vesting percentages are as follows:
Common Share Price Vesting % 2005 Plan 2004 Plan 2003 Plan 2002 Plan
Grant Price 0 $ 32.44 $ 29.38 $ 26.95 $ 26.0510% improvement 25 $ 35.68 $ 32.32 $ 29.65 $ 28.6620% improvement 50 $ 38.93 $ 35.26 $ 32.34 $ 31.2630% improvement 75 $ 42.17* $ 38.19 $ 35.04 $ 33.8740% improvement 100 $ 45.42* $ 41.13* $ 37.73 $ 36.47
*Unvested at December 31, 2005.
Details of the deferred share unit plans are as follows:
For years ended December 31 DSU-A DSU-� DDSU
UNITS 2005 2004 2005 2004 2005 2004
Outstanding, beginning of year 52,716 67,607 723,301 685,766 163,072 132,390Additions during year 637 713 132,400 130,951 23,511 30,682Exercised/cancelled during year (1,570) (15,604) (100,615) (93,416) (28,104) –Outstanding, end of year 51,783 52,716 755,086 723,301 158,479 163,072Vested, beginning of year 52,716 67,607 388,050 258,498 163,072 132,390Vested during year 637 713 365,190 213,802 23,511 30,682Exercised/cancelled during year (1,570) (15,604) (84,479) (84,250) (28,104) –Vested, end of year 51,783 52,716 668,761 388,050 158,479 163,072
LIA�ILITY ($ THOUSANDS)
�alance, beginning of year $ 1,844 $ 2,028 $ 13,578 $ 7,755 $ 5,706 $ 3,972Expensed during year 142 311 14,402 8,626 1,195 1,734Exercised/cancelled during year (63) (495) (3,142) (2,803) (1,015) –�alance, end of year $ 1,923 $ 1,844 $ 24,838 $ 13,578 $ 5,886 $ 5,706
The value of the outstanding DSUs at December 31, 2005 was $32.6 million (2004: $21.1 million) and is included in long-term obligations on the balance sheet.
management
Beginning in 2002, awards under the Share Appreciation Rights Plan (SAR) were granted to senior managers within Canada and the U.K. The exercise price is determined based on the Company’s common share price on the Toronto Stock Exchange on the grant date. Under the SAR Plan, awards are expensed over the vesting period of three years when the market price of the common shares exceeds the exercise price under the plan for vested units. Changes, either increases or decreases, in the quoted market value of common shares between the date of grant and the measurement date result in a change in the measure of compensation for the award and will be amortized over the remaining vesting period. The SAR Plan uses notional units that are valued based on the Company’s common share price on the Toronto Stock Exchange.
In 2005, 255,872 awards were granted to management in the U.K. and Canada at a grant price of $32.44 (2004: 237,129 awards at a grant price of $29.38).
NoTES To THE CoNSoLIdATEd FINANCIAL STATEmENTS

77
Details of the SAR plans are as follows:
For years ended December 31 UNITS 2005 2004
Outstanding, beginning of year 649,367 541,121Additions during year 255,872 237,129Exercised/cancelled during year (190,239) (128,883)Outstanding, end of year 715,000 649,367Vested, beginning of year 205,073 163,708Vested during year 235,408 138,665Exercised/cancelled during year (153,781) (97,300)Vested, end of year 286,700 205,073
LIA�ILITY
($ THOUSANDS)
�alance, beginning of year $ 3,520 $ 1,226Expensed during period 3,050 2,837Exercised/cancelled during period (1,915) (543)�alance, end of period $ 4,655 $ 3,520
Exercise price ranges: $26.05 - $32.44
Changes in the value of all deferred share units and share appreciation rights as a result of fluctuations in the Company’s common share price and the impact of new issues, including stock options, resulted in a charge to income in 2005 of $20.6 million (2004: $14.4 million). This amount was recognized in selling, general and administrative expenses on the consolidated statement of income.
9. earnings per shareBasic earnings per share is calculated by dividing net income available to common shareholders by the weighted average number of common shares outstanding during the period. Diluted earnings per share is calculated to reflect the dilutive effect of exercising outstanding stock options by applying the treasury stock method.
For years ended December 31 ($ THOUSANDS, EXCEPT SHARE AND PER SHARE AMOUNTS) Income Shares Per Share
2005�asic earnings per share: net income $ 164,030 88,851,343 $ 1.85Effect of dilutive securities: stock options – 1,043,383 –Diluted earnings per share: net income and assumed conversions $ 164,030 89,894,726 $ 1.83
2004�asic earnings per share: net income $ 114,946 79,018,683 $ 1.45Effect of dilutive securities: stock options – 1,051,870 –Diluted earnings per share: net income and assumed conversions $ 114,946 80,070,553 $ 1.43
NoTES To THE CoNSoLIdATEd FINANCIAL STATEmENTS
FIN
NIN
G IN
TER
NAT
ION
AL
INC
.
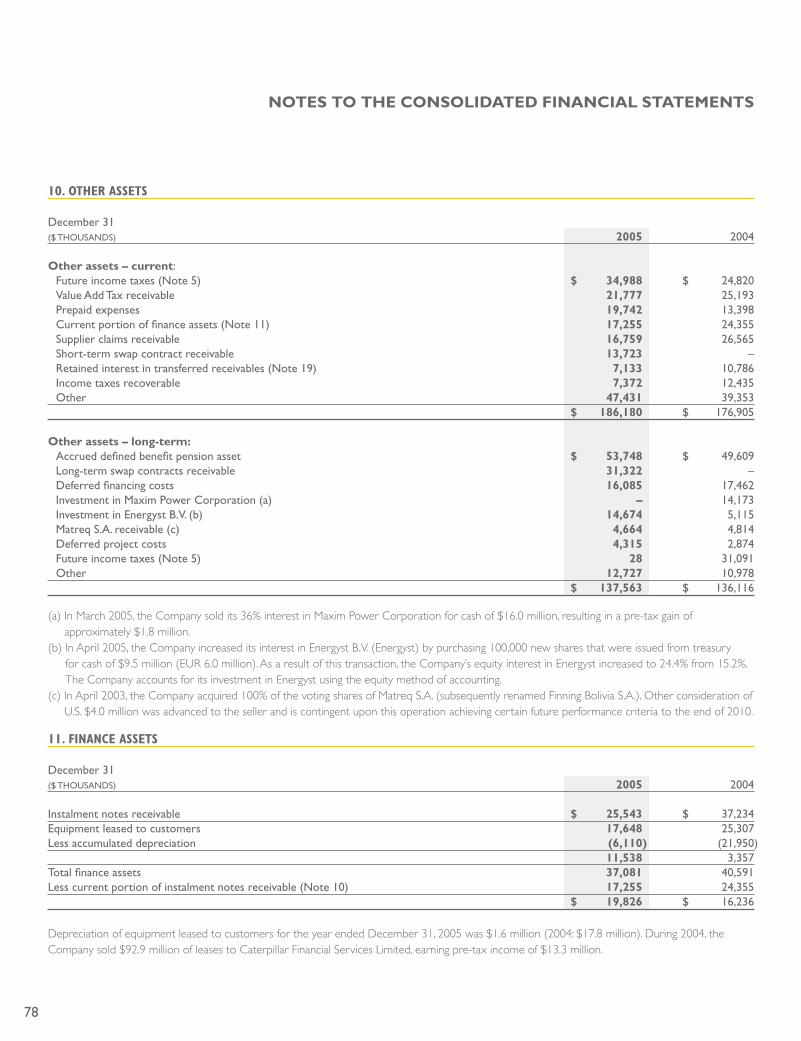
78
10. Other assets
December 31 ($ THOUSANDS) 2005 2004
other assets – current: Future income taxes (Note 5) $ 34,988 $ 24,820 Value Add Tax receivable 21,777 25,193 Prepaid expenses 19,742 13,398 Current portion of finance assets (Note 11) 17,255 24,355 Supplier claims receivable 16,759 26,565 Short-term swap contract receivable 13,723 – Retained interest in transferred receivables (Note 19) 7,133 10,786 Income taxes recoverable 7,372 12,435 Other 47,431 39,353 $ 186,180 $ 176,905
other assets – long-term: Accrued defined benefit pension asset $ 53,748 $ 49,609 Long-term swap contracts receivable 31,322 – Deferred financing costs 16,085 17,462 Investment in Maxim Power Corporation (a) – 14,173 Investment in Energyst �.V. (b) 14,674 5,115 Matreq S.A. receivable (c) 4,664 4,814 Deferred project costs 4,315 2,874 Future income taxes (Note 5) 28 31,091 Other 12,727 10,978 $ 137,563 $ 136,116
(a) In March 2005, the Company sold its 36% interest in Maxim Power Corporation for cash of $16.0 million, resulting in a pre-tax gain of approximately $1.8 million.
(b) In April 2005, the Company increased its interest in Energyst B.V. (Energyst) by purchasing 100,000 new shares that were issued from treasury for cash of $9.5 million (EUR 6.0 million). As a result of this transaction, the Company’s equity interest in Energyst increased to 24.4% from 15.2%. The Company accounts for its investment in Energyst using the equity method of accounting.
(c) In April 2003, the Company acquired 100% of the voting shares of Matreq S.A. (subsequently renamed Finning Bolivia S.A.). Other consideration of U.S. $4.0 million was advanced to the seller and is contingent upon this operation achieving certain future performance criteria to the end of 2010.
11. finanCe assets
December 31 ($ THOUSANDS) 2005 2004
Instalment notes receivable $ 25,543 $ 37,234Equipment leased to customers 17,648 25,307Less accumulated depreciation (6,110) (21,950) 11,538 3,357Total finance assets 37,081 40,591Less current portion of instalment notes receivable (Note 10) 17,255 24,355 $ 19,826 $ 16,236
Depreciation of equipment leased to customers for the year ended December 31, 2005 was $1.6 million (2004: $17.8 million). During 2004, the Company sold $92.9 million of leases to Caterpillar Financial Services Limited, earning pre-tax income of $13.3 million.
NoTES To THE CoNSoLIdATEd FINANCIAL STATEmENTS
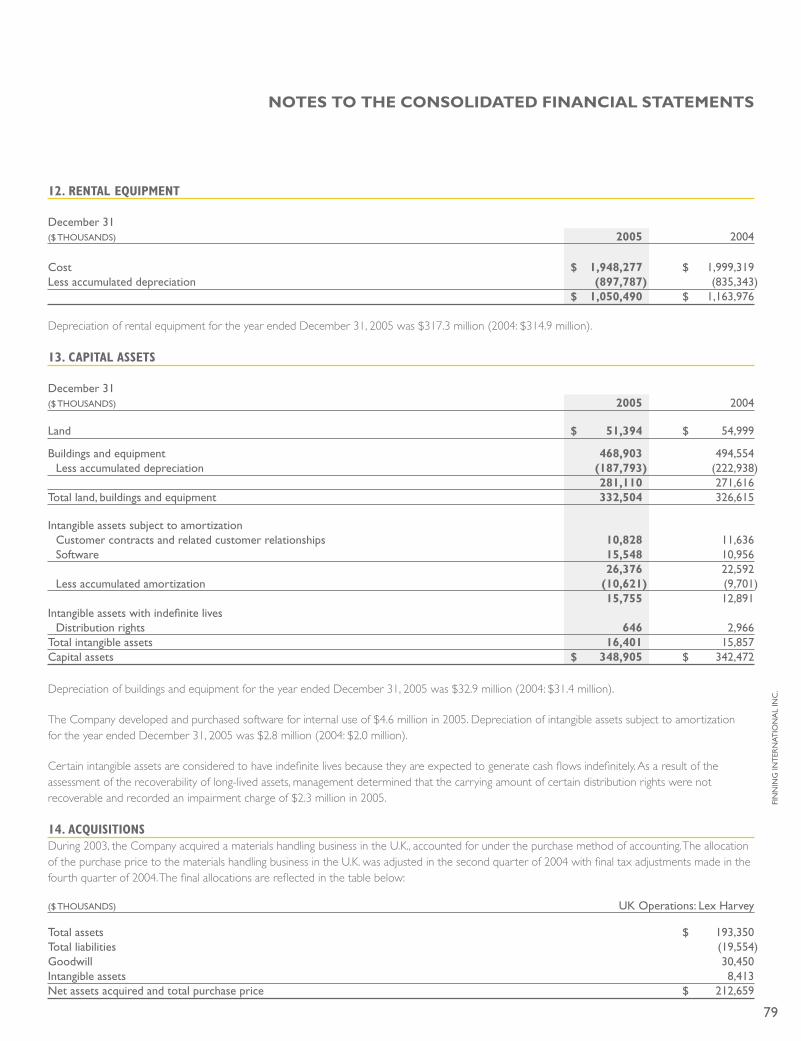
79
12. rental eQuipment
December 31
($ THOUSANDS) 2005 2004
Cost $ 1,948,277 $ 1,999,319Less accumulated depreciation (897,787) (835,343) $ 1,050,490 $ 1,163,976
Depreciation of rental equipment for the year ended December 31, 2005 was $317.3 million (2004: $314.9 million).
13. Capital assets
December 31
($ THOUSANDS) 2005 2004
Land $ 51,394 $ 54,999
�uildings and equipment 468,903 494,554 Less accumulated depreciation (187,793) (222,938) 281,110 271,616Total land, buildings and equipment 332,504 326,615
Intangible assets subject to amortization Customer contracts and related customer relationships 10,828 11,636 Software 15,548 10,956 26,376 22,592 Less accumulated amortization (10,621) (9,701) 15,755 12,891Intangible assets with indefinite lives Distribution rights 646 2,966Total intangible assets 16,401 15,857Capital assets $ 348,905 $ 342,472
Depreciation of buildings and equipment for the year ended December 31, 2005 was $32.9 million (2004: $31.4 million).
The Company developed and purchased software for internal use of $4.6 million in 2005. Depreciation of intangible assets subject to amortization for the year ended December 31, 2005 was $2.8 million (2004: $2.0 million).
Certain intangible assets are considered to have indefinite lives because they are expected to generate cash flows indefinitely. As a result of the assessment of the recoverability of long-lived assets, management determined that the carrying amount of certain distribution rights were not recoverable and recorded an impairment charge of $2.3 million in 2005.
14. aCQuisitiOnsDuring 2003, the Company acquired a materials handling business in the U.K., accounted for under the purchase method of accounting. The allocation of the purchase price to the materials handling business in the U.K. was adjusted in the second quarter of 2004 with final tax adjustments made in the fourth quarter of 2004. The final allocations are reflected in the table below:
($ THOUSANDS) UK Operations: Lex Harvey
Total assets $ 193,350Total liabilities (19,554)Goodwill 30,450Intangible assets 8,413Net assets acquired and total purchase price $ 212,659
NoTES To THE CoNSoLIdATEd FINANCIAL STATEmENTS
FIN
NIN
G IN
TER
NAT
ION
AL
INC
.
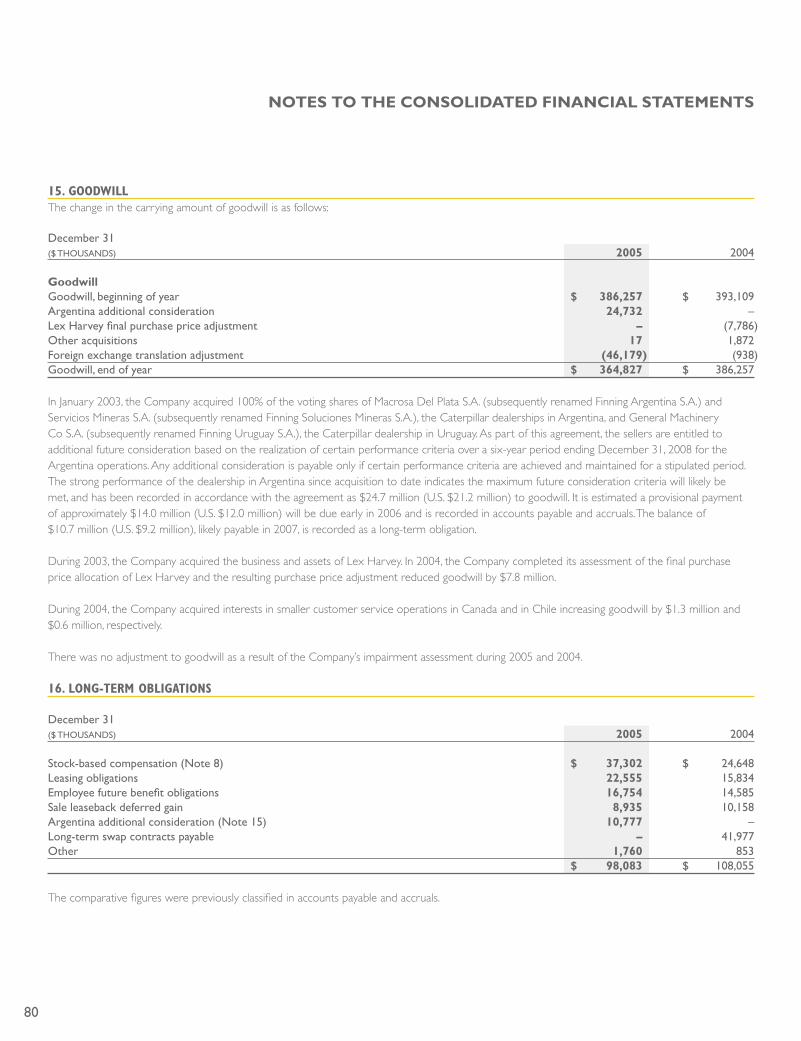
80
15. gOOdwillThe change in the carrying amount of goodwill is as follows:
December 31 ($ THOUSANDS) 2005 2004
GoodwillGoodwill, beginning of year $ 386,257 $ 393,109Argentina additional consideration 24,732 –Lex Harvey final purchase price adjustment – (7,786)Other acquisitions 17 1,872Foreign exchange translation adjustment (46,179) (938)Goodwill, end of year $ 364,827 $ 386,257
In January 2003, the Company acquired 100% of the voting shares of Macrosa Del Plata S.A. (subsequently renamed Finning Argentina S.A.) and Servicios Mineras S.A. (subsequently renamed Finning Soluciones Mineras S.A.), the Caterpillar dealerships in Argentina, and General Machinery Co S.A. (subsequently renamed Finning Uruguay S.A.), the Caterpillar dealership in Uruguay. As part of this agreement, the sellers are entitled to additional future consideration based on the realization of certain performance criteria over a six-year period ending December 31, 2008 for the Argentina operations. Any additional consideration is payable only if certain performance criteria are achieved and maintained for a stipulated period. The strong performance of the dealership in Argentina since acquisition to date indicates the maximum future consideration criteria will likely be met, and has been recorded in accordance with the agreement as $24.7 million (U.S. $21.2 million) to goodwill. It is estimated a provisional payment of approximately $14.0 million (U.S. $12.0 million) will be due early in 2006 and is recorded in accounts payable and accruals. The balance of $10.7 million (U.S. $9.2 million), likely payable in 2007, is recorded as a long-term obligation.
During 2003, the Company acquired the business and assets of Lex Harvey. In 2004, the Company completed its assessment of the final purchase price allocation of Lex Harvey and the resulting purchase price adjustment reduced goodwill by $7.8 million.
During 2004, the Company acquired interests in smaller customer service operations in Canada and in Chile increasing goodwill by $1.3 million and $0.6 million, respectively.
There was no adjustment to goodwill as a result of the Company’s impairment assessment during 2005 and 2004.
16. lOng-term ObligatiOns
December 31 ($ THOUSANDS) 2005 2004
Stock-based compensation (Note 8) $ 37,302 $ 24,648Leasing obligations 22,555 15,834Employee future benefit obligations 16,754 14,585Sale leaseback deferred gain 8,935 10,158Argentina additional consideration (Note 15) 10,777 –Long-term swap contracts payable – 41,977Other 1,760 853 $ 98,083 $ 108,055
The comparative figures were previously classified in accounts payable and accruals.
NoTES To THE CoNSoLIdATEd FINANCIAL STATEmENTS
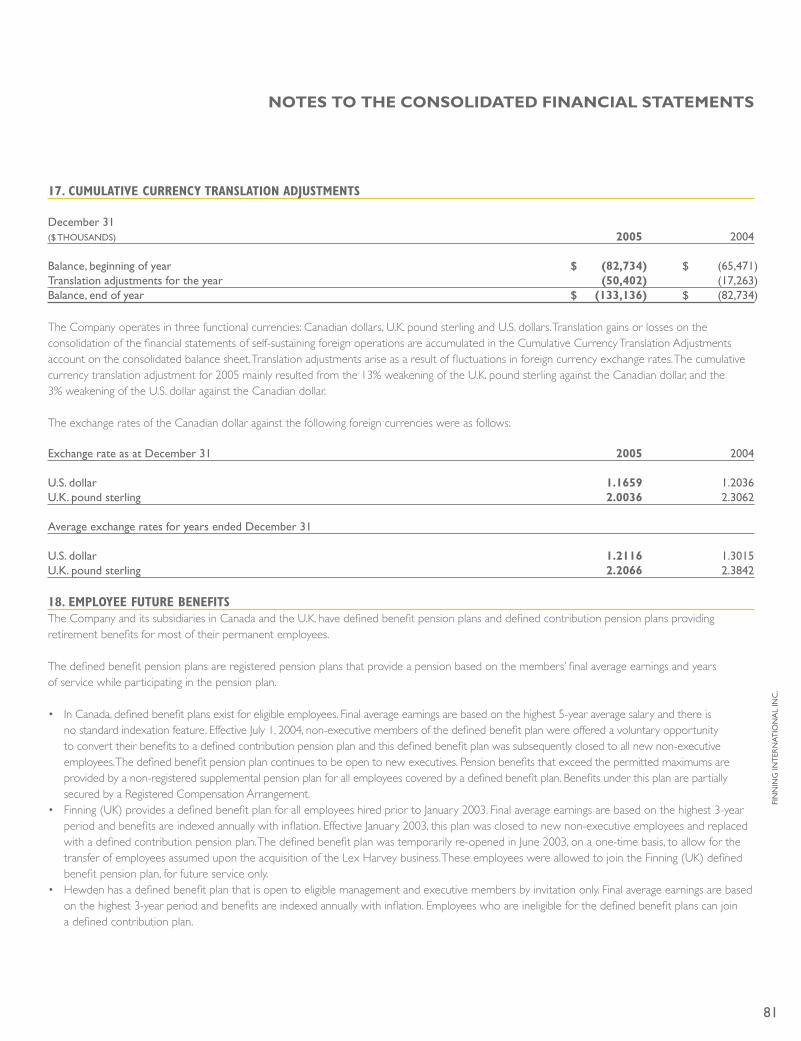
81
17. Cumulative CurrenCY translatiOn adJustments
December 31 ($ THOUSANDS) 2005 2004
�alance, beginning of year $ (82,734) $ (65,471)Translation adjustments for the year (50,402) (17,263)�alance, end of year $ (133,136) $ (82,734)
The Company operates in three functional currencies: Canadian dollars, U.K. pound sterling and U.S. dollars. Translation gains or losses on the consolidation of the financial statements of self-sustaining foreign operations are accumulated in the Cumulative Currency Translation Adjustments account on the consolidated balance sheet. Translation adjustments arise as a result of fluctuations in foreign currency exchange rates. The cumulative currency translation adjustment for 2005 mainly resulted from the 13% weakening of the U.K. pound sterling against the Canadian dollar, and the 3% weakening of the U.S. dollar against the Canadian dollar.
The exchange rates of the Canadian dollar against the following foreign currencies were as follows:
Exchange rate as at December 31 2005 2004
U.S. dollar 1.1659 1.2036U.K. pound sterling 2.0036 2.3062
Average exchange rates for years ended December 31
U.S. dollar 1.2116 1.3015U.K. pound sterling 2.2066 2.3842
18. emplOYee future benefitsThe Company and its subsidiaries in Canada and the U.K. have defined benefit pension plans and defined contribution pension plans providing retirement benefits for most of their permanent employees.
The defined benefit pension plans are registered pension plans that provide a pension based on the members’ final average earnings and years of service while participating in the pension plan.
• In Canada, defined benefit plans exist for eligible employees. Final average earnings are based on the highest 5-year average salary and there is no standard indexation feature. Effective July 1, 2004, non-executive members of the defined benefit plan were offered a voluntary opportunity to convert their benefits to a defined contribution pension plan and this defined benefit plan was subsequently closed to all new non-executive employees. The defined benefit pension plan continues to be open to new executives. Pension benefits that exceed the permitted maximums are provided by a non-registered supplemental pension plan for all employees covered by a defined benefit plan. Benefits under this plan are partially secured by a Registered Compensation Arrangement.
• Finning (UK) provides a defined benefit plan for all employees hired prior to January 2003. Final average earnings are based on the highest 3-year period and benefits are indexed annually with inflation. Effective January 2003, this plan was closed to new non-executive employees and replaced with a defined contribution pension plan. The defined benefit plan was temporarily re-opened in June 2003, on a one-time basis, to allow for the transfer of employees assumed upon the acquisition of the Lex Harvey business. These employees were allowed to join the Finning (UK) defined benefit pension plan, for future service only.
• Hewden has a defined benefit plan that is open to eligible management and executive members by invitation only. Final average earnings are based on the highest 3-year period and benefits are indexed annually with inflation. Employees who are ineligible for the defined benefit plans can join a defined contribution plan.
NoTES To THE CoNSoLIdATEd FINANCIAL STATEmENTS
FIN
NIN
G IN
TER
NAT
ION
AL
INC
.
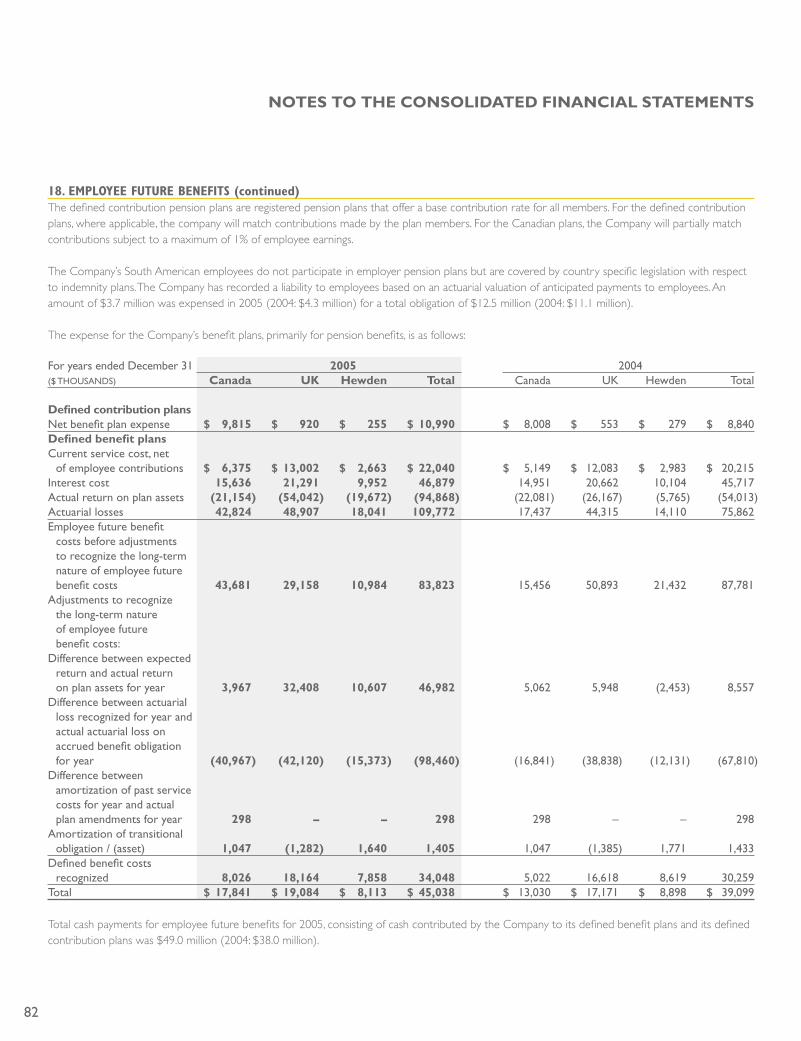
82
18. emplOYee future benefits (continued)The defined contribution pension plans are registered pension plans that offer a base contribution rate for all members. For the defined contribution plans, where applicable, the company will match contributions made by the plan members. For the Canadian plans, the Company will partially match contributions subject to a maximum of 1% of employee earnings.
The Company’s South American employees do not participate in employer pension plans but are covered by country specific legislation with respect to indemnity plans. The Company has recorded a liability to employees based on an actuarial valuation of anticipated payments to employees. An amount of $3.7 million was expensed in 2005 (2004: $4.3 million) for a total obligation of $12.5 million (2004: $11.1 million).
The expense for the Company’s benefit plans, primarily for pension benefits, is as follows:
For years ended December 31 2005 2004($ THOUSANDS) Canada UK Hewden Total Canada UK Hewden Total
defined contribution plansNet benefit plan expense $ 9,815 $ 920 $ 255 $ 10,990 $ 8,008 $ 553 $ 279 $ 8,840defined benefit plansCurrent service cost, net of employee contributions $ 6,375 $ 13,002 $ 2,663 $ 22,040 $ 5,149 $ 12,083 $ 2,983 $ 20,215Interest cost 15,636 21,291 9,952 46,879 14,951 20,662 10,104 45,717Actual return on plan assets (21,154) (54,042) (19,672) (94,868) (22,081) (26,167) (5,765) (54,013)Actuarial losses 42,824 48,907 18,041 109,772 17,437 44,315 14,110 75,862Employee future benefit costs before adjustments to recognize the long-term nature of employee future benefit costs 43,681 29,158 10,984 83,823 15,456 50,893 21,432 87,781Adjustments to recognize the long-term nature of employee future benefit costs:Difference between expected return and actual return on plan assets for year 3,967 32,408 10,607 46,982 5,062 5,948 (2,453) 8,557Difference between actuarial loss recognized for year and actual actuarial loss on accrued benefit obligation for year (40,967) (42,120) (15,373) (98,460) (16,841) (38,838) (12,131) (67,810)Difference between amortization of past service costs for year and actual plan amendments for year 298 – – 298 298 – – 298Amortization of transitional obligation / (asset) 1,047 (1,282) 1,640 1,405 1,047 (1,385) 1,771 1,433Defined benefit costs recognized 8,026 18,164 7,858 34,048 5,022 16,618 8,619 30,259Total $ 17,841 $ 19,084 $ 8,113 $ 45,038 $ 13,030 $ 17,171 $ 8,898 $ 39,099
Total cash payments for employee future benefits for 2005, consisting of cash contributed by the Company to its defined benefit plans and its defined contribution plans was $49.0 million (2004: $38.0 million).
NoTES To THE CoNSoLIdATEd FINANCIAL STATEmENTS
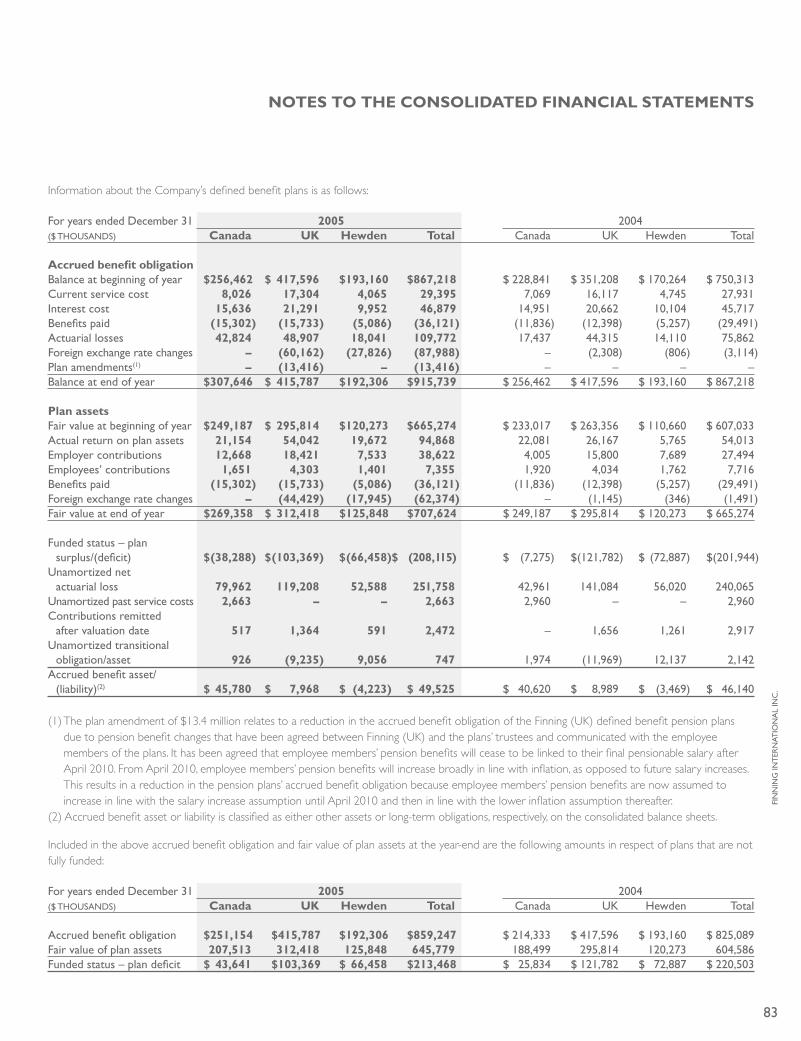
83
Information about the Company’s defined benefit plans is as follows:
For years ended December 31 2005 2004($ THOUSANDS) Canada UK Hewden Total Canada UK Hewden Total
Accrued benefit obligation�alance at beginning of year $ 256,462 $ 417,596 $ 193,160 $ 867,218 $ 228,841 $ 351,208 $ 170,264 $ 750,313Current service cost 8,026 17,304 4,065 29,395 7,069 16,117 4,745 27,931Interest cost 15,636 21,291 9,952 46,879 14,951 20,662 10,104 45,717�enefits paid (15,302) (15,733) (5,086) (36,121) (11,836) (12,398) (5,257) (29,491)Actuarial losses 42,824 48,907 18,041 109,772 17,437 44,315 14,110 75,862Foreign exchange rate changes – (60,162) (27,826) (87,988) – (2,308) (806) (3,114)Plan amendments(1) – (13,416) – (13,416) – – – –�alance at end of year $ 307,646 $ 415,787 $ 192,306 $ 915,739 $ 256,462 $ 417,596 $ 193,160 $ 867,218
Plan assetsFair value at beginning of year $ 249,187 $ 295,814 $ 120,273 $ 665,274 $ 233,017 $ 263,356 $ 110,660 $ 607,033Actual return on plan assets 21,154 54,042 19,672 94,868 22,081 26,167 5,765 54,013Employer contributions 12,668 18,421 7,533 38,622 4,005 15,800 7,689 27,494Employees’ contributions 1,651 4,303 1,401 7,355 1,920 4,034 1,762 7,716�enefits paid (15,302) (15,733) (5,086) (36,121) (11,836) (12,398) (5,257) (29,491)Foreign exchange rate changes – (44,429) (17,945) (62,374) – (1,145) (346) (1,491)Fair value at end of year $ 269,358 $ 312,418 $ 125,848 $ 707,624 $ 249,187 $ 295,814 $ 120,273 $ 665,274
Funded status – plan surplus/(deficit) $ (38,288) $ (103,369) $ (66,458)$ (208,115) $ (7,275) $ (121,782) $ (72,887) $ (201,944)Unamortized net actuarial loss 79,962 119,208 52,588 251,758 42,961 141,084 56,020 240,065Unamortized past service costs 2,663 – – 2,663 2,960 – – 2,960Contributions remitted after valuation date 517 1,364 591 2,472 – 1,656 1,261 2,917Unamortized transitional obligation/asset 926 (9,235) 9,056 747 1,974 (11,969) 12,137 2,142Accrued benefit asset/ (liability)(2) $ 45,780 $ 7,968 $ (4,223) $ 49,525 $ 40,620 $ 8,989 $ (3,469) $ 46,140
(1) The plan amendment of $13.4 million relates to a reduction in the accrued benefit obligation of the Finning (UK) defined benefit pension plans due to pension benefit changes that have been agreed between Finning (UK) and the plans’ trustees and communicated with the employee members of the plans. It has been agreed that employee members’ pension benefits will cease to be linked to their final pensionable salary after April 2010. From April 2010, employee members’ pension benefits will increase broadly in line with inflation, as opposed to future salary increases. This results in a reduction in the pension plans’ accrued benefit obligation because employee members’ pension benefits are now assumed to increase in line with the salary increase assumption until April 2010 and then in line with the lower inflation assumption thereafter.
(2) Accrued benefit asset or liability is classified as either other assets or long-term obligations, respectively, on the consolidated balance sheets.
Included in the above accrued benefit obligation and fair value of plan assets at the year-end are the following amounts in respect of plans that are not fully funded:
For years ended December 31 2005 2004($ THOUSANDS) Canada UK Hewden Total Canada UK Hewden Total
Accrued benefit obligation $ 251,154 $ 415,787 $ 192,306 $ 859,247 $ 214,333 $ 417,596 $ 193,160 $ 825,089Fair value of plan assets 207,513 312,418 125,848 645,779 188,499 295,814 120,273 604,586Funded status – plan deficit $ 43,641 $ 103,369 $ 66,458 $ 213,468 $ 25,834 $ 121,782 $ 72,887 $ 220,503
NoTES To THE CoNSoLIdATEd FINANCIAL STATEmENTS
FIN
NIN
G IN
TER
NAT
ION
AL
INC
.
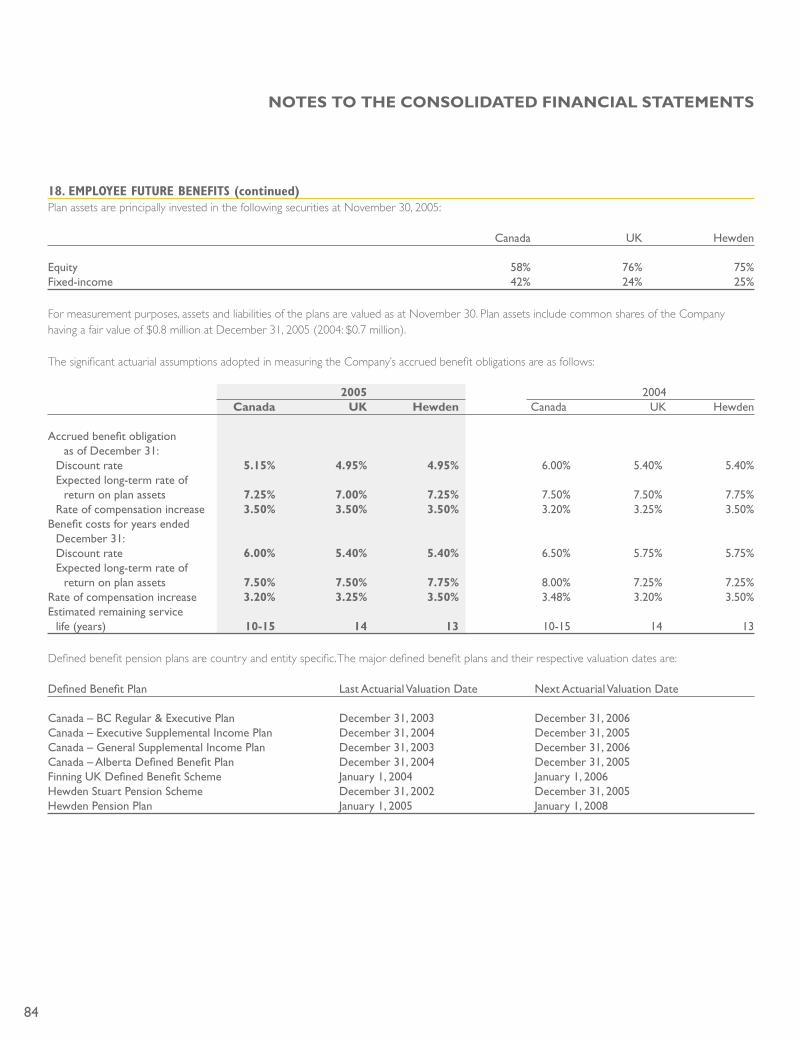
84
18. emplOYee future benefits (continued)Plan assets are principally invested in the following securities at November 30, 2005:
Canada UK Hewden
Equity 58% 76% 75%Fixed-income 42% 24% 25%
For measurement purposes, assets and liabilities of the plans are valued as at November 30. Plan assets include common shares of the Company having a fair value of $0.8 million at December 31, 2005 (2004: $0.7 million).
The significant actuarial assumptions adopted in measuring the Company’s accrued benefit obligations are as follows:
2005 2004 Canada UK Hewden Canada UK Hewden
Accrued benefit obligation as of December 31: Discount rate 5.15% 4.95% 4.95% 6.00% 5.40% 5.40% Expected long-term rate of return on plan assets 7.25% 7.00% 7.25% 7.50% 7.50% 7.75% Rate of compensation increase 3.50% 3.50% 3.50% 3.20% 3.25% 3.50%�enefit costs for years ended December 31: Discount rate 6.00% 5.40% 5.40% 6.50% 5.75% 5.75% Expected long-term rate of return on plan assets 7.50% 7.50% 7.75% 8.00% 7.25% 7.25%Rate of compensation increase 3.20% 3.25% 3.50% 3.48% 3.20% 3.50%Estimated remaining service life (years) 10-15 14 13 10-15 14 13
Defined benefit pension plans are country and entity specific. The major defined benefit plans and their respective valuation dates are:
Defined �enefit Plan Last Actuarial Valuation Date Next Actuarial Valuation Date
Canada – �C Regular & Executive Plan December 31, 2003 December 31, 2006Canada – Executive Supplemental Income Plan December 31, 2004 December 31, 2005Canada – General Supplemental Income Plan December 31, 2003 December 31, 2006Canada – Alberta Defined �enefit Plan December 31, 2004 December 31, 2005Finning UK Defined �enefit Scheme January 1, 2004 January 1, 2006Hewden Stuart Pension Scheme December 31, 2002 December 31, 2005Hewden Pension Plan January 1, 2005 January 1, 2008
NoTES To THE CoNSoLIdATEd FINANCIAL STATEmENTS
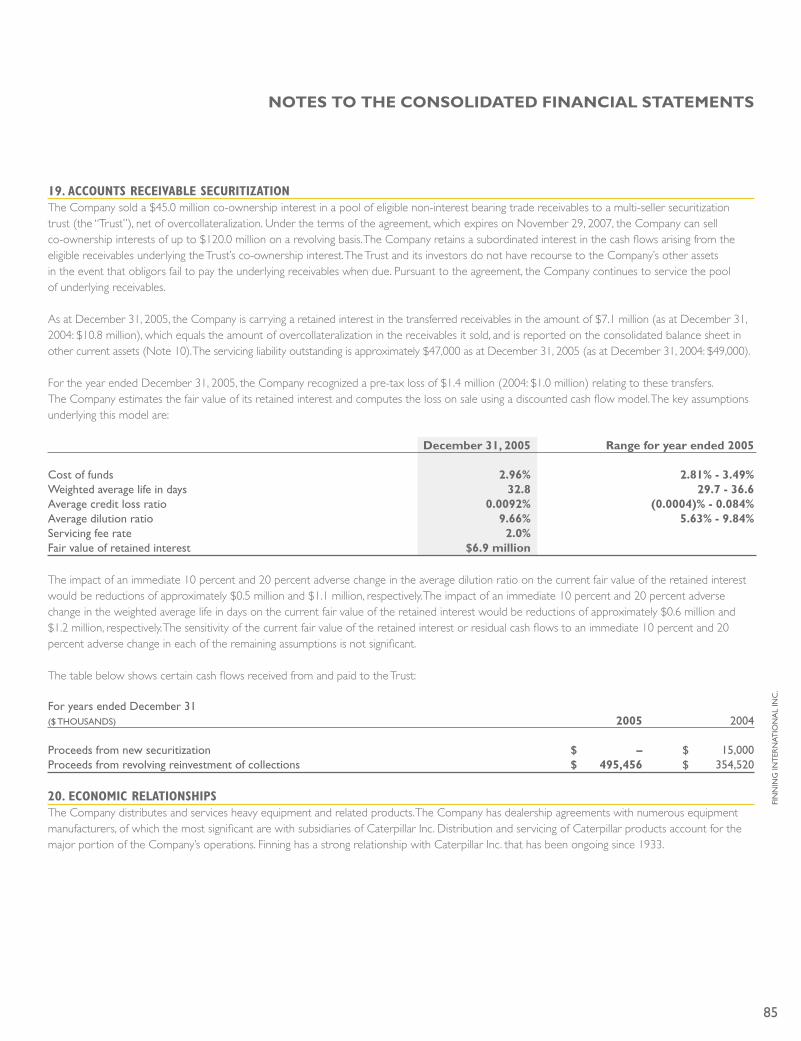
85
19. aCCOunts reCeivable seCuritiZatiOnThe Company sold a $45.0 million co-ownership interest in a pool of eligible non-interest bearing trade receivables to a multi-seller securitization trust (the “Trust”), net of overcollateralization. Under the terms of the agreement, which expires on November 29, 2007, the Company can sell co-ownership interests of up to $120.0 million on a revolving basis. The Company retains a subordinated interest in the cash flows arising from the eligible receivables underlying the Trust’s co-ownership interest. The Trust and its investors do not have recourse to the Company’s other assets in the event that obligors fail to pay the underlying receivables when due. Pursuant to the agreement, the Company continues to service the pool of underlying receivables.
As at December 31, 2005, the Company is carrying a retained interest in the transferred receivables in the amount of $7.1 million (as at December 31, 2004: $10.8 million), which equals the amount of overcollateralization in the receivables it sold, and is reported on the consolidated balance sheet in other current assets (Note 10). The servicing liability outstanding is approximately $47,000 as at December 31, 2005 (as at December 31, 2004: $49,000).
For the year ended December 31, 2005, the Company recognized a pre-tax loss of $1.4 million (2004: $1.0 million) relating to these transfers. The Company estimates the fair value of its retained interest and computes the loss on sale using a discounted cash flow model. The key assumptions underlying this model are:
december 31, 2005 range for year ended 2005
Cost of funds 2.96% 2.81% - 3.49%Weighted average life in days 32.8 29.7 - 36.6Average credit loss ratio 0.0092% (0.0004)% - 0.084%Average dilution ratio 9.66% 5.63% - 9.84%Servicing fee rate 2.0%Fair value of retained interest $6.9 million
The impact of an immediate 10 percent and 20 percent adverse change in the average dilution ratio on the current fair value of the retained interest would be reductions of approximately $0.5 million and $1.1 million, respectively. The impact of an immediate 10 percent and 20 percent adverse change in the weighted average life in days on the current fair value of the retained interest would be reductions of approximately $0.6 million and $1.2 million, respectively. The sensitivity of the current fair value of the retained interest or residual cash flows to an immediate 10 percent and 20 percent adverse change in each of the remaining assumptions is not significant.
The table below shows certain cash flows received from and paid to the Trust:
For years ended December 31 ($ THOUSANDS) 2005 2004
Proceeds from new securitization $ – $ 15,000Proceeds from revolving reinvestment of collections $ 495,456 $ 354,520
20. eCOnOmiC relatiOnshipsThe Company distributes and services heavy equipment and related products. The Company has dealership agreements with numerous equipment manufacturers, of which the most significant are with subsidiaries of Caterpillar Inc. Distribution and servicing of Caterpillar products account for the major portion of the Company’s operations. Finning has a strong relationship with Caterpillar Inc. that has been ongoing since 1933.
NoTES To THE CoNSoLIdATEd FINANCIAL STATEmENTS
FIN
NIN
G IN
TER
NAT
ION
AL
INC
.
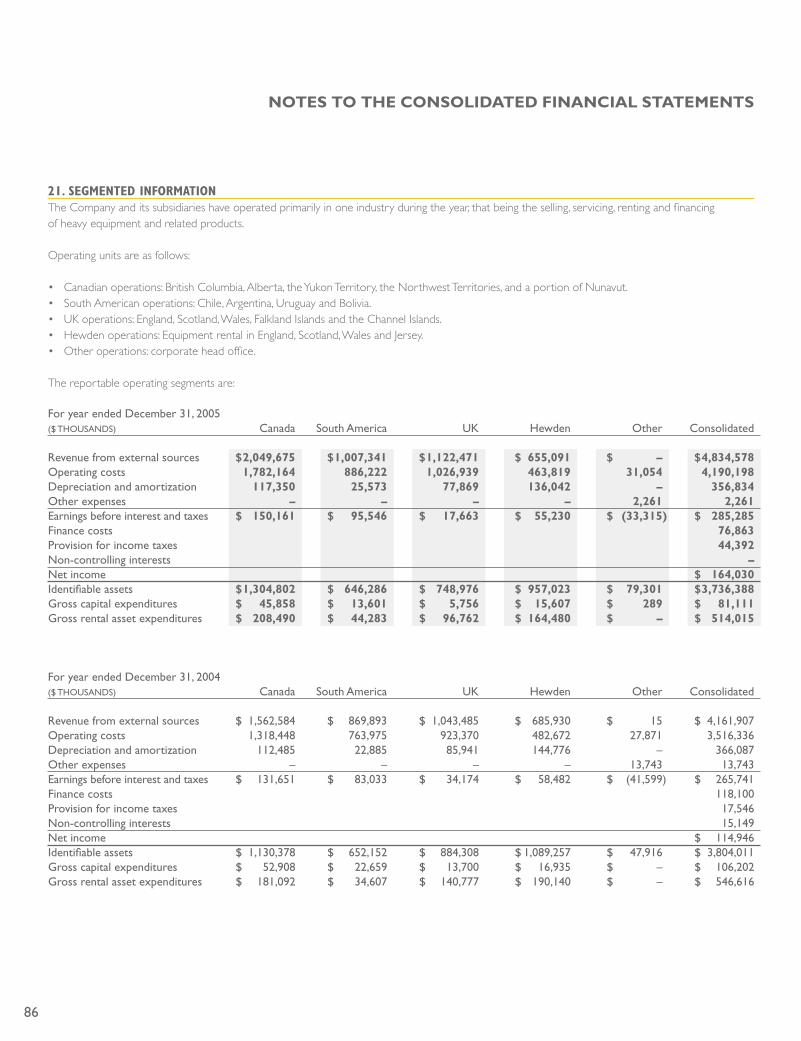
86
21. segmented infOrmatiOnThe Company and its subsidiaries have operated primarily in one industry during the year, that being the selling, servicing, renting and financing of heavy equipment and related products.
Operating units are as follows:
• Canadian operations: British Columbia, Alberta, the Yukon Territory, the Northwest Territories, and a portion of Nunavut.• South American operations: Chile, Argentina, Uruguay and Bolivia.• UK operations: England, Scotland, Wales, Falkland Islands and the Channel Islands.• Hewden operations: Equipment rental in England, Scotland, Wales and Jersey.• Other operations: corporate head office.
The reportable operating segments are:
For year ended December 31, 2005 ($ THOUSANDS) Canada South America UK Hewden Other Consolidated
Revenue from external sources $ 2,049,675 $ 1,007,341 $ 1,122,471 $ 655,091 $ – $ 4,834,578Operating costs 1,782,164 886,222 1,026,939 463,819 31,054 4,190,198Depreciation and amortization 117,350 25,573 77,869 136,042 – 356,834Other expenses – – – – 2,261 2,261Earnings before interest and taxes $ 150,161 $ 95,546 $ 17,663 $ 55,230 $ (33,315) $ 285,285Finance costs 76,863Provision for income taxes 44,392Non-controlling interests –Net income $ 164,030Identifiable assets $ 1,304,802 $ 646,286 $ 748,976 $ 957,023 $ 79,301 $ 3,736,388Gross capital expenditures $ 45,858 $ 13,601 $ 5,756 $ 15,607 $ 289 $ 81,111Gross rental asset expenditures $ 208,490 $ 44,283 $ 96,762 $ 164,480 $ – $ 514,015
For year ended December 31, 2004 ($ THOUSANDS) Canada South America UK Hewden Other Consolidated
Revenue from external sources $ 1,562,584 $ 869,893 $ 1,043,485 $ 685,930 $ 15 $ 4,161,907Operating costs 1,318,448 763,975 923,370 482,672 27,871 3,516,336Depreciation and amortization 112,485 22,885 85,941 144,776 – 366,087Other expenses – – – – 13,743 13,743Earnings before interest and taxes $ 131,651 $ 83,033 $ 34,174 $ 58,482 $ (41,599) $ 265,741Finance costs 118,100Provision for income taxes 17,546Non-controlling interests 15,149Net income $ 114,946Identifiable assets $ 1,130,378 $ 652,152 $ 884,308 $ 1,089,257 $ 47,916 $ 3,804,011Gross capital expenditures $ 52,908 $ 22,659 $ 13,700 $ 16,935 $ – $ 106,202Gross rental asset expenditures $ 181,092 $ 34,607 $ 140,777 $ 190,140 $ – $ 546,616
NoTES To THE CoNSoLIdATEd FINANCIAL STATEmENTS
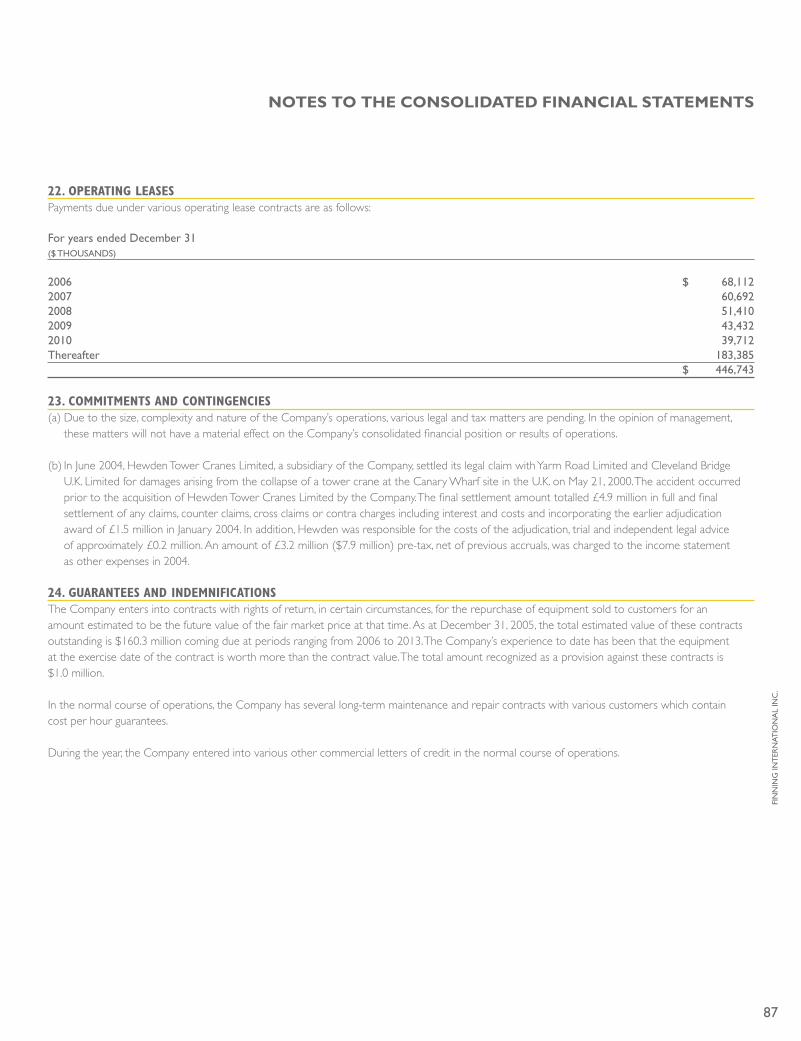
87
22. Operating leasesPayments due under various operating lease contracts are as follows:
For years ended December 31 ($ THOUSANDS)
2006 $ 68,1122007 60,6922008 51,4102009 43,4322010 39,712Thereafter 183,385 $ 446,743
23. COmmitments and COntingenCies(a) Due to the size, complexity and nature of the Company’s operations, various legal and tax matters are pending. In the opinion of management,
these matters will not have a material effect on the Company’s consolidated financial position or results of operations.
(b) In June 2004, Hewden Tower Cranes Limited, a subsidiary of the Company, settled its legal claim with Yarm Road Limited and Cleveland Bridge U.K. Limited for damages arising from the collapse of a tower crane at the Canary Wharf site in the U.K. on May 21, 2000. The accident occurred prior to the acquisition of Hewden Tower Cranes Limited by the Company. The final settlement amount totalled £4.9 million in full and final settlement of any claims, counter claims, cross claims or contra charges including interest and costs and incorporating the earlier adjudication award of £1.5 million in January 2004. In addition, Hewden was responsible for the costs of the adjudication, trial and independent legal advice of approximately £0.2 million. An amount of £3.2 million ($7.9 million) pre-tax, net of previous accruals, was charged to the income statement as other expenses in 2004.
24. guarantees and indemnifiCatiOnsThe Company enters into contracts with rights of return, in certain circumstances, for the repurchase of equipment sold to customers for an amount estimated to be the future value of the fair market price at that time. As at December 31, 2005, the total estimated value of these contracts outstanding is $160.3 million coming due at periods ranging from 2006 to 2013. The Company’s experience to date has been that the equipment at the exercise date of the contract is worth more than the contract value. The total amount recognized as a provision against these contracts is $1.0 million.
In the normal course of operations, the Company has several long-term maintenance and repair contracts with various customers which contain cost per hour guarantees.
During the year, the Company entered into various other commercial letters of credit in the normal course of operations.
NoTES To THE CoNSoLIdATEd FINANCIAL STATEmENTS
FIN
NIN
G IN
TER
NAT
ION
AL
INC
.
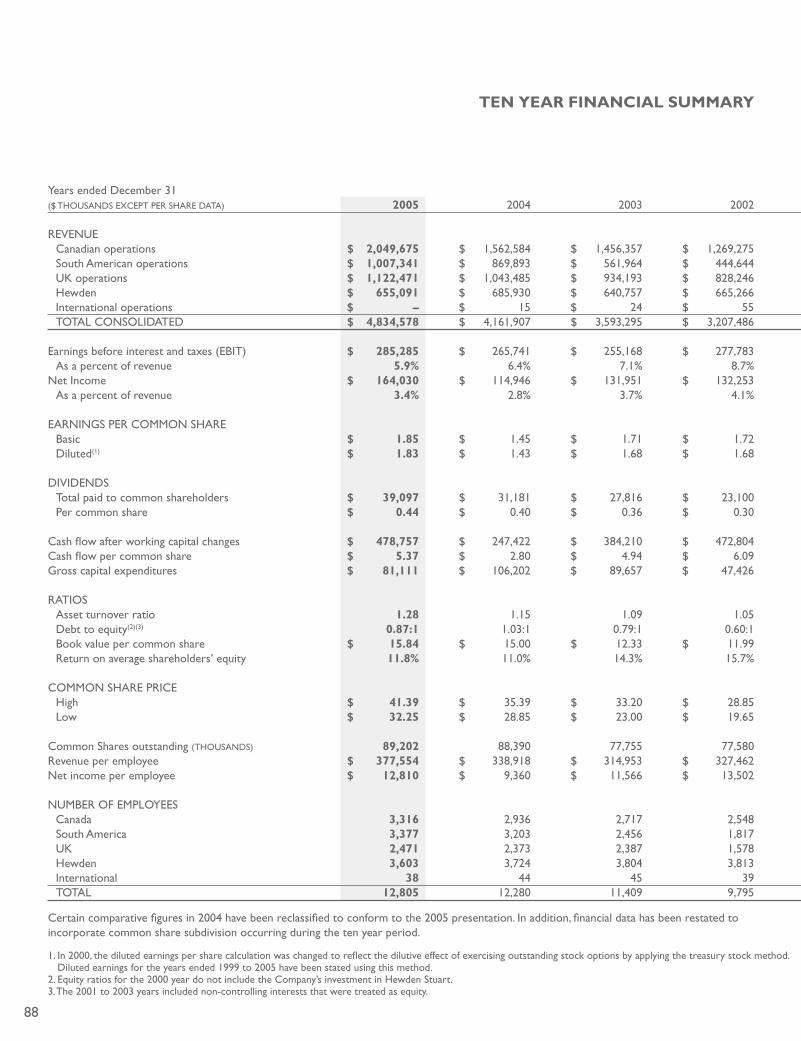
88
Years ended December 31 ($ THOUSANDS EXCEPT PER SHARE DATA) 2005 2004 2003 2002 2001 2000 1999 1998 1997 1996
REVENUE Canadian operations $ 2,049,675 $ 1,562,584 $ 1,456,357 $ 1,269,275 $ 1,398,623 $ 1,214,516 $ 1,032,922 $ 1,136,917 $ 1,146,406 $ 926,653 South American operations $ 1,007,341 $ 869,893 $ 561,964 $ 444,644 $ 448,005 $ 474,145 $ 377,777 $ 503,505 $ 514,068 $ 408,616 UK operations $ 1,122,471 $ 1,043,485 $ 934,193 $ 828,246 $ 804,084 $ 682,162 $ 712,941 $ 793,020 $ 565,376 $ 437,949 Hewden $ 655,091 $ 685,930 $ 640,757 $ 665,266 $ 587,482 $ – $ – $ – $ – $ – International operations $ – $ 15 $ 24 $ 55 $ 8,849 $ 89,209 $ 106,221 $ 151,979 $ 101,214 $ 101,491 TOTAL CONSOLIDATED $ 4,834,578 $ 4,161,907 $ 3,593,295 $ 3,207,486 $ 3,247,043 $ 2,460,032 $ 2,229,861 $ 2,585,421 $ 2,327,064 $ 1,874,709
Earnings before interest and taxes (E�IT) $ 285,285 $ 265,741 $ 255,168 $ 277,783 $ 241,601 $ 165,263 $ 148,912 $ 82,729 $ 216,625 $ 188,404 As a percent of revenue 5.9% 6.4% 7.1% 8.7% 7.4% 6.7% 6.7% 3.2% 9.3% 10.0%Net Income $ 164,030 $ 114,946 $ 131,951 $ 132,253 $ 103,917 $ 73,391 $ 59,600 $ 3,185 $ 103,695 $ 88,184 As a percent of revenue 3.4% 2.8% 3.7% 4.1% 3.2% 3.0% 2.7% 0.1% 4.5% 4.7%
EARNINGS PER COMMON SHARE �asic $ 1.85 $ 1.45 $ 1.71 $ 1.72 $ 1.37 $ 0.95 $ 0.75 $ 0.04 $ 1.32 $ 1.13 Diluted(1) $ 1.83 $ 1.43 $ 1.68 $ 1.68 $ 1.34 $ 0.94 $ 0.74 $ 0.04 $ 1.27 $ 1.09
DIVIDENDS Total paid to common shareholders $ 39,097 $ 31,181 $ 27,816 $ 23,100 $ 15,155 $ 15,452 $ 15,919 $ 15,868 $ 15,761 $ 15,600 Per common share $ 0.44 $ 0.40 $ 0.36 $ 0.30 $ 0.20 $ 0.20 $ 0.20 $ 0.20 $ 0.20 $ 0.20
Cash flow after working capital changes $ 478,757 $ 247,422 $ 384,210 $ 472,804 $ 445,623 $ 357,780 $ 438,232 $ 253,891 $ 200,397 $ 153,887Cash flow per common share $ 5.37 $ 2.80 $ 4.94 $ 6.09 $ 5.88 $ 4.72 $ 5.50 $ 3.20 $ 2.53 $ 1.96Gross capital expenditures $ 81,111 $ 106,202 $ 89,657 $ 47,426 $ 51,180 $ 15,284 $ 20,864 $ 44,176 $ 47,148 $ 43,132
RATIOS Asset turnover ratio 1.28 1.15 1.09 1.05 1.25 1.18 1.05 1.13 0.99 1.04 Debt to equity(2)(3) 0.87:1 1.03:1 0.79:1 0.60:1 0.87:1 1.04:1 1.29:1 1.67:1 1.66:1 1.50:1 �ook value per common share $ 15.84 $ 15.00 $ 12.33 $ 11.99 $ 10.23 $ 9.02 $ 8.74 $ 8.52 $ 8.69 $ 7.59 Return on average shareholders’ equity 11.8% 11.0% 14.3% 15.7% 14.1% 10.5% 8.7% 0.5% 16.2% 16.0%
COMMON SHARE PRICE High $ 41.39 $ 35.39 $ 33.20 $ 28.85 $ 20.35 $ 13.85 $ 15.40 $ 18.50 $ 20.50 $ 14.58 Low $ 32.25 $ 28.85 $ 23.00 $ 19.65 $ 12.10 $ 9.85 $ 9.00 $ 10.25 $ 14.43 $ 9.75
Common Shares outstanding (THOUSANDS) 89,202 88,390 77,755 77,580 75,816 75,790 79,737 79,426 79,091 78,547Revenue per employee $ 377,554 $ 338,918 $ 314,953 $ 327,462 $ 331,230 $ 477,120 $ 450,113 $ 492,367 $ 423,565 $ 441,940Net income per employee $ 12,810 $ 9,360 $ 11,566 $ 13,502 $ 10,601 $ 14,234 $ 12,031 $ 607 $ 18,874 $ 20,788
NUM�ER OF EMPLOYEES Canada 3,316 2,936 2,717 2,548 2,629 2,326 2,271 2,494 2,496 2,269 South America 3,377 3,203 2,456 1,817 1,516 1,390 1,259 1,354 1,228 1,008 UK 2,471 2,373 2,387 1,578 1,553 1,404 1,364 1,348 1,720 925 Hewden 3,603 3,724 3,804 3,813 4,066 – – – – – International 38 44 45 39 39 36 60 55 50 40 TOTAL 12,805 12,280 11,409 9,795 9,803 5,156 4,954 5,251 5,494 4,242
Certain comparative figures in 2004 have been reclassified to conform to the 2005 presentation. In addition, financial data has been restated to incorporate common share subdivision occurring during the ten year period.
1. In 2000, the diluted earnings per share calculation was changed to reflect the dilutive effect of exercising outstanding stock options by applying the treasury stock method. Diluted earnings for the years ended 1999 to 2005 have been stated using this method.
2. Equity ratios for the 2000 year do not include the Company’s investment in Hewden Stuart.3. The 2001 to 2003 years included non-controlling interests that were treated as equity.
TEN yEAr FINANCIAL SUmmAry
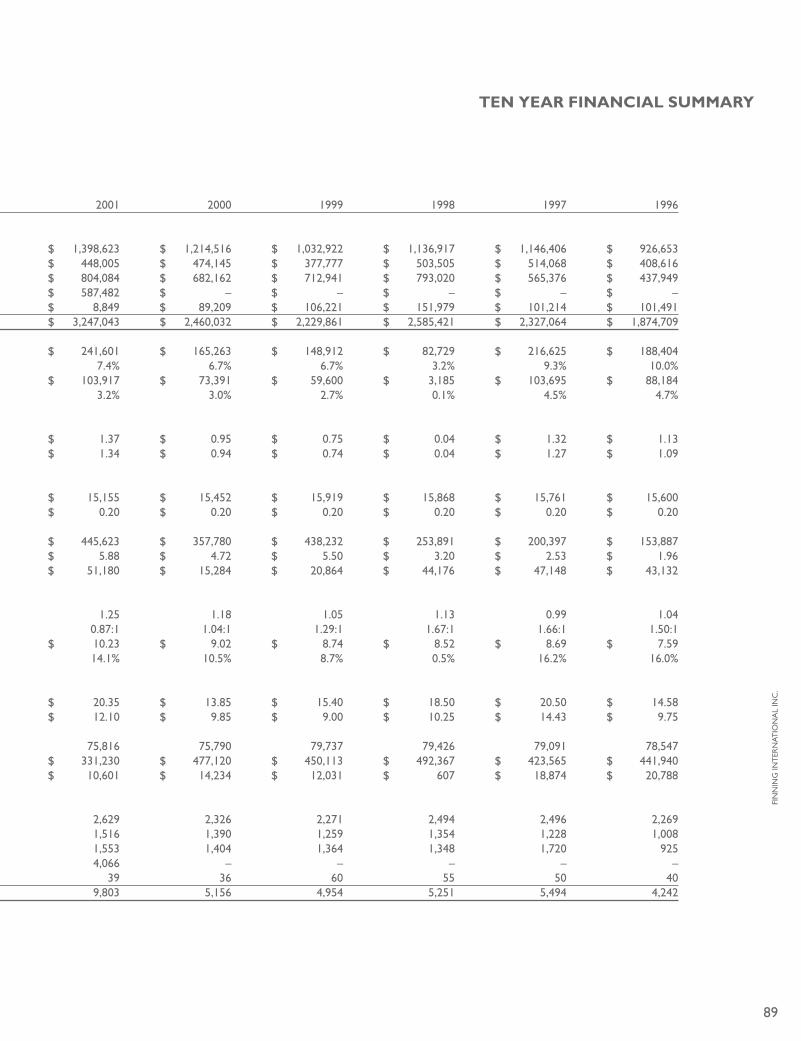
89
Years ended December 31 ($ THOUSANDS EXCEPT PER SHARE DATA) 2005 2004 2003 2002 2001 2000 1999 1998 1997 1996
REVENUE Canadian operations $ 2,049,675 $ 1,562,584 $ 1,456,357 $ 1,269,275 $ 1,398,623 $ 1,214,516 $ 1,032,922 $ 1,136,917 $ 1,146,406 $ 926,653 South American operations $ 1,007,341 $ 869,893 $ 561,964 $ 444,644 $ 448,005 $ 474,145 $ 377,777 $ 503,505 $ 514,068 $ 408,616 UK operations $ 1,122,471 $ 1,043,485 $ 934,193 $ 828,246 $ 804,084 $ 682,162 $ 712,941 $ 793,020 $ 565,376 $ 437,949 Hewden $ 655,091 $ 685,930 $ 640,757 $ 665,266 $ 587,482 $ – $ – $ – $ – $ – International operations $ – $ 15 $ 24 $ 55 $ 8,849 $ 89,209 $ 106,221 $ 151,979 $ 101,214 $ 101,491 TOTAL CONSOLIDATED $ 4,834,578 $ 4,161,907 $ 3,593,295 $ 3,207,486 $ 3,247,043 $ 2,460,032 $ 2,229,861 $ 2,585,421 $ 2,327,064 $ 1,874,709
Earnings before interest and taxes (E�IT) $ 285,285 $ 265,741 $ 255,168 $ 277,783 $ 241,601 $ 165,263 $ 148,912 $ 82,729 $ 216,625 $ 188,404 As a percent of revenue 5.9% 6.4% 7.1% 8.7% 7.4% 6.7% 6.7% 3.2% 9.3% 10.0%Net Income $ 164,030 $ 114,946 $ 131,951 $ 132,253 $ 103,917 $ 73,391 $ 59,600 $ 3,185 $ 103,695 $ 88,184 As a percent of revenue 3.4% 2.8% 3.7% 4.1% 3.2% 3.0% 2.7% 0.1% 4.5% 4.7%
EARNINGS PER COMMON SHARE �asic $ 1.85 $ 1.45 $ 1.71 $ 1.72 $ 1.37 $ 0.95 $ 0.75 $ 0.04 $ 1.32 $ 1.13 Diluted(1) $ 1.83 $ 1.43 $ 1.68 $ 1.68 $ 1.34 $ 0.94 $ 0.74 $ 0.04 $ 1.27 $ 1.09
DIVIDENDS Total paid to common shareholders $ 39,097 $ 31,181 $ 27,816 $ 23,100 $ 15,155 $ 15,452 $ 15,919 $ 15,868 $ 15,761 $ 15,600 Per common share $ 0.44 $ 0.40 $ 0.36 $ 0.30 $ 0.20 $ 0.20 $ 0.20 $ 0.20 $ 0.20 $ 0.20
Cash flow after working capital changes $ 478,757 $ 247,422 $ 384,210 $ 472,804 $ 445,623 $ 357,780 $ 438,232 $ 253,891 $ 200,397 $ 153,887Cash flow per common share $ 5.37 $ 2.80 $ 4.94 $ 6.09 $ 5.88 $ 4.72 $ 5.50 $ 3.20 $ 2.53 $ 1.96Gross capital expenditures $ 81,111 $ 106,202 $ 89,657 $ 47,426 $ 51,180 $ 15,284 $ 20,864 $ 44,176 $ 47,148 $ 43,132
RATIOS Asset turnover ratio 1.28 1.15 1.09 1.05 1.25 1.18 1.05 1.13 0.99 1.04 Debt to equity(2)(3) 0.87:1 1.03:1 0.79:1 0.60:1 0.87:1 1.04:1 1.29:1 1.67:1 1.66:1 1.50:1 �ook value per common share $ 15.84 $ 15.00 $ 12.33 $ 11.99 $ 10.23 $ 9.02 $ 8.74 $ 8.52 $ 8.69 $ 7.59 Return on average shareholders’ equity 11.8% 11.0% 14.3% 15.7% 14.1% 10.5% 8.7% 0.5% 16.2% 16.0%
COMMON SHARE PRICE High $ 41.39 $ 35.39 $ 33.20 $ 28.85 $ 20.35 $ 13.85 $ 15.40 $ 18.50 $ 20.50 $ 14.58 Low $ 32.25 $ 28.85 $ 23.00 $ 19.65 $ 12.10 $ 9.85 $ 9.00 $ 10.25 $ 14.43 $ 9.75
Common Shares outstanding (THOUSANDS) 89,202 88,390 77,755 77,580 75,816 75,790 79,737 79,426 79,091 78,547Revenue per employee $ 377,554 $ 338,918 $ 314,953 $ 327,462 $ 331,230 $ 477,120 $ 450,113 $ 492,367 $ 423,565 $ 441,940Net income per employee $ 12,810 $ 9,360 $ 11,566 $ 13,502 $ 10,601 $ 14,234 $ 12,031 $ 607 $ 18,874 $ 20,788
NUM�ER OF EMPLOYEES Canada 3,316 2,936 2,717 2,548 2,629 2,326 2,271 2,494 2,496 2,269 South America 3,377 3,203 2,456 1,817 1,516 1,390 1,259 1,354 1,228 1,008 UK 2,471 2,373 2,387 1,578 1,553 1,404 1,364 1,348 1,720 925 Hewden 3,603 3,724 3,804 3,813 4,066 – – – – – International 38 44 45 39 39 36 60 55 50 40 TOTAL 12,805 12,280 11,409 9,795 9,803 5,156 4,954 5,251 5,494 4,242
Certain comparative figures in 2004 have been reclassified to conform to the 2005 presentation. In addition, financial data has been restated to incorporate common share subdivision occurring during the ten year period.
1. In 2000, the diluted earnings per share calculation was changed to reflect the dilutive effect of exercising outstanding stock options by applying the treasury stock method. Diluted earnings for the years ended 1999 to 2005 have been stated using this method.
2. Equity ratios for the 2000 year do not include the Company’s investment in Hewden Stuart.3. The 2001 to 2003 years included non-controlling interests that were treated as equity.
TEN yEAr FINANCIAL SUmmAry
FIN
NIN
G IN
TER
NAT
ION
AL
INC
.
90
rICArdo bACArrEzASantiago, ChilePresident, Proinvest S.A.Director since: 1999Member: Audit Committee; Environmental, Health and Safety Committee
JAmES F. dINNINGCalgary, Alberta, CanadaChairman of the Board, Western Financial Group. Director of Shaw Communications Inc., Russell Metals Inc. Director since: 1997Member: Human Resources Committee; Environmental, Health and Safety Committee
TImoTHy S. HowdENMarlow, Buckinghamshire, EnglandDirector of Hyperion Insurance Group Ltd. Director since: 1998Member: Audit Committee; Environmental Health and Safety Committee
JEFFErSoN J. mooNEy Vancouver, British Columbia, CanadaChairman, A&W Food Services of Canada Inc. Director of A&W Canada Inc., A&W Trade Marks Inc., A&W Root Beer Beverages of Canada Inc., The Cadillac Fairview Corporation Limited, Ontrea Inc. and Ontrasia Inc.Director since: 2000Member: Human Resources Committee (Chairman); Corporate Governance Committee
doNALd S. o’SULLIVANCalgary, Alberta, CanadaPresident, O’Sullivan Resources Ltd. Director of National Life Assurance Company of Canada Ltd.Director since: 1991Member: Corporate Governance Committee (Chairman); Audit Committee
CoNrAd A. PINETTE (Chairman of the Board) Vancouver, British Columbia, CanadaDirector of A&W Revenue Royalties Income Fund, TimberWest Forest Corporation and Northgate Minerals Corporation.Director since: 1992Member: Corporate Governance Committee
ANdrEw H. SImoN, obE London, EnglandDirector of SGL Carbon AG, Associated British Ports Plc, Dalkia Plc and Brake Brothers Ltd. Director since: 1999Member: Audit Committee (Chairman); Corporate Governance Committee
mICHAEL T. wAITESCalgary, Alberta, CanadaExecutive Vice President, Chief Financial Officer, Canadian Pacific Railway and Chief Executive Officer, U.S. Network, Canadian Pacific Railway Director since: 2003Member: Audit Committee; Human Resources Committee
doUGLAS w.G. wHITEHEAdWest Vancouver, British Columbia, CanadaPresident and Chief Executive Officer, Finning International Inc. Director of Ballard Power Systems Inc., Kinder Morgan Inc. and The Conference Board of Canada. Director since: 1999Member: Environmental, Health and Safety Committee
JoHN m. wILLSoNVancouver, British Columbia, CanadaDirector of Nexen Inc., Pan American Silver Corporation and Aber Diamond Corporation. Director since: 2000Member: Environmental, Health and Safety Committee (Chairman); Human Resources Committee
boArd oF dIrECTorS
Please refer to the Company’s management proxy circular for complete biographies of the Finning directors.
91
CoNrAd A. PINETTECHAIRMAN OF THE BOARDFINNING INTERNATIONAL INC.
doUGLAS w.G. wHITEHEAdPRESIDENT AND CHIEF ExECUTIVE OFFICERFINNING INTERNATIONAL INC.
brIAN C. bELLPRESIDENTFINNING SOUTH AMERICA
NAdINE J. bLoCKVICE PRESIDENT,CORPORATE HUMAN RESOURCESFINNING INTERNATIONAL INC.
SEbASTIAN T. GUrIdICORPORATE SECRETARY FINNING INTERNATIONAL INC.
NICHoLAS b. LLoydMANAGING DIRECTORFINNING GROUP, UK
STEPHEN mALLETTPRESIDENT,FINNING POWER SYSTEMSFINNING INTERNATIONAL INC.
CorPorATE oFFICErS ANd EXECUTIVE mANAGEmENT
ANNA P. mArKSVICE PRESIDENT, CORPORATE CONTROLLERFINNING INTERNATIONAL INC.
THomAS m. mErINSKyVICE PRESIDENT, INVESTOR RELATIONSFINNING INTERNATIONAL INC.
IAN m. rEIdPRESIDENTFINNING (CANADA)
SHELLEy C. wILLIAmSVICE PRESIDENT, CORPORATE TREASURERFINNING INTERNATIONAL INC.
FIN
NIN
G IN
TER
NAT
ION
AL
INC
.
92
The Corporation’s Board of Directors and management are committed to the highest standards of good corporate governance and believe that such standards are central to the efficient and effective operation of the Corporation in a manner that ultimately enhances shareholder value.
�OARD MANDATE AND COMPOSITIONThe Board of Directors has overall responsibility for conduct of the business and affairs of the Corporation. The Board discharges this responsibility both directly and through delegating certain authority to committees of the Board and to senior management of the Corporation.
The Board of Directors is currently made up of 10 members. All directors, other than Douglas W.G. Whitehead (who is the President and Chief Executive Officer of the Corporation) are independent.
In order to ensure that the Board can function independently from management, the Corporation has separated the role of Chairman of the Board (currently Conrad A. Pinette) and Chief Executive Officer (currently Douglas W.G. Whitehead).
Each year the Board (with the assistance of the Corporate Governance Committee) formally reviews its own performance, the performance of each committee of the Board, the performance of the Chairman of the Board and the performance of the Chief Executive Officer. In addition, a formal process of individual director peer assessment has been adopted.
COMMITTEES OF THE �OARD OF DIRECTORSThere are currently 4 committees of the Board of Directors. Each committee operates in accordance with Board-approved terms of reference.
The Corporate Governance CommitteeThe mandate of the Corporate Governance Committee is to enhance corporate performance by assessing and making recommendations regarding Board effectiveness and by establishing a process for identifying, recruiting, appointing and re-appointing directors and providing for the on-going development of current Board members.
The Audit CommitteeThe Audit Committee provides assistance to the Board of Directors in fulfilling its oversight responsibility to the shareholders with respect to the Corporation’s: (a) financial statements; (b) financial reporting process; (c) systems of internal and disclosure controls; (d) internal audit function; (e) external auditor function; (f) financial arrangements and liquidity; and (g) risk identification, assessment and management program. It is the responsibility of the Committee to maintain an open avenue of communication between itself, the external auditors, the internal auditors and the management of the Corporation. In performing its role, the Committee is empowered to investigate any matter brought to its attention, with full access to all books, records, facilities and personnel of the Corporation. It is also empowered to retain outside counsel or other experts as required.
The Human Resources CommitteeOne of the key mandates of the Human Resources Committee is to establish a market competitive total compensation program for the executive officers and other key employees. In addition, the Human Resources Committee reviews and approves the succession plan for the Chief Executive Officer and for the executive leadership team; reviews and approves any significant changes to the organizational structure; and reviews engagement of the workforce. The Committee also reviews, with the Corporation’s management pension committee: (a) the pension fund investment strategy; (b) the choice of fund manager(s) for the Corporation’s pension funds; (c) the ongoing performance of the fund manager(s); (d) the design and benefits of the Corporation’s pension plans; and (e) contribution levels and funding status of the Corporation’s pension plans.
The Environmental, Health and Safety CommitteeThe mandate of the Committee is to encourage, assist and counsel the management of the Corporation in its drive towards attaining and maintaining a high level of performance in areas relating to the environment, health and safety. The Committee also seeks to ensure, through the management of the Corporation, that the Corporation’s employees and contractors enjoy a safe and healthy workplace.
The Company’s management proxy circular issued in connection with the 2006 Annual General Meeting and the corporate governance section of the website provide a full discussion of Finning’s corporate governance policies and practices.
CorPorATE GoVErNANCE
93
STOCK EXCHANGESThe common shares of Finning International Inc. are listed onthe Toronto Stock Exchange. Symbol: FTT
AUDITORSdeloitte & Touche LLPVancouver, Canada
SOLICITORSborden Ladner Gervais LLPVancouver, Canada
CORPORATE HEAD OFFICESuite 1000-666 �urrard StreetVancouver, Canada V6C 2X8Telephone: 604-691-6444
ANNUAL GENERAL MEETINGMay 10, 2006 11:00 am PDT
Crystal Pavilion Pan Pacific Hotel300 - 999 Canada PlaceVancouver, �ritish Columbia
VancouverComputershare510 �urrard Street2nd FloorVancouver, �.C.V6C 3�9
CORPORATE INFORMATIONThe Company prepares an Annual Information Form (AIF),which is filed with the securities commission or similar bodiesin all of the provinces of Canada. Copies of the AIF and Annualand Quarterly Reports are available to shareholders and otherinterested parties on request or can be accessed directly fromFinning’s website at www.finning.com
INVESTOR INQUIRIESInquiries relating to shares or dividends should be directed tothe Company’s Registrar and Transfer Agent. Inquiries relatingto the Company’s operating activities and financial informationshould be directed to Tom Merinsky, Vice President, InvestorRelations. Telephone 604-331-4950, Fax 604-331-4899email: [email protected]
FORWARD LOOKING STATEMENTSThis report contains forward-looking statements and information,which reflect the current view of Finning International Inc.with respect to future events and financial performance. Anysuch forward-looking statements are subject to risks anduncertainties and Finning’s actual results of operations coulddiffer materially from historical results or current expectations.Finning assumes no obligation to publicly update or revise itsforward-looking statements even if experience or futurechanges make it clear that any projected results expressed orimplied therein do not materialize.
Refer to Finning’s annual report, management information circular,annual information form and other filings with the OntarioSecurities Commission and Toronto Stock Exchange, which canbe found at www.sedar.com, for further information on risks anduncertainties that could cause actual results to differ materiallyfrom forward-looking statements contained in this report.
rEGISTrAr & TrANSFEr AGENTCOMPUTERSHARE TRUST COMPANY OF CANADA
TorontoComputershare100 University Avenue11th FloorToronto, OntarioM5J 2Y1
PhoneNorth America1-800-564-6253International514-982-7555
websitewww.computershare.com
SHArEHoLdEr INFormATIoN
www.finning.com
FINN
ING
INT
ERN
ATIO
NA
L INC
. 2005 AN
NU
AL R
EPORT