drivers of growth: evidence from sub-saharan african · pdf filethis study examines the...
TRANSCRIPT

Drivers of Growth: Evidence from
Sub-Saharan African Countries
Prepared by Manuk Ghazanchyan and Janet G. Stotsky

2013 International Monetary Fund WP/13/236
IMF Working Paper
Office of Budget and Planning
Drivers of Growth: Evidence from Sub-Saharan African Countries*
Prepared by Manuk Ghazanchyan and Janet G. Stotsky
Authorized for distribution by Janet G. Stotsky
November 2013
Abstract
This study examines the drivers of growth in Sub-Saharan African countries, using aggregate data,
from the past decade. We correlate recent growth experience to key determinants of growth,
including private and public investment, government consumption, the exchange regime and real
exchange rate, and current account liberalization, using various econometric methodologies,
including fixed and random effects models, with cluster-robust standard errors. We find that,
depending on the specification, higher private and public investments boost growth. Some
evidence is found that government consumption exerts a drag on growth and that more flexible
exchange regimes are beneficial to growth. The real exchange rate and liberalization variables are
not significant.
JEL Classification Numbers: E60, F30, F41, F43, O40, O55
Keywords: Sub-Saharan Africa, growth, exchange rate regimes, real exchange rate
Authors’ E-Mail Addresses: [email protected] and [email protected]
* We thank Isabell Adenauer, Nissim Cohen, Alfredo Cuevas, Peter van der Hoek, John L. Mikesell, and seminar
participants at the Forum for Economists International, held in Amsterdam, Netherlands on May 31–June 3, 2013
for helpful comments. Carolina Parodi, Rob Newman, Felicite Adjahouinou and Bakar Ould Abdallah provided
outstanding support.
This Working Paper should not be reported as representing the views of the IMF.
The views expressed in this Working Paper are those of the author(s) and do not necessarily represent
those of the IMF or IMF policy. Working Papers describe research in progress by the author(s) and
are published to elicit comments and to further debate.
2
Contents Page
I. Drivers of African Economic Growth ....................................................................................3 A. Introduction .....................................................................................................................3
B. Literature Review ............................................................................................................4 C. Data and Descriptive Analysis ........................................................................................6 D. Empirical Specification ...................................................................................................9 E. Conclusions and Policy Implications ............................................................................20 References ..........................................................................................................................21
Tables
1a. Growth and the Exchange Rate Regime, 1999–2011 ........................................................13
1b. Growth and the Exchange Rate Regime, Non-Oil Sample, 1999–2011 ............................14
1c. Growth and the Exchange Rate Regime, Middle and Low Income Sample,1999–2011 ...15
2a. Non-Agricultural Growth and the Exchange Rate Regime, 1999–2011 ............................17
2b. Non-Agricultural Growth and the Exchange Rate Regime, Non-Oil
Sample, 1999–2011............................................................................................................18
2c. Non-Agricultural Growth and the Exchange Rate Regime, Middle and Low Income
Sample, 1999–2011 ..........................................................................................................19
Figures
1. Real GDP Growth per Capita and Investment .......................................................................8
2. Real GDP Growth per Capita and Consumption ...................................................................8
3. Real GDP Growth per Capita and Exchange Rate Regimes (IMF de jure classification) .....8
4. Real GDP Growth per Capita and Exchange Rate Regimes (IMF de facto classification ....8
Appendixes
A. African Countries in the Sample .........................................................................................25
B. De Jure and de Facto Classification ....................................................................................31

3
I. DRIVERS OF AFRICAN ECONOMIC GROWTH
A. INTRODUCTION
The analysis of growth is central to assessing macroeconomic performance. Most
Sub-Saharan African countries have notably improved their macroeconomic performance in
recent years, as reflected in higher average growth, generally moderate and stable inflation,
and the accumulation of ample international reserve coverage. For developing countries,
investment is a critical component of growth, and other important drivers may include
characteristics of the foreign exchange regime and the real exchange rate as well as
institutional and political variables. In Africa, a key contributing factor to this improved
macroeconomic performance were the reforms that these countries undertook to strengthen
macroeconomic stability, and in doing so to liberalize their foreign exchange regimes. In the
past, the foreign exchange regimes of many of these countries shared features of illiberal
regimes once found commonly in Latin America and elsewhere, and were characterized by
administrative controls over foreign exchange allocation and current account transactions.
Persistently weak external accounts and overvalued exchange rates led to extensive foreign
exchange rationing and sizeable black market premiums.
This study focuses on assessing the drivers of growth in Sub-Saharan Africa, using aggregate
cross-section and time-series data, for the past decade, over the entire continent. Growth
analysis using aggregate data has its weaknesses, especially when dealing with a very diverse
set of countries, and any such analysis needs to be supplemented with that derived from more
micro-based data. Nonetheless, the striking improvement in growth rates in Africa over the
past decade suggest that some analysis of aggregate relationships might yield clues as to what
factors were most directly responsible for the improved performance. The value added of this
study is thus twofold: it makes use of a panel data set, with recent data on all African
countries and checks robustness of the results against model specification; and it specifically
investigates the relationship of indicators of the exchange rate regime and current account
liberalization to growth.
We find that, depending on the specification, higher private and public investments boost
growth. The lack of a robust relationship in all samples and variants may reflect a lack of
quality investments or an inability to measure growth and investment well in these countries.1
Some evidence is found that government consumption exerts a drag on growth and that more
flexible exchange regimes may be beneficial to growth. These results are generally in
accordance with our expectations. The real exchange rate and liberalization variables are not
significant. The absence of a robust relationship between the choice of the foreign exchange
regime and growth is not unusual and has been obtained in other studies on developing
1 Devarajan (2013) and Jerven (2013) discuss the limitations of aggregate African data in a special issue of the
Review of Income and Wealth.
4
countries, using aggregate data; this finding suggests that the entire macroeconomic policy
mix and not just the foreign exchange regime is critical to providing an environment
conducive to growth. The absence of a clear relationship between the real exchange rate and
growth may reflect in part the difficulty in constructing an accurate measure of our CPI-
based real exchange rates in these countries, especially in view of the poor quality of
inflation data.
Section B reviews the literature. Section C describes the data and presents a descriptive
analysis. Sections D and E present our results and Section F concludes.
B. Literature Review
Aghion and Howitt (2009), the Commission on Growth and Development (2008), and Barro
and Sala-i-Martin (2004) survey the extensive literature on the determinants of growth.2 In
Empirical modeling has found a robust relationship between investment (both human and
nonhuman) and growth. Drawing upon an augmented Solow model of growth, Mankiw,
Romer, and Weil (1992) find that investment, education, and population growth play a
significant role in explaining cross-country growth. Levine and Renelt (1992) find that
investment share in GDP is the most robust determinant of growth. Real exchange rates and
institutional features also figure prominently as empirical determinants of growth.
A growing body of literature tries to explain the recent growth experience of low income
countries and more specifically, African countries. Some recent studies include Guerguil and
others (2011), IMF (2012), IMF (2013), Jaunky (2013), Johnson, Ostry, and Subramanian
(2007), Mijiyawa (2013), Patillo, Gupta, and Carey (2006), and Stotsky and others (2012).
This research shows that Sub-Saharan African countries have made progress in sustaining
macroeconomic stability and liberalizing foreign exchange regimes but still face challenges
to improve institutions, reduce regulatory barriers, strengthen human capital and health, and
avoid overvalued exchange rates. Natural resource exporters have enjoyed robust growth, in
the face of significant foreign direct investments while the experience of the non-resource
based economies has been more varied. So far, no clear consensus has emerged on exactly
what factors have been most responsible for driving the African growth pick-up and for
sustaining growth. And it appears that there is a combination of factors, which are to some
extent idiosyncratic to each country. The poor quality of African institutions was once
thought to be a key hindrance to growth (Collier and Gunning, 1999). However, with the
improvement over the past few decades of the institutions specifically responsible for
macroeconomic management and the increasing autonomy of central banks, which have
underpinned greater macroeconomic stability and stable inflation, other factors are beginning
to emerge as key drivers of and hindrances to growth. Economic factors include investment
2 Agenor and Montiel (1996) bring in an explicit development macroeconomics dimension.
5
in human and physical capital, greater trade openness, avoidance of overvalued exchange
rates, and greater financial development or availability of credit; institutional and cultural
factors include democratization, reduction of ethnic friction, and greater gender equality.
We bring focus in our analysis to the relationship of foreign exchange regimes to growth.
Rose (2011), Klein and Shambaugh (2010), and Ghosh, Gulde, and Wolf (2002) survey key
ideas that form the background to a study of foreign exchange regimes. Monetary neutrality
suggests that the nominal exchange rate regime should have no bearing on long-run
economic growth. On the other hand, the exchange rate regime influences how countries
adjust to real and nominal shocks and hence it may have some bearing on growth. It is
generally considered advantageous for countries that experience significant real shocks to use
floating exchange rates, which allows relative price adjustment to take place through
adjustments of the nominal exchange rate, whereas it is considered advantageous for
countries experiencing significant nominal shocks to adopt fixed exchange regimes. A range
of other considerations are relevant to this discussion, including the transparency and
credibility of the central bank, the incentives of different regimes for fiscal discipline, and
various microeconomic arguments related to the workings of the foreign exchange market.
Theoretically, the choice of regime may influence growth through its indirect effect on
investment, productivity, and international trade. Uncertainty is a key consideration in this
indirect chain. A pegged exchange rate regime may increase confidence and reduce
uncertainty and transaction costs, thus boosting investment, productivity, and trade, while
uncertainty about exchange rates, under floating regimes, may create a damper to investment.
However, if a peg is not credible or leads to overvaluation and black market premiums, as
was observed in many African countries in the past, then it may lead to lower investment,
productivity, and trade, and hence weaken growth and competitiveness. Countries with more
developed financial markets may be better able to contain exchange rate volatility associated
with a flexible exchange rate, and thus are able to achieve the benefits of flexible rates in
terms of enhancing the ability to adjust to real shocks without sacrificing the stability that a
credible peg may entail.
Rose, Kyaw and de Vita (2011), Klein and Shambaugh, Ghosh Ostry, and Tsangarides
(2010), and Harms and Kreschmann (2009) add to empirical work on the relationship
between foreign exchange regime and growth.3 De Vita and Kyaw use a panel of developing
countries, over the 1981–2004 period, to study this relationship. They distinguish de facto
and de jure regimes. They find that after controlling for the monetary policy framework, the
regime has no significant effect on growth. Similarly, Rose, Klein and Shambaugh, and
Ghosh, Ostry, and Tsangarides reach the same conclusion, with respect to developing
countries (see also Husain, Mody, and Rogoff, 2005, Rogoff and others, 2004; and Ghosh
and others, 1997). Harms and Kreschmann, using a sample of developing countries, find
3 Petreski (2009) surveys the literature as well.

6
some benefit from less flexible regimes, but this result disappears after high inflation periods
are eliminated from the sample. In contrast, Levy-Yeyati and Sturzenegger (2003) come to
the conclusion that less flexible regimes are associated with slower growth, as well as greater
output volatility. Miles (2006) introduces a measure of the black market premium, into the
standard regression setup, and finds that this eliminates the effect of the exchange regime. In
sum, the preponderance of empirical work suggests that the regime does not have a
significant effect on growth, once other relevant variables are taken into account, in
developing countries, but this finding is not uniform and some studies have found that more
flexible regimes are better for growth.
These studies have not explored another important dimension of the foreign exchange
regime, the degree to which the country has liberalized its current account. Liberalization
may on its own exert an effect on growth by creating an atmosphere that is more conducive
to development of trade and export-oriented industry. It may sometimes be difficult to
ascertain whether a country has liberalized its current account, because there are many
aspects to this determination and there may also be substantial gaps between the laws and
regulations and practices, as with the exchange rate regime. The best measure of
liberalization on a de jure basis is whether the country has accepted Article VIII status of the
IMF’s Articles of Agreement and the de facto adherence is something that IMF country
teams assess in conjunction with the relevant authorities.
Finally, the real effective exchange rate is a key component of macroeconomic policy. There
is evidence that overvaluation is bad for growth and some more limited evidence that
undervaluation may be beneficial for growth. Johnson, Ostry, and Subramanian (2007),
Rodrik (2008), and Berg and Miao (2010) cover these issues in depth, in the developing
country and specifically African context.
C. Data and Descriptive Analysis
Data
The sample for our study covers annual observations for 42 African countries over the period
1999–2011. 4 The sample excludes the Democratic Republic of Congo and Zimbabwe owing
to their historically high inflation episodes and freely falling currencies. We group the
countries into three samples: a full sample, a sample excluding oil exporters, and a sample
that includes only middle and low income countries. The sample includes the countries in the
regional unions of the West African Economic and Monetary Union (WAEMU), the
Economic Community of Central African States (CEMAC), and the Common Monetary Area
(CMA).
4 See Appendix A for a description of the data and summary statistics.

7
In constructing our measure of foreign exchange regime, this study distinguishes between de
jure and de facto foreign exchange regimes, as indicated in the IMF’s Annual Report on
Exchange Arrangements and Exchange Restrictions (AREAER). The de jure classification
reflects the officially announced exchange rate regime and the de facto classification, the
actual policies in place at that time. We map the IMF classifications into three regimes (i.e.,
pegged, intermediate, and floating).5 The de jure and de facto classifications are positively
correlated, in our sample, with a correlation coefficient of 0.85. Several other approaches rely
on economic outcome data to distinguish de jure from de facto regimes. Levy-Yeyati and
Sturzenegger (2005) use data on changes in nominal exchange rates, the volatility of these
changes, and the volatility of international reserves, with cluster techniques, to group
countries into de facto regimes. Reinhart and Rogoff (2004) rely on exchange rate
movements and black market data, which were not available for our sample. In view of the
difficulty in classifying intermediate regimes, we also conduct robustness checks on the
regime classifications, following Eichengreen and Razo-Garcia (2011). We find no
substantive difference in our results with these variants. Another approach is to substitute an
index that increments by one for each type of regime, ordered from least to most flexible, in
place of the dummy variables for the types of regimes. We use both linear and quadratic
forms and again find results consistent with our baseline findings. For current account
liberalization, we use the IMF’s AREAER de facto classification to characterize current
accounts as liberalized or not.
Descriptive analysis
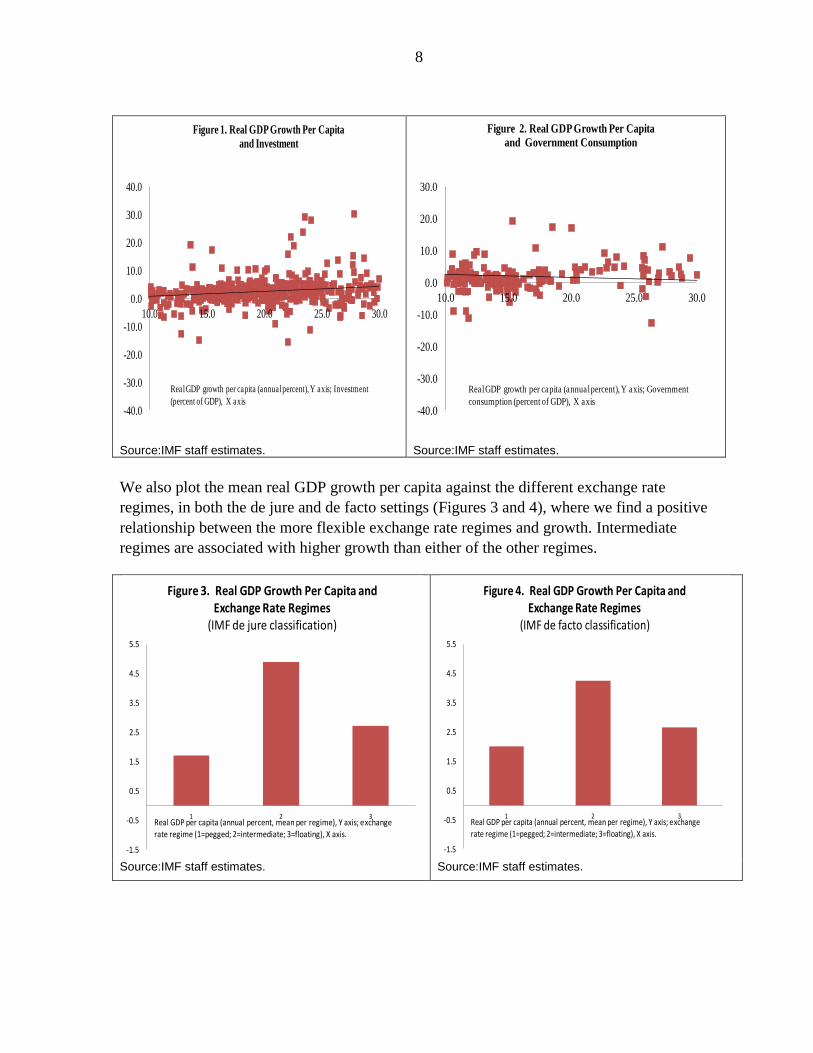
We present some simple scatter plots to examine the relationship between our variables of
interest and growth. Figure 1 plots investment share in GDP against real GDP per capita
while Figure 2 plots government consumption share. We find a direct association between
investment and growth, and an inverse association between government consumption and
growth, though in both cases the correlations appear weak.
5 See Appendix B for the methodology of exchange regime classifications.
8
Source:IMF staff estimates. Source:IMF staff estimates.
We also plot the mean real GDP growth per capita against the different exchange rate
regimes, in both the de jure and de facto settings (Figures 3 and 4), where we find a positive
relationship between the more flexible exchange rate regimes and growth. Intermediate
regimes are associated with higher growth than either of the other regimes.
Source:IMF staff estimates. Source:IMF staff estimates.
-40.0
-30.0
-20.0
-10.0
0.0
10.0
20.0
30.0
40.0
10.0 15.0 20.0 25.0 30.0
Figure 1. Real GDP Growth Per Capita
and Investment
Real GDP growth per capita (annual percent), Y axis; Investment
(percent of GDP), X axis -40.0
-30.0
-20.0
-10.0
0.0
10.0
20.0
30.0
10.0 15.0 20.0 25.0 30.0
Figure 2. Real GDP Growth Per Capita
and Government Consumption
Real GDP growth per capita (annual percent), Y axis; Government
consumption (percent of GDP), X axis
-1.5
-0.5
0.5
1.5
2.5
3.5
4.5
5.5
1 2 3
Figure 3. Real GDP Growth Per Capita and Exchange Rate Regimes
(IMF de jure classification)
Real GDP per capita (annual percent, mean per regime), Y axis; exchange rate regime (1=pegged; 2=intermediate; 3=floating), X axis.
-1.5
-0.5
0.5
1.5
2.5
3.5
4.5
5.5
1 2 3
Figure 4. Real GDP Growth Per Capita and Exchange Rate Regimes
(IMF de facto classification)
Real GDP per capita (annual percent, mean per regime), Y axis; exchange rate regime (1=pegged; 2=intermediate; 3=floating), X axis.

9
D. Empirical Specification
The set-up
Our econometric results are based on estimating the following equation:6
Growth i,t = α X
i,t + β R
i,t + σ
i + γ
t + ε
i,t (1)
In equation (1), Growthi,t
is the growth rate of real GDP per capita or the growth rate of non-
agricultural real GDP per capita of country i in year t; Xi,t
is a vector of explanatory variables,
described below; R i,t
is a vector of foreign exchange regime dummies, where the coefficients
represent the performance of flexible foreign exchange regimes relative to a pegged regime,
which is the omitted category; σi are country specific effects; γ
t are time specific effects; ε
i,t
are error terms; and α and β are parameters to be estimated. We run our estimations for
pooled ordinary least squares (OLS), cross-sectional fixed effects, time-and cross-sectional
fixed effects and random effects models.7
For the explanatory variables, we draw upon the rich empirical literature in this field, keeping
in mind the limitations of the data from these countries, especially regarding the investment
variables. We use private and public investment in GDP as measures of factor inputs, where
we would expect a higher share of investment should lead to higher growth. We use lagged
investment in our analysis, following some previous studies, to capture supply side effects.
We also use government consumption in GDP as an explanatory variable, which we expect
would have an ambiguous effect on growth for the following reasons. From a demand
perspective, higher government spending may stimulate growth, but if excessive, may lead to
higher inflation rather than growth. From a supply perspective, public investment spending,
on either physical or human capital, may induce higher growth. However, wasteful spending,
such as on excessive compensation to civil servants or unproductive state enterprises, might
lead to lower growth.
Following the open economy variants of the literature, the real exchange rate is expected to
be a determinant of growth; hence in this analysis, we use the change in the real effective
exchange rate as an explanatory variable, though its effect is uncertain. Countries that are
growing more rapidly tend to experience exchange rate appreciation. Hence an appreciating
real exchange rate may not necessarily reduce competitiveness. Unfortunately, we have no
6 We use annual data because data with a higher frequency are not available for key variables.
7 We used STATA programming language in our research, and the following program codes: OLS (regress,
robust); cross-sectional, fixed effects (xtivreg2, fe bw (5)), time and cross-sectional, fixed effects
(xtivreg2…dum* (year), fe bw (5)), both corrected for arbitrary autocorrelation up to the 4th
order, with the
assumption of homoskedasticity, and random effects (xtreg, re).

10
good measures of productivity in most of these African countries. In some analyses, relative
per capita income is used as a measure of productivity, but we have some doubts about its
value in the African context, where a large part of activity is smallholder farming. Hence, we
simply use the change in the real exchange rate. We would expect an appreciating real
effective exchange rate to have a negative effect on growth and a depreciating, a positive
effect. With regard to the variables characterizing the foreign exchange regime, we would
expect that a liberalized current account would raise growth, if it leads to greater trade and
more certain access to foreign currency, thus improving business conditions. Our priors are
that a more flexible exchange rate regime should be beneficial for countries that are buffeted
by real shocks, which tends to be characteristic of African economies that heavily dependent
on subsistence agriculture. Nonetheless, there are arguments in favor of a fixed exchange rate
for those countries with weak central bank credibility or with close trade or financial
relations to one dominant hard currency (e.g., the Francophone countries in Central and West
Africa, which retain close economic links to France).
For the independent variables, private and public investment (Private Inv and Public Inv) and
government consumption (Govc), the shares in GDP are taken from national accounts data.
The change in the real effective exchange rate (cREER) is measured with the exchange rate
expressed as US dolla rs per nat ional currency (hence an increase means an appreciat ion
of the nat ional cur rency). Current account liberalization (Liberalization) is taken from
AREAER data, where 1 indicates a liberalized current account, on a de facto basis, and the
constrained regimes are the omitted category. The exchange rate regime dummies for
intermediate and floating de facto (Intdefacto and Flexdefacto) and de jure regimes (Intdejure
and Flexdejure) are used to measure the impact of the regime on growth, with the pegged
exchange rate regime treated as the omitted regime.
It would be interesting to assess the effect on growth of distortions in the foreign exchange
regime distortion as opposed to just the regime, itself, because of the profound
macroeconomic imbalances that distorted regimes produced in these countries. However,
given the data deficiencies, we could only construct measures that would have a sizeable
measurement error. For instance, we could not devise an accurate and consistent way to
measure the black market premium, without collecting for each country detailed informal
exchange rate information that are not available in published sources. Similarly, observations
where the de jure and de facto exchange regime classification differ might only reflect a gap
between the law and practice but not necessarily a distortion, such as would result in
rationing of foreign exchange or a black market premium. We thus do not draw any
conclusions from our empirical work about the effect of distortions, as opposed to regimes.
Over the period of the sample, there are only a relatively modest number of foreign exchange
regime changes (i.e., there are nine instances of countries experiencing a regime change out
of 42 countries in the de jure setting and 21 in the de facto setting). Having said this, we do
not find that the panel data display any problems of multicollinearity and hence we include
both regime and country fixed effects in the final specification.

11
Results
We present our results below for the two dependent variables, overall real GDP and non-
agricultural real GDP growth per capita and for the full, non-oil, and middle- and low-income
samples of countries. Within each table, we present two columns for each of the various
econometric specifications (i.e., pooled OLS, cross-section fixed effects, time- and cross-
section fixed effects, and random effects). The first column uses dummy variables derived
from the IMF de jure foreign exchange regime classification and the second column the IMF
de facto regime classification.
Our preferred model is the time-and cross-section, fixed effects estimator.8,9
We assume that
errors are homoskedastic and correct for autocorrelation. We do not correct for possible
heteroskedasticity owing to the small number of cross-sectional units. However, the
dependent variable is already scaled by size, thus reducing the possibility of serious bias. We
explored variations on the exchange regime classification scheme and also, using an index
variable rather than dummy variables for regimes, but found the results were similar.10
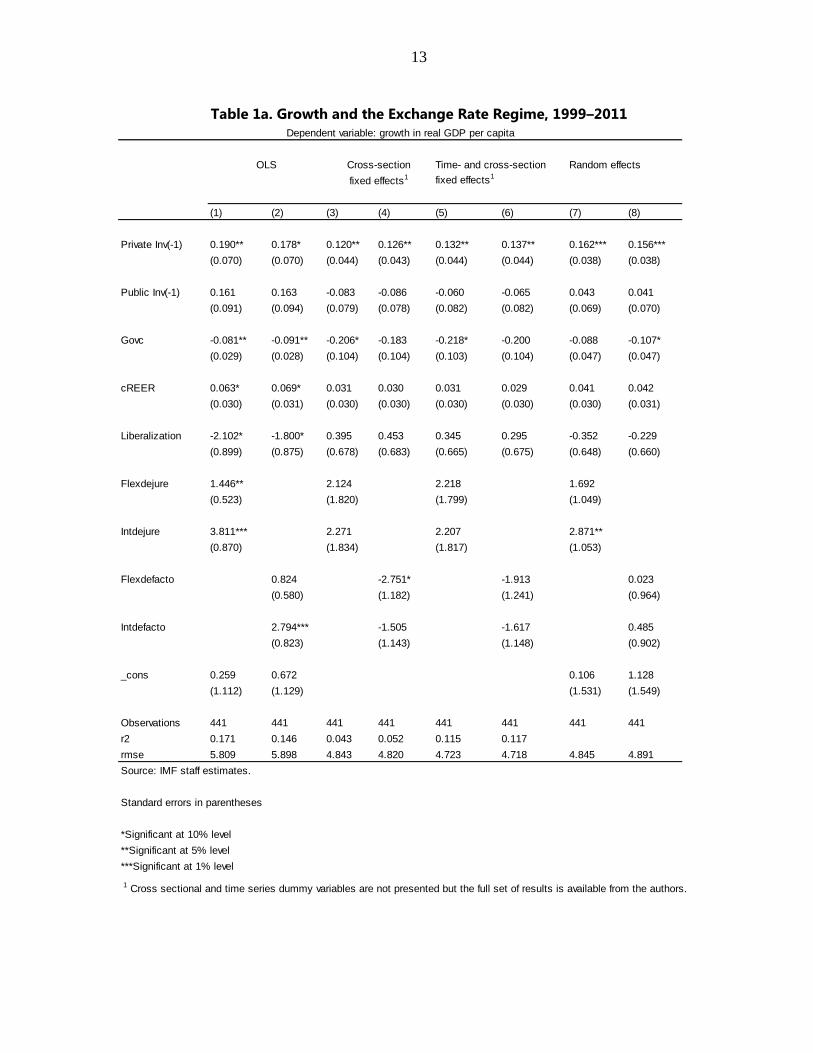
Overall real GDP growth per capita
Table 1a presents the results for the full sample of African countries for the dependent
variable, overall real GDP growth per capita. We concentrate our discussion columns 5 and
6, which refer to the time- and cross-section fixed effects results and columns 7 and 8, which
refer to the random effects results. The signs of the control variables are broadly as expected,
though the lack of significance is noteworthy. Lagged private investment has a positive and
significant effect on growth. An increase of private investment share in nominal GDP by 1
percentage point (say, from 26 percent of GDP to 27 percent of GDP), increases the rate of
growth per capita by a little over one-tenth of a percentage point. IMF (2013, p. 110) also
finds that growth takeoffs in today’s low-income countries have been achieved with lower
investment than in the past, not inconsistent with our finding that the relationship between
investment and growth is weaker than anticipated. In the de jure specification, we find that
government consumption has a significantly negative effect and the coefficient implies that
an increase of government consumption share in GDP by 1 percentage point decreases the
8 Our robustness checks showed that the fixed effects model is preferred to the pooled OLS regression model.
The F-statistic (Durbin-Wu-Hausman) strongly rejects the null of consistency and full efficiency of OLS results
compared to the fixed effects model. We also rejected the appropriateness of the random effects estimator with
the standard Hausman test, and by also observing higher correlation of country level individual effects with the
independent variables after running the fixed effects model. Nonetheless, we report the results of the random
effects model.
9 Our robustness tests soundly rejected the time invariance of our models, which means that the two-way, fixed
effects model is the preferred one.
10 The results are available from the authors upon request.

12
rate of growth per capita by about one-fifth of a percentage point. The change in the real
effective exchange rate and the liberalization and regime dummies are not significant. The
random effects specifications present the same positive effect of private investment, though
the marginal effect is greater. Government consumption is negative and significant, but in
contrast to the fixed effects results, only in the de facto specification. In the de jure
specification, the intermediate regime dummy is positive and significant and the marginal
effect is sizeable. Correction for endogeneity of investment and the use of a longer lag length
produce similar results. 11
We tried several variants on this basic specification to incorporate institutional or other
economic features of the countries. The inclusion of population growth, education, country
size, openness and political risk as explanatory variables did not change the key results.
Although we did find that initial income was strongly negative and significant, suggestive of
some degree of convergence of income over time, this variable is time invariant and hence
would need to be dropped in the specification that included country fixed effects, our
preferred specification.
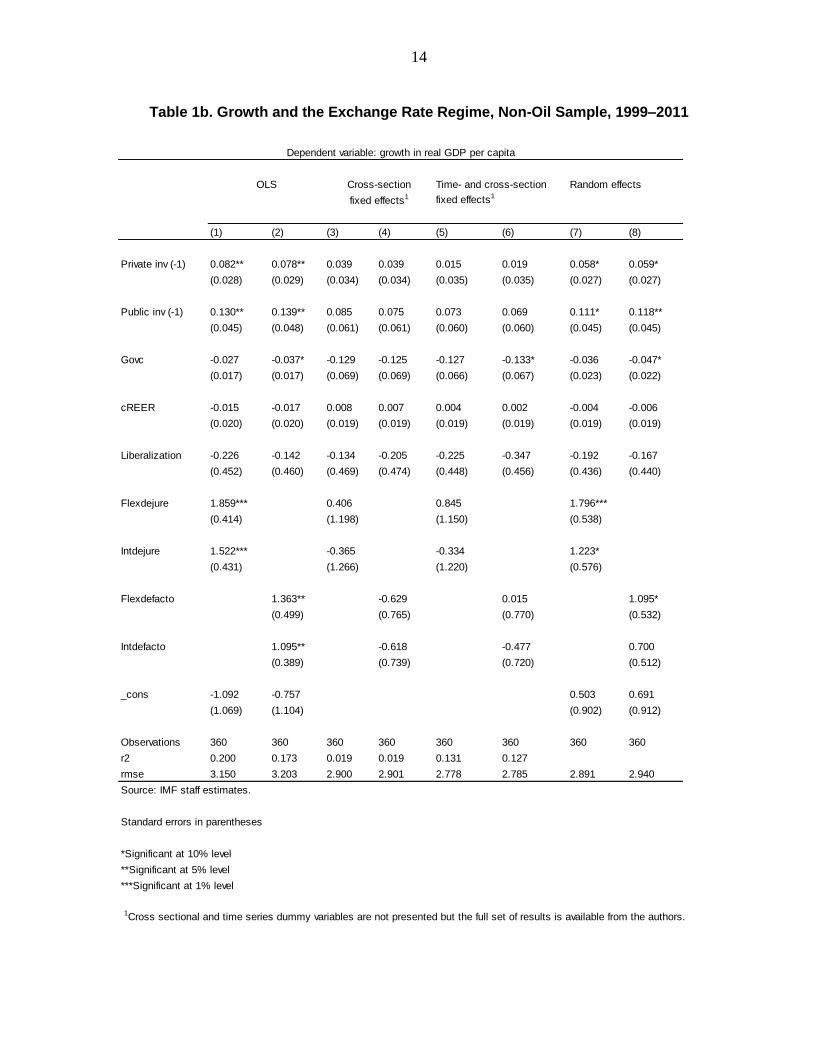
Table 1b presents the results for overall real GDP growth per capita for the non-oil country
sample, where the coefficients for private investment are no longer significant in explaining
growth in the fixed effect specifications (columns 5 and 6), though they remain marginally
significant in the random effects specifications (columns 7 and 8). These results may reflect a
combination of genuine economic differences as well as the significantly loss of sample size
and perhaps an overall poorer quality of data in the non-oil countries. Interestingly, in
contrast to the full sample, we find that public investment is positive and significant, but only
in the random effects specifications. This may suggest that the quality of public investment is
better in non-oil countries, hence leading to a stronger linkage between public investment and
growth, in this sample. In addition, in the low-income countries, the private sector may not
yet have the confidence to lead large investment projects and hence the government remains
a key investor for capital projects. Government consumption is negative and significant in the
de facto specifications (columns 6 and 8). The exchange regime variables are not significant
in the fixed effects specification though both of the flexible regime dummy variables are
positive and significant in the random effects de jure specifications (column 7).
Table 1c presents the results for the sample for middle- and low-income African countries.
We observe that private investment is no longer statistically significant while public
investment is again positive and significant in the random effects specifications. Government
consumption is negative and significant only in the fixed effects de jure specification. The
foreign exchange and liberalization variables are not significant.
11
Rose (2011) in his survey finds few systematic differences between the higher income countries (measured by
real GDP per capita) and their exchange rage regimes. Hence we do not formally assess endogeneity of the
exchange rate regime.
13
Table 1a. Growth and the Exchange Rate Regime, 1999–2011
Time- and cross-section Random effects
fixed effects1
(1) (2) (3) (4) (5) (6) (7) (8)
Private Inv(-1) 0.190** 0.178* 0.120** 0.126** 0.132** 0.137** 0.162*** 0.156***
(0.070) (0.070) (0.044) (0.043) (0.044) (0.044) (0.038) (0.038)
Public Inv(-1) 0.161 0.163 -0.083 -0.086 -0.060 -0.065 0.043 0.041
(0.091) (0.094) (0.079) (0.078) (0.082) (0.082) (0.069) (0.070)
Govc -0.081** -0.091** -0.206* -0.183 -0.218* -0.200 -0.088 -0.107*
(0.029) (0.028) (0.104) (0.104) (0.103) (0.104) (0.047) (0.047)
cREER 0.063* 0.069* 0.031 0.030 0.031 0.029 0.041 0.042
(0.030) (0.031) (0.030) (0.030) (0.030) (0.030) (0.030) (0.031)
Liberalization -2.102* -1.800* 0.395 0.453 0.345 0.295 -0.352 -0.229
(0.899) (0.875) (0.678) (0.683) (0.665) (0.675) (0.648) (0.660)
Flexdejure 1.446** 2.124 2.218 1.692
(0.523) (1.820) (1.799) (1.049)
Intdejure 3.811*** 2.271 2.207 2.871**
(0.870) (1.834) (1.817) (1.053)
Flexdefacto 0.824 -2.751* -1.913 0.023
(0.580) (1.182) (1.241) (0.964)
Intdefacto 2.794*** -1.505 -1.617 0.485
(0.823) (1.143) (1.148) (0.902)
_cons 0.259 0.672 0.106 1.128
(1.112) (1.129) (1.531) (1.549)
Observations 441 441 441 441 441 441 441 441
r2 0.171 0.146 0.043 0.052 0.115 0.117
rmse 5.809 5.898 4.843 4.820 4.723 4.718 4.845 4.891
Source: IMF staff estimates.
Standard errors in parentheses
*Significant at 10% level
**Significant at 5% level
***Significant at 1% level
1 Cross sectional and time series dummy variables are not presented but the full set of results is available from the authors.
Dependent variable: growth in real GDP per capita
OLS
fixed effects1
Cross-section
14
Table 1b. Growth and the Exchange Rate Regime, Non-Oil Sample, 1999–2011
Time- and cross-section Random effects
fixed effects1
(1) (2) (3) (4) (5) (6) (7) (8)
Private inv (-1) 0.082** 0.078** 0.039 0.039 0.015 0.019 0.058* 0.059*
(0.028) (0.029) (0.034) (0.034) (0.035) (0.035) (0.027) (0.027)
Public inv (-1) 0.130** 0.139** 0.085 0.075 0.073 0.069 0.111* 0.118**
(0.045) (0.048) (0.061) (0.061) (0.060) (0.060) (0.045) (0.045)
Govc -0.027 -0.037* -0.129 -0.125 -0.127 -0.133* -0.036 -0.047*
(0.017) (0.017) (0.069) (0.069) (0.066) (0.067) (0.023) (0.022)
cREER -0.015 -0.017 0.008 0.007 0.004 0.002 -0.004 -0.006
(0.020) (0.020) (0.019) (0.019) (0.019) (0.019) (0.019) (0.019)
Liberalization -0.226 -0.142 -0.134 -0.205 -0.225 -0.347 -0.192 -0.167
(0.452) (0.460) (0.469) (0.474) (0.448) (0.456) (0.436) (0.440)
Flexdejure 1.859*** 0.406 0.845 1.796***
(0.414) (1.198) (1.150) (0.538)
Intdejure 1.522*** -0.365 -0.334 1.223*
(0.431) (1.266) (1.220) (0.576)
Flexdefacto 1.363** -0.629 0.015 1.095*
(0.499) (0.765) (0.770) (0.532)
Intdefacto 1.095** -0.618 -0.477 0.700
(0.389) (0.739) (0.720) (0.512)
_cons -1.092 -0.757 0.503 0.691
(1.069) (1.104) (0.902) (0.912)
Observations 360 360 360 360 360 360 360 360
r2 0.200 0.173 0.019 0.019 0.131 0.127
rmse 3.150 3.203 2.900 2.901 2.778 2.785 2.891 2.940
Source: IMF staff estimates.
Standard errors in parentheses
*Significant at 10% level
**Significant at 5% level
***Significant at 1% level
1Cross sectional and time series dummy variables are not presented but the full set of results is available from the authors.
Dependent variable: growth in real GDP per capita
OLS
fixed effects1
Cross-section

15
Table 1c. Growth and the Exchange Rate Regime, Middle and Low Income Sample,1999–2011
Time- and cross-section Random effects
fixed effects 1
(1) (2) (3) (4) (5) (6) (7) (8)
Private inv (-1) 0.021 0.020 0.040 0.041 0.027 0.032 0.020 0.022
(0.034) (0.035) (0.044) (0.043) (0.044) (0.044) (0.039) (0.037)
Public inv (-1) 0.182*** 0.195*** 0.090 0.077 0.102 0.102 0.154* 0.171**
(0.054) (0.056) (0.078) (0.078) (0.075) (0.076) (0.065) (0.065)
Govc -0.003 -0.017 -0.264 -0.250 -0.272* -0.250 -0.009 -0.021
(0.018) (0.017) (0.141) (0.143) (0.134) (0.137) (0.031) (0.026)
cREER -0.014 -0.014 0.008 0.005 -0.000 -0.002 -0.006 -0.008
(0.024) (0.024) (0.023) (0.023) (0.023) (0.023) (0.022) (0.022)
Liberalization -0.271 -0.285 0.073 -0.005 -0.105 -0.325 -0.229 -0.308
(0.508) (0.518) (0.557) (0.566) (0.531) (0.553) (0.512) (0.517)
Flexdejure 1.289* 0.528 0.825 1.208
(0.504) (1.254) (1.195) (0.676)
Intdejure 0.857 -0.600 -0.479 0.529
(0.512) (1.343) (1.296) (0.712)
Flexdefacto 0.744 -0.725 0.371 0.649
(0.580) (0.857) (0.865) (0.610)
Intdefacto 0.418 -0.486 -0.378 0.091
(0.496) (0.836) (0.821) (0.588)
_cons 1.504 1.873 1.398 1.509
(1.110) (1.134) (1.254) (1.243)
Observations 263 263 263 263 263 263 263 263
r2 0.158 0.141 0.029 0.026 0.160 0.156
rmse 3.074 3.105 3.035 3.040 2.893 2.900 2.889 2.947
Source: IMF staff estimates.
Standard errors in parentheses
*Significant at 10% level
**Significant at 5% level
***Significant at 1% level
1 Cross sectional and time series dummy variables are not presented but the full set of results is available from the authors.
Dependent variable: growth in real GDP per capita
OLS
fixed effects 1
Cross-section
16
Non-agricultural real GDP growth per capita
We now turn to the results for non-agricultural real GDP growth per capita. Table 2a presents
the results for the full sample. Similar to the results for overall real GDP, we find that lagged
private investment is positive and significant, with somewhat higher marginal effects. This
holds true across both the fixed and random effects specifications (columns 5–8). It is
intuitively plausible that private investment has a larger marginal effect on growth excluding
agriculture, because much of the growth in the oil exporters as well in some other rapidly
growing African countries is in sectors other than agriculture. Government consumption and
the liberalization and change in the real exchange rate variables are not significant. The
flexible regime variables are positive and significant in the random effects de jure
specification (column 7), similar to the earlier results as well.
Table 2b presents the results for non-agricultural real GDP growth per capita for the non-oil
country sample, where again we find, as with overall GDP, a diminished significance of
private investment. The random effects specification indicates a marginal positive and
significant effect of this investment. The only other significant variables are the flexible
regime dummies in the random effects de jure specification and the most flexible regime
dummy in the de facto specification. In Table 2c, which shows the results for the middle- and
low-income sample, no variable is statistically significant except the most flexible regime
dummy in the random effects de jure specification.

17
Table 2a. Non-Agricultural Growth and the Exchange Rate Regime, 1999–2011
Random effects
fixed effects 1
(1) (2) (3) (4) (5) (6) (7) (8)
Private inv (-1) 0.286** 0.267** 0.229*** 0.221*** 0.241*** 0.238*** 0.281*** 0.266***
(0.088) (0.088) (0.065) (0.065) (0.065) (0.065) (0.047) (0.047)
Public inv (-1) 0.024 0.025 -0.054 -0.083 -0.040 -0.053 0.022 0.026
(0.081) (0.083) (0.140) (0.142) (0.145) (0.148) (0.093) (0.093)
Govc -0.017 -0.040 -0.181 -0.177 -0.182 -0.193 -0.023 -0.040
(0.028) (0.028) (0.151) (0.154) (0.151) (0.153) (0.047) (0.045)
cREER 0.036 0.034 0.020 0.012 0.033 0.029 0.045 0.044
(0.040) (0.041) (0.043) (0.043) (0.043) (0.043) (0.042) (0.042)
Liberalization -0.500 -0.334 -0.088 -0.259 -0.216 -0.452 -0.412 -0.399
(1.028) (1.059) (1.065) (1.083) (1.060) (1.077) (0.947) (0.956)
Flexdejure 2.697** 1.173 3.475 3.033**
(0.919) (4.445) (4.447) (1.177)
Intdejure 2.766** -2.788 -0.557 2.456*
(0.859) (4.312) (4.330) (1.140)
Flexdefacto 1.115 -1.773 0.062 1.816
(1.003) (1.829) (1.962) (1.171)
Intdefacto 2.064** -1.197 -1.099 1.218
(0.786) (1.753) (1.758) (1.070)
_cons -1.345 -0.356 -0.737 0.007
(1.691) (1.678) (2.422) (2.473)
Observations 356 356 356 356 356 356 356 356
r2 0.125 0.107 0.058 0.048 0.136 0.126
rmse 6.963 7.033 6.593 6.626 6.426 6.464 6.509 6.588
Source: IMF staff estimates.
Standard errors in parentheses
*Significant at 10% level
**Significant at 5% level
***Significant at 1% level
1 Cross sectional and time series dummy variables are not presented but the full set of results is available from the authors.
Dependent variable: growth in real GDP (non agricultural) per capita
OLS Time- and cross-section
fixed effects 1
Cross-section

18
Table 2b. Non-Agricultural Growth and the Exchange Rate Regime, Non-Oil Sample, 1999–2011
Random effects
fixed effects 1
(1) (2) (3) (4) (5) (6) (7) (8)
Private inv (-1) 0.119* 0.102* 0.030 0.019 -0.006 -0.001 0.119* 0.102*
(0.050) (0.050) (0.072) (0.073) (0.075) (0.076) (0.047) (0.047)
Public inv (-1) 0.047 0.061 0.032 0.006 -0.008 -0.006 0.047 0.061
(0.069) (0.070) (0.123) (0.126) (0.125) (0.128) (0.072) (0.075)
Govc 0.008 0.000 0.018 0.009 0.052 0.023 0.008 0.000
(0.026) (0.026) (0.136) (0.139) (0.133) (0.136) (0.032) (0.032)
cREER -0.016 -0.019 0.001 -0.006 0.005 0.002 -0.016 -0.019
(0.039) (0.039) (0.037) (0.037) (0.037) (0.037) (0.037) (0.037)
Liberalization -0.606 -0.526 -1.025 -1.306 -0.976 -1.214 -0.606 -0.526
(1.225) (1.239) (1.042) (1.059) (1.035) (1.049) (0.921) (0.921)
Flexdejure 3.069*** 1.721 3.309 3.069***
(0.845) (3.654) (3.618) (0.828)
Intdejure 2.296** -2.022 -0.541 2.296**
(0.773) (3.542) (3.518) (0.858)
Flexdefacto 2.725* -0.444 1.422 2.725**
(1.063) (1.608) (1.682) (0.915)
Intdefacto 1.279 -0.719 -0.329 1.279
(0.675) (1.558) (1.537) (0.857)
_cons 1.070 1.576 1.419 1.601
(1.889) (1.936) (2.114) (2.176)
Observations 291 291 291 291 291 291 291 291
r2 0.155 0.137 0.026 0.007 0.125 0.110
rmse 5.504 5.562 5.476 5.530 5.307 5.350 5.504 5.562
Source: IMF staff estimates.
Standard errors in parentheses
*Significant at 10% level
**Significant at 5% level
***Significant at 1% level
1 Cross sectional and time series dummy variables are not presented but the full set of results is available from the authors.
Dependent variable: growth in real GDP (non agricultural) per capita
OLS Time- and cross-section
fixed effects 1
Cross-section

19
Table 2c. Non-Agricultural Growth and the Exchange Rate Regime,
Middle and Low Income Sample, 1999–2011
Random effects
fixed effects 1
(1) (2) (3) (4) (5) (6) (7) (8)
Private inv (-1) 0.048 0.034 0.034 0.015 0.063 0.059 0.048 0.034
(0.061) (0.065) (0.090) (0.091) (0.094) (0.097) (0.067) (0.067)
Public inv (-1) 0.064 0.090 0.035 -0.010 0.043 0.031 0.064 0.090
(0.101) (0.095) (0.145) (0.149) (0.146) (0.152) (0.101) (0.105)
Govc 0.036 0.014 -0.278 -0.240 -0.218 -0.186 0.036 0.014
(0.029) (0.029) (0.249) (0.259) (0.242) (0.252) (0.040) (0.038)
cREER 0.007 0.007 0.020 0.012 0.027 0.023 0.007 0.007
(0.040) (0.040) (0.041) (0.042) (0.040) (0.041) (0.041) (0.041)
Liberalization -1.430 -1.610 -1.314 -1.666 -1.214 -1.648 -1.430 -1.610
(1.189) (1.257) (1.101) (1.131) (1.091) (1.127) (1.016) (1.013)
Flexdejure 2.580** 2.331 4.454 2.580**
(0.946) (3.583) (3.548) (0.980)
Intdejure 1.773* -2.444 -0.100 1.773
(0.816) (3.448) (3.446) (0.972)
Flexdefacto 1.706 -1.152 1.411 1.706
(1.164) (1.700) (1.822) (1.026)
Intdefacto 0.524 -0.840 -0.230 0.524
(0.724) (1.682) (1.679) (0.981)
_cons 3.153 4.153 3.797 4.473
(2.154) (2.264) (2.492) (2.584)
Observations 222 222 222 222 222 222 222 222
r2 0.151 0.133 0.053 0.021 0.167 0.142
rmse 5.285 5.342 5.310 5.400 5.129 5.205 5.285 5.342
Source: IMF staff estimates.
Standard errors in parentheses
*Significant at 10% level
**Significant at 5% level
***Significant at 1% level
1 Cross sectional and time series dummy variables are not presented but the full set of results is available from the authors.
fixed effects 1
Cross-section
Dependent variable: growth in real GDP (non agricultural) per capita
OLS Time- and cross-section

20
E. Conclusions and Policy Implications
This paper examines the relationship between economic growth and various determinants of
growth, using panel data on 42 countries in Sub-Saharan Africa, during 1999–2011. We find
no robust evidence that the exchange rate regime or current account liberalization affects
growth performance, after controlling for other variables, though in some specifications more
flexible regimes are correlated with stronger growth. Private investment share in GDP is an
important determinant for growth when oil-exporting African countries are included in the
sample, perhaps reflecting a willingness of the private sector to step in when reserves and
fiscal balances are buffered by large oil revenues. When oil exporters are excluded, we find
more limited evidence for a positive effect of private investment on growth but instead some
evidence of a positive effect of public investment on growth. With regard to government
consumption, we find some evidence that higher spending as share of GDP exerts a drag on
growth, suggesting that this spending may be unproductive when it leads to padding a public
work force or subsidizing loss-making state enterprises. In some specifications, the more
flexible regime dummy variables are linked to stronger growth. In general, our results are
consistent with our expectations regarding sign and magnitude of effects.
Overall, our results suggest that the recent African growth experience has been varied and
that capital accumulation has boosted growth but that the relationship is not as strong or clear
as might be expected. Evidence for the positive effect of private investment is largely limited
to oil exporters, where its main impulse may be on the demand side. Some evidence is found
for a positive effect of public investment in the non-oil countries. The implications for policy
are that African countries should ensure that they not only invest in capital but also put in
place a framework that ensures high-quality growth-enhancing investment. Government
spending should be directed to critical priorities. Some limited evidence is found for a
positive impact of more flexible foreign exchange regimes. The change in the real effective
exchange rate and current account liberalization do not appear to be strong determinants of
growth or their effect does not clearly emerge at this aggregate level of data. However, like
investment and growth, the measure of the real effective exchange rate, relying on flawed
inflation data, may limit our ability to assess the relationship.

21
References
Agenor, Pierre-Richard and Peter J. Montiel, 1996, Development Macroeconomics
(Princeton, NJ: Princeton University Press).
Aghion, Philippe and Peter Howitt, 2009, Economics of Growth (Cambridge, MA: MIT
Press).
Arellano, Manuel, and S. Bond, 1991, “Some Tests of Specification for Panel Data: Monte
Carlo Evidence and an Application to Employment Equations,” Review of Economic
Studies, Vol. 58, No. 2, pp. 277–297.
Barro, Robert J. and Xavier Sala-i-Martin, 2004, Economic Growth (Cambridge, MA: MIT
Press).
Berg, Andrew and Yanliang Miao, 2010, “The Real Exchange Rate and Growth Revisited:
The Washington Consensus Strikes Back?” IMF Working Paper No. 10/58
(Washington, D.C.: International Monetary Fund).
Betts, Caroline and Michael B. Devereux, 1996, “The Exchange Rate in a Model of Pricing-
to-Market,” European Economic Review, Vol. 40, No. 3–5, pp. 1007–21.
Blundell, Richard and Stephen Bond, 1998, “Initial Conditions and Moment Restrictions in
Dynamic Panel Data Models,” Journal of Econometrics, Vol. 87, No. 1, pp. 111–143.
Bubula, Andrea, and Inci Otker-Robe, 2002, “The Evolution of Exchange Rate Regimes
Since 1990: Evidence from De Facto Policies,” IMF Working Paper No. 02/155
(Washington, DC: International Monetary Fund).
Calvo, Guillermo A., and Carmen M. Reinhart, 2002, “Fear of Floating” Quarterly Journal
of Economics, Vol. 117, No. 2, pp. 379–408.
Christiansen, Lone, E., Alessandro Prati, Luca Antonio Ricci, and Thierry Tressel, 2009,
“External Balance in Low Income Countries,” IMF Working Paper No. 09/221
(Washington, D.C.: International Monetary Fund).
Commission on Growth and Development, 2008, Growth Report: Strategies for Sustained
Growth and Inclusive Development (Washington, DC: World Bank).
Collier, Paul, and Jan Willem Gunning, 1999, “Explaining African Economic Performance,”
Journal of Economic Literature, Vol. 37, No. 1, pp. 64-111.
De Grauwe, Paul and Gunther Schnabl, 2008, “Exchange Rate Stability, Inflation and
Growth in (South) Eastern and Central Europe,” Review of Development Economics,
Vol.12, No. 3, pp. 530–549.
22
Devarajan, Shantayanan, 2013, “Africa’s Statistical Tragedy,” Review of Income and Wealth,
Series 59, Special Issue, October, pp. S9-S15..
De Vita, Glauco and Khine Sandar Kyaw, 2011, “Does the Choice of Exchange Rate Regime
Affect the Economic Growth of Developing Countries,” Journal of Developing
Areas, Vol. 45, No. 1, pp. 135–53.
Eichengreen, Barry, and Raul Razo-Garcia, 2011, “How Reliable are de Facto Exchange
Rate Regime Classifications?” NBER Working Paper No. 17318 (Cambridge, MA:
National Bureau of Economic Research).
Ghosh, Atish R., Anne-Marie Gulde, Jonathan D. Ostry, and Holger C. Wolfe, 1997, “Does
the Nominal Exchange Regime Matter?” NBER Working Paper No. 5874
(Cambridge, MA: National Bureau of Economic Research).
Ghosh, Atish, R., Anne-Marie Gulde, and Holger C. Wolf, 2002, Exchange Rate Regimes:
Choices and Consequences (Cambridge, MA: MIT Press).
Ghosh, Atish R., Jonathan D. Ostry, and Charalambos G. Tsangarides, 2010, “Exchange Rate
Regimes and the Stability of the International Monetary System,” IMF Occasional
Paper 270 (Washington, D.C.: International Monetary Fund).
Ghosh, Atish R., Mahvash S. Qureshi, and Charalambos Tsangarides, 2011, “Words vs.
Deeds: What Really Matters?” IMF Working Paper No. 11/112 (Washington, D.C.:
International Monetary Fund).
Guerguil, Martine, Catherine McAuliffe, Hamid R. Davoodi, Maxwell Opoku-Afari, and
Shiv Dixit, 2011, “The East African Community: Taking Off?” in Regional Economic
Outlook, Sub-Saharan Africa (Washington, D.C.: International Monetary Fund),
pp. 51–72.
Harms, Philipp and Marco Kreschmann, 2009, “Words, Deeds and Outcomes: A Survey on
the Growth Effects of Exchange Rate Regimes,” Journal of Economic Surveys,
Vol. 23, No. 1, pp. 139–164.
Husain, Aasim M., Ashoka Mody, and Kenneth S. Rogoff, 2005, “Exchange Rate Regime
Durability and Performance in Developing versus Advanced Economies,” Journal of
Monetary Economics, Vol. 52, No. 1, pp. 35–64.
IMF, Annual Report on Exchange Arrangements and Exchange Restrictions, various
editions, (Washington, D.C.: International Monetary Fund).
IMF, 2012, “Maintaining Growth in an Uncertain World,” Chapter 1 in Regional Economic
Outlook, Sub-Saharan Africa (Washington, DC: International Monetary Fund),
October, pp. 1-23.
23
IMF, 2013, “Breaking Through the Frontier: Can Today’s Dynamic Low-Income Countries
Make It?” Chapter 4 in World Economic Outlook (Washington, DC: International
Monetary Fund), April, pp. 97-131.
Jaunky, Vishal Chandr, 2013, “Democracy and Economic Growth in Sub-Saharan Africa: a
Panel Data Approach,” Empirical Economics, Vol. 45, No. 2, pp. 987-1008.
Jerven, Morten, 2013, “Comparability of GDP Estimates in Sub-Saharan African: The Effect
of Revisions in Sources and Methods Since Structural Adjustment,” Review of
Income and Wealth, Series 59, Special Issue, October, pp. S16-S36.
Johnson, Simon H., Jonathan D. Ostry, and Arvind Subramanian, 2007, “The Prospects for
Sustained Growth in Africa: Benchmarking the Constraints,” IMF Working Paper
No. 7/52 (Washington, D.C.: International Monetary Fund).
Klein, Michael W. and Jay C. Shambaugh, 2010, Exchange Rate Regimes in the Modern Era
(Cambridge, MA: MIT Press).
Levine, Ross and David Renelt, “A Sensitivity Analysis of Cross-Country Growth
Regressions,” American Economic Review, Vol. 82, No. 4, pp. 942–963.
Levy-Yeyati, Eduardo and Federico Sturzenegger, 2001, “Exchange Rate Regimes and
Economic Performance,” IMF Staff Papers, Vol. 47, pp. 62–98.
Levy-Yeyati, Eduardo and Federico Sturzenegger, 2003, “To Float or to Fix: Evidence on the
Impact of Exchange Rate Regimes on Growth,” American Economic Review, Vol. 93,
No. 4, pp. 1173–1193.
Levy-Yeyati, Eduardo and Federico Sturzenegger, 2005, “Classifying Exchange
Rate Regimes: Deeds vs. Words,” European Economic Review, Vol. 49, No. 6,
pp. 1603–1635.
Mankiw, N. Gregory, David Romer, and David N. Weil, 1992, “A Contribution to the
Empirics of Economic Growth,” Quarterly Journal of Economics, Vol. 107, No. 2,
pp. 407–437.
Mijiyawa, Abdoul’ Ganiou, 2013, “Africa’s Recent Economic Growth, What Are the
Contributing Factors?” African Development Review, Vol. 25, No. 3, pp. 289-302.
Miles, William, 2006, “To Float or Not to Float? Currency Regimes and Growth,” Journal of
Economic Development, Vol. 31, No. 2, pp. 91–105.
Nickell, Stephen J., 1981, “Biases in Dynamic Models with Fixed Effects,” Econometrica,
Vol. 49, No. 6, pp. 1417–26.
Obstfeld, Maurice and Kenneth Rogoff, 1995, “The Mirage of Fixed Exchange Rates,”
Journal of Economic Perspectives, Vol. 9, No. 4, pp. 73–96.

24
Pattillo, Catherine, Sanjeev Gupta, and Kevin Carey, 2006, Sustaining and Accelerating Pro-
Poor Growth in Africa (Washington, D.C.: International Monetary Fund).
Petreski, Marjan, 2009, “Exchange-Rate Regime and Economic Growth: A Review of the
Theoretical and Empirical Literature,” Economics, Discussion Paper No. 2009–31.
Reinhart, Carmen M. and Kenneth S. Rogoff, 2004, “The Modern History of Exchange Rate
Arrangements: A Reinterpretation,” Quarterly Journal of Economics, Vol. 119,
No. 1, pp. 1–48.
Rodrik, Dani, 2008, “The Real Exchange Rate and Economic Growth,” Brookings Papers on
Economic Activity, Vol. 2, pp. 365–412.
Rogoff, Kenneth S., Aasim M. Husain, Ashoka Mody, Robin J. Brooks, and Nienke Oomes,
2004, “Evolution and Performance of Exchange Rate Regimes,” IMF Occasional
Paper 229 (Washington, D.C.: International Monetary Fund).
Rose, Andrew K., 2011, “Exchange Rate Regimes in the Modern Era: Fixed, Floating, and
Flaky,” Journal of Economic Literature, Vol. 49, No. 3, pp. 652–672.
Stotsky, Janet G., Manuk Ghazanchyan, Olumuyiwa Adedeji, and Nils Maehle, 2012, “The
Relationship between the Foreign Exchange Regime and Macroeconomic
Performance in Eastern Africa,” IMF Working Paper No. 12/148 (Washington, D.C.:
International Monetary Fund).

25
Appendix A. African Countries in the Sample
Country Profile Oil Exporter/importer Commodity Exporter
1 Angola Middle income Exporter Oil 2 Benin Low income Importer Cotton and textiles 3 Botswana Middle income Importer Gold and diamonds and other precious stones 4 Burkina Faso Low income Importer Cotton and gold 5 Burundi Fragile Importer Coffee 6 Cameroon Low income Exporter Oil 7 Cape Verde Middle income Importer Re-export of fuel for boats and spare parts 8 Central African Republic Fragile Importer Gold and diamonds and other precious stones 9 Chad Low income exporter Oil
10 Comoros Fragile Importer Vanilla, cloves, ylang ylang 11 Congo, Democratic Republic Fragile Importer Cobalt and copper 12 Congo, Republic of Low income Exporter Oil 13 Cote d'Ivoire Fragile Importer Cocoa, coffee 14 Equatorial Guinea Low income Exporter Oil 15 Eritrea Fragile Importer Food and live animals 16 Ethiopia Low income Importer Coffee 17 Gabon Low income Exporter Oil 18 Gambia Low income Importer Groundnut products 19 Ghana Middle income Importer Gold and diamonds and other precious stones 20 Guinea Fragile Importer Other 21 Guinea-Bissau Fragile Importer Cashew nuts 22 Kenya Low income Importer tea, horticulture 23 Lesotho Middle income Importer Garments 24 Liberia Fragile Importer Rubber 25 Madagascar Low income Importer From export processing zones 26 Malawi Low income Importer Tobacco 27 Mali Low income Importer Gold and diamonds and other precious stones 28 Mauritius Middle income Importer Sugar, textile 29 Mozambique Low income Importer Aluminum 30 Namibia Middle income Importer Gold and diamonds and other precious stones 31 Niger Low income Importer Base metals and uranium 32 Nigeria Middle income exporter Oil 33 Rwanda Low income Importer Tea, coffee 34 Sao Tome and Principe Fragile Importer Cocoa 35 Senegal Middle income Importer Fish 36 Seychelles Middle income Importer Tuna 37 Sierra Leone Low income Importer Gold and diamonds and other precious stones 38 South Africa Middle income Importer Gold and diamonds and other precious stones 39 Swaziland Middle income Importer Sugar, textile 40 Tanzania Low income Importer Gold and diamonds and other precious stones 41 Togo Fragile Importer Cotton and phosphate 42 Uganda Low income Importer Cobalt and copper 43 Zambia Middle income Importer Base metals and uranium 44 Zimbabwe Fragile Importer Gold and diamonds and other precious stones
Source: IMF country database.
1/ We remove the Democratic Republic of Congo and Zimbabwe from our sample data.
Table A1. African Countries in the Sample

26
The African countries are divided into subsamples for our analysis. The first sample consists
of all countries, minus Democratic Republic of Congo and Zimbabwe owing to their
experience with hyperinflation during the sample period. The second sample consists of all
countries, minus Zimbabwe and Democratic Republic of Congo as well as oil exporters,
Angola, Cameroon, Chad, Republic of Congo, Equatorial Guinea, Gabon, and Nigeria. The
third sample consists of only middle and low income countries, which excludes the oil
exporters and the fragile countries (no countries are considered high income).
Cameroon, Central African Republic, Chad, Republic of the Congo, Equatorial Guinea, and
Gabon form the CEMAC group, each using the CFA franc, which is pegged to the euro.
Benin, Burkina Faso, Ivory Coast, Guinea-Bissau, Mali, Niger, Senegal, and Togo form the
WAEMU group, also using the CFA franc pegged to the euro. The Common Monetary Area
(CMA) consists of the Republic of South Africa, Lesotho, Namibia, and Swaziland, which
have their currencies tied to the South African rand.
Figures A1 and A2 show some interesting data on growth and exchange regimes, broken
down by country groups. Growth is higher among countries with a floating regime for middle
income and low income countries, classified on either the de jure or de facto basis. However,
higher growth is achieved by the intermediate regime countries for oil exporters.

27
Table A2. Definition of Variables and Sources
Variable Description Source
Dependent variables
Rgdppcg Real GDP growth per capita (percent) International Monetary Fund, WEO
Rgdppcg_nagr Nonagricultural Real GDP growth per capita (percent)
World Bank, World Development Indicators, IMF staff estimates
Independent variables
Govc Government consumption (percent of GDP). International Monetary Fund, WEO
Private Inv (-1)
Public Inv (-1)
Lagged investment, gross fixed capital formation (percent of GDP)
Lagged investment, gross fixed capital formation (percent of GDP)
International Monetary Fund, WEO
International Monetary Fund, WEO
Real GDP Real GDP growth International Monetary Fund, WEO
Creer Change in reer (average yearly). International Monetary Fund, Information Notice System
Dummy variables
Intdejure Intermediate exchange rateime regime dummy, de jure regime classification
International Monetary Fund, Annual Report on Exchange Arrangements and Exchange Restrictions (AREAER).
Flexdejure Flexible exchange regime dummy, de jure regime classification
International Monetary Fund, AREAER
Intdefacto Intermediate exchange regime dummy, de facto regime classification
International Monetary Fund AREAER and Bubula and Ötker-Robe (2002).
Flexdefacto Flexible exchange regime dummy, de facto regime classification
International Monetary Fund, AREAER and Bubula and Ötker-Robe (2002).
Liberalization Liberalization dummy constructed based on controls for current account transactions; a country is considered to have a liberalized regime (the dummy variable taking a value of 1 and 0 otherwise) if it has a liberalized current account.
International Monetary Fund, AREAER
Source: IMF staff estimates.

28
Variable Mean Standard Deviation Min Max
Real GDP per capita growth (percent change) 2.6 6.2 -32.2 64.5 Investment (percent of GDP) 21.37 10.22 1.37 76.44 Government consumption (percent of GDP) 16.10 8.29 2.29 54.80 Real effective exchange rate (percent change) 0.62 6.60 -8.39 18.97 Real GDP growth (percent change) 4.7 5.5 -31.3 63.4 Source: IMF staff estimates.
Regime classification Pegged (286)
Intermediate (112)
Floating (148)
Real GDP per capita growth (percent change) 1.8 4.9 3.0 Investment (percent of GDP) 22.05 19.00 19.99 Government consumption (percent of GDP) 16.93 14.78 13.67 Real effective exchange rate (percent change) 1.08 1.17 -0.91 Real GDP growth (percent change) 4.2 5.8 5.2 Source: IMF staff estimates.
Regime classification Pegged (304)
Intermediate (120)
Floating (122)
Real GDP per capita growth (percent change) 2.0 4.2 2.6 Investment (percent of GDP) 21.89 19.89 18.89 Government consumption (percent of GDP) 16.40 19.89 14.64 Real effective exchange rate (percent change) 1.10 0.57 -0.74 Real GDP growth (percent change) 4.5 5.3 4.8 Source: IMF staff estimates.
Table A3. Descriptive Statistics for the Full Sample, 1999-2011
Table A4. Selected Variable Means by Type of Exchange Rate Regime, 1999-2011 (de jure classification)
Table A5. Selected Variable Means by Type of Exchange Rate Regime, 1999-2011 (de facto classification)

29
Figure A1. Selected Country Groups and Average Growth, 1999–2011.
(de jure classification)
Sources: IMF AREAER and staff estimates.
68 (3.8)
23 (13.99)
Frequency distribution of regimes
(number of countries, average growth).
Oil exporters
Pegged regime Intermediate regime
87 (2.4)
22 (2.8)
34 (3.2)
Frequency distribution of regimes
(number of countries, average growth):
Middle income countries
Pegged regime Intermediate regime Floating regime
52 (1.9)
48 (2.7)
82 (3.4)
Frequency distribution of regimes
(number of countries, average growth):
Low income countries
Pegged regime Intermediate regime Floating regime
286 (1.8)
112 (4.9)
148 (3.0)
Frequency distribution of regimes
(number of countries, average growth).
Full sample
Pegged regime Intermediate regime Floating regime

30
Figure A2. Selected Country Groups and Average Growth, 1999–2011.
(de facto classification)
Sources: IMF AREAER and staff estimates.
68 (4.34)
15 (16.9)
8 (5.9)
Distribution of regimes ( number of countries , average growth).
Oil exporters
Pegged regime Intermediate regime Floating regime
86 (2.4) 20 (2.8)
31 (2.9)
Frequency distribution of regimes ( number of countries , average growth).
Middle income countries
Pegged regime Intermediate regime Floating regime
68 (2.8)
45 (2.5)
69 (2.9)
Frequency distribution of regimes ( number of countries , average growth).
Low income countries
Pegged regime Intermediate regime Floating regime
304 (2.0)
120 (4.2)
122 (2.6)
Distribution of regimes
(number of countries, average growth).
Full sample
Pegged regime Intermediate regime Floating regime

31
Appendix B. De Jure and De Facto Classification
Characterizing accurately the exchange rate regime is critical in assessing the relationship
between exchange rate regimes and economic growth. In our empirical study we adopted two
classification schemes:1 The IMF de jure regime classification, based on the regime that
governments claim to have in place, published by the IMF in its Annual Report on Exchange
Rate Agreements and Exchange Restrictions (various issues) and the IMF de facto
classification scheme also published in the IMF’s Annual Report on Exchange Rate
Agreements and Exchange Restrictions (AREAER). Thus, we complement the IMF de jure
classification scheme with the de facto scheme for comparison.
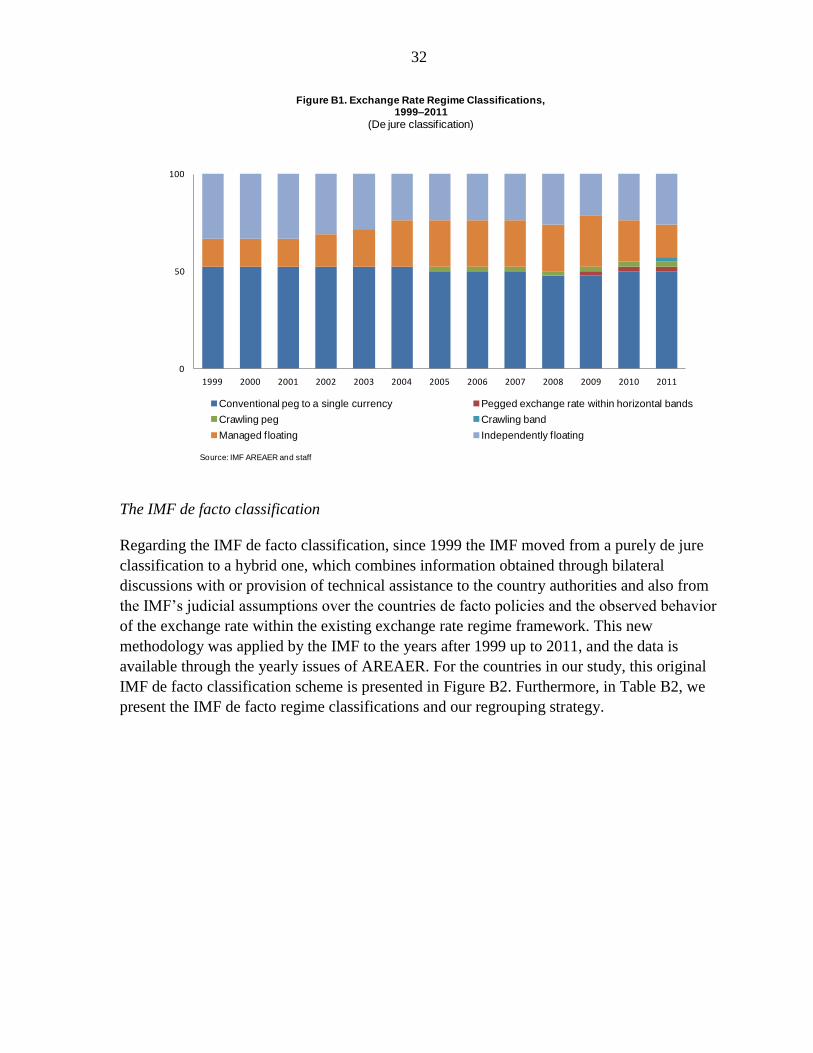
The IMF de jure classification2
The IMF de jure classification is reported in either the issues of the AREAER or in the
International Financial Statistics. For the countries in our study, this original IMF de jure
classification scheme is presented in Table B1 and Figure B1. As can be seen, we further
mapped the original classification into three (floating, intermediate, and pegged) regime
categories. This is done to draw a line in a continuum of different intermediate regimes
ranging from fixed rates, hard and soft pegs, crawling or other stabilized arrangements,
heavily or lightly managed floats, to free floating regimes.
1 We examined other statistically-based regime classification approaches proposed in the literature, (for
example, Levy-Yeyati and Sturzenegger, 2002, 2003, Reinhart and Rogoff (2004) and Shambaugh (2004), but
focused on the IMF and Bubula and Ötker-Robe (2002) classifications. We did not use the Reinhart and Rogoff
regime classification scheme, whose distinguishing feature is its use of black market premium data, which are
not consistently available for our set of countries.
2 All classifications are at end of year.
Sources: IMF AREAER and staff estimates.
IMF Reclassified 1/
No self-determined monetary policy -1 -1 Information not available 0 0 Exchange arrangement with no separate legal tender 1 0 Currency board arrangement 2 1 Conventional pegged arrangement 3 1 Pegged exchange rate within horizontal bands 4 1 Crawling peg 5 1 Crawling band 6 1 Managed floating 7 2 Independently floating 8 3
1/ 1-pegged; 2-intermediate; 3-
floating
Table B1. The IMF de Jure Regime Classifications and Our Reclassification Strategy
32
The IMF de facto classification
Regarding the IMF de facto classification, since 1999 the IMF moved from a purely de jure
classification to a hybrid one, which combines information obtained through bilateral
discussions with or provision of technical assistance to the country authorities and also from
the IMF’s judicial assumptions over the countries de facto policies and the observed behavior
of the exchange rate within the existing exchange rate regime framework. This new
methodology was applied by the IMF to the years after 1999 up to 2011, and the data is
available through the yearly issues of AREAER. For the countries in our study, this original
IMF de facto classification scheme is presented in Figure B2. Furthermore, in Table B2, we
present the IMF de facto regime classifications and our regrouping strategy.
0
50
100
1999 2000 2001 2002 2003 2004 2005 2006 2007 2008 2009 2010 2011
Figure B1. Exchange Rate Regime Classifications, 1999–2011
(De jure classification)
Conventional peg to a single currency Pegged exchange rate within horizontal bands
Crawling peg Crawling band
Managed floating Independently floating
Source: IMF AREAER and staff

33
Table B3 shows the regime distributions of both de jure and de facto observations. According
to the official IMF de jure classification floating regimes constitute about one third of all the
observations, while pegged regimes more than half of the observations owing mainly to the
inclusion of CFA franc zone countries. Under the de facto categorization, there are even
fewer floating regimes, about 22 percent of total observations but more pegged regimes,
0
20
40
60
80
100
1999 2000 2001 2002 2003 2004 2005 2006 2007 2008 2009 2010 2011
Figure B2. Exchange Rate Regime Classifications, 1999–2011(De facto classification)
Conventional peg to a single currency Conventional peg to a composite
Stabilized arrangement Crawling peg
Crawl-like arrangement Pegged exchange rate within horizontal bands
Source: IMF AREAER and staff estimates
Sources: IMF AREAER and staff estimates.
IMF Reclassified 1/
No separate legal tender 1 0
Currency board 2 1
Conventional peg to a single currency 3 1
Conventional peg to a composite 3.5 1
Stabilized arrangement 4 2
Crawling peg 5 1
Crawl-like arrangement 6 1
Pegged exchange rate within horizontal bands 7 1
Other managed arrangement 8 2
Floating 9 3
Free floating 10 3
1/ 1-pegged; 2-intermediate; 3-floating
Table B2. The IMF de Facto Regime Classifications and Our Reclassification Strategy

34
about 56 percent of total observations. The share of intermediate regimes stays at a steady
level of about 22 percent of total observations under both classifications.
Sources: IMF AREAER and staff estimates.
Among the countries in our sample presented in Tables B4 and B5, Burundi, Gambia,
Madagascar, Mozambique, South Africa, Tanzania, Uganda, and Zambia had most of the
floating time periods under the de jure exchange rate regime but with the de facto
classification, Burundi is no longer among the floaters and Liberia and Sierra Leone are
added to this group. Other than the CFA franc zone countries, only Botswana, Ethiopia and
Namibia had no experience in having a floating regime. De facto, Burundi, Ethiopia, Ghana,
Kenya, Mauritius, Nigeria, Rwanda, Sao Tome and Principe, and Zambia had most of the
experience in running managed arrangements. Overall, countries who had mixed regimes
from floating to intermediate are Gambia, Ghana, Guinea, Kenya, Liberia, Madagascar,
Malawi, Mauritius, Mozambique, and Zambia. .
IMF Percent IMF Percent
(de Jure) (in total) (de facto) (in total)
Regime
Floating regime 148 27 122 22
Immediate regime 112 21 120 22
Pegged 286 52 304 56
Total 546 100 546 100
Table B3. Distribution of Regimes

35
Floating Intermediate PeggedPercent of
Floats
Percent of
Total
Angola 0 13 0 0 0
Benin 0 0 13 0 0
Botswana 0 0 13 0 0
Burkina Faso 0 0 13 0 0
Burundi 13 0 0 100 9
Cameroon 0 0 13 0 0
Cape Verde 0 0 13 0 0
Central African Republic 0 0 13 0 0
Chad 0 0 13 0 0
Comoros 0 0 13 0 0
Congo, Republic of 0 0 13 0 0
Cote d'Ivoire 0 0 13 0 0
Equatorial Guinea 0 0 13 0 0
Eritrea 1 0 12 8 1
Ethiopia 0 13 0 0 0
Gabon 0 0 13 0 0
Gambia 13 0 0 100 9
Ghana 4 9 0 31 3
Guinea 3 10 0 23 2
Guinea-Bissau 0 0 13 0 0
Kenya 0 13 0 0 0
Lesotho 0 0 13 0 0
Liberia 5 8 0 38 3
Madagascar 13 0 0 100 9
Malawi 0 13 0 0 0
Mali 0 0 13 0 0
Mauritius 4 9 0 31 3
Mozambique 13 0 0 100 9
Namibia 0 0 13 0 0
Niger 0 0 13 0 0
Nigeria 0 10 3 0 0
Rwanda 12 1 0 92 8
Sao Tome and Principe 10 1 2 77 7
Senegal 0 0 13 0 0
Seychelles 0 4 9 0 0
Sierra Leone 5 8 0 38 3
South Africa 13 0 0 100 9
Swaziland 0 0 13 0 0
Tanzania 13 0 0 100 9
Togo 0 0 13 0 0
Uganda 13 0 0 100 9
Zambia 13 0 0 100 9
Total 148 112 286 100
Source: IMF country information.
Table B4. Distribution of de Jure Regimes by Country

36
Figures B3 and B4 depict the evolution of the exchange rate regimes in our sample of
42 countries ranging from 1999 to 2011 using both classification schemes. As shown in the
top chart, the de jure classification shows a slight increase in the prevalence of intermediate
regimes with the popularity of floating regimes fluctuating over time. In the bottom chart
with de facto regimes, intermediate regimes are less common and the move towards floating
regimes is more prevalent in the recent years.
Having said this, overall, there is not much difference between the two classification schemes
and our calculated correlation coefficient between the IMF de facto and de jure regime
classification’s is 0.81. The slight divergence that exists is in the gap between de jure floating
and de facto intermediate regimes early and in mid 2000-s. Interestingly, the proportion of de
facto floating regimes that are de jure intermediate regimes has increased in the very recent
years. The proportion of pegged regimes compared in the de jure and de facto classifications
has been stable.
0
10
20
30
40
50
60
70
80
90
100
1999 2000 2001 2002 2003 2004 2005 2006 2007 2008 2009 2010 2011
Figure B3. Frequency Distribution of Exchange Rate Regimes, 1999 – 2011
(De jure classification)
"0 - Fixed regime" "1 - Intermediate regime" "2 - Floating regime"
Sources: IMF AREAER and staff estimates.

37
0 10 20 30 40 50 60 70 80 90
100
1999 2000 2001 2002 2003 2004 2005 2006 2007 2008 2009 2010 2011
Figure B4. Frequency Distribution of Exchange Rate Regimes, 1999 – 2011
(De facto classification)
"0 - Fixed regime" "1 - Intermediate regime" "2 - Floating regime"
Sources: IMF AREAER and staff estimates.