droplet impact and penetration onto … · droplet impact and penetration into structured permeable...
TRANSCRIPT
DROPLET IMPACT AND PENETRATION ONTO
STRUCTURED PORE NETWORK GEOMETRIES
by
Saman Hosseini
A thesis submitted in conformity with the requirements
for the degree of Doctor of Philosophy
Graduate Department of Mechanical and Industrial Engineering
University of Toronto
© Copyright by Saman Hosseini (2015)
ii
ABSTRACT
Droplet Impact and Penetration on to the Structured Pore Network Geometries
Saman Hosseini
Doctor of Philosophy
Graduate Department of Mechanical and Industrial Engineering
University of Toronto
2015
The impact of the water droplet on permeable substrate has been studied experimentally and
numerically. Reynolds number (Re) and Weber number (We) are found to be the governing non-
dimensional numbers. Porosity of the substrate is the geometry parameter studied in this thesis.
Impact and penetration of the water droplet has been studied experimentally on structured parallel
holes on a solid substrate to track penetration in the presence of capillarity. Liquid penetration
into the holes was initially rapid, driven by the inertia of the impacting liquid and then much
slower, caused by capillary forces that drew in the liquid. The rate of liquid movement was
predicted by a simple model that included liquid pressure, surface tension and viscous effects. The
area of liquid, solid contact inside the holes was significant, varying from 5% to 30% of the total
droplet-substrate contact area as droplet height was raised from 1 cm to 5 cm. The enhanced
contact area increased the surface energy of the droplet and reduced the energy available for
droplet recoil.
iii
Physics of capillary penetration in our experimental studies extended our research to model
droplet impact and penetration into structured permeable geometries using ANSYS-FLUENT
14.0. The significant objective of the numerical studies is characterization of the ratio of
penetrated volume rather than droplet initial volume. Porosity of the substrate has been studied to
evaluate the effect of this value in penetration regime. Investigating the effect of impact inertia
achieved by changing Re number from 50 to 2000 and penetrated volume showed that increasing
Re number increases liquid penetrated into the pore network. Spreading diameter and droplet
height showed similar oscillatory behaviors, but larger degree in height rather than spreading
diameter. In the end, dynamic of bubble formation at range of Re has been observed. Small
bubbles start forming at Re = 200. By increasing Re to 500 entrapped bubbles into the pore
network starts to disappear due to the larger degree of momentum of the impact which pushes the
bubbles closer to the liquid/gas interface. For Re > 1000, formation of bubbles changes from
spherical small form to large slug form.
iv
Acknowledgements
I am deeply grateful for the support, friendly supervision and guidance of Professor Nasser
Ashgriz, Professor of Mechanical and Industrial Engineering Department of University of
Toronto. This thesis could not have been completed without his help, patience, and valuable
advices.
I also would like to thank my co-supervisor, Professor Sanjeev Chandra, Professor Nasser
Ashgriz, Professor of Mechanical and Industrial Engineering Department of University of
Toronto, for his unconditional support, constant guidance, motivation and untiring help during
the course of my PhD.
My thesis committee guided me through all these years. Thank you to Professor Markus
Bussmann, Professor Aimy Bazylak and Professor Pierre E. Sullivan in Mechanical and
Industrial Engineering Department of University of Toronto for being my major advisors. Also
thank you to Professor Cyrus K. Madnia, Professor of Mechanical and Aerospace Engineering
Department at State University of New York at Buffalo for being my external committee
member and his helpful advices on my thesis.
I acknowledge the support of Stephan Drappel and John R. Andrews in Xerox Research
Centre of Canada in the year of 2010 and 2011.
I appreciate the financial support of Ontario Graduate Scholarship (OGS) and Mechanical and
Industrial Engineering Department of University of Toronto via Doctoral Completion Award.
Also I would like to acknowledge my colleagues, Dr. Araz Sarchami, Dr. Amirreza Amighi,
Dr. Mohsen Behzad, Dr. Reza Karami and Dr. Maryam Medghalchi that welcomed me to the

v
Multiphase Flow and Spray Systems Laboratory at the University of Toronto and support me
truly in these five years.
vi
Table of Contents
List of Figures ............................................................................................................................ vii
Chapter 1 Introduction ............................................................................................................... 1
1.1 Overview ............................................................................................................................. 1
1.2 Literature Review ................................................................................................................ 2
1.2.1 Droplet impact ............................................................................................................. 2
1.2.2 Liquid penetration into porous substrate ..................................................................... 3
1.2.3 Droplet impact on paper (printing industry) .................................................................. 6
1.2.4 Paper .............................................................................................................................. 8
1.2.5 Capillary flow ................................................................................................................ 9
1.3 Objectives .......................................................................................................................... 16
1.4 This Thesis ........................................................................................................................ 17
Chapter 2 Governing Equation and Numerical Model .......................................................... 20
2.1 Overview ........................................................................................................................... 20
2.2 Mathematical Formulation ................................................................................................ 20
2.3 3D Solver .......................................................................................................................... 23
2.3.1 Solution algorithm ..................................................................................................... 25
2.4 Geometry and Meshing ..................................................................................................... 25
vii
2.5 Boundary and Initial Conditions ....................................................................................... 29
2.6 Time Step Limitations........................................................................................................ 29
Chapter 3 Penetration of an Impacting Water Droplet into Capillary Holes in a Solid
Surface ........................................................................................................................................ 30
3.1 Overview ........................................................................................................................... 30
3.2 Experimental System ........................................................................................................ 31
3.3 Results and Analysis ......................................................................................................... 32
3.4 Numerical Code Validation ............................................................................................... 51
3.5 Conclusion ......................................................................................................................... 52
Chapter 4 Impact of a Liquid Droplet on an Inverted T-hole Geometry ............................. 54
4.1 Overview ........................................................................................................................... 54
4.2 The Model ......................................................................................................................... 55
4.3 Results and Discussion ...................................................................................................... 56
4.3.1 Base case model - outline of the physical mechanism .............................................. 57
4.3.2 Effect of governing parameters ................................................................................. 71
4.3.2.1 Effect of droplet impact velocity ....................................................................... 71
4.3.2.2 Effect of droplet diameter .................................................................................. 72
4.3.2.3 Effect of capillary hole diameter (Pore size) ..................................................... 74
viii
4.3.2.4 Effect of the contact angle ................................................................................. 75
4.4 Conclusion ......................................................................................................................... 77
Chapter 5 Droplet Impact and Penetration on Structured 3D Pore Network ..................... 79
5.1 Overview ........................................................................................................................... 79
5.2 A Model for a Porous Substance ....................................................................................... 80
5.3 Results and Discussion ...................................................................................................... 81
5.3.1 Base case - outline of the physical mechanism .................................................... 82
5.3.2 Penetration Depth ................................................................................................. 87
5.3.3 Effect of impact Reynolds .................................................................................... 90
5.3.3.1 Oscillation of droplet height and spreading diameter ................................. 108
5.3.3.2 Final shape of the droplet ............................................................................ 112
5.3.4 Effect of liquid viscosity ..................................................................................... 118
5.3.5 Effect of Weber number ..................................................................................... 120
5.3.6 Effect of porosity ................................................................................................ 122
5.4 Conclusion ....................................................................................................................... 125
Chapter 6 Conclusions and Future Recommendations ........................................................ 127
6.1 Summary and Conclusions............................................................................................... 127
References ................................................................................................................................. 133
ix
List of Figures
Figure 1-1: The variation of penetration depth (𝑯𝒇∗) () and spread ratio (𝑹𝒇∗) (▲) as a function
(a) porosity, (b) Re, (c) We and (d) contact angle ........................................................................... 6
Figure 1-2: An ordinary carbon paper .............................................................................................. 8
Figure 1-3: Analytical solution and experimental data for the capillary rise of water at capillary
diameter of 0.3mm ......................................................................................................................... 11
Figure 1-4: Definition of the permeable wall boundary condition ................................................ 13
Figure 1-5: Spreading ratio for drop impact at Re = 2300 and We = 42 ....................................... 13
Figure 1-6: Theoretical and experimental droplet spreading diameter for multiple liquid after
impact on porous substrate ............................................................................................................. 15
Figure 1-7: Schematic model of an impacted droplet onto the porous substrate ........................... 17
Figure 2-1: Parallel holes numerical geometry............................................................................... 26
Figure 2-2: Inverted T-hole geometry ............................................................................................ 27
Figure 2-3: Structured cubic geometry .......................................................................................... 28
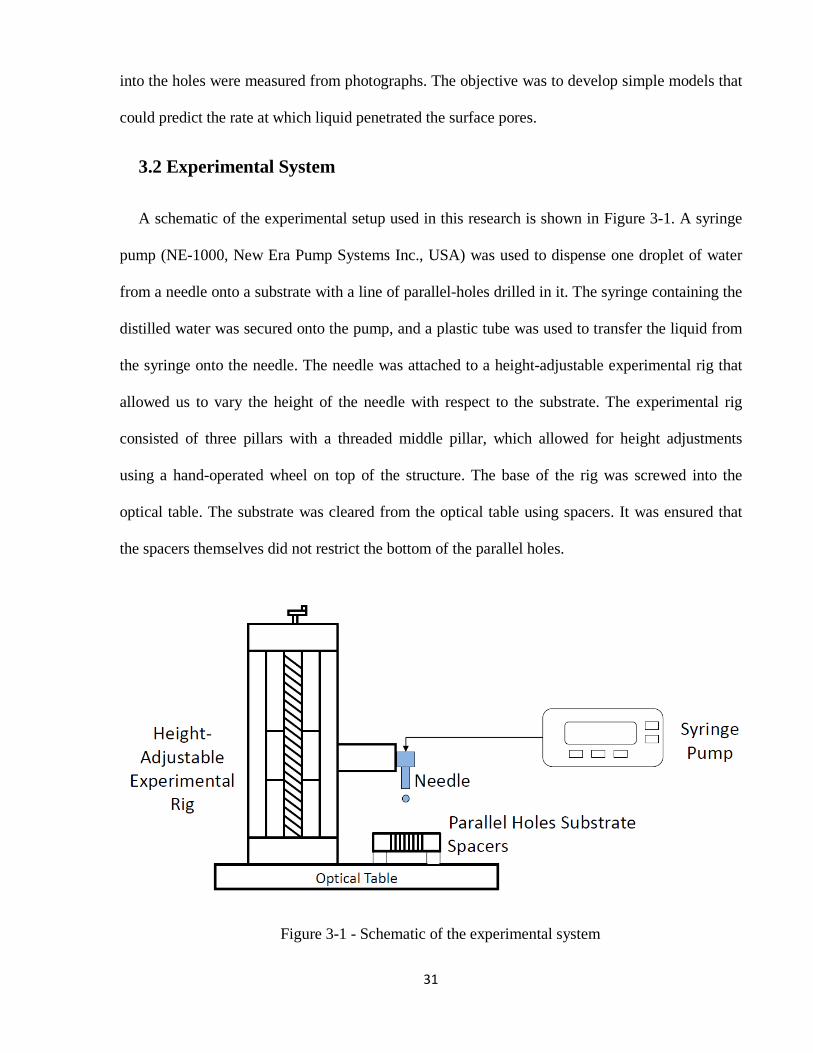
Figure 3-1 - Schematic of the experimental system ....................................................................... 31
Figure 3-2: Water droplet impact and penetration for diameter of 3.2mm and heights of impact of
1, 3 and 5 cm .................................................................................................................................. 33
Figure 3-3: Advancing liquid front for centre hole at release height of 5cm ................................ 35
x
Figure 3-4: Penetration history of impacted droplet on centre hole for three different heights of 1,
3 and 5cm ....................................................................................................................................... 36
Figure 3-5 - Dynamic force diagram of liquid inside the capillary hole........................................ 37
Figure 3-6: Penetration of the liquid droplet on line of parallel holes at height of impact of 5 cm
......................................................................................................................................................... 41
Figure 3-7: Analytical solution of pressure and velocity field inside the droplet (a) t=5ms and (b)
Pressure gradient. ........................................................................................................................... 42
Figure 3-8: Oscillation of the spreading diameter for droplet height for heights of 1, 3 and 5cm
......................................................................................................................................................... 43
Figure 3-9: Penetrated volume into capillary holes at three different heights of impact .............. 44
Figure 3-10: Oscillation of the droplet height for impact heights of (a) 1, (b) 3 and (c) 5cm ....... 46
Figure 3-11: Penetrated area into capillary holes at three different heights of impact .................. 49
Figure 3-12: Ratio of final to initial internal energy of the liquid droplet at three heights of impact
......................................................................................................................................................... 50
Figure 3-13: Time evolution of the shape of the droplet in numerical simulation and experiment of
the same model ............................................................................................................................... 52
Figure 4-1: Impact of a droplet on an inverted T-hole (a) Interlocked with the substrate, (b) Not
interlocked with the substrate ......................................................................................................... 56
Figure 4-2: Droplet impact on an inverted T-hole resulting in interlocking penetration .............. 57
xi
Figure 4-3: Liquid front velocity, droplet spreading diameter and penetration depth for droplet
impact at 0.75 m/s and T-hole stem length of 0.85mm ................................................................. 58
Figure 4-4: Liquid front penetration for interlocking .................................................................... 59
Figure 4-5: Droplet impact on an inverted T-hole resulting in no interlocking with the substrate
......................................................................................................................................................... 60
Figure 4-6: Liquid front velocity, droplet spreading diameter and penetration depth for droplet
impact at 0.75 m/s and vertical T length of 0.95mm ..................................................................... 61
Figure 4-7: Liquid front penetration for no interlocking ............................................................... 62
Figure 4-8: Liquid front formation for interlocking regime .......................................................... 64
Figure 4-9: Schematic of liquid ligament at the moment of interlocking ...................................... 64
Figure 4-10: Ligament height change for interlocking case .......................................................... 67
Figure 4-11: Two dynamics of T junction penetration according to contact line wetting .............68
Figure 4-12: Penetration track into T-hole ..................................................................................... 70
Figure 4-13: Parametric study of liquid interlocking at different impact velocities ...................... 72
Figure 4-14 - Parametric study of liquid interlocking at different droplet diameters .................... 73
Figure 4-15: Parametric studies of liquid interlocking at different pore size .................................74
Figure 4-16: Parametric study of liquid interlocking at different contact angles ...........................76
Figure 4-17:Interlocking regime for range of Reynolds number ................................................... 77
Figure 5-1: SEM images of the paper surface ............................................................................. 81
xii
Figure 5-2: Schematic representation of the problem (a) Front-view) (b) isometric ................... 82
Figure 5-3: Water droplet impact: D= 100µm and V=1m/s, Re=100, We=1.43, 𝜽 = 𝟖𝟎
...........83
Figure 5-4: Pressure contours during a droplet impact: D= 10µm and V=1m/s, Re=100,
We=1.43, 𝜽 = 𝟖0 ......................................................................................................................... 85
Figure 5-5: Isometric view of a droplet impact: D= 10µm, V=1m/s, Re=100, We=1.43,𝜽 =
𝟖𝟎.................................................................................................................................................. 86
Figure 5-6: Liquid penetration into the center for a range of impact velocities and for D=10µm.
....................................................................................................................................................... 88
Figure 5-7: Liquid penetration into the R-1 pore for a range of impact velocities and for
D=10µm. ...................................................................................................................................... 88
Figure 5-8: Penetration shape for droplet impact at Re = 100 ..................................................... 91
Figure 5-9: Liquid front wetting of the horizontal pore beneath central and L-1 pores for Re =
100 ................................................................................................................................................ 92
Figure 5-10: Penetration shape for droplet impact at Re = 200 ................................................... 94
Figure 5-11: Bubble formation and motion during droplet impact and spreading at Re = 200 ... 96
Figure 5-12: Penetration shape for droplet impact at Re = 500 ................................................... 99
Figure 5-13: Liquid front wetting at very first moment of spreading timescale for Re = 500 ...101
Figure 5-14: Penetration shape for droplet impact at Re = 1000 ............................................... 103
Figure 5-15: Liquid front wetting at first moments of spreading timescale for impact Re = 1000
..................................................................................................................................................... 104
Figure 5-16: Bubble formation and it's motion at Re=1000 ..................................................... 105
Figure 5-17: Penetrated volume ratio at range of Impact velocity and final shape of the droplet
..................................................................................................................................................... 106
xiii
Figure 5-18: Time evolution of the shape of the impacted droplet and penetration into pore
network at Re = 100 to Re = 1000 ............................................................................................. 107
Figure 5-19: Droplet height diameter oscillation at range of Re ............................................... 108
Figure 5-20: Detail of droplet height oscillation at range of Re ................................................ 109
Figure 5-21: Droplet spreading diameter oscillation at range of Re .......................................... 110
Figure 5-22: Detail of droplet spreading diameter oscillation at range of Re ............................ 111
Figure 5-23: Final shapes and final isosurfaces of the impacted droplets for Re = 50 to Re = 2000
..................................................................................................................................................... 114
Figure 5-24: Liquid residue on the substrate at the end of the impact process .......................... 116
Figure 5-25: Droplet residual diameter on the substrate with changing Re ............................... 117
Figure 5-26: Penetrated area into the pore network at different Re ........................................... 118
Figure 5-27: Penetration depth and droplet height oscillation for µ = 0.001 𝐤𝐠𝐦−𝐬
/ Re = 100 .... 119
Figure 5-28: Penetration depth and droplet height oscillation for µ = 0.00033 𝐤𝐠𝐦−𝐬
/ Re = 100
..................................................................................................................................................... 119
Figure 5-29: Penetrated volume ratio at (i) We = 0.4 and (ii) We = 1.4 / Re = 100 ................. 121
Figure 5-30: Penetration regime at porosity (i) 13% and (ii) 3.5% for range of Re .................. 123
Figure 5-31: Penetrated volume ratio at range of Re for two different porosities of 3.5% and 13%
......................................................................................................................................................125
1
Chapter 1
Introduction
1.1 Overview
Droplet impact on permeable and non-permeable surfaces is a key element of a wide variety of
phenomena encountered in industrial applications such as ink-jet printing, spray cooling, internal
combustion engines, spray painting and coating. For the case of permeable surfaces, only a few
studies have been specifically concerned with droplet impact and penetration. The physics of
liquid droplet impact onto permeable substrates can be studied from two points of view: (i)
droplet impact and spreading on non-permeable substrate; and (ii) liquid penetration into porous
material due to the impact energy and capillary forces. When a droplet impacts onto a substrate,
all the kinetic energy of the droplet is transformed to surface energy of the deforming droplet or
dissipated in overcoming viscous forces. The kinetic energy forces the liquid droplet to spread
over the solid surface and also pushes it into holes in the permeable substrate. The rate and
amount of penetration of liquid into the substrate is determined by other factors such as the
porosity and permeability of the substrate. The relevant literature on droplet impact and
penetration is reviewed below.
2
1.2 Literature Review
In order to review the literature relevant to this research, it was divided into five main topics:
droplet impact; liquid penetration into a porous substrate; droplet impact on paper; paper as a
permeable substrate; and capillary flow. These topics include all the physical and dynamic aspects
of the physics of our research.
1.2.1 Droplet impact
Droplet impact on a solid substrate has been extensively studied experimentally and
numerically. When a droplet impacts of a solid surface, it spreads radially until it reaches a
maximum spread diameter. The droplet may retract and after several oscillations reach an
equilibrium shape on the top of the substrate; it may splash and breakup into small droplets; or it
may bounce off the surface [1-3]. The maximum spread diameter and the final outcome of the
droplet impact depends on the droplet impact velocity, droplet size, liquid and surface properties
including surface tension and surface roughness. Droplet spread diameter and dynamics of impact
show changes when a liquid film stays on the solid substrate and a droplet impacts onto it [4-8].
Other effects, such as bubble entrapment during the impact [9], solidification and viscosity
changes in the liquid [10], effects of the impact parameters on the droplet impingement onto
horizontal surfaces [11,12], and hydrophobic and hydrophilic surface effects [13,14] have also
been considered. High speed inkjet coating application of droplet impact onto modified surfaces
showed that a more hydrophilic surface as a substrate of ink swells more than the one that is less
hydrophilic [15]. There are also a number of modeling studies on droplet impact [16-19] showing
the details of the fluid and temperature fields inside the droplet during the impact process.
However, studies related to the droplet impact and penetration into porous materials are scarce
[20-25].
3
Rioboo et al. [26] have identified six possible outcomes of droplet impact due to physical
properties of liquid, dynamic effect of impact and surface property of substrate. They used the
Reynolds and Weber numbers in their categorization:
𝑅𝑒 = 𝐼𝑛𝑒𝑟𝑖𝑎 𝑓𝑜𝑟𝑐𝑒𝑉𝑖𝑠𝑐𝑜𝑢𝑠 𝑓𝑜𝑟𝑐𝑒
= 𝜌𝑉𝐷𝜇
1-1
𝑊𝑒 = 𝐼𝑛𝑒𝑟𝑖𝑎 𝑓𝑜𝑟𝑐𝑒𝑠𝑢𝑟𝑓𝑎𝑐𝑒 𝑡𝑒𝑛𝑠𝑖𝑜𝑛 𝑓𝑜𝑟𝑐𝑒
= 𝜌 𝑉2 𝐷𝜎
1-2
where 𝜌 is the liquid density, 𝑉 is the impact velocity, 𝐷 is the droplet diameter and 𝜇 and 𝜎 are
the liquid viscosity and surface tension, respectively. At low Re, droplet impact on a solid wall
results in spreading of the drop on the surface [27], usually referred to as the kinematic stage of
impact. In this case, the spreading radius of the droplet increases according to 𝑅~𝑡1/2, which is
independent of the physical properties of the liquid and the surface. As Re increases
progressively, droplet impact results in splashing, corona splash, receding break-up, partial
rebound and complete rebound [26, 27].
Air bubble entrapment is another effect that is observed in droplet impact processes. It is
observed that when a droplet impacts and spreads on a surface, air in the gap between them may
be forced out or trapped underneath the droplet. The liquid front velocity and the air pressure
below the droplet determine the dynamics of air bubble entrapment [28].
1.2.2 Liquid penetration into porous substrate
There are numerous studies on droplet impact on solid surfaces; however, there are very few
investigations on the impact of droplets on porous surfaces. When the substrate is permeable,
liquid might penetrate into it while spreading on its surface. There have been some studies on the
impact of droplets on both porous surfaces and parallel holes representing porous substrates [23,
4
24, 29-32]. Most research has focused on the imbibition of liquid due to the capillary pressure,
and only a few studies have considered impingement of a droplet on porous substrate.
Capillary penetration of liquid into porous material is observed in the experiment of capillary
rise into a piece of permeable fabric. The mass of liquid absorbed into this permeable fabric is
compared with the Washburn law and it is shown that gravity is negligible during this liquid rise
[20]. Spontaneous imbibition is important in the case of oil recovery and two-phase fluid transport
in fuel cell applications, which is an important industrial application for penetration into porous
material [21,22]. There are also several studies on the impact and penetration of a liquid droplet in
capillary tubes. Delbos et al. [33] experimentally investigated the penetration of a capillary tube
using the initial kinetic energy of an impacting droplet. The experiments focused on a single
capillary tube with either a hydrophilic or hydrophobic surface. They studied the impact of liquid
drop on a single hole, with a diameter of the same order of magnitude as the drop size and
evaluated different regimes for penetration based on hydrophobicity of the surface [33]. These
studies presented detailed experimental investigation of the phenomenon of penetration
concentrated on the effect of varying droplet size rather than pore size.
Reis et al. [23] evaluated the influence of different parameters on the penetration, including
Darcy number (Da), which is the ratio of the impact momentum to dissipation by the porous
matrix. In fluid dynamics of flow through porous media, Darcy number represents the relative
effect of the permeability of the medium versus its cross-sectional area. Smaller values of Da,
shows that the flow resistance of the substrate is large, since the space available for the fluid to
flow is smaller, and the penetrated liquid occupies a larger overall volume of the substrate. In the
study of droplet impact on a porous substrate several parameters need to be considered such as
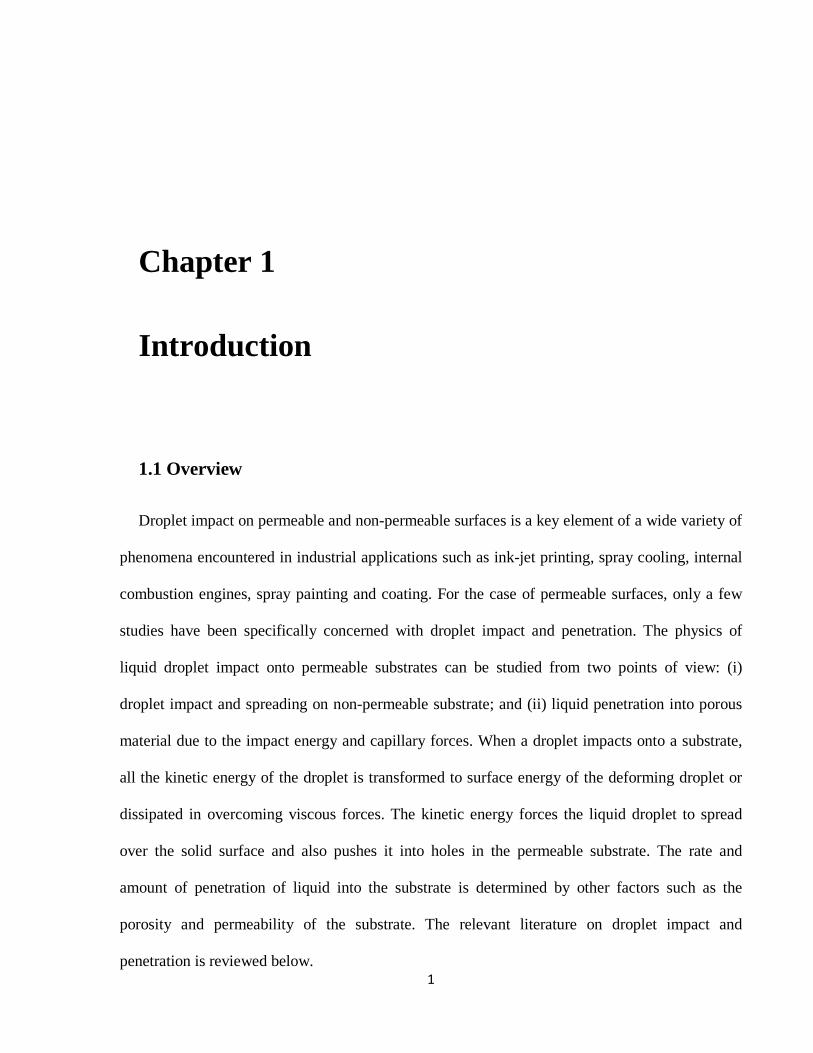
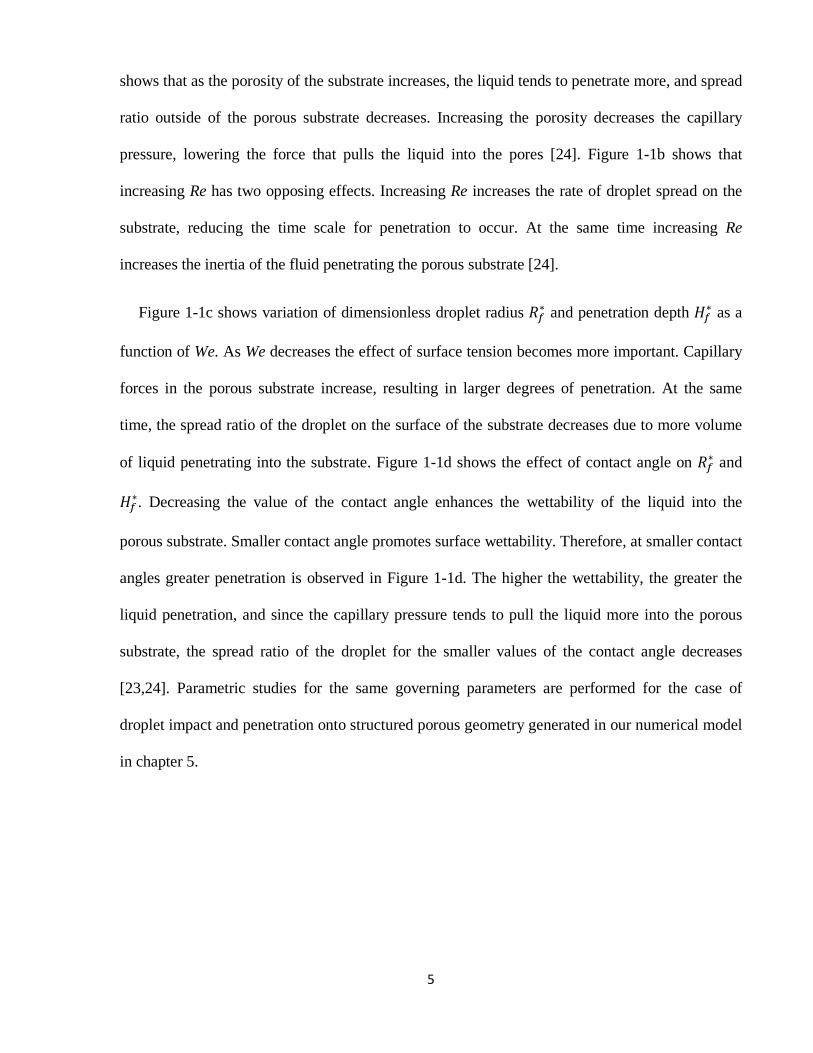
spreading diameter, contact angle and penetration depth [24]. Figure 1-1a shows the variation of
penetration depth (𝐻𝑓∗) and spread ratio (𝑅𝑓∗) as a function of porosity of the substrate (𝜀). It
5
shows that as the porosity of the substrate increases, the liquid tends to penetrate more, and spread
ratio outside of the porous substrate decreases. Increasing the porosity decreases the capillary
pressure, lowering the force that pulls the liquid into the pores [24]. Figure 1-1b shows that
increasing Re has two opposing effects. Increasing Re increases the rate of droplet spread on the
substrate, reducing the time scale for penetration to occur. At the same time increasing Re
increases the inertia of the fluid penetrating the porous substrate [24].
Figure 1-1c shows variation of dimensionless droplet radius 𝑅𝑓∗ and penetration depth 𝐻𝑓∗ as a
function of We. As We decreases the effect of surface tension becomes more important. Capillary
forces in the porous substrate increase, resulting in larger degrees of penetration. At the same
time, the spread ratio of the droplet on the surface of the substrate decreases due to more volume
of liquid penetrating into the substrate. Figure 1-1d shows the effect of contact angle on 𝑅𝑓∗ and
𝐻𝑓∗. Decreasing the value of the contact angle enhances the wettability of the liquid into the
porous substrate. Smaller contact angle promotes surface wettability. Therefore, at smaller contact
angles greater penetration is observed in Figure 1-1d. The higher the wettability, the greater the
liquid penetration, and since the capillary pressure tends to pull the liquid more into the porous
substrate, the spread ratio of the droplet for the smaller values of the contact angle decreases
[23,24]. Parametric studies for the same governing parameters are performed for the case of
droplet impact and penetration onto structured porous geometry generated in our numerical model
in chapter 5.
6
(a) (b)
(c) (d)
Figure 1-1: The variation of penetration depth (𝑯𝒇∗) () and spread ratio (𝑹𝒇∗) (▲) as a function
(a) porosity, (b) Re, (c) We and (d) contact angle [23]
1.2.3 Droplet impact on paper (printing industry)
Droplet impact on paper is observed in solid ink jet printing. Solid ink color printing
technology is widely used in the office printing, prepress proofing, and wide format color printing
markets. Solid ink is a wax-resin based ink which is solid at room temperature, and melts when
heated. The solid ink is placed inside the print head of a printer and heated to its melt point before
printing. The melted ink is then ejected through the orifices on the print head as single droplets,
which are aimed on a surface to generate an image [34].
7
A number of experimental studies were done on droplet impact and penetration onto permeable
substrate in the printing industry, in order to understand the physics of penetration and guide
subsequent analytical and numerical studies. The printer reproduces images using round dots of
ink [35], which are the smallest spots of ink that a printer is capable of producing. Dot quality is
key to the perception of print quality. To achieve accurate reproduction of colors and images, dot
size (covered area), dot shape (roundness) and dot placement accuracy on the paper must be
precisely controlled. In a printer, for each electrical pulse supplied to the print head, a dot (usually
a round shape) with a controlled diameter is produced and deposited at a required location on the
paper. The substrate and its conditions have a significant effect on the adhesion between the
deposited droplets and the substrate. Currently, different printing solutions provide a range of
quality and performance. By altering the ink composition, paper material (including finish), and
method of application, printing results can vary from basic black and white to vivid high quality
color resolution [34].
To improve printing results as well as reduce costs the printing industry is attempting to
change the printing process from a multi-step (print head-to-drum-to-paper) to single-step process
(direct printing: print head-to-paper). In order to achieve a direct printing process, a better
understanding of solid ink adhesion and penetration of ink into the paper is required. These
factors are essential to determine the optimal printing parameters for superior image quality and
performance. Although there are industry methods to qualitatively measure the effects of adhesion
and penetration, there is a lack of quantitative information for these parameters. Quantitative
results require proper control over many parameters including humidity, temperature, air flow,
velocity, and pressure. In addition, a better understanding of the effects of paper coatings (surface
finishing) on altering adhesion and penetration of ink on porous material is needed [35].
8
1.2.4 Paper
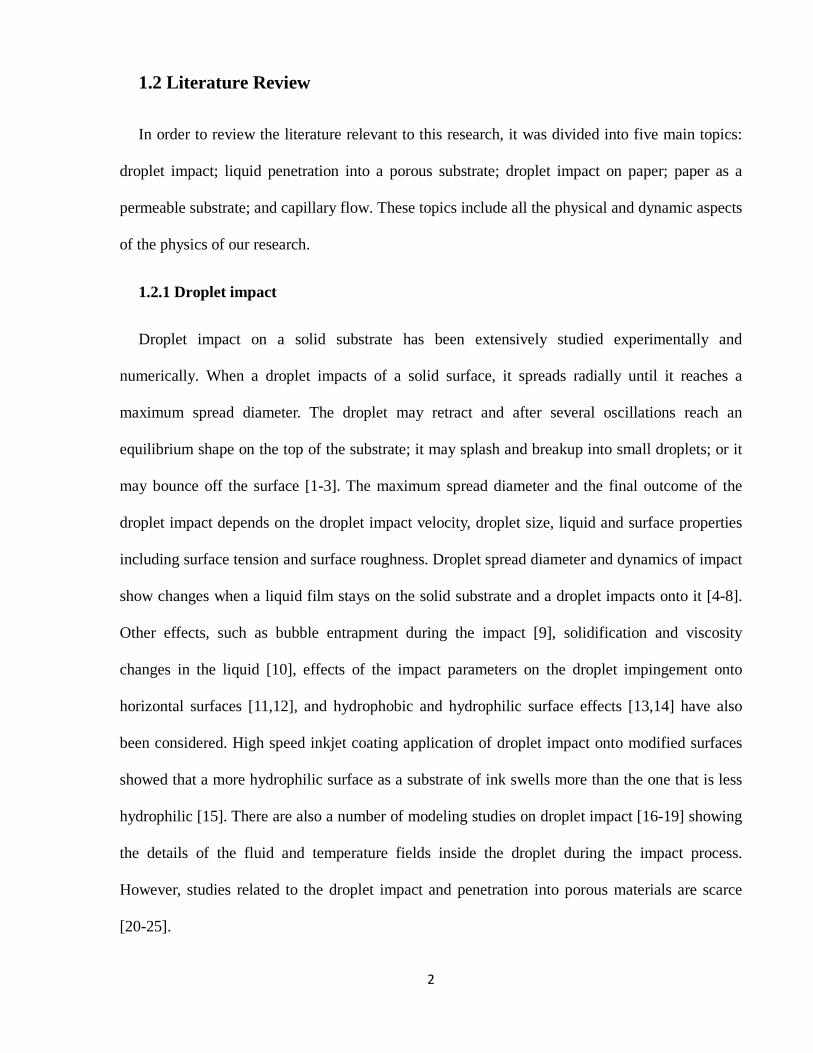
Paper is a permeable material that absorbs the liquid into itself. Paper consists of a network of
cellulosic fibers [38]. These fibers are deposited stochastically in planes compressed to each other
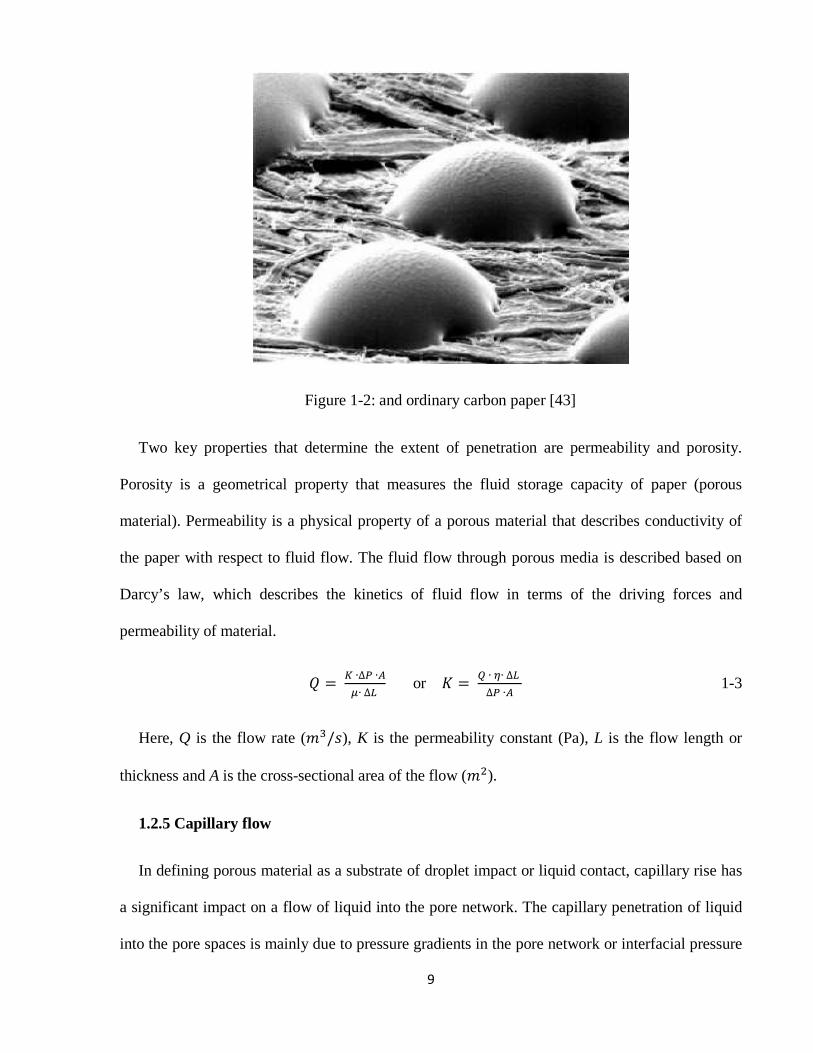
to form the thickness of paper. The taxonomy of these fibers that is observable in Figure 1-2 is
heterogeneous in all directions of the surface of paper. Pores form in the spaces between fibers
and provide pathways for fluid flow [39]. Some fiber materials and their typical dimensions are
provided in Table 1-1 [40].
Table 1-1: Characteristic properties of softwood fibers used in papermaking
Length (mm) Fiber diameter (𝜇𝑚)
Scots pine
2.1 37
Scots pine plus
2.1 30
Western hemlock 2.4 31
Douglas fir 2.8 34
Paper fiber lengths are in the range of a few millimeters. Fibers are arranged randomly in a
planar structure [41]. A typical paper sheet contains, on average, ten fibers across its thickness;
therefore, the diameter of a fiber is approximately one-tenth the paper thickness. About half of
these fibers, at some point, are exposed to the open surface and the rest are located in the interior
structure of paper. Figure 1-2 represents a paper fiber network [42].
9
Figure 1-2: and ordinary carbon paper [43]
Two key properties that determine the extent of penetration are permeability and porosity.
Porosity is a geometrical property that measures the fluid storage capacity of paper (porous
material). Permeability is a physical property of a porous material that describes conductivity of
the paper with respect to fluid flow. The fluid flow through porous media is described based on
Darcy’s law, which describes the kinetics of fluid flow in terms of the driving forces and
permeability of material.
𝑄 = 𝐾 ∙∆𝑃 ∙𝐴𝜇∙ ∆𝐿
or 𝐾 = 𝑄 ∙ 𝜂∙ ∆𝐿 ∆𝑃 ∙𝐴
1-3
Here, Q is the flow rate (𝑚3/𝑠), K is the permeability constant (Pa), L is the flow length or
thickness and A is the cross-sectional area of the flow (𝑚2).
1.2.5 Capillary flow
In defining porous material as a substrate of droplet impact or liquid contact, capillary rise has
a significant impact on a flow of liquid into the pore network. The capillary penetration of liquid
into the pore spaces is mainly due to pressure gradients in the pore network or interfacial pressure
10
differences [44]. The simplest model of liquid flow into capillaries is that of cylindrical capillary
tubes. Hamraoui et al. [45] studied the mechanism of capillary rise into an infinite cylindrical
capillary tube by accounting for all the dynamic and physical forces applied to the meniscus of
liquid in capillary tubes, which include: surface tension force, inertia force, gravity force and
force due to liquid viscosity. The equilibrium of these forces provides the Lucas-Washburn
equation:
𝜌𝜋𝑟2 𝜕𝜕𝑡�ℎ(𝑡) 𝜕ℎ(𝑡)
𝜕𝑡� = 2𝜋𝑟𝜎 𝑐𝑜𝑠(𝜃) − 𝜋𝑟2𝜌𝑔ℎ(𝑡) − 8𝜋𝜇ℎ(𝑡) 𝜕ℎ(𝑡)
𝜕𝑡 1-4
Where h(t) is the penetration of liquid into the capillary tube over time of t and r is the capillary
radius. Solving this equation gives the rate of liquid rise as follows [46]:
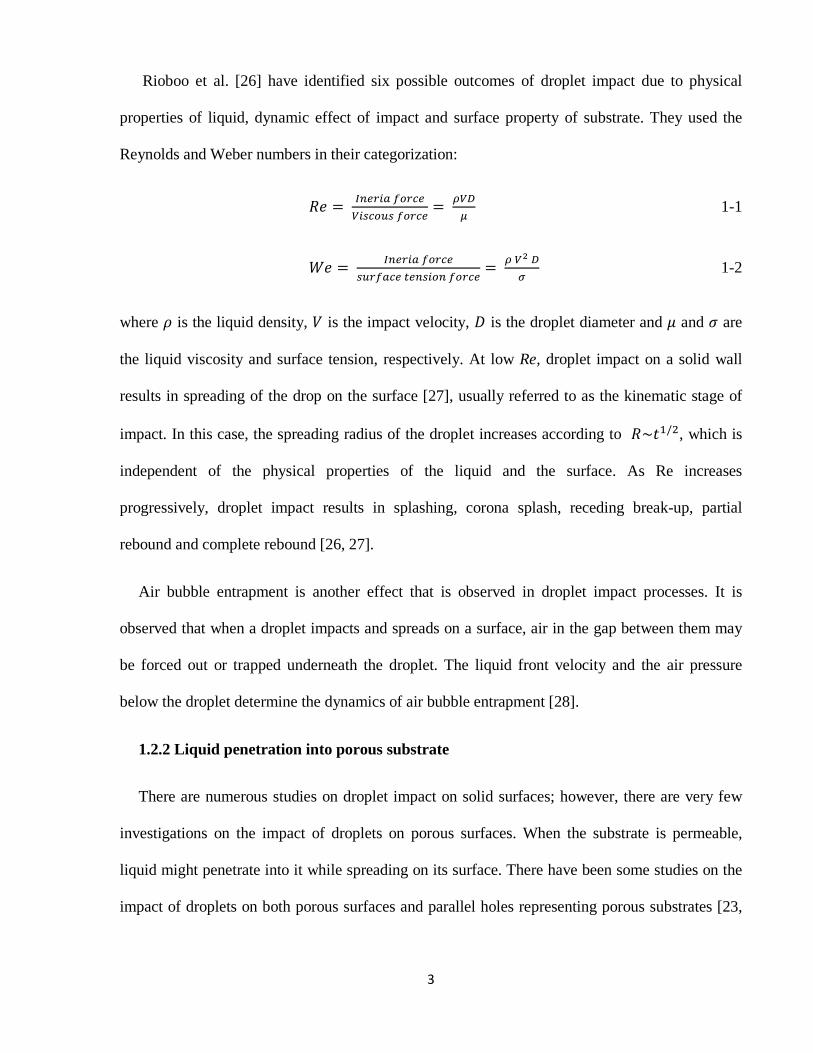
ℎ(𝑡) = �𝜎𝑟𝑐𝑜𝑠𝜃2𝜇
𝑡 1-5
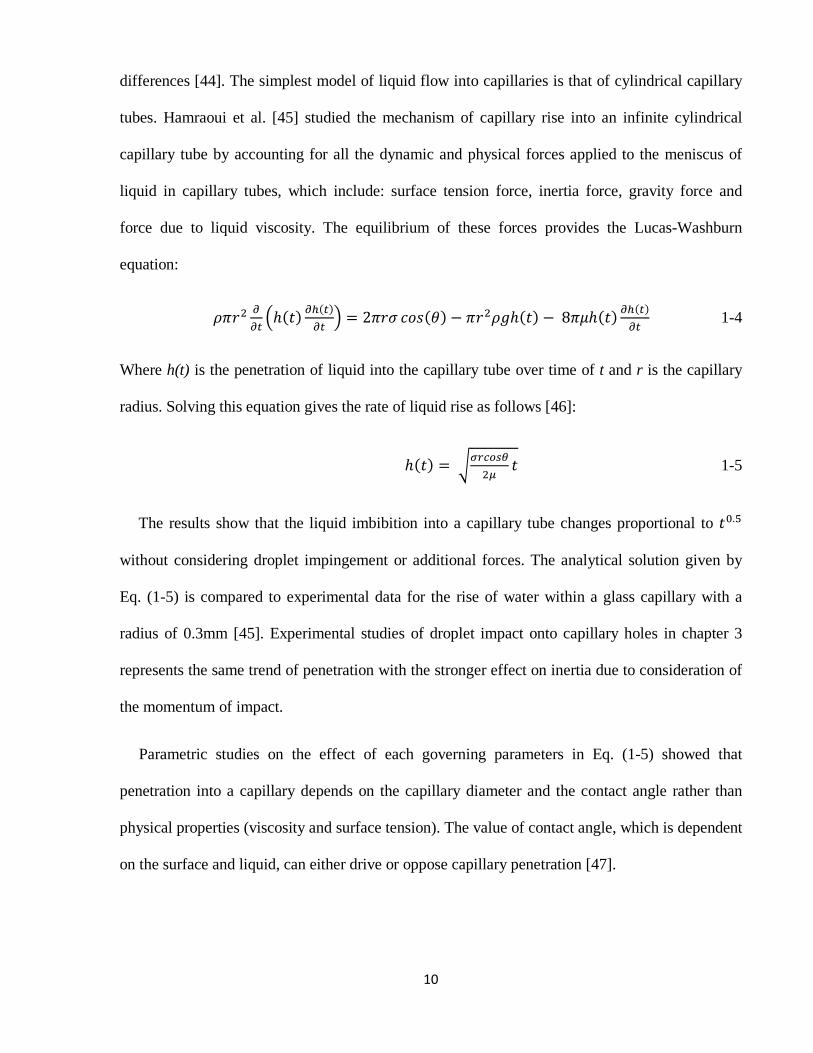
The results show that the liquid imbibition into a capillary tube changes proportional to 𝑡0.5
without considering droplet impingement or additional forces. The analytical solution given by
Eq. (1-5) is compared to experimental data for the rise of water within a glass capillary with a
radius of 0.3mm [45]. Experimental studies of droplet impact onto capillary holes in chapter 3
represents the same trend of penetration with the stronger effect on inertia due to consideration of
the momentum of impact.
Parametric studies on the effect of each governing parameters in Eq. (1-5) showed that
penetration into a capillary depends on the capillary diameter and the contact angle rather than
physical properties (viscosity and surface tension). The value of contact angle, which is dependent
on the surface and liquid, can either drive or oppose capillary penetration [47].
11
Figure 1-3: Analytical solution and experimental data for the capillary rise of water at capillary
diameter of 0.3mm [45]
Fries et al. [48] investigated the initial moments of capillary rise in capillary tubes. The
dynamics of capillary rise of liquid into the capillary tube can be derived using a momentum
balance for the liquid inside a capillary tube. Capillary forces must be balanced by inertial,
viscous and hydrostatic forces:
2𝜎𝑐𝑜𝑠𝜃𝑟
= 𝑑�𝜌ℎℎ̇�𝑑𝑡
+ 8𝜇ℎ𝑅2
ℎ̇ + 𝜌𝑔ℎ 1-6
where 𝜎 refers to the surface tension, 𝑟, capillary radius and 𝜌 and 𝜇, liquid viscosity and density.
Capillary rise into the tube separated into the very first moments after the contact of the tube with
the liquid as purely inertial time stage. During this time, neglecting viscous and gravity effects,
gives [50]:
2𝜎𝑐𝑜𝑠𝜃𝜌𝑟
= ℎ̇2 + ℎℎ̈ 1-7
12
Solving this differential equation shows the capillary rise due to inertia of impact of tube into
liquid as:
ℎ = 𝑡�2𝜎𝑐𝑜𝑠𝜃𝜌𝑟
1-8
After the very first moment, Bosanquet [49] presented a solution for viscous and inertia time
stage
𝑑𝑑𝑡�ℎℎ̇� + 8𝜇
𝑟2𝜌 �ℎℎ̇� = 2𝜎𝑐𝑜𝑠𝜃
𝜌𝑟 1-9
Solution of this ODE is
ℎ = �𝑟𝜎𝑐𝑜𝑠𝜃2𝜇
[𝑡 − 𝑟2𝜌8𝜇
(1 − 𝑒−8𝜇𝑡𝑟2𝜌)] 1-10
For 𝑡 → ∞, this equation converges into the Lucas-Washburn equation which is:
ℎ = �𝑟𝜎𝑐𝑜𝑠𝜃2𝜇
𝑡 1-11
Fries et al. [48] also studied the separation of time stages in transitions between inertia to
capillary rise. Rearrangement between Bosanquet [49] and Quere [50] solutions finds 𝑡1, the
transition time between purely inertia to viscous-inertia (capillary) rise as:
𝑡1 = 0.0232𝑟2𝜌𝜇
1-12
It should be mentioned here that, inertia timescale in chapter 3 shows the inertia timescale of
4𝑚𝑠 𝑡𝑜 8𝑚𝑠 for different heights of impact and 𝑡1 timescale represents the value of 5𝑚𝑠.
Berberovic [51] studied droplet impact on a porous substrate using the permeable wall model.
He presented the numerical procedure for interface capturing to compute drop impact on a porous
surface. Drop spreading on the permeable substrate is numerically modeled by computing only
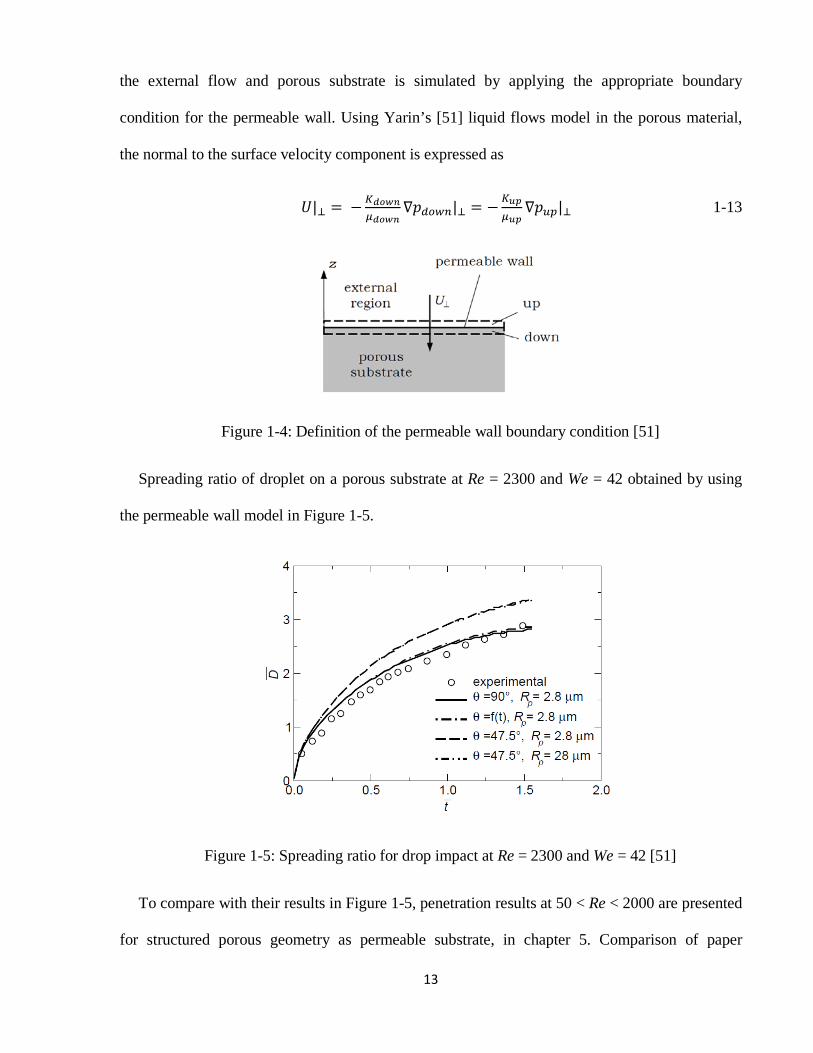
13
the external flow and porous substrate is simulated by applying the appropriate boundary
condition for the permeable wall. Using Yarin’s [51] liquid flows model in the porous material,
the normal to the surface velocity component is expressed as
𝑈|⊥ = −𝐾𝑑𝑜𝑤𝑛𝜇𝑑𝑜𝑤𝑛
∇𝑝𝑑𝑜𝑤𝑛|⊥ = −𝐾𝑢𝑝𝜇𝑢𝑝
∇𝑝𝑢𝑝|⊥ 1-13
Figure 1-4: Definition of the permeable wall boundary condition [51]
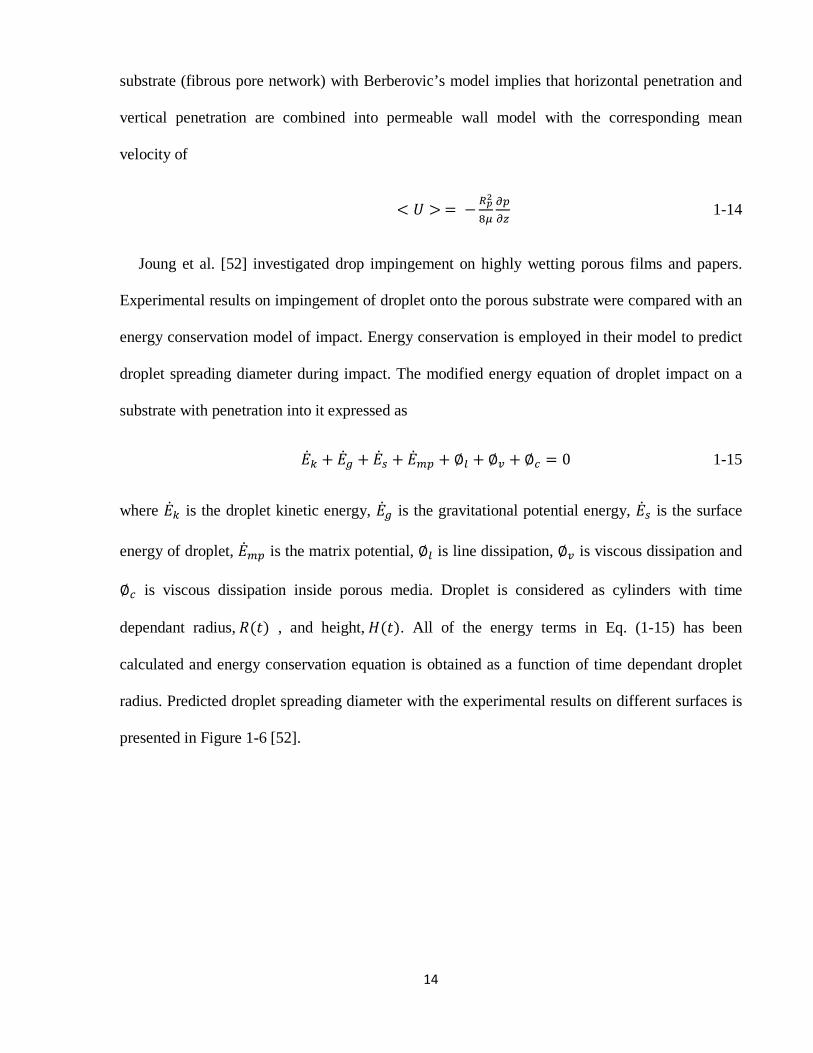
Spreading ratio of droplet on a porous substrate at Re = 2300 and We = 42 obtained by using
the permeable wall model in Figure 1-5.
Figure 1-5: Spreading ratio for drop impact at Re = 2300 and We = 42 [51]
To compare with their results in Figure 1-5, penetration results at 50 < Re < 2000 are presented
for structured porous geometry as permeable substrate, in chapter 5. Comparison of paper
14
substrate (fibrous pore network) with Berberovic’s model implies that horizontal penetration and
vertical penetration are combined into permeable wall model with the corresponding mean
velocity of
< 𝑈 > = −𝑅𝑝2
8𝜇𝜕𝑝𝜕𝑧
1-14
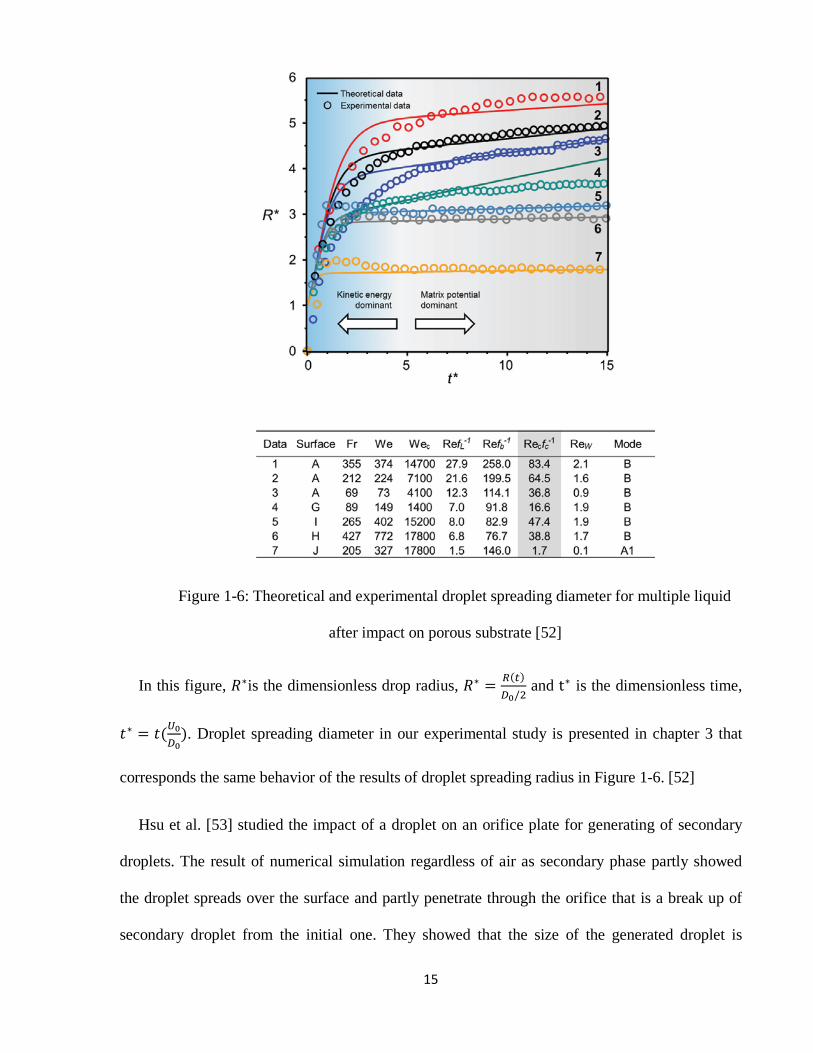
Joung et al. [52] investigated drop impingement on highly wetting porous films and papers.
Experimental results on impingement of droplet onto the porous substrate were compared with an
energy conservation model of impact. Energy conservation is employed in their model to predict
droplet spreading diameter during impact. The modified energy equation of droplet impact on a
substrate with penetration into it expressed as
�̇�𝑘 + �̇�𝑔 + �̇�𝑠 + �̇�𝑚𝑝 + ∅𝑙 + ∅𝑣 + ∅𝑐 = 0 1-15
where �̇�𝑘 is the droplet kinetic energy, �̇�𝑔 is the gravitational potential energy, �̇�𝑠 is the surface
energy of droplet, �̇�𝑚𝑝 is the matrix potential, ∅𝑙 is line dissipation, ∅𝑣 is viscous dissipation and
∅𝑐 is viscous dissipation inside porous media. Droplet is considered as cylinders with time
dependant radius, 𝑅(𝑡) , and height, 𝐻(𝑡). All of the energy terms in Eq. (1-15) has been
calculated and energy conservation equation is obtained as a function of time dependant droplet
radius. Predicted droplet spreading diameter with the experimental results on different surfaces is
presented in Figure 1-6 [52].
15
Figure 1-6: Theoretical and experimental droplet spreading diameter for multiple liquid
after impact on porous substrate [52]
In this figure, 𝑅∗is the dimensionless drop radius, 𝑅∗ = 𝑅(𝑡)𝐷0/2
and t∗ is the dimensionless time,
𝑡∗ = 𝑡(𝑈0𝐷0
). Droplet spreading diameter in our experimental study is presented in chapter 3 that
corresponds the same behavior of the results of droplet spreading radius in Figure 1-6. [52]
Hsu et al. [53] studied the impact of a droplet on an orifice plate for generating of secondary
droplets. The result of numerical simulation regardless of air as secondary phase partly showed
the droplet spreads over the surface and partly penetrate through the orifice that is a break up of
secondary droplet from the initial one. They showed that the size of the generated droplet is
16
related to the volume of the liquid immediately on top of the orifice while the droplet forms. They
considered initial stage of impact as an important and dominant time scale of orifice fluid flow. A
critical Re was identified for the generation of a secondary droplet.
Ashgriz et al. [54] used a numerical model to study the penetration of a liquid drop into radial
capillaries. They showed that an impacted droplet may or may not penetrate through a capillary
gap depending on the droplet velocity, fluid properties, contact angle and geometrical parameters
of the capillary gap. Their radial capillary gap was formed by two parallel plates at a small
distance from each other. They set a contact angle of 93.3° as a threshold of capillary penetration.
They showed capillary penetration increases with reduction of viscosity and extremely with larger
degree of surface tension. Thinner capillary gaps resulted in more penetration [54].
Range et al. [55] studied the impact of a droplet onto a surface with different degrees of
roughness. They observed that the splashing process may occur at lower impact velocities for
surface with larger degrees of roughness.
1.3 Objectives
The objectives of this work include:
• Understanding the physics of penetration of liquid droplet impacts onto a capillary
holes substrate and evaluation of the effect of physical and dynamic parameters on it.
• Studying the effect of impact momentum and capillarity on liquid penetration inside
capillary tubes.
• Defining interlocking regime inside an inverted T-hole as a structured model of
adhesion and studying the effect of governing parameters on this regime.
17
• Discussing the physics of liquid penetration into the 3D structured pore network and
evaluating the effect of droplet impact parameters on the volume of liquid penetrating
into it. Observation a wide range of Reynolds and its effect on penetration, and porosity
of the substrate. A comparison of the inertia and capillary driven penetration regimes
by changing the impact Weber will be done in Chapter 5.
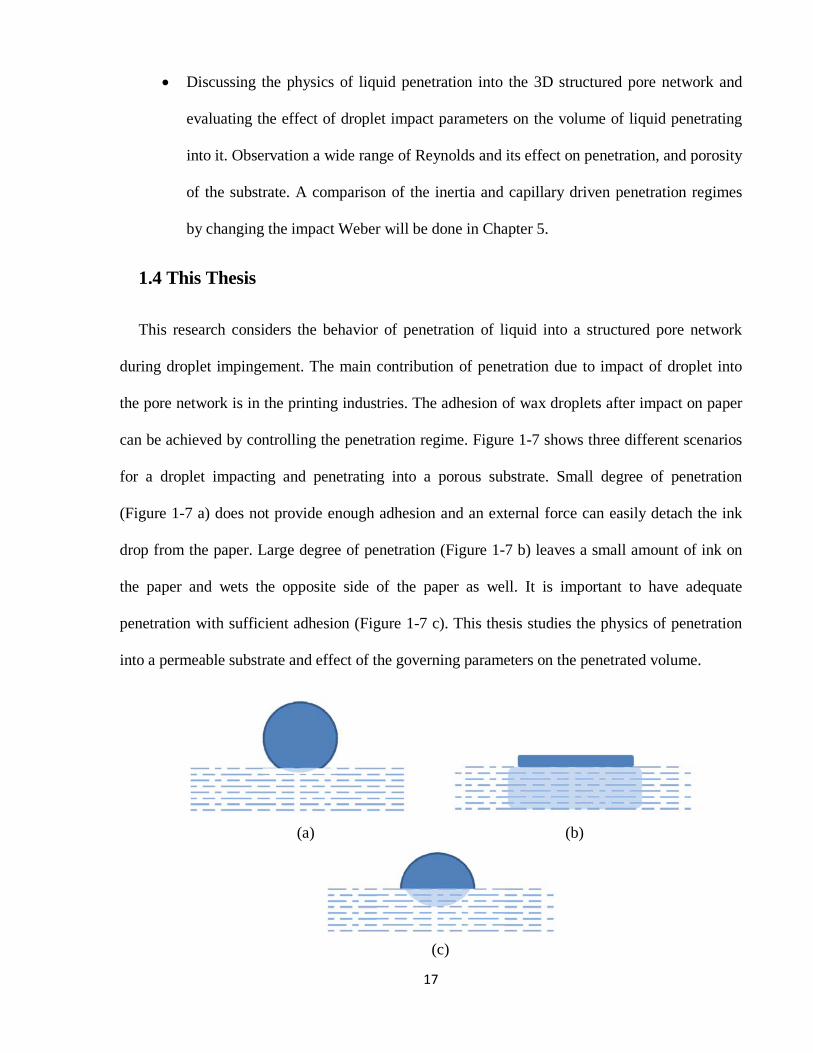
1.4 This Thesis
This research considers the behavior of penetration of liquid into a structured pore network
during droplet impingement. The main contribution of penetration due to impact of droplet into
the pore network is in the printing industries. The adhesion of wax droplets after impact on paper
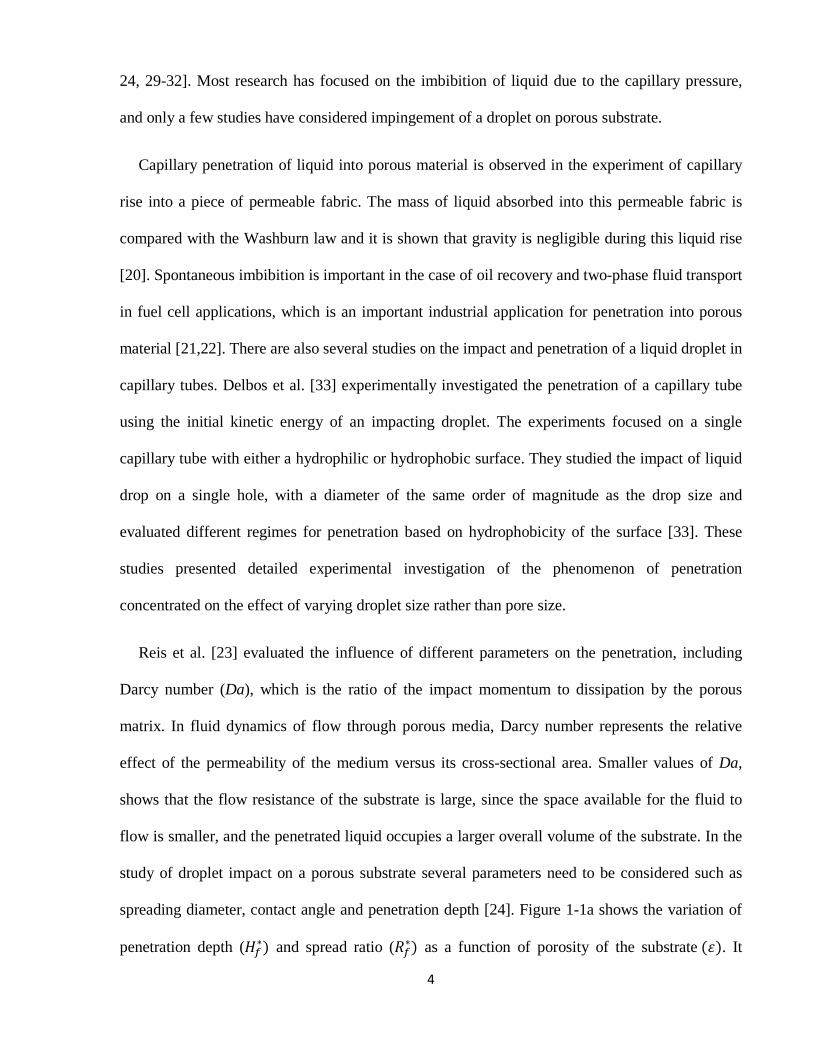
can be achieved by controlling the penetration regime. Figure 1-7 shows three different scenarios
for a droplet impacting and penetrating into a porous substrate. Small degree of penetration
(Figure 1-7 a) does not provide enough adhesion and an external force can easily detach the ink
drop from the paper. Large degree of penetration (Figure 1-7 b) leaves a small amount of ink on
the paper and wets the opposite side of the paper as well. It is important to have adequate
penetration with sufficient adhesion (Figure 1-7 c). This thesis studies the physics of penetration
into a permeable substrate and effect of the governing parameters on the penetrated volume.
(a) (b)
(c)
18
Figure 1-7: Schematic model of penetration of an impacted droplet onto the porous
substrate
Prior droplet impact studies have mainly considered droplet impact dynamics on impervious
surfaces. The current study focuses more on the droplet dynamics inside a pore structure. In order
to achieve these goals three main tasks have been carried out in this study:
1) Capillary holes penetration: Experimental studies, presented in chapter 3, have
been designed to observe the penetration of liquid into a line of parallel holes under a
droplet impacting and spreading on the substrate. The experimental results have also
been used to validate the numerical model.
2) Impact of liquid droplet on an inverted T-Hole: A structured grid of pores
contains a large number of corners where vertical and horizontal pores meet to form a T.
If the liquid penetrating into a pore turns around a corner and then penetrates into the
horizontal branch of T, the droplet will adhere strongly to the surface. This dynamic that
liquid penetrates into the T structured and stays there during droplet oscillation on the
substrate; is called liquid interlocking. Chapter 4 studies the penetration of liquid in a T-
shape capillary tube. A number of T-hole with varying vertical length have been
modeled to understand how liquid penetrates into the horizontal branch. After studying
the physics of horizontal ligament formation, parametric studies has been performed on
the numerical simulations to see the effect of impact velocity, droplet diameter, pore
diameter and contact angle on liquid interlocking regime.
3) Impact of liquid droplet on structured pore network: A fiber-based paper was
modeled as a porous substrate consisting of capillary holes laid out in a structured, three-
dimensional Cartesian grid. Capillary size has been set to match paper fiber length and
19
diameter. The impact of liquid droplet on this substrate has been simulated and the
volume of liquid penetrating studied for a range of Re, We, liquid viscosity and pore size.
Results of this study are presented in chapter 5 as the final step of this research
dissertation.
At the end, chapter 6 provides the summary and conclusions of the study.
20
Chapter 2
Governing Equation and Numerical Model
2.1 Overview
The governing equations of Navier-Stokes (conservation of mass and momentum) and the
interface tracking method are described in this chapter. Numerical methods that were used to
obtain 3D results from the model are explained. Mesh development for 3D model and its
refinement is explained. 3D simulation is performed using the ANSYS-FLUENT 14.0. Volume of
Fluid (VOF) algorithm is used in the solver to capture the interface between the liquid and the
gas.
2.2 Mathematical Formulation
The assumptions for solving conservation of mass and momentum are that liquid and gas are
incompressible and Newtonian. The properties of the two phases are constant and fluid flow is
laminar. The liquid droplet is assumed spherical at the moment of impact in all numerical
simulations and droplet deformation during flight is neglected.
21
The conservation of mass equation for an incompressible fluid is written as:
∇.𝑉 ���⃗ = 0 2-1
A single momentum equation is solved for both the liquid and the gas phases. The momentum
equation for an incompressible fluid is:
𝜕𝑉��⃗
𝜕𝑡+ 𝑉�⃗ .∇𝑉�⃗ = − 1
𝜌∇𝑝 + 1
𝜌∇. 𝜏 + 1
𝜌�⃗�𝑆𝐹 + 1
𝜌�⃗�𝐵 2-2
Where ρ and µ are the fluid density and dynamic viscosity, respectively, 𝑉 ���⃗ is the velocity
vector, p the pressure, 𝜏 the shear stress tensor, g�⃗ the gravitational , �⃗�𝐵 is all the body forces
acting on the fluid, and �⃗�𝑆𝐹 is the surface tension force per unit volume at the liquid/gas interface.
The equations are discretized on an Eulerian grid with structured non-uniform mesh size. Eulerian
frame of reference couples the solution with one of the methodologies of interface tracking of
liquid. The Volume of Fluid (VOF) method is used in ANSYS-FLUENT 14.0 to track the
interface. The portion of the phase in the grid is specified as 𝛼, where 𝛼 = 1 denoted to cell with
liquid and 𝛼 = 0 for cells filled with gas. 0 < 𝛼 < 1 is related to the cells which contain a portion
of the interface. VOF method is advected by the fluid flow written as:
𝜕𝛼𝜕𝑡
+ �𝑉�⃗ .∇�𝛼 = 0 2-3
The density in each computational grid can be calculated based on the value of 𝛼 in the cell.
This can be written as:
𝜌𝑛𝑐𝑒𝑙𝑙 = 𝛼 × 𝜌𝑙𝑖𝑞𝑢𝑖𝑑 + (1 − 𝛼) × 𝜌𝑔𝑎𝑠 2-4
To add surface tension force to the VOF calculation results, continuum surface force (CSF)
model has been implemented in ANSYS-FLUENT 14.0. The pressure at the liquid-gas interface
is written as:
22
∆𝑃 = 𝑃𝑙𝑖𝑞𝑢𝑖𝑑 − 𝑃𝑎𝑖𝑟 = 𝜎κ 2-5
Where ∆𝑃the interfacial pressure difference and κ is is the surface curvature. The curvature κ is
equal to:
𝑘 = 1𝑅1
+ 1𝑅2
2-6
Where 𝑅1 and 𝑅2 are the two radii orthogonal direction of curvature and the shear stress is
assumed to be zero.
The importance of surface tension is determined based on the value of two dimensionless
numbers: Weber number and capillary number. Since 𝑅𝑒 ≫ 1 in our experimental and numerical
studies, Weber number is considered rather than capillary number.
Re, Ca and We are defined as
𝐶𝑎 = 𝜇𝑈𝜎
2-7
𝑅𝑒 = 𝜌𝑈𝐷𝜇
2-8
𝑊𝑒 = 𝜌𝑈2𝐷𝜎
2-9
Ohnesorge number, Oh, and Bond number, Bo, are two other dimensionless values that
correspond the ratio of viscous effect and gravity to capillary; respectively.
𝑂ℎ = 𝜇�𝜌 𝜎 𝑑ℎ
2-10
𝐵𝑜 = 𝜌 𝑔 𝑑ℎ2
𝜎 2-11
where U is the free-stream velocity, D is the droplet diameter, and 𝜌 , 𝜇 𝑎𝑛𝑑 𝜎 are liquid density,
viscosity and surface tension and 𝑑ℎ represents the capillary hole diameter.
23
In order to consider the effect of contact angle, wall adhesion angle is considered in ANSYS-
FLUENT 14.0. There are two applications of contact angle utilized for this study. For Re<100
where the retraction phase of droplet on the substrate is small, receding contact angle is not
observed into the porous substrate. Therefore a static advancing contact angle is applied in our
numerical simulations for low range of Re. For Re>>100, retraction of the droplet transfers
considerable pressure into the porous substrate which makes the effect receding contact angle to
be significant. Several researches in multiphase flow study (Chandra and Avedisian, 1991, Gunjal
et al. 2005, Roisman et al. 2008) reported the use of dynamic contact angle in their simulations
gives a better agreement with experimental data for the condition in their work, in which a longer
duration of impact phenomena was considered. In this study, effect of dynamic contact angle is
considered for our initial numerical simulations. A UDF is set to apply the change of contact
angle at solid, liquid interface. Numerical simulation validation with the experimental results of
droplet impact and penetration onto the parallel holes substrate (chapter 3) implied the fact that
static contact angle of 85° showed the best fit to the experimental data.
2.3 3D Solver
In the discretization of the momentum equation, the gradient has been solved in the method of
Least Squares Cell-Based Gradient evaluation. In this method, the solution is assumed to vary
linearly. It means to compute the gradient of scalar 𝜑 at the cell centre 𝑐0, the following discrete
form is written as:
(∇𝜑)𝑐0 .∆𝑟𝑖 = (𝜑𝑐𝑖 − 𝜑𝑐0) 2-12
where, 𝑐𝑖 denotes the cell adjacent to 𝑐0 and ∆𝑟𝑖 is distance from the centroid of 𝑐0 and 𝑐𝑖.
The Pressure solution uses PRESTO spatial discretization scheme. PRESTO method
(PREssure STaggering Option) uses the discrete continuity balance for a “staggered” control
24
volume about the face to compute the “staggered” pressure. This method is accurate for
quadrilateral grids that are selected for our geometry meshing. Momentum has been discretized in
second-order upwind scheme. When second-order accuracy is applied to the momentum equation,
quantities at cell faces are computed using a multidimensional linear reconstruction approach.
Finally, the VOF model for Eulerian multiphase use Geo-Reconstruct scheme.
The pressure-based solver with an algorithm belongs to the projection method is used in
ANSYS-FLUENT 14.0 to solve the two-phase liquid gas flow modeling. In projection method,
mass conservation of the velocity is achieved by solving pressure equation. The solution
converges when coupled governing equations of conservation of mass and momentum solves
repeatedly and meets the convergence criteria of the case. The SIMPLE algorithm as one of the
segregated algorithms is used to solve these physics. This algorithm uses the relationship between
velocity and pressure corrections and with this relationship and mass conservation the pressure
field is obtained. The Pressure-Implicit with Splitting of Operators (PISO) pressure-velocity
coupling scheme that is part of the SIMPLE family algorithms is the scheme in the solution
method for solving pressure-velocity coupling. PISO algorithm that is based on the higher degree
of approximate relation between the corrections for pressure and velocity overcomes the
limitation of SIMPLE and SIMPLEC algorithm. This is the main reason of using this method for
pressure-velocity coupling. This efficiency improvement has been achieved by two corrections:
neighbor correction and skewness correction.
2.3.1 Solution algorithm
25
The solution algorithm for advancing procedure through an increment in time 𝛿𝑡 including the
steps of:
1. Explicit approximations of Eq. (2-2) are used to compute the first guess for new time-level
velocities. This guess using with the initial conditions at first-time step or previous time-
level values of all advective, pressure, and viscous accelerations at other time steps.
2. To satisfy the continuity equation, Eq. (2-1), pressures are iteratively adjusted in each grid
of the geometry. Meanwhile, the velocity changes achieved by each pressure change are
added to the velocities evaluated in the previous step. Pressure change in one cell in order
to satisfy Eq. (2-1) affects on balance of pressure on four other cells; thus an iteration is
needed to balance this change.
3. VOF function that defines the interface of liquid/gas is updated in Eq. (2-3) to produce the
new liquid/gas interface.
4. Boundary conditions will be updated at the end and time advances by on increment of 𝛿𝑡.
2.4 Geometry and Meshing
Numerical simulations have been studied on three different geometries. Numerical code with
User Defined Functions (UDF) applications has been validated by modeling liquid droplet impact
on line of capillary parallel holes along the diameter of the droplet while it spreads on the
substrate. Initialization UDF is used to enforce the initial spherical phase of liquid into the cubic
geometry with structured mesh. Another UDF is used to enforce the liquid/solid contact angle as
the contact line velocity changes. This UDF is used in numerical model validation section in
chapter 3 to define the contact angle based on our experimental model for the next numerical
studies.
26
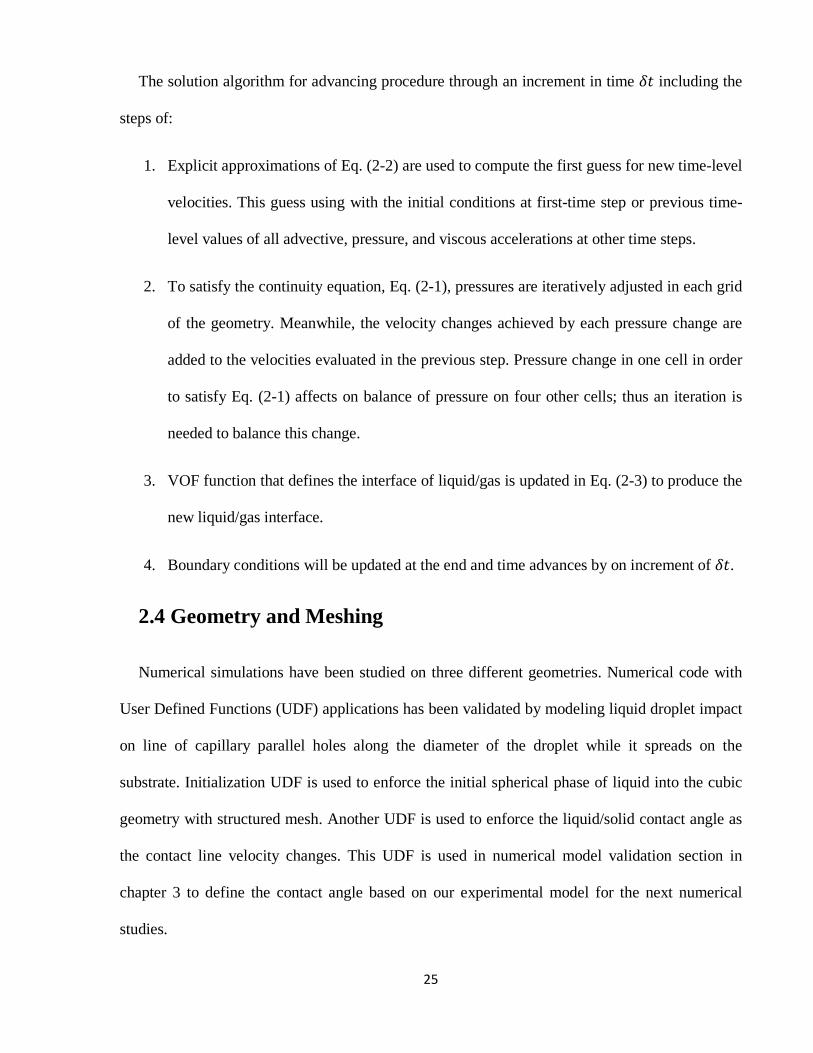
The parallel hole geometry that is studied in chapter 3 consists of seven holes with a cross
section of the square. These cross sections are extruded throughout the cubical volume that
contains the droplet in it, shown in Figure 2-1.
Figure 2-1: Parallel holes numerical geometry
The main cube which contains a 3.2 mm diameter droplet is 5x5x3mm. Each capillary holes
has a cross section width of 0.3mm with a spacing of 0.3mm from each other. The vertical depth
of these holes is 7mm.
The cube has structured non-uniform hexahedral grids in its volume. Non-uniformity of the
grid type comes from the refinement application into the holes to keep the mesh accuracy in the
range of our interest. Number of grid is set as ten grid per length of the holes and 50 per diameter
of the droplet. Grid has been applied by slicing the geometry dependant to the holes and applying
the grid into all the surfaces in x and y directions. The third direction of the geometry has been
swept from the gridded surfaces with required refinement. The result of this meshing method is
27
7.2M elements into the entire geometry. This geometry is validated with the same experimental
studies designed in our lab that will be extensively explained in chapter 3.
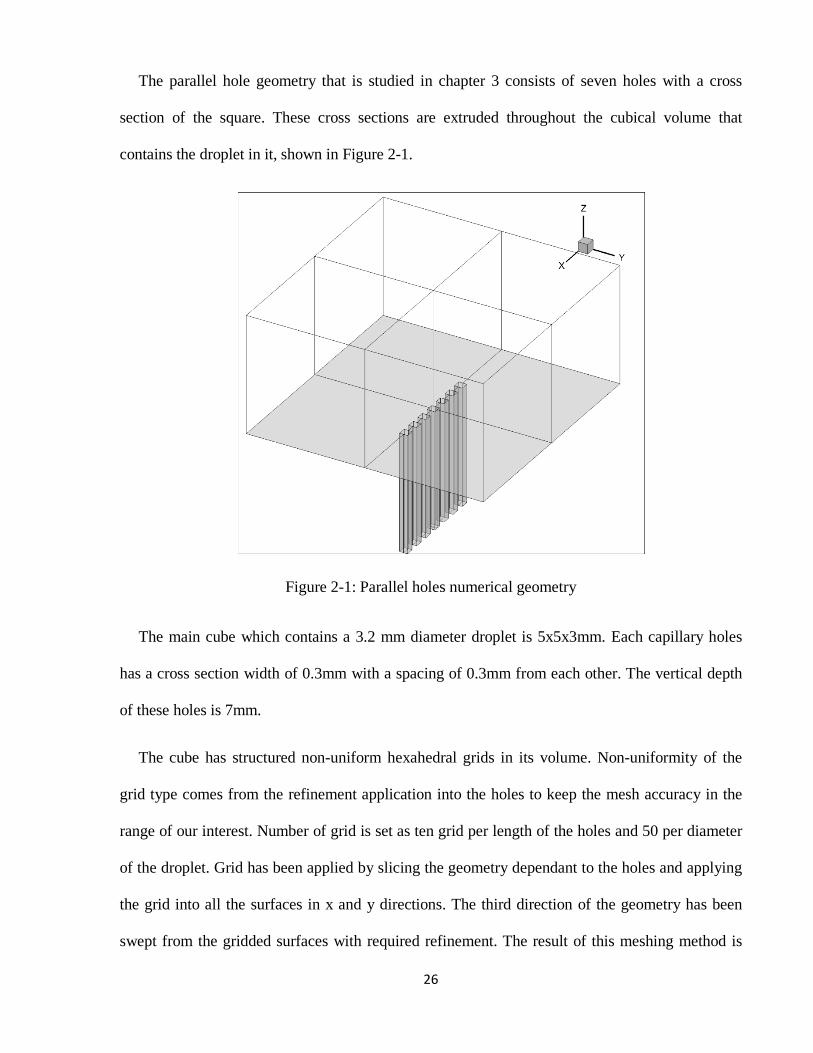
Figure 2-2: Inverted T-hole geometry
The second geometry is related to an inverted T-hole geometry studying the interlocking
physics of impact and capillary penetration. This geometry represented in Figure 2-2. is created
for impact on capillary T-hole study. The same meshing method has been applied with an
additional refinement at the sharp corner of T. Double refinement produced 20 grids per diameter
for the T-corner. This geometry has been created for a range of vertical length of T and 7.2M
elements into entire geometry is the mesh size.
28
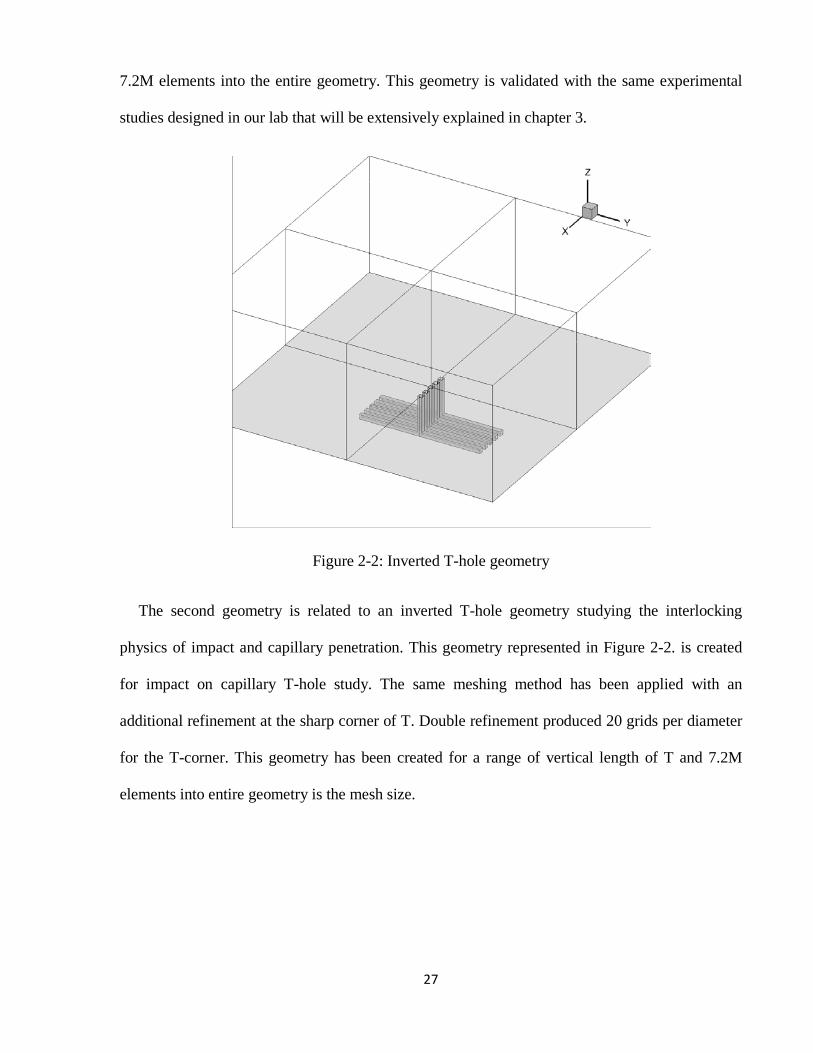
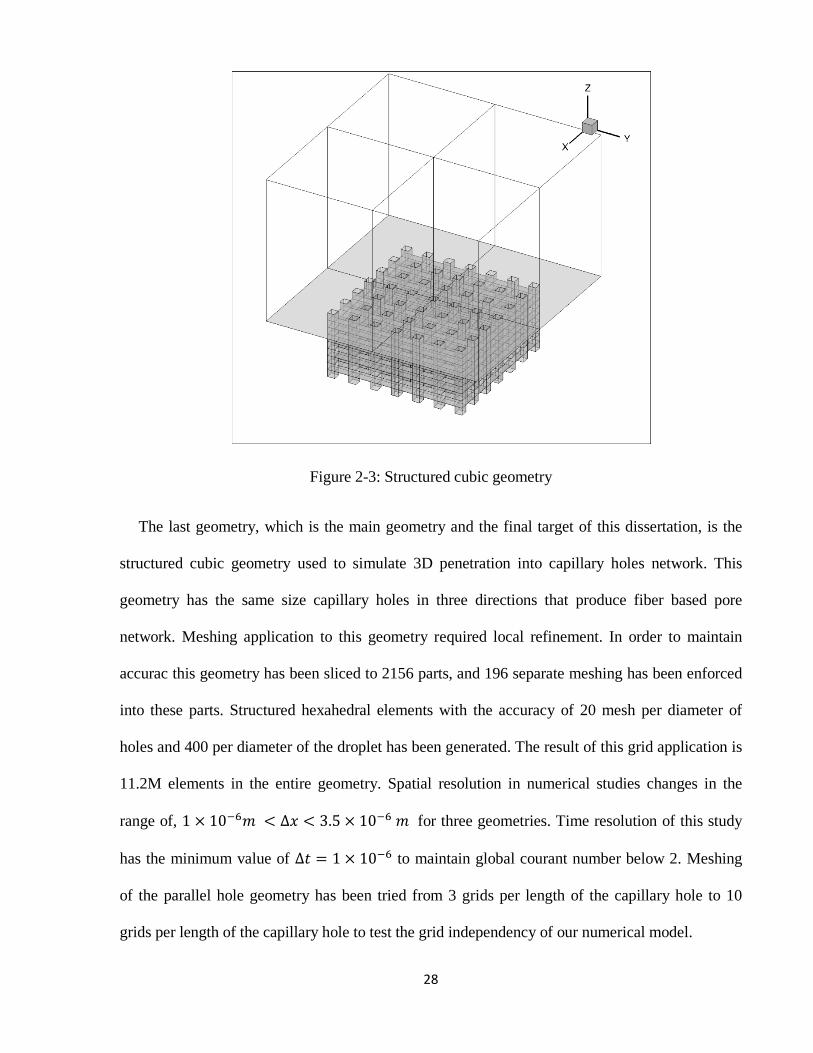
Figure 2-3: Structured cubic geometry
The last geometry, which is the main geometry and the final target of this dissertation, is the
structured cubic geometry used to simulate 3D penetration into capillary holes network. This
geometry has the same size capillary holes in three directions that produce fiber based pore
network. Meshing application to this geometry required local refinement. In order to maintain
accurac this geometry has been sliced to 2156 parts, and 196 separate meshing has been enforced
into these parts. Structured hexahedral elements with the accuracy of 20 mesh per diameter of
holes and 400 per diameter of the droplet has been generated. The result of this grid application is
11.2M elements in the entire geometry. Spatial resolution in numerical studies changes in the
range of, 1 × 10⁻⁶𝑚 < ∆𝑥 < 3.5 × 10⁻⁶ 𝑚 for three geometries. Time resolution of this study
has the minimum value of ∆𝑡 = 1 × 10⁻⁶ to maintain global courant number below 2. Meshing
of the parallel hole geometry has been tried from 3 grids per length of the capillary hole to 10
grids per length of the capillary hole to test the grid independency of our numerical model.
29
In all three geometries, liquid droplet is located in the centre of cube close to the substrate and
initial condition has been applied at that position.
2.5 Boundary and Initial Condition
Two boundary conditions, no-slip boundary condition and pressure-outlet boundary condition
are applied. The outer boundaries of the main cube and the last face of all holes have pressure-
outlet boundary condition, and the substrate and hole walls have no-slip boundary condition.
Liquid droplet has been initialized in the centre of cube with an enforced UDF to ANSYS-
FLUENT 14.0. The interface of the sphere has been utilized with volume fraction of liquid gas at
desired diameter of the initial droplet. Initial impact velocity has been applied to the liquid
volume fraction in the mesh before initial solution.
𝑉�⃗ = 𝑉0𝑧 2-13
2.6 Time Step Limitations
Time step limitation is derived through by the limit set for CFL (Courant-Friedrichs-Lewy) as
𝐶𝐹𝐿 = max(|𝑢|∆𝑡∆𝑥
, |𝑣|∆𝑡∆𝑦
, |𝑤|∆𝑡∆𝑧
) < 2 2-14
This minimum is chosen at each time step to guarantee the solution stability.
30
Chapter 3
Penetration of an Impacting Water Droplet
onto a Substrate with Line of Parallel Holes
3.1 Overview
The impact of water droplets on a transparent surface with a line of parallel holes drilled in it
was photographed. The penetration distance of the liquid into the holes was measured as a
function of time. The parallel hole substrate has been fabricated and set of experiments are
performed. The penetration results of these experiments are studied to observe the regime of
penetration at the moment of impact, during droplet spreading phase and after droplet is at rest.
This study was undertaken to observe the impact of water droplets on a transparent surface in
which a row of holes was drilled to create a porous substrate. The height of release of the droplet
was varied from 1 to 5 cm, and the movement of both the droplet and liquid in the holes
photographed. The height and diameter of spreading droplets and the distance of liquid movement
31
into the holes were measured from photographs. The objective was to develop simple models that
could predict the rate at which liquid penetrated the surface pores.
3.2 Experimental System
A schematic of the experimental setup used in this research is shown in Figure 3-1. A syringe
pump (NE-1000, New Era Pump Systems Inc., USA) was used to dispense one droplet of water
from a needle onto a substrate with a line of parallel-holes drilled in it. The syringe containing the
distilled water was secured onto the pump, and a plastic tube was used to transfer the liquid from
the syringe onto the needle. The needle was attached to a height-adjustable experimental rig that
allowed us to vary the height of the needle with respect to the substrate. The experimental rig
consisted of three pillars with a threaded middle pillar, which allowed for height adjustments
using a hand-operated wheel on top of the structure. The base of the rig was screwed into the
optical table. The substrate was cleared from the optical table using spacers. It was ensured that
the spacers themselves did not restrict the bottom of the parallel holes.
Figure 3-1 - Schematic of the experimental system
32
The substrate was made from polycarbonate with a length of 15 mm, width of 13 mm and
thickness of 8 mm. At the center of the width of the substrate seven through-holes each with a
diameter of 350 µm and center-to-center distance of 700 µm from one another were drilled in a
straight line. The water droplet impacted at the center of the line of holes. Gage 17 and 34 needles
were used which gave droplets with diameters of 3.2 mm and 2.0 mm respectively. This entire
chapter presents results of Gage 17 (3.2mm droplet diameter) since we did not focus on droplet
diameter study. The results of Gage 34 mainly used for validation of our experimental results. The
droplets were released from 1, 3 and 5 cm heights. The droplet impact, spreading and capillary
penetration into the holes was observed using a high-speed camera (FASTCAM SA5, Photron,
USA). The video was taken at 4000 frames per second, 1024x1024 pixel resolution and 40.7 µs
shutter speed. In a separate set of experiments designed to see the contact angle in the holes,
higher magnification videos were taken at 2000 frames per second, 4096x4096 pixel resolution
and 40.7µs shutter speed.
3.3 Results and Analysis
Figure 3-2 shows the impact of a droplet on a substrate with 7 parallel holes. Each column
shows successive stages of impact of a single droplet. The droplet diameter in all cases was 3.2
mm and droplets were released from three different heights, ℎ = 1𝑐𝑚 (Figure 3-2a), 3cm (Figure
3-2b) and 5cm (Figure3-2c), measured from the bottom of the droplet at the instant it detached
from the needle to the substrate. The time of each frame, measured from the moment of impact, is
shown under each image. Droplet centre aligned with the centre hole into the substrate as accurate
as possible. Impact velocity at the moment of droplet hitting the substrate was measured from
high speed images of the droplets at the moment of impact and was as 0.91 m/s for ℎ = 5𝑐𝑚,
0.54 m/s for ℎ = 3𝑐𝑚 and 0.32 m/s for ℎ = 1𝑐𝑚.
33
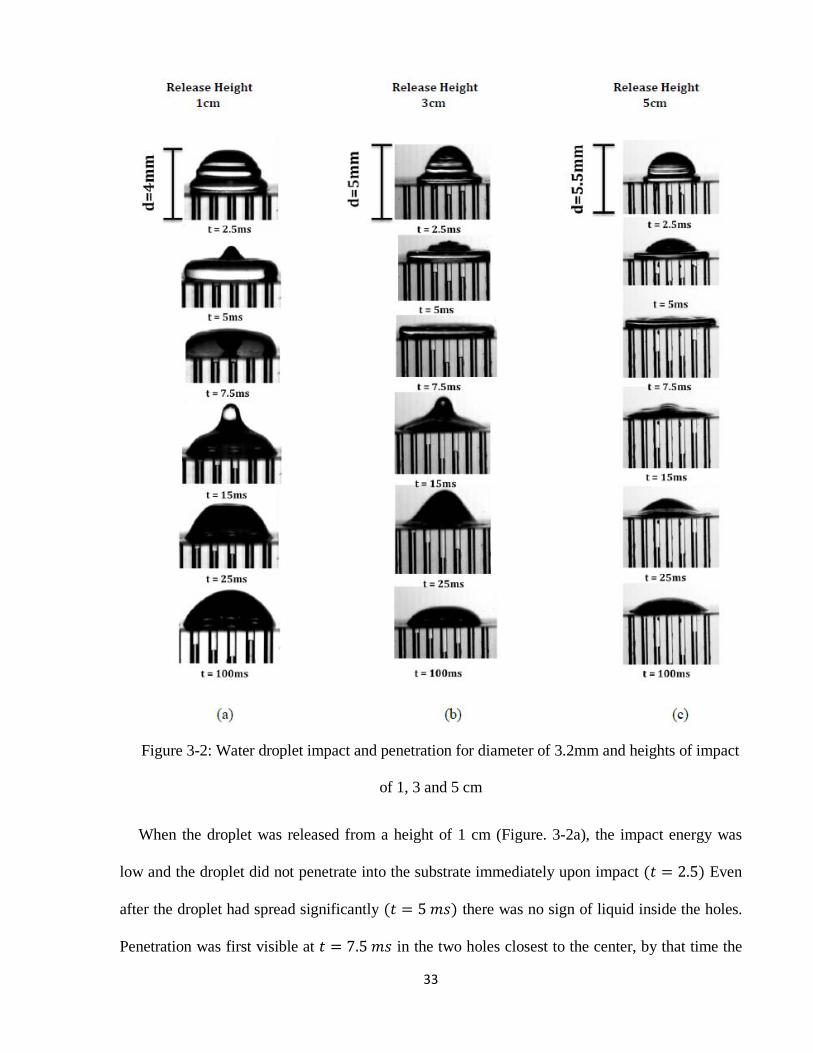
Figure 3-2: Water droplet impact and penetration for diameter of 3.2mm and heights of impact
of 1, 3 and 5 cm
When the droplet was released from a height of 1 cm (Figure. 3-2a), the impact energy was
low and the droplet did not penetrate into the substrate immediately upon impact (𝑡 = 2.5) Even
after the droplet had spread significantly (𝑡 = 5 𝑚𝑠) there was no sign of liquid inside the holes.
Penetration was first visible at 𝑡 = 7.5 𝑚𝑠 in the two holes closest to the center, by that time the
34
droplet has spread to about 75% of its maximum spread diameter. After 𝑡 = 12𝑚𝑠 the droplet
started to rebound as surface tension forces pulled the outer edge of the droplet back. As the
droplet retracted, the movement of liquid in the holes was arrested (see 𝑡 = 15𝑚𝑠). Droplet
rebound was completed by 𝑡 = 18𝑚𝑠 after the impact, after which the water penetration process
restarted at a slower rate than before and continued (𝑡 = 25𝑚𝑠). The liquid motion continued
even after the droplet had come to rest and after a delay the other holes also began to fill with
water (𝑡 = 100 𝑚𝑠).
When droplet release height was increased to 3cm, penetration of water into the holes started
much earlier, as seen at 𝑡 = 2.5 𝑚𝑠 in Figure 3-2b. The liquid front in the holes advanced
approximately at a constant rate until 𝑡 = 6.5𝑚𝑠, by that time the droplet had reached its
maximum spreading diameter. Then, liquid penetration continued steadily, but at a lower rate. The
advance of water progressed farthest in the middle hole and was progressively less with radial
distance from the center.
Figure 3-2c shows the impact of a droplet released from a height of 5cm above the substrate.
Water penetration is faster than it was from a height of either 1 or 3 cm. The droplet reaches its
maximum spread at 𝑡 = 8 𝑚𝑠, after which the liquid penetration rate reduced. The droplet
oscillated from 𝑡 = 10𝑚𝑠 to 𝑡 = 100𝑚𝑠, alternately spreading out and rebounding off the
surface. This droplet motion did not affect the rate at which liquid advanced in the holes.
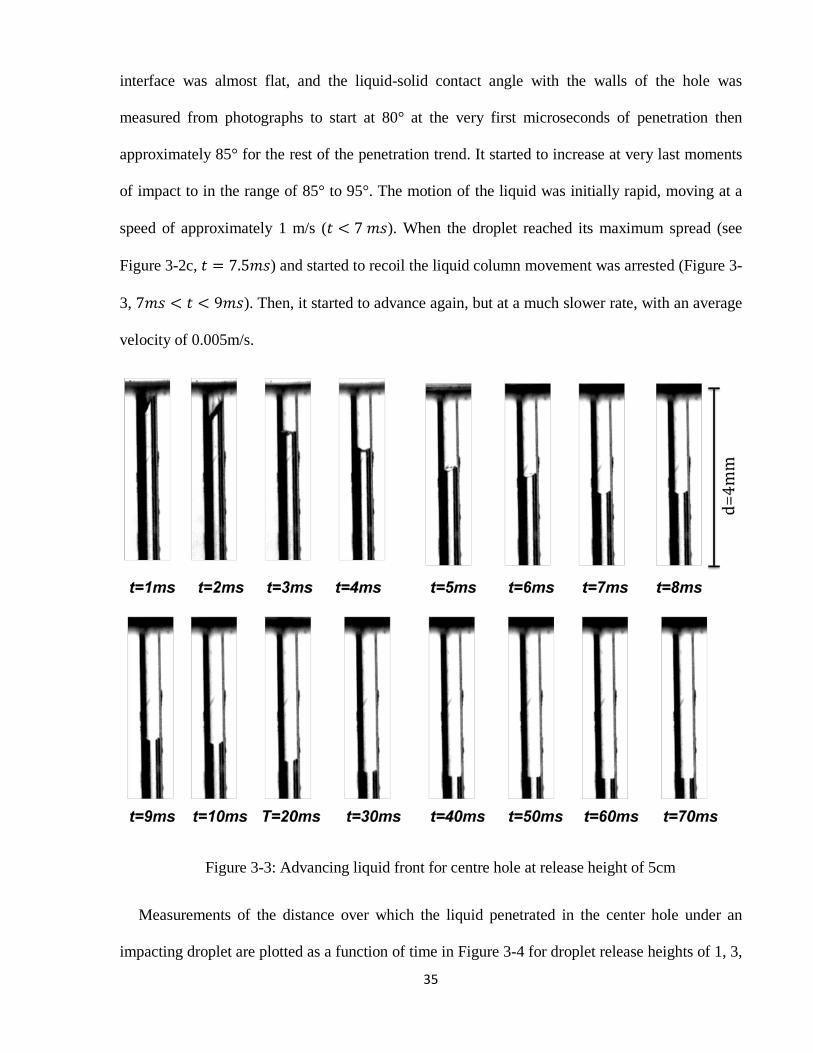
Figure 3-3 shows enlarged views of the motion of the liquid inside the center hole under a
droplet released from a height of 5 cm, as seen previously in Figure 3-2c. Immediately after
impact (𝑡 = 1 𝑚𝑠) liquid can be seen entering the hole. The interface is inclined, showing that the
droplet did not impact precisely on the center of the hole, but was slightly offset. By 𝑡 = 3𝑚𝑠 the
liquid interface was perpendicular to the hole axis, and stayed that way as it advanced. The
35
interface was almost flat, and the liquid-solid contact angle with the walls of the hole was
measured from photographs to start at 80° at the very first microseconds of penetration then
approximately 85° for the rest of the penetration trend. It started to increase at very last moments
of impact to in the range of 85° to 95°. The motion of the liquid was initially rapid, moving at a
speed of approximately 1 m/s (𝑡 < 7 𝑚𝑠). When the droplet reached its maximum spread (see
Figure 3-2c, 𝑡 = 7.5𝑚𝑠) and started to recoil the liquid column movement was arrested (Figure 3-
3, 7𝑚𝑠 < 𝑡 < 9𝑚𝑠). Then, it started to advance again, but at a much slower rate, with an average
velocity of 0.005m/s.
Figure 3-3: Advancing liquid front for centre hole at release height of 5cm
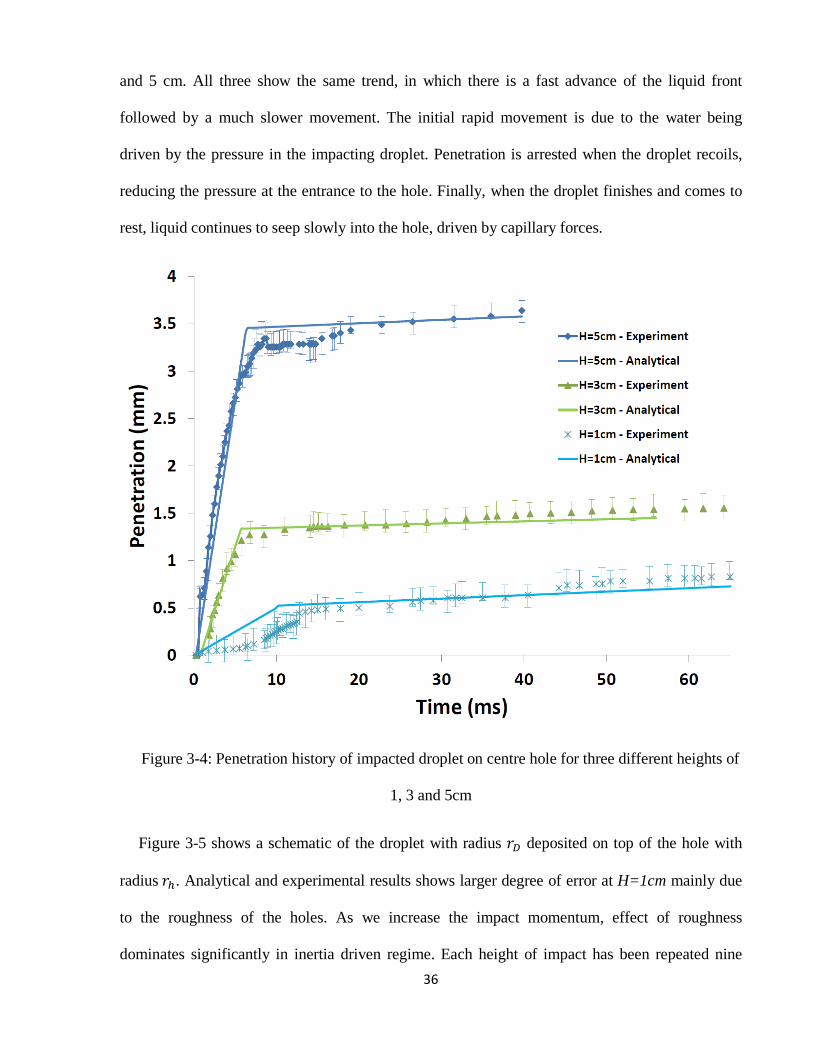
Measurements of the distance over which the liquid penetrated in the center hole under an
impacting droplet are plotted as a function of time in Figure 3-4 for droplet release heights of 1, 3,
36
and 5 cm. All three show the same trend, in which there is a fast advance of the liquid front
followed by a much slower movement. The initial rapid movement is due to the water being
driven by the pressure in the impacting droplet. Penetration is arrested when the droplet recoils,
reducing the pressure at the entrance to the hole. Finally, when the droplet finishes and comes to
rest, liquid continues to seep slowly into the hole, driven by capillary forces.
Figure 3-4: Penetration history of impacted droplet on centre hole for three different heights of
1, 3 and 5cm
Figure 3-5 shows a schematic of the droplet with radius 𝑟𝐷 deposited on top of the hole with
radius 𝑟ℎ. Analytical and experimental results shows larger degree of error at H=1cm mainly due
to the roughness of the holes. As we increase the impact momentum, effect of roughness
dominates significantly in inertia driven regime. Each height of impact has been repeated nine
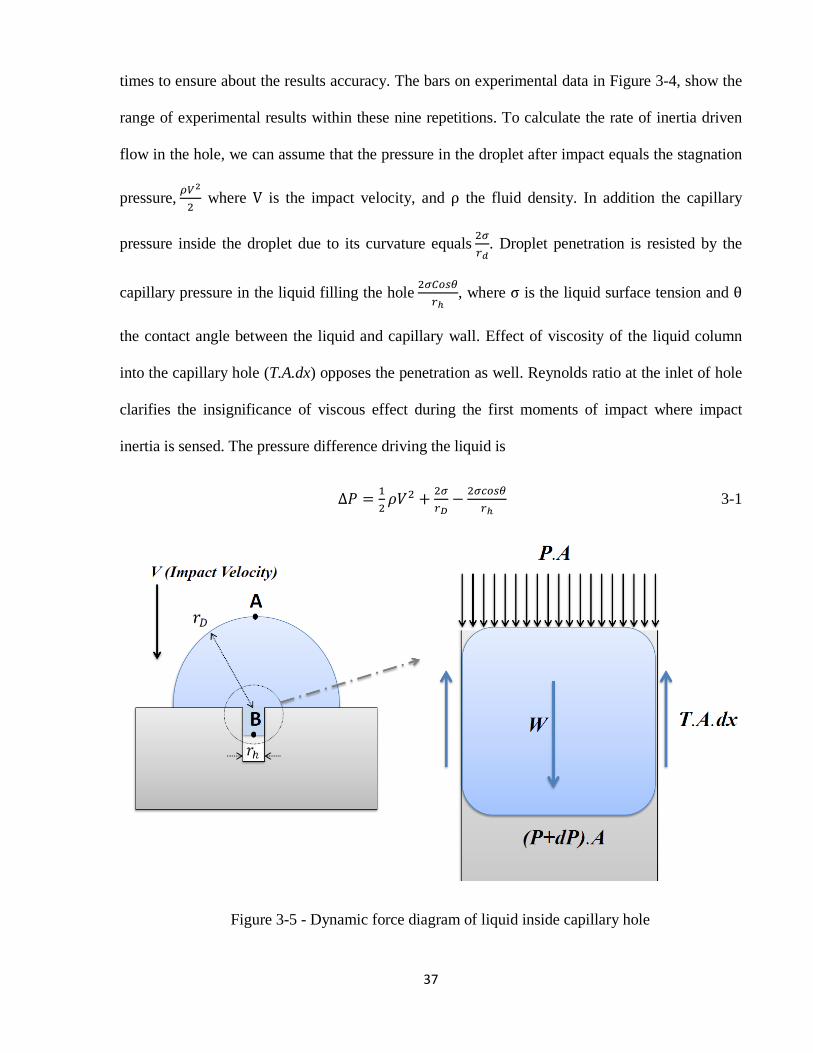
37
times to ensure about the results accuracy. The bars on experimental data in Figure 3-4, show the
range of experimental results within these nine repetitions. To calculate the rate of inertia driven
flow in the hole, we can assume that the pressure in the droplet after impact equals the stagnation
pressure, 𝜌𝑉2
2 where V is the impact velocity, and ρ the fluid density. In addition the capillary
pressure inside the droplet due to its curvature equals 2𝜎𝑟𝑑
. Droplet penetration is resisted by the
capillary pressure in the liquid filling the hole 2𝜎𝐶𝑜𝑠𝜃𝑟ℎ
, where σ is the liquid surface tension and θ
the contact angle between the liquid and capillary wall. Effect of viscosity of the liquid column
into the capillary hole (T.A.dx) opposes the penetration as well. Reynolds ratio at the inlet of hole
clarifies the insignificance of viscous effect during the first moments of impact where impact
inertia is sensed. The pressure difference driving the liquid is
∆𝑃 = 12𝜌𝑉2 + 2𝜎
𝑟𝐷− 2𝜎𝑐𝑜𝑠𝜃
𝑟ℎ 3-1
Figure 3-5 - Dynamic force diagram of liquid inside capillary hole
38
The contact angle of water in the capillary hole is close to 90° (see Figure 3-3), so the last term
in Eq. 3-1 is negligible. The capillary pressure in the droplet is only 5% of the stagnation pressure
and can also be neglected without introducing error.
Equating the force acting on the liquid column in the capillary to the rate of change of
momentum:
∆𝑃𝐴 = 𝜌𝜋𝑟ℎ2𝜕𝜕𝑡
(ℎ(𝑡) 𝑑ℎ𝑑𝑡
) 3-2
Where A is the cross-sectional area of the hole and h the length of the liquid column. Solving this
non-linear second order ODE gives us the penetration as a function of time for the inertia driven
regime. The solution of Eq. 3-2 is plotted in Figure 3-4 for different impact heights. The
predictions compare reasonably well with experimental measurements of the liquid meniscus
movement during inertia driven flow.
Inertia driven flow ends when droplet spreads to its maximum and starts to recoil, lifting off
the surface (see Figure 3-2c, 𝑡 = 15𝑚𝑠). This reduces the pressure in the droplet and arrests
further movement of liquid in the hole. Pasandideh Fard et al. et al [19] developed a simple model
for droplet spreading and estimated that the spread time is of order:
𝑡𝑠 = 83𝐷𝑉
3-3
where D is the droplet diameter and V is the impact velocity. The lines representing inertia
controlled growth in Figure 3-4 are terminated at 𝑡𝑠, which gives a reasonable estimate of the
observed liquid penetration time.
The rate of flow of liquid in a capillary tube can be calculated using the Lucas Washburn [26]
equation, which is derived by calculating all the forces acting on the liquid meniscus. The viscous
force, assuming Poiseuille flow in the tube, is given by
39
𝐹𝜇 = 8𝜋𝜇ℎ(𝑡) 𝑑ℎ𝑑𝑡
3-4
The gravity force is given by
𝐹𝑔 = 𝜋𝑟ℎ2𝜌𝑔ℎ 3-5
And the surface tension force by
Fσ = πrhσcosθ 3-6
Summing all forces and equating them to the rate of change of momentum of the liquid in the
capillary,
𝐹𝜎 + 𝐹𝑔 − 𝐹𝜇 = 𝜌𝜋𝑟ℎ2𝑑𝑑𝑡�ℎ 𝑑ℎ
𝑑𝑡� 3-7
During capillary driven flow, the velocity is low and almost constant (see Figure 3-4). We can,
therefore, neglect liquid acceleration and assume the right-hand side of Eq. 3-7 equals zero. The
gravitational force is negligible by comparison to surface tension: the ratio 𝜌𝑔ℎ(𝑡)2𝜎𝑟ℎ
� varies from
0.006 to 0.08 for the range of values h during our observations. Eq. 3-7 therefore reduces to:
8𝜋𝜇ℎ 𝑑ℎ𝑑𝑡
= 𝜋𝑟ℎ𝜎𝑐𝑜𝑠𝜃 3-8
Integrating with respect to time gives:
ℎ(𝑡) = �𝜎𝑟ℎ𝑐𝑜𝑠𝜃2𝜇
𝑡 + ℎ0 3-9
Where ℎ0 is the length of the liquid column after inertia driven penetration into a hole at 𝑡 =
𝑡𝑠. This equation is plotted in Figure 3-4 for 𝑡 > 𝑡𝑠 and is seen to predict the experimentally liquid
penetration reasonably well.
40
After droplet impact water first enters the center hole and then, after a brief delay, into the
surrounding hole. In Figure 3-2c liquid can be seen in the first hole on the left and right (referred
to as L1 and R1 respectively), with the advancing meniscus in each capillary a little distance
behind that in the center. The position of the advancing front in R1 is slightly ahead of that in L1,
which was because the droplet landed slightly to the right of the center hole (see Figure 3-2c
𝑡 = 2.5 ms). After a further delay liquid enters the second hole on the right (R2) and advances.
No water enters L2, L3 or R3, even though the droplet covers their entrances. Figure 3-6 shows
the position of the liquid front as a function of time for all the holes in the surface for which a
droplet is released from a height of 5 cm. In all cases, the liquid advanced rapidly, pushed by
liquid inertia, followed by capillary driven movement through the hole.
The difference in the rate of advance through radially spaced holes may exist because there is a
radial pressure gradient in the spreading drop during impact, so that holes at distance from the
center see a lower pressure at their entrance than the central hole. To evaluate the pressure
variation under an impacting droplet, we can assume that the liquid flow can be represented by
stagnation point flow in an axisymmetric jet. The momentum conservation equations are
𝑢 𝜕𝑢𝜕𝑥
+ 𝑣 𝜕𝑢𝜕𝑦
= − 1𝜌𝜕𝑝𝜕𝑥
+ 𝜇[𝜕2𝑢
𝜕𝑥2+ 𝜕2𝑢
𝜕𝑦2] 3-10
𝜕𝑣𝜕𝑥
+ 𝑣 𝜕𝑣𝜕𝑦
= − 1𝜌𝜕𝑝𝜕𝑦
+ 𝜇[𝜕2𝑣
𝜕𝑥2+ 𝜕2𝑣
𝜕𝑦2] 3-11
The continuity equation is satisfied by a stream function φ that satisfies the conditions
𝑢 = −𝜕𝜑𝜕𝑥
and 𝑣 = −𝜕𝜑𝜕𝑦
, 3-12
The stream function for axisymmetric stagnation point flow is written as follows
φ = −Bx2y 3-13
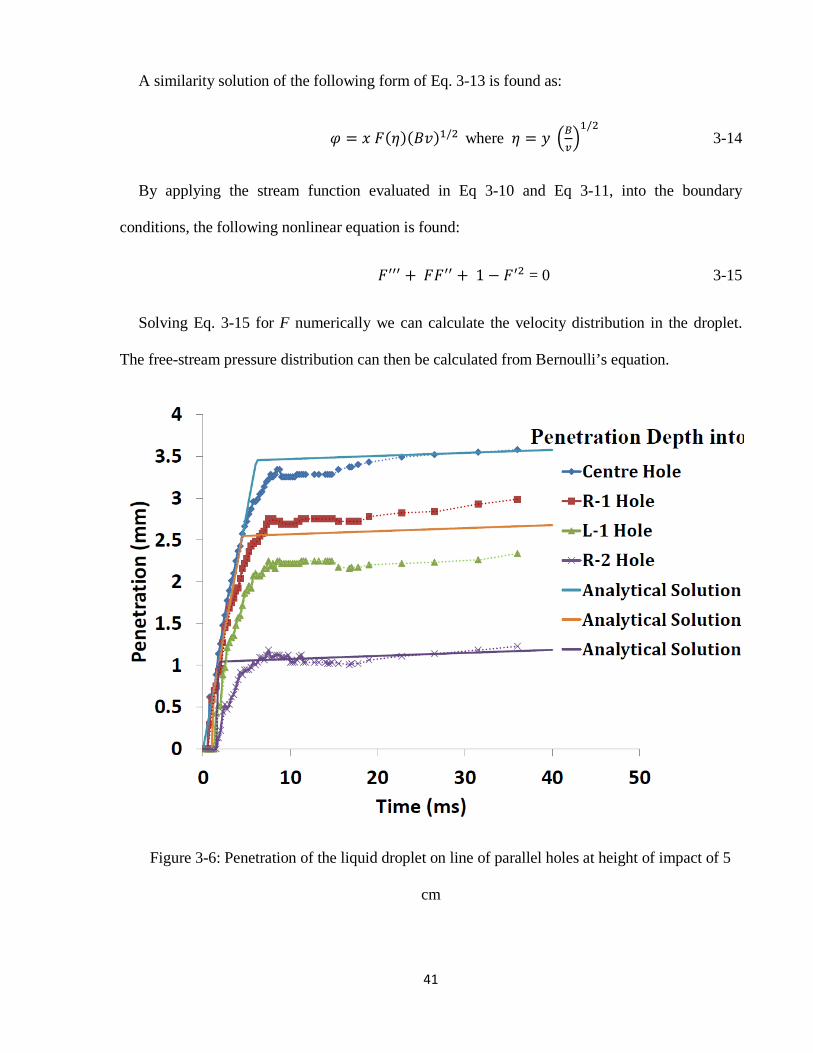
41
A similarity solution of the following form of Eq. 3-13 is found as:
𝜑 = 𝑥 𝐹(𝜂)(𝐵𝑣)1/2 where 𝜂 = 𝑦 �𝐵𝑣�1/2
3-14
By applying the stream function evaluated in Eq 3-10 and Eq 3-11, into the boundary
conditions, the following nonlinear equation is found:
𝐹′′′ + 𝐹𝐹′′ + 1 − 𝐹′2 = 0 3-15
Solving Eq. 3-15 for F numerically we can calculate the velocity distribution in the droplet.
The free-stream pressure distribution can then be calculated from Bernoulli’s equation.
Figure 3-6: Penetration of the liquid droplet on line of parallel holes at height of impact of 5
cm
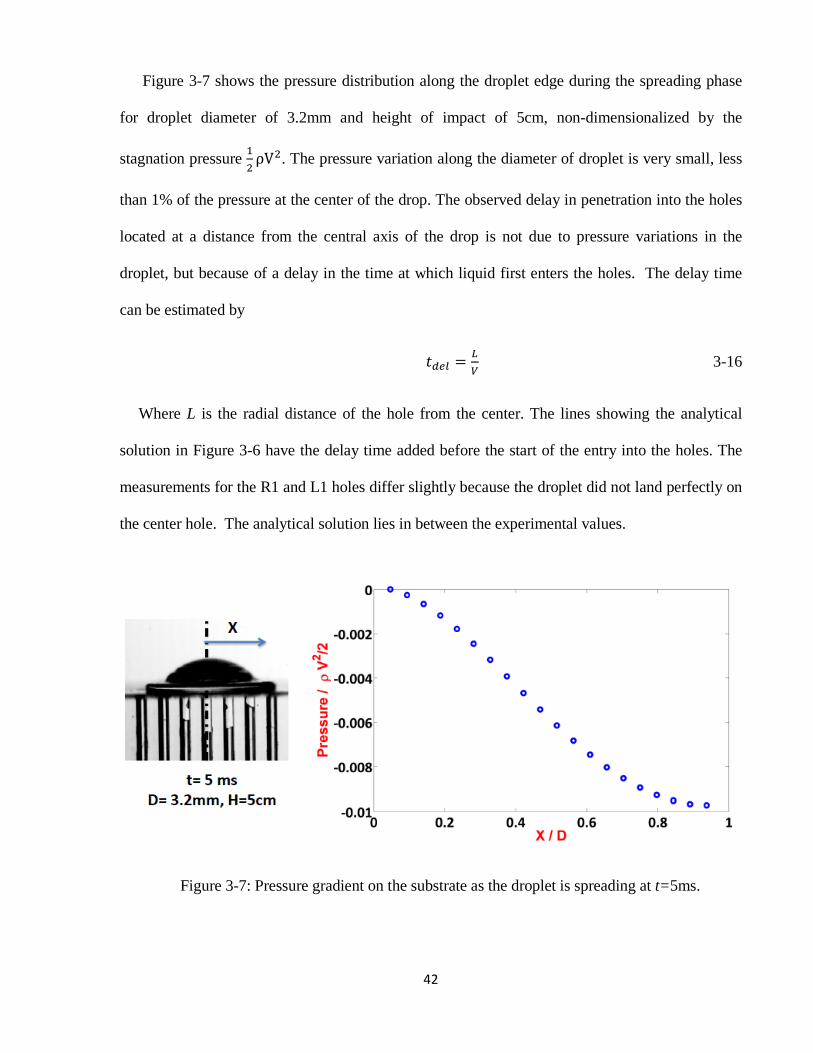
42
Figure 3-7 shows the pressure distribution along the droplet edge during the spreading phase
for droplet diameter of 3.2mm and height of impact of 5cm, non-dimensionalized by the
stagnation pressure 12ρV2. The pressure variation along the diameter of droplet is very small, less
than 1% of the pressure at the center of the drop. The observed delay in penetration into the holes
located at a distance from the central axis of the drop is not due to pressure variations in the
droplet, but because of a delay in the time at which liquid first enters the holes. The delay time
can be estimated by
𝑡𝑑𝑒𝑙 = 𝐿𝑉 3-16
Where L is the radial distance of the hole from the center. The lines showing the analytical
solution in Figure 3-6 have the delay time added before the start of the entry into the holes. The
measurements for the R1 and L1 holes differ slightly because the droplet did not land perfectly on
the center hole. The analytical solution lies in between the experimental values.
Figure 3-7: Pressure gradient on the substrate as the droplet is spreading at t=5ms.
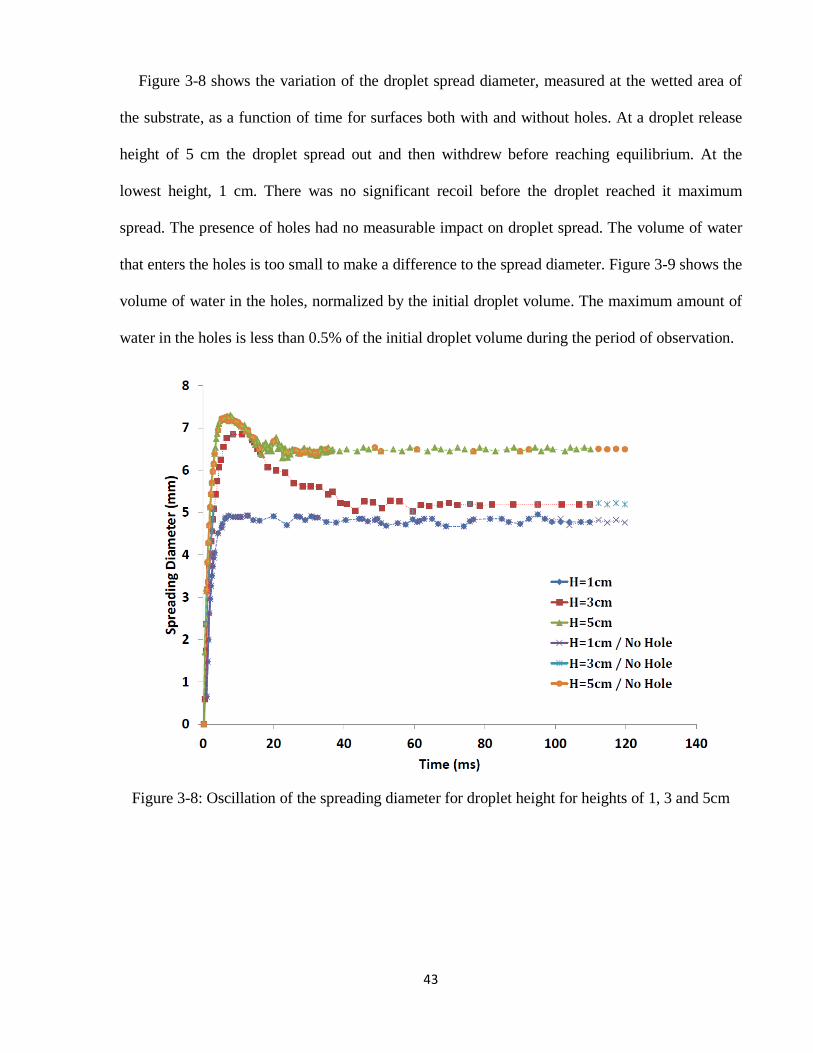
43
Figure 3-8 shows the variation of the droplet spread diameter, measured at the wetted area of
the substrate, as a function of time for surfaces both with and without holes. At a droplet release
height of 5 cm the droplet spread out and then withdrew before reaching equilibrium. At the
lowest height, 1 cm. There was no significant recoil before the droplet reached it maximum
spread. The presence of holes had no measurable impact on droplet spread. The volume of water
that enters the holes is too small to make a difference to the spread diameter. Figure 3-9 shows the
volume of water in the holes, normalized by the initial droplet volume. The maximum amount of
water in the holes is less than 0.5% of the initial droplet volume during the period of observation.
Figure 3-8: Oscillation of the spreading diameter for droplet height for heights of 1, 3 and 5cm
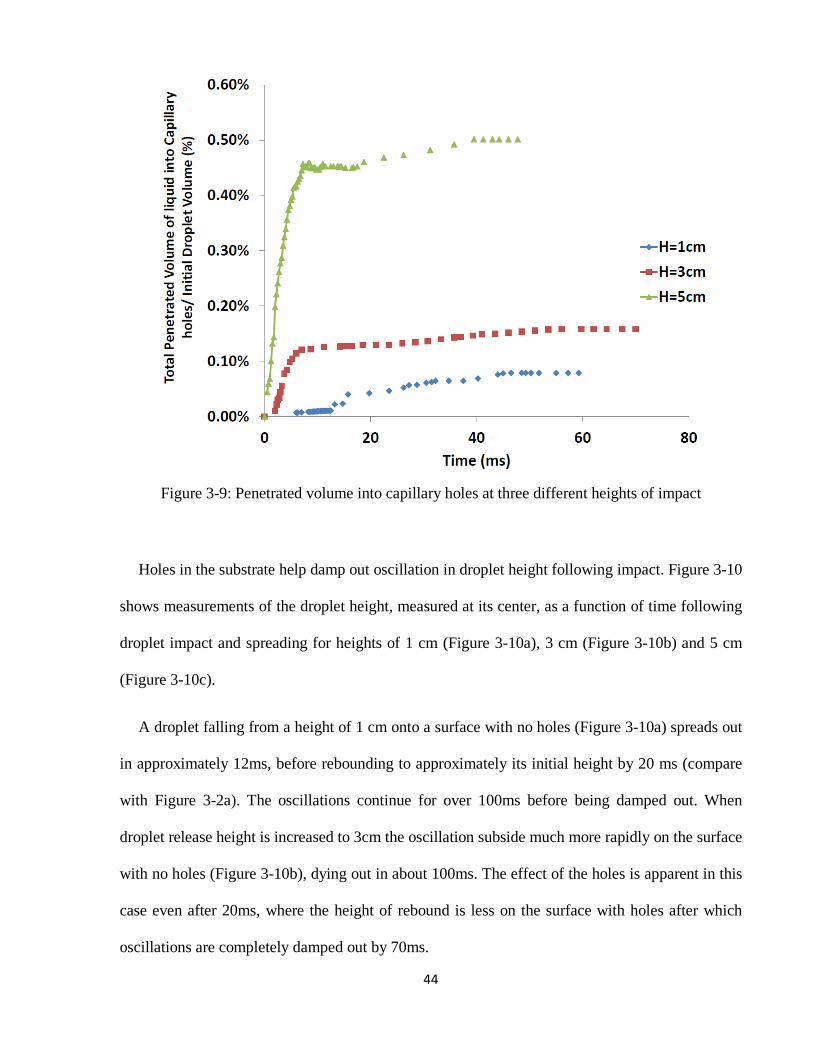
44
Figure 3-9: Penetrated volume into capillary holes at three different heights of impact
Holes in the substrate help damp out oscillation in droplet height following impact. Figure 3-10
shows measurements of the droplet height, measured at its center, as a function of time following
droplet impact and spreading for heights of 1 cm (Figure 3-10a), 3 cm (Figure 3-10b) and 5 cm
(Figure 3-10c).
A droplet falling from a height of 1 cm onto a surface with no holes (Figure 3-10a) spreads out
in approximately 12ms, before rebounding to approximately its initial height by 20 ms (compare
with Figure 3-2a). The oscillations continue for over 100ms before being damped out. When
droplet release height is increased to 3cm the oscillation subside much more rapidly on the surface
with no holes (Figure 3-10b), dying out in about 100ms. The effect of the holes is apparent in this
case even after 20ms, where the height of rebound is less on the surface with holes after which
oscillations are completely damped out by 70ms.
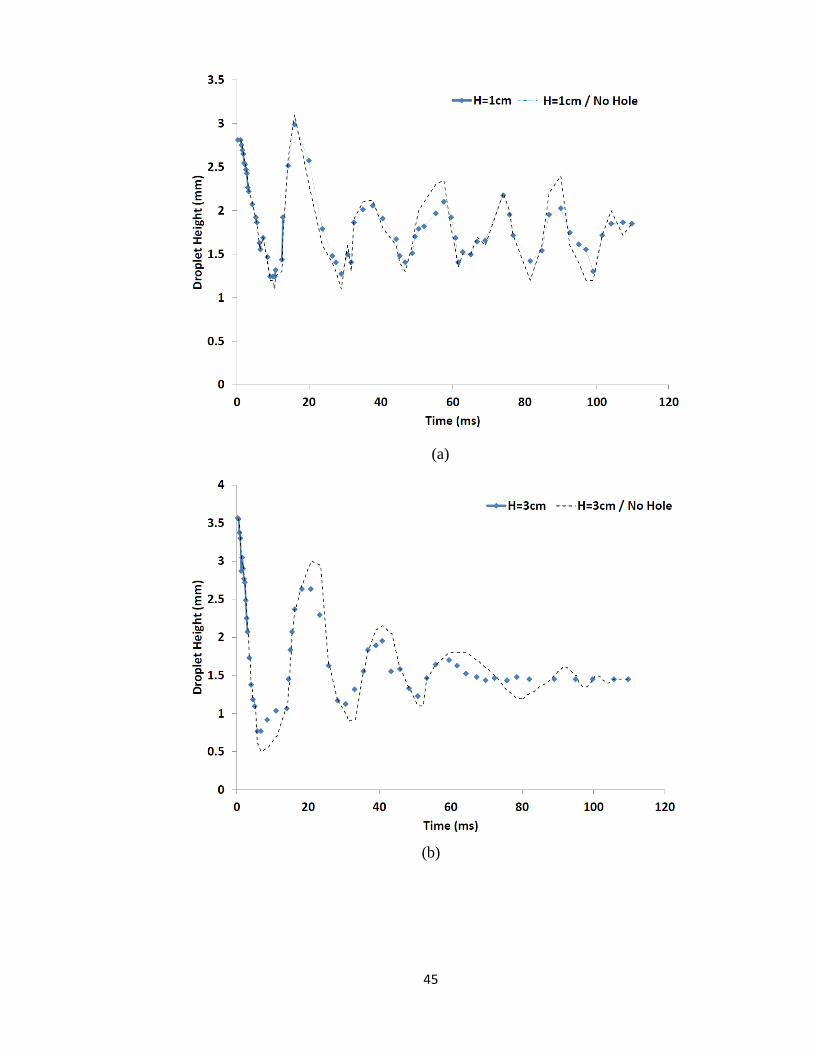
45
(a)
(b)
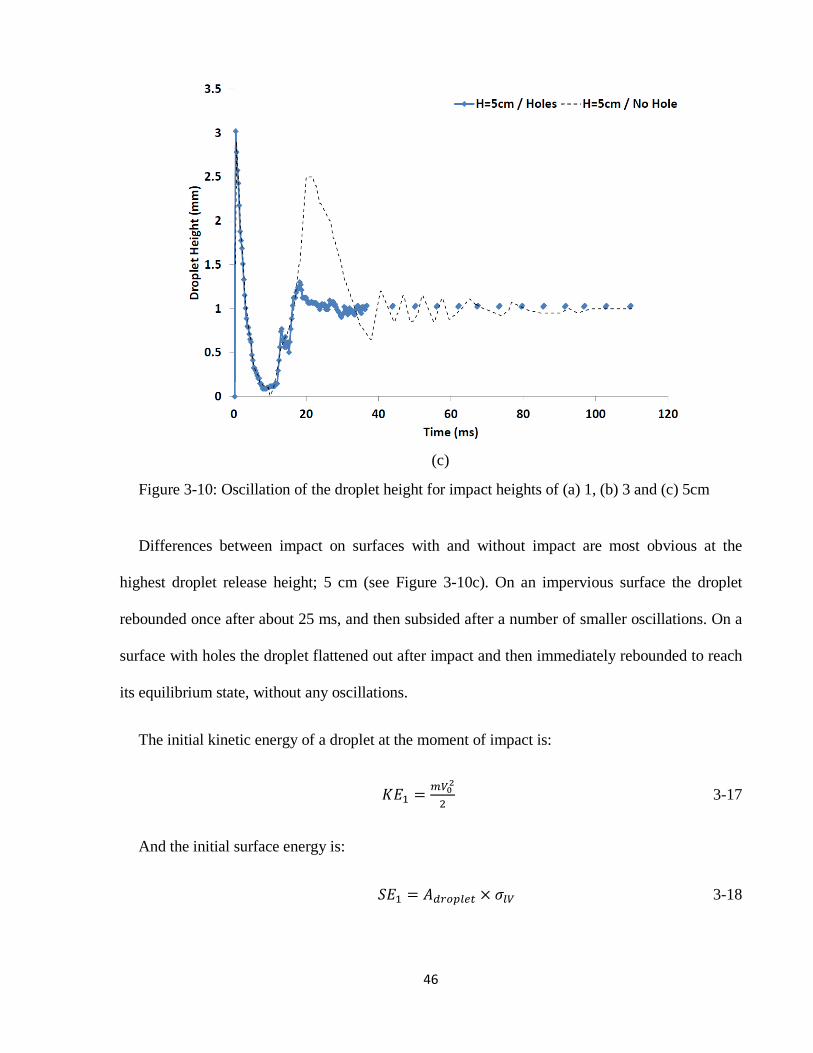
46
(c)
Figure 3-10: Oscillation of the droplet height for impact heights of (a) 1, (b) 3 and (c) 5cm
Differences between impact on surfaces with and without impact are most obvious at the
highest droplet release height; 5 cm (see Figure 3-10c). On an impervious surface the droplet
rebounded once after about 25 ms, and then subsided after a number of smaller oscillations. On a
surface with holes the droplet flattened out after impact and then immediately rebounded to reach
its equilibrium state, without any oscillations.
The initial kinetic energy of a droplet at the moment of impact is:
𝐾𝐸1 = 𝑚𝑉02
2 3-17
And the initial surface energy is:
𝑆𝐸1 = 𝐴𝑑𝑟𝑜𝑝𝑙𝑒𝑡 × 𝜎𝑙𝑉 3-18
47
After impact, the droplet spreads over the surface until it comes to rest. At this time the kinetic
energy
𝐾𝐸2 = 0 3-19
Assuming that the droplet can be modeled as a disk with diameter 𝐷𝑠 that has its lower surface
in contact with the solid substrate and the upper surface exposed to air, and neglecting the edge
area, the surface energy of a droplet on a surface with no holes is given by:
𝑆𝐸2,𝑛 = 𝐴𝑠𝑢𝑏𝑠𝑡𝑟𝑎𝑡𝑒 × 𝜎𝑙𝑠 + 𝐴𝑑𝑟𝑜𝑝𝑙𝑒𝑡2
× 𝜎𝑙𝑣 3-20
On a surface with holes, the surface energy is
𝑆𝐸2,ℎ = 𝐴𝑠𝑢𝑏𝑠𝑡𝑟𝑎𝑡𝑒 × 𝜎𝑙𝑠 + 𝐴𝑑𝑟𝑜𝑝𝑙𝑒𝑡2
× 𝜎𝑙𝑣 + 𝐴ℎ𝑜𝑙𝑒𝑠 × 𝜎𝑙𝑠 3-21
where 𝐴ℎ𝑜𝑙𝑒𝑠 is the surface area wetted by liquid that has penetrated the holes.
To calculate the value of σls for Eq 3-20, we have Young equation as
𝜎𝑙𝑣𝑐𝑜𝑠𝜃 = 𝜎𝑠𝑣 − 𝜎𝑙𝑠 3-22
The internal energy before the impact can be written as:
𝐸1 = 𝐴𝑑𝑟𝑜𝑝𝑙𝑒𝑡 × 𝜎𝑙𝑣 + (𝐴𝑠𝑢𝑏𝑠𝑡𝑟𝑎𝑡𝑒 + 𝐴ℎ𝑜𝑙𝑒𝑠) × 𝜎𝑙𝑠 3-23
According to Figure 3-5, the internal energy at rest can be written as:
𝐸2 = 𝐴𝑑𝑟𝑜𝑝𝑙𝑒𝑡 × 𝜎𝑙𝑣 + (𝐴𝑠𝑢𝑏𝑠𝑡𝑟𝑎𝑡𝑒 + 𝐴ℎ𝑜𝑙𝑒𝑠) × 𝜎𝑙𝑣 + (𝐴𝑠𝑢𝑏𝑠𝑡𝑟𝑎𝑡𝑒 + 𝐴ℎ𝑜𝑙𝑒𝑠) × 𝜎𝑠𝑣 3-24
Substituting Eq. 3-22:
∆𝐸 = (𝐴𝑠𝑢𝑏𝑠𝑡𝑟𝑎𝑡𝑒 + 𝐴ℎ𝑜𝑙𝑒𝑠)[𝜎𝑙𝑣 (1 − 𝑐𝑜𝑠𝜃)] 3-25
48
Where θ is the contact angle of liquid and solid interface. Therefore, Eq. 3-20 and Eq. 3-21 can
be written as
𝑆𝐸2,𝑛 = 𝐴𝑠𝑢𝑏𝑠𝑡𝑟𝑎𝑡𝑒 × 𝜎𝑙𝑣(1 − 𝑐𝑜𝑠𝜃) 3-26
and
𝑆𝐸2,ℎ = (𝐴𝑠𝑢𝑏𝑠𝑡𝑟𝑎𝑡𝑒 + 𝐴ℎ) 𝜎𝑙𝑣(1− 𝑐𝑜𝑠𝜃) 3-27
Once a droplet has reached its maximum extension and is stationary an energy balance gives
𝐾𝐸1 + 𝑆𝐸1 = 𝑆𝐸2 + 𝑊 3-28
Where W is the energy lost due viscous dissipation, and SE2 could be either SE2,n or SE2,h
depending on whether the surface has no holes or holes in it. The viscous dissipation losses can be
estimated by:
𝑊 = 𝜋3𝜌𝑉02𝐷0𝐷𝑠2
1√𝑅𝑒
3-29
Where V0 is the impact velocity. As the impact velocity increases the viscous losses also
increase, which is why the oscillations damp out much more quickly as the droplet release height
becomes greater.
The surface energy also increases with impact velocity since liquid penetrates faster into the
holes. The difference gives the additional energy
𝑆𝐸2,ℎ − 𝑆𝐸2,𝑛 = 𝐴ℎ𝑜𝑙𝑒𝑠 × 𝜎𝑙𝑠 3-30
Figure 3-11 shows the variation of the liquid-solid contact area in the holes (Aholes) as a
function of time. The area is normalized by the maximum contact area of a droplet after impact on
a surface with no holes (πDs2/4).
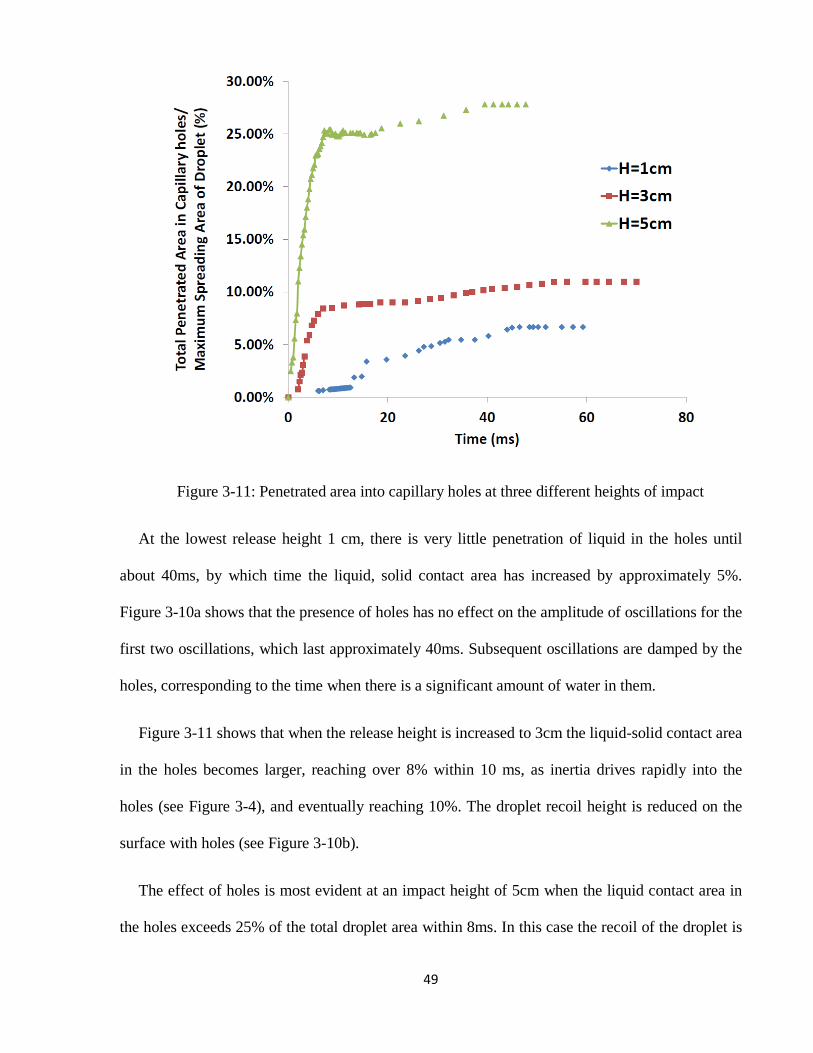
49
Figure 3-11: Penetrated area into capillary holes at three different heights of impact
At the lowest release height 1 cm, there is very little penetration of liquid in the holes until
about 40ms, by which time the liquid, solid contact area has increased by approximately 5%.
Figure 3-10a shows that the presence of holes has no effect on the amplitude of oscillations for the
first two oscillations, which last approximately 40ms. Subsequent oscillations are damped by the
holes, corresponding to the time when there is a significant amount of water in them.
Figure 3-11 shows that when the release height is increased to 3cm the liquid-solid contact area
in the holes becomes larger, reaching over 8% within 10 ms, as inertia drives rapidly into the
holes (see Figure 3-4), and eventually reaching 10%. The droplet recoil height is reduced on the
surface with holes (see Figure 3-10b).
The effect of holes is most evident at an impact height of 5cm when the liquid contact area in
the holes exceeds 25% of the total droplet area within 8ms. In this case the recoil of the droplet is
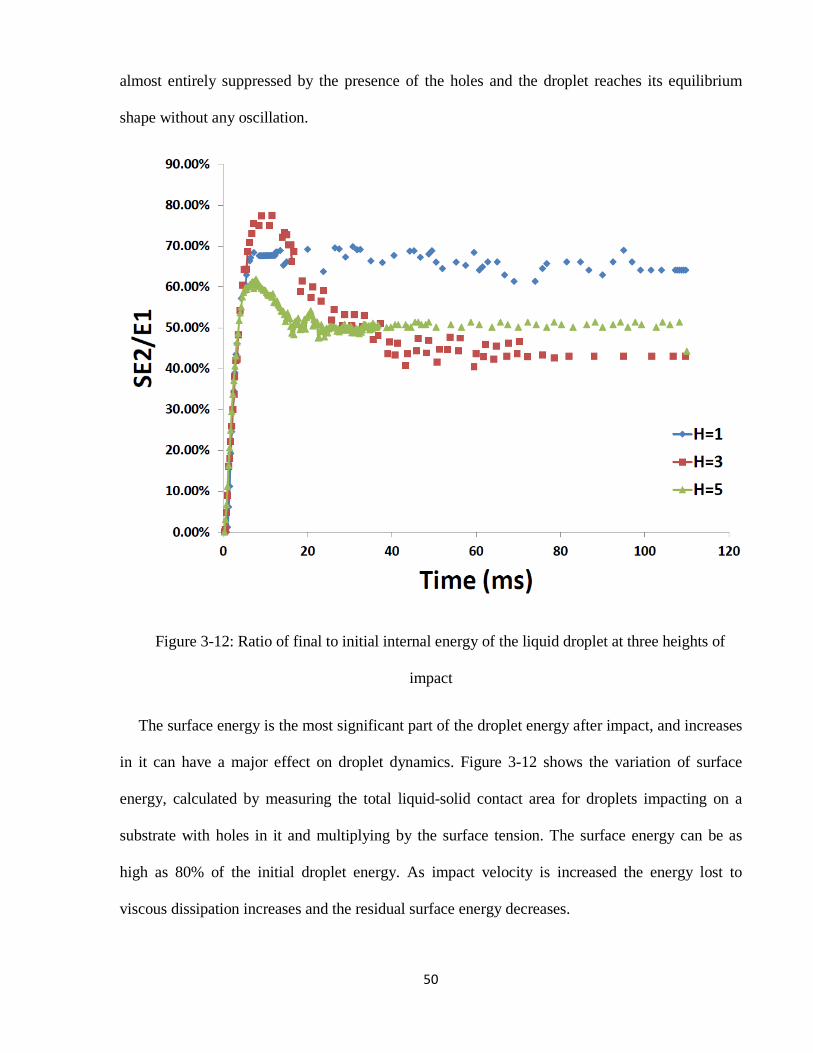
50
almost entirely suppressed by the presence of the holes and the droplet reaches its equilibrium
shape without any oscillation.
Figure 3-12: Ratio of final to initial internal energy of the liquid droplet at three heights of
impact
The surface energy is the most significant part of the droplet energy after impact, and increases
in it can have a major effect on droplet dynamics. Figure 3-12 shows the variation of surface
energy, calculated by measuring the total liquid-solid contact area for droplets impacting on a
substrate with holes in it and multiplying by the surface tension. The surface energy can be as
high as 80% of the initial droplet energy. As impact velocity is increased the energy lost to
viscous dissipation increases and the residual surface energy decreases.
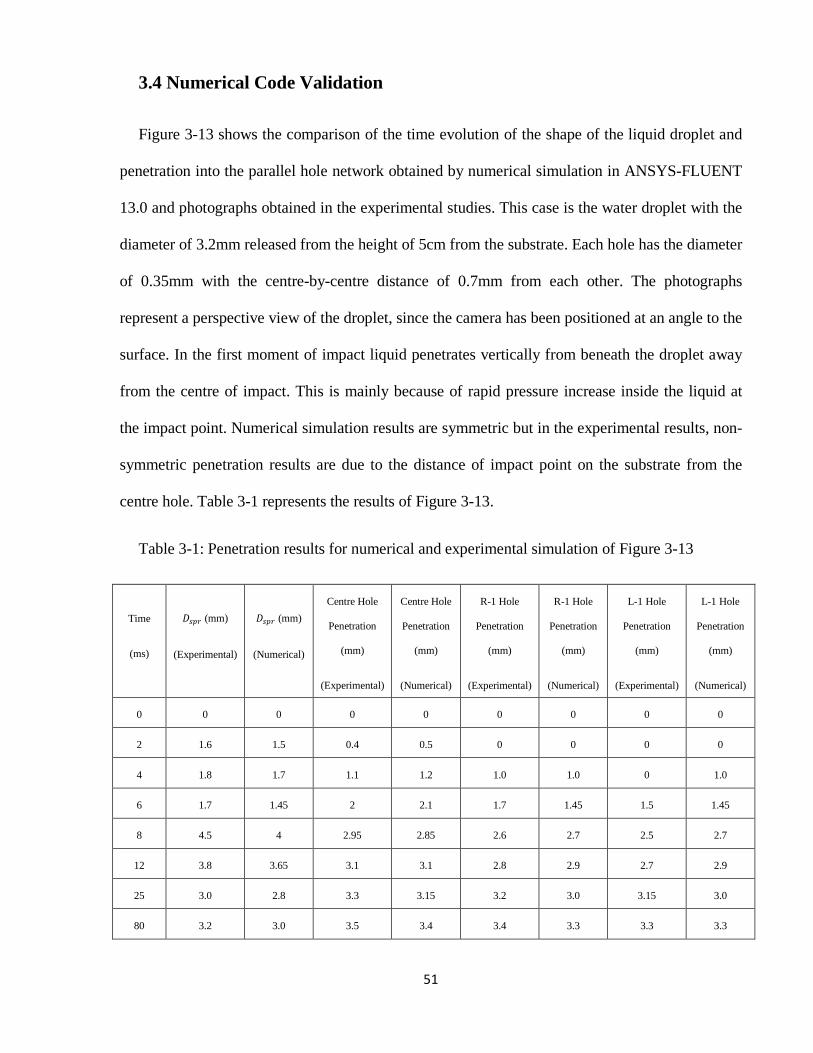
51
3.4 Numerical Code Validation
Figure 3-13 shows the comparison of the time evolution of the shape of the liquid droplet and
penetration into the parallel hole network obtained by numerical simulation in ANSYS-FLUENT
13.0 and photographs obtained in the experimental studies. This case is the water droplet with the
diameter of 3.2mm released from the height of 5cm from the substrate. Each hole has the diameter
of 0.35mm with the centre-by-centre distance of 0.7mm from each other. The photographs
represent a perspective view of the droplet, since the camera has been positioned at an angle to the
surface. In the first moment of impact liquid penetrates vertically from beneath the droplet away
from the centre of impact. This is mainly because of rapid pressure increase inside the liquid at
the impact point. Numerical simulation results are symmetric but in the experimental results, non-
symmetric penetration results are due to the distance of impact point on the substrate from the
centre hole. Table 3-1 represents the results of Figure 3-13.
Table 3-1: Penetration results for numerical and experimental simulation of Figure 3-13
Time
(ms)
𝐷𝑠𝑝𝑟 (mm)
(Experimental)
𝐷𝑠𝑝𝑟 (mm)
(Numerical)
Centre Hole
Penetration
(mm)
(Experimental)
Centre Hole
Penetration
(mm)
(Numerical)
R-1 Hole
Penetration
(mm)
(Experimental)
R-1 Hole
Penetration
(mm)
(Numerical)
L-1 Hole
Penetration
(mm)
(Experimental)
L-1 Hole
Penetration
(mm)
(Numerical)
0 0 0 0 0 0 0 0 0
2 1.6 1.5 0.4 0.5 0 0 0 0
4 1.8 1.7 1.1 1.2 1.0 1.0 0 1.0
6 1.7 1.45 2 2.1 1.7 1.45 1.5 1.45
8 4.5 4 2.95 2.85 2.6 2.7 2.5 2.7
12 3.8 3.65 3.1 3.1 2.8 2.9 2.7 2.9
25 3.0 2.8 3.3 3.15 3.2 3.0 3.15 3.0
80 3.2 3.0 3.5 3.4 3.4 3.3 3.3 3.3
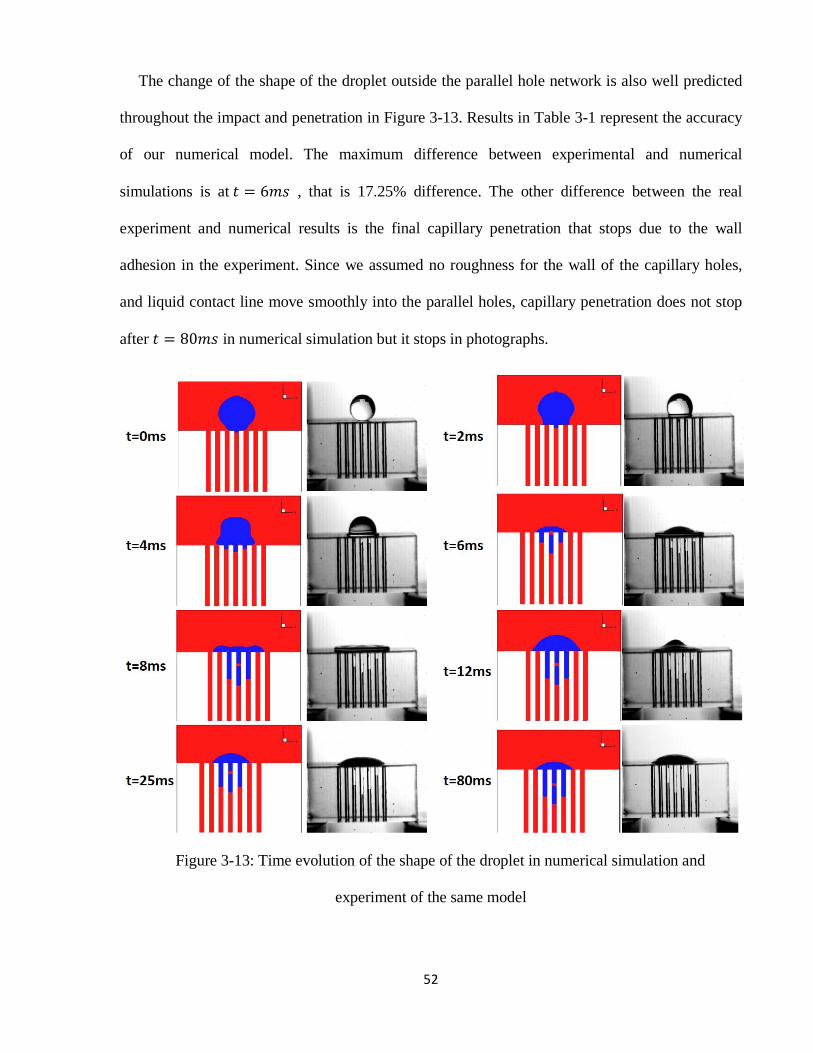
52
The change of the shape of the droplet outside the parallel hole network is also well predicted
throughout the impact and penetration in Figure 3-13. Results in Table 3-1 represent the accuracy
of our numerical model. The maximum difference between experimental and numerical
simulations is at 𝑡 = 6𝑚𝑠 , that is 17.25% difference. The other difference between the real
experiment and numerical results is the final capillary penetration that stops due to the wall
adhesion in the experiment. Since we assumed no roughness for the wall of the capillary holes,
and liquid contact line move smoothly into the parallel holes, capillary penetration does not stop
after 𝑡 = 80𝑚𝑠 in numerical simulation but it stops in photographs.
Figure 3-13: Time evolution of the shape of the droplet in numerical simulation and
experiment of the same model
53
This validation simulation has been performed to use the same numerical model and capillary
geometry to simulate droplet impact onto the structured pore network.
3.5 Summary and Conclusions
Water droplets falling onto a flat surface with small diameter holes drilled into it penetrated
into the holes on a time scale that was significantly longer the time for droplet impact. Liquid
penetration into the holes was initially rapid, driven by the inertia of the impacting liquid. When
the droplet reached its maximum spread and began to recoil the inertia driven movement was
arrested. Subsequent liquid flow into the holes was much slower, caused by capillary forces that
drew in the liquid. A simple model accounting for liquid pressure, surface tension and viscous
forces predicted the rate of liquid movement in both inertia and capillary driven regimes. A model
accounted to analyze the experimental result followed the figures to the minimum of 82%
accuracy. There are still factors e.g. roughness if the drilled hole, edge of the hole on the substrate,
contact angle measurement and droplet initial shape prior to impact moment that has been
neglected in our analytical model.
The maximum extent of droplet spread after impact was not affected by the holes in our
experiments. The total volume of liquid that penetrated the holes was less than 0.5% of the droplet
volume. However, the oscillations of droplets on the surface following impact were damped out
more rapidly by the presence of holes. The greater the height from which droplets were released
the faster oscillations were damped out. The area of liquid, solid contact inside the holes was
significant, varying from 5% to 30% of the total droplet-substrate contact area as droplet height
was raised from 1cm to 5cm. The enhanced contact area increased the surface energy of the
droplet and reduced the energy available for droplet recoil.
54
Chapter 4
Impact of a Liquid Droplet on Inverted T-
hole Geometry
4.1 Overview
Impact of a water droplet on an inverted T-hole in a solid substrate is studied numerically as a
model for the mechanical adhesion of a molten droplet onto a porous substrate. The inverted T-
hole is characterized by its hole diameter and its stem length. Droplets with different diameters
and various impact velocities are impacted on the stem of the hole and the infiltration of liquid
through the hole is investigated. The outcome of such impact is characterized based on the
conditions for which the liquid may pass the T-junction or not. A molten droplet may interlock
with the T-hole, and thus the substrate after it solidifies if the molten droplet infiltrates passing the
T-junctions. Otherwise, it may not interlock with the substrate.
55
4.2 The Model
The inverted T-hole used in the present study is shown in Figure 4-1. A droplet impacts onto
the vertical hole in the substrate. If the impact momentum is small, the liquid penetrating through
the vertical section may not reach the horizontal section of the hole. If the impact momentum is
large enough, the liquid penetrates passing the vertical section and penetrates through the
horizontal section. If the liquid passes the T-junction, it may have a strong bond with the substrate
once it solidifies. Since the liquid bonding is a more general term and refers to both mechanical
and chemical bonding of the liquid with the substrate, the present process of liquid infiltration
through a T-junction is called an “interlocking” process. If the liquid passes the T-junction, it
interlocks with the substrate as shown in Figure 4-1. Once a molted wax droplet, such as those
used in inkjet printing, impacts on a paper, penetration of the wax into the paper generates enough
interlocking to prevent the ink drop from detaching off the paper after it solidifies.
ANSYS-FLUENT 14.0 is used to solve the mass and momentum conservation equations
inside an inverted T-hole. A structured quadrilateral mesh with maximum aspect ratio of 2.5 is
used. 200 meshes per droplet diameter and 20 meshes per diameter of holes are assigned. Water
droplet with a diameter of 3mm has been impacted at different impact velocities onto the substrate
with the hole diameter of 0.15 mm. The vertical length of the inverted T-hole is varied in the
simulations. Boundary conditions inside the T-hole are no-slip boundary condition with static and
dynamic contact angle changes with advancing and receding velocities. Holes are open at all
sides, and the domain boundary condition is set as pressure-outlet. Impact velocity, droplet
diameter, hole diameter (pore size) and contact angle are the parameters studied for the liquid
penetration process. In order to explore the influence of dynamic and geometric properties (i.e.,
velocity, droplet diameter, hole diameter and contact angle), twenty-eight configurations were
simulated and analyzed.
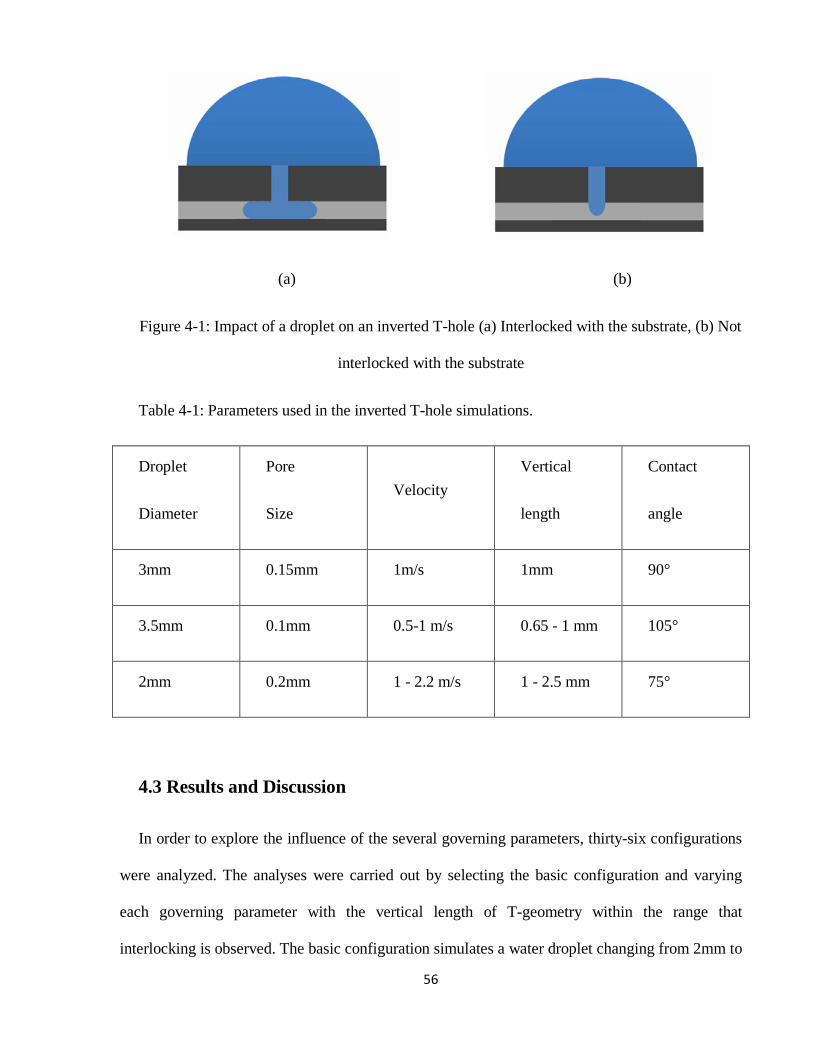
56
(a) (b)
Figure 4-1: Impact of a droplet on an inverted T-hole (a) Interlocked with the substrate, (b) Not
interlocked with the substrate
Table 4-1: Parameters used in the inverted T-hole simulations.
Droplet
Diameter
Pore
Size Velocity
Vertical
length
Contact
angle
3mm 0.15mm 1m/s 1mm 90°
3.5mm 0.1mm 0.5-1 m/s 0.65 - 1 mm 105°
2mm 0.2mm 1 - 2.2 m/s 1 - 2.5 mm 75°
4.3 Results and Discussion
In order to explore the influence of the several governing parameters, thirty-six configurations
were analyzed. The analyses were carried out by selecting the basic configuration and varying
each governing parameter with the vertical length of T-geometry within the range that
interlocking is observed. The basic configuration simulates a water droplet changing from 2mm to
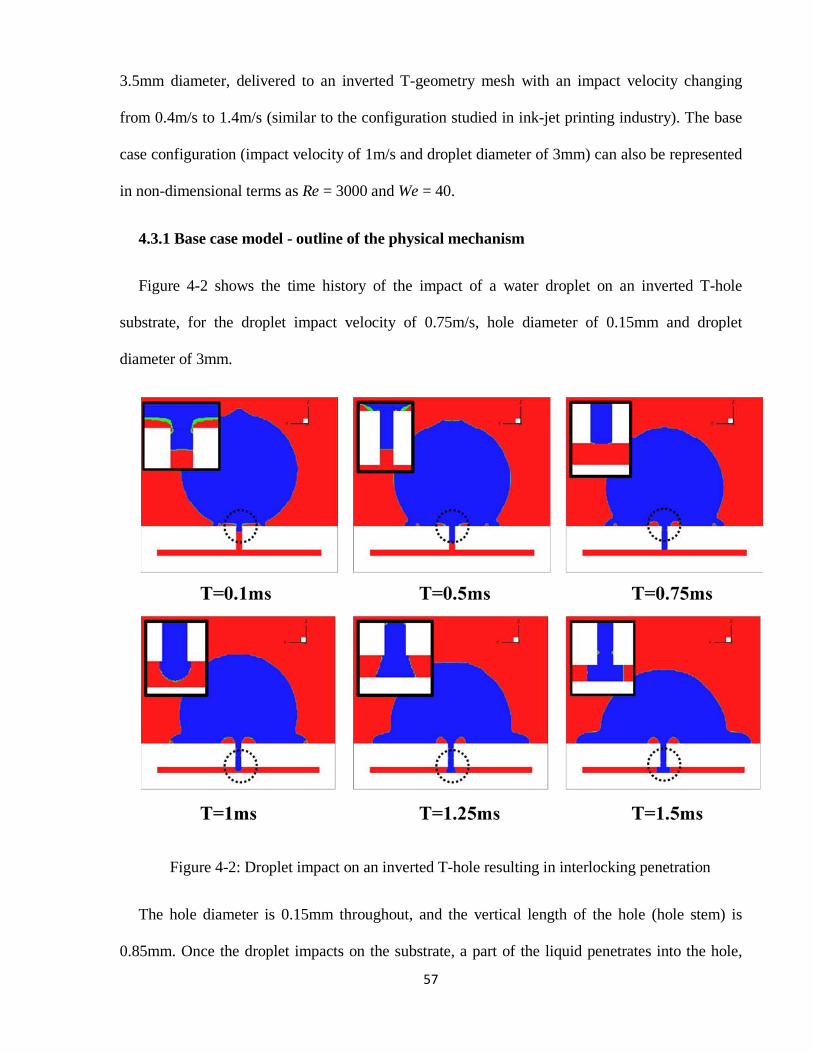
57
3.5mm diameter, delivered to an inverted T-geometry mesh with an impact velocity changing
from 0.4m/s to 1.4m/s (similar to the configuration studied in ink-jet printing industry). The base
case configuration (impact velocity of 1m/s and droplet diameter of 3mm) can also be represented
in non-dimensional terms as Re = 3000 and We = 40.
4.3.1 Base case model - outline of the physical mechanism
Figure 4-2 shows the time history of the impact of a water droplet on an inverted T-hole
substrate, for the droplet impact velocity of 0.75m/s, hole diameter of 0.15mm and droplet
diameter of 3mm.
Figure 4-2: Droplet impact on an inverted T-hole resulting in interlocking penetration
The hole diameter is 0.15mm throughout, and the vertical length of the hole (hole stem) is
0.85mm. Once the droplet impacts on the substrate, a part of the liquid penetrates into the hole,
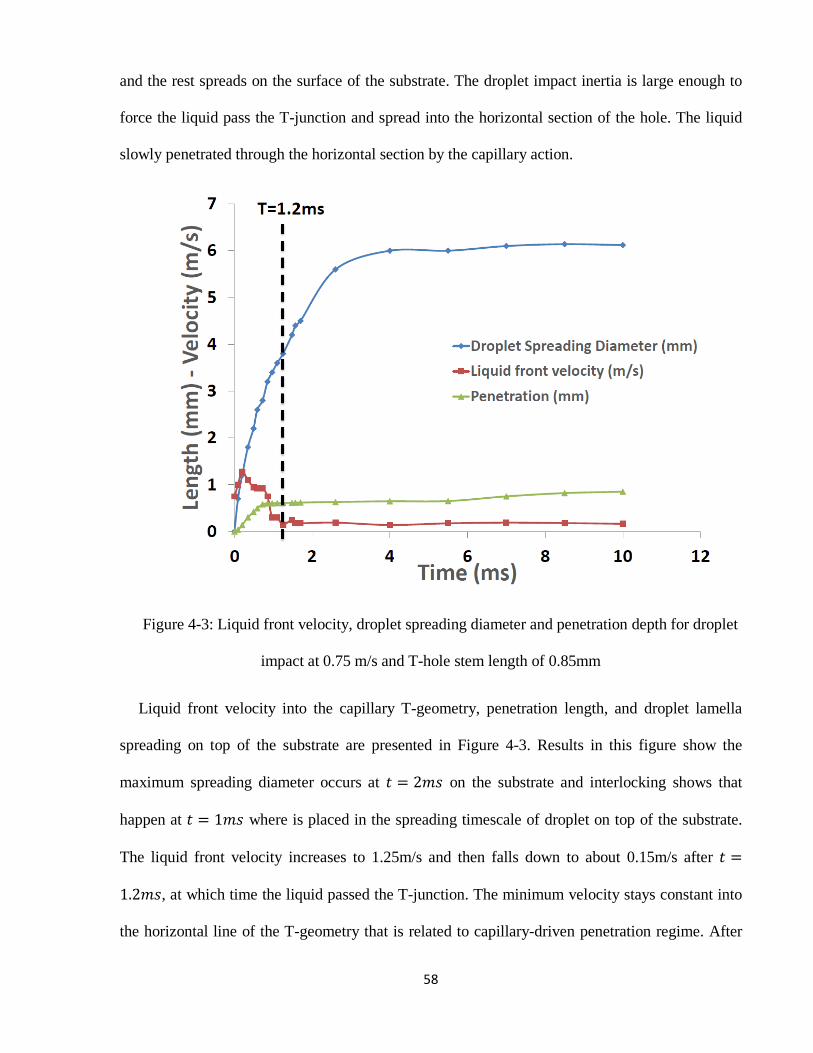
58
and the rest spreads on the surface of the substrate. The droplet impact inertia is large enough to
force the liquid pass the T-junction and spread into the horizontal section of the hole. The liquid
slowly penetrated through the horizontal section by the capillary action.
Figure 4-3: Liquid front velocity, droplet spreading diameter and penetration depth for droplet
impact at 0.75 m/s and T-hole stem length of 0.85mm
Liquid front velocity into the capillary T-geometry, penetration length, and droplet lamella
spreading on top of the substrate are presented in Figure 4-3. Results in this figure show the
maximum spreading diameter occurs at 𝑡 = 2𝑚𝑠 on the substrate and interlocking shows that
happen at 𝑡 = 1𝑚𝑠 where is placed in the spreading timescale of droplet on top of the substrate.
The liquid front velocity increases to 1.25m/s and then falls down to about 0.15m/s after 𝑡 =
1.2𝑚𝑠, at which time the liquid passed the T-junction. The minimum velocity stays constant into
the horizontal line of the T-geometry that is related to capillary-driven penetration regime. After
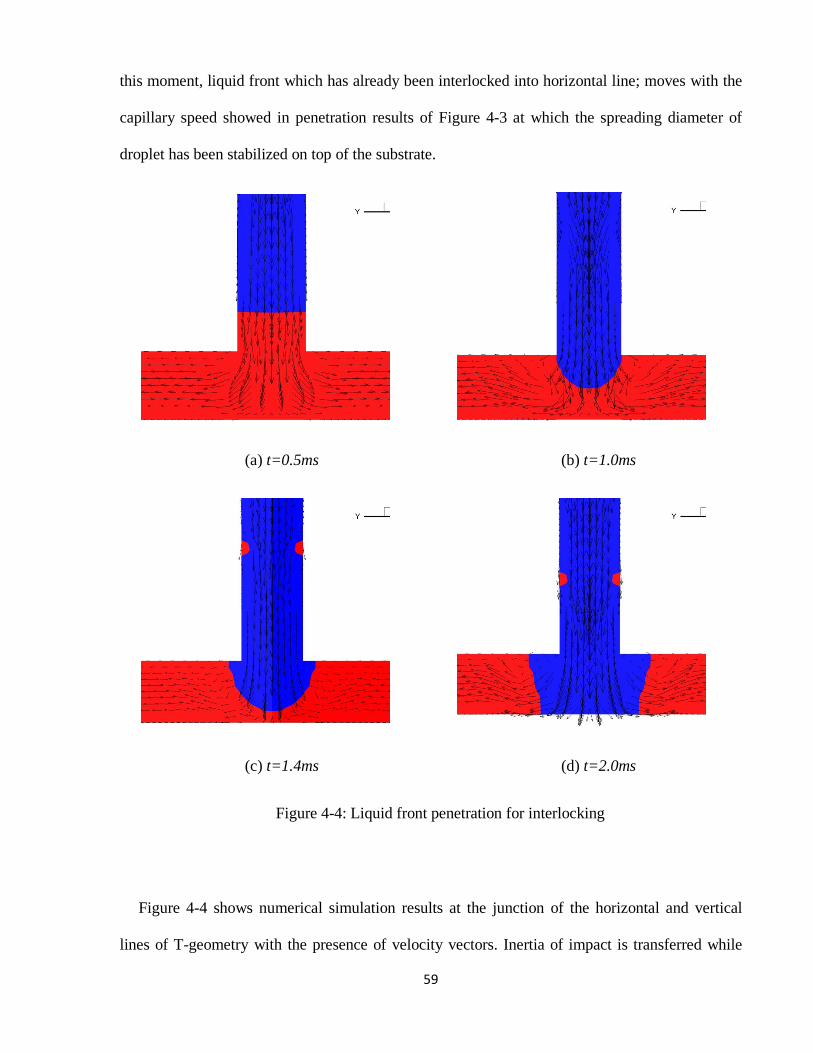
59
this moment, liquid front which has already been interlocked into horizontal line; moves with the
capillary speed showed in penetration results of Figure 4-3 at which the spreading diameter of
droplet has been stabilized on top of the substrate.
(a) t=0.5ms (b) t=1.0ms
(c) t=1.4ms (d) t=2.0ms
Figure 4-4: Liquid front penetration for interlocking
Figure 4-4 shows numerical simulation results at the junction of the horizontal and vertical
lines of T-geometry with the presence of velocity vectors. Inertia of impact is transferred while
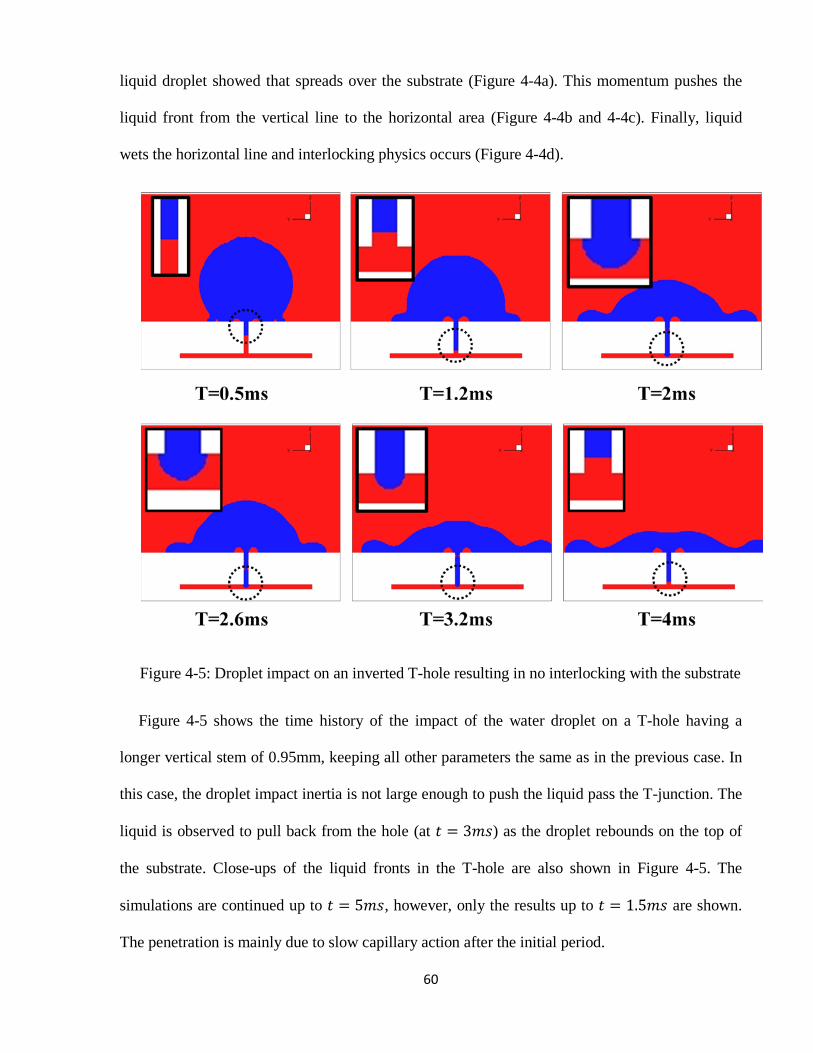
60
liquid droplet showed that spreads over the substrate (Figure 4-4a). This momentum pushes the
liquid front from the vertical line to the horizontal area (Figure 4-4b and 4-4c). Finally, liquid
wets the horizontal line and interlocking physics occurs (Figure 4-4d).
Figure 4-5: Droplet impact on an inverted T-hole resulting in no interlocking with the substrate
Figure 4-5 shows the time history of the impact of the water droplet on a T-hole having a
longer vertical stem of 0.95mm, keeping all other parameters the same as in the previous case. In
this case, the droplet impact inertia is not large enough to push the liquid pass the T-junction. The
liquid is observed to pull back from the hole (at 𝑡 = 3𝑚𝑠) as the droplet rebounds on the top of
the substrate. Close-ups of the liquid fronts in the T-hole are also shown in Figure 4-5. The
simulations are continued up to 𝑡 = 5𝑚𝑠, however, only the results up to 𝑡 = 1.5𝑚𝑠 are shown.
The penetration is mainly due to slow capillary action after the initial period.
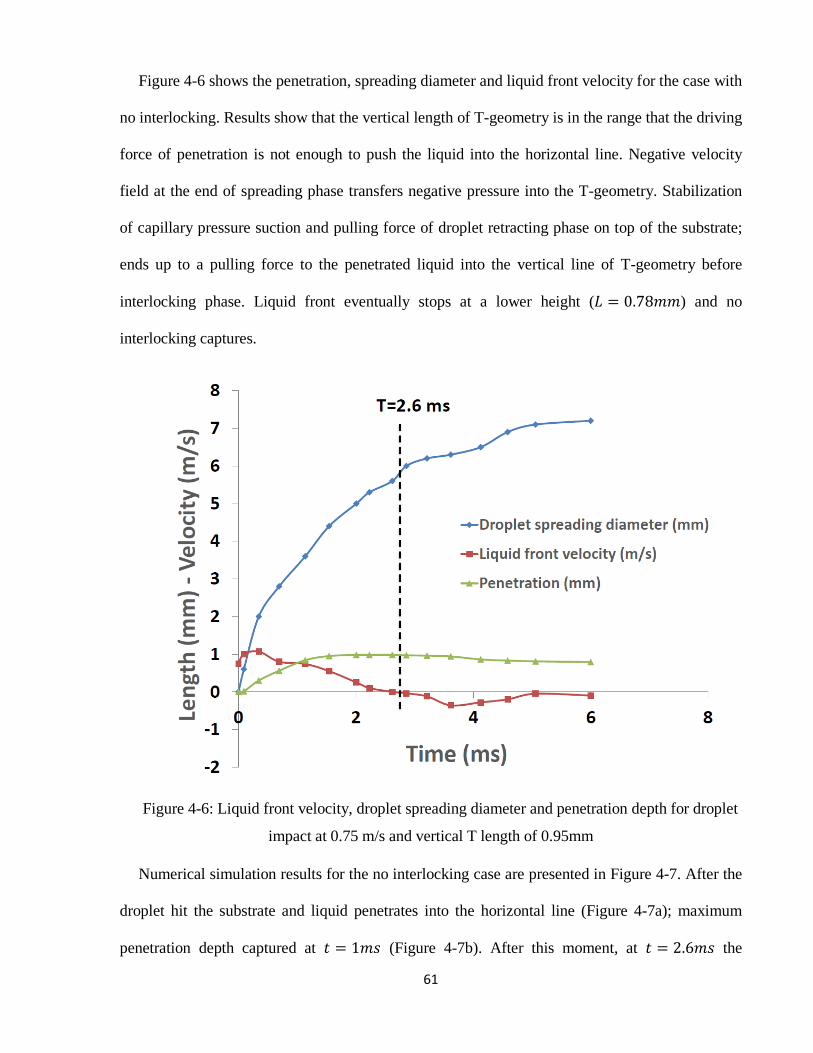
61
Figure 4-6 shows the penetration, spreading diameter and liquid front velocity for the case with
no interlocking. Results show that the vertical length of T-geometry is in the range that the driving
force of penetration is not enough to push the liquid into the horizontal line. Negative velocity
field at the end of spreading phase transfers negative pressure into the T-geometry. Stabilization
of capillary pressure suction and pulling force of droplet retracting phase on top of the substrate;
ends up to a pulling force to the penetrated liquid into the vertical line of T-geometry before
interlocking phase. Liquid front eventually stops at a lower height (𝐿 = 0.78𝑚𝑚) and no
interlocking captures.
Figure 4-6: Liquid front velocity, droplet spreading diameter and penetration depth for droplet
impact at 0.75 m/s and vertical T length of 0.95mm
Numerical simulation results for the no interlocking case are presented in Figure 4-7. After the
droplet hit the substrate and liquid penetrates into the horizontal line (Figure 4-7a); maximum
penetration depth captured at 𝑡 = 1𝑚𝑠 (Figure 4-7b). After this moment, at 𝑡 = 2.6𝑚𝑠 the
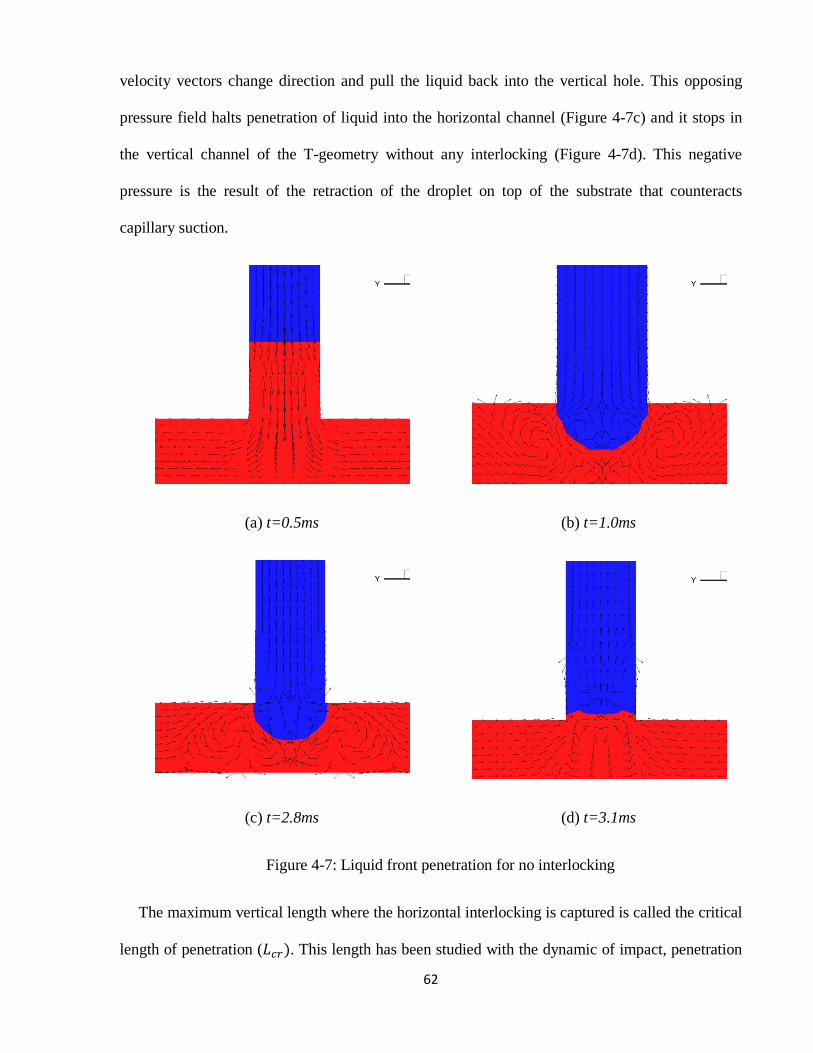
62
velocity vectors change direction and pull the liquid back into the vertical hole. This opposing
pressure field halts penetration of liquid into the horizontal channel (Figure 4-7c) and it stops in
the vertical channel of the T-geometry without any interlocking (Figure 4-7d). This negative
pressure is the result of the retraction of the droplet on top of the substrate that counteracts
capillary suction.
(a) t=0.5ms (b) t=1.0ms
(c) t=2.8ms (d) t=3.1ms
Figure 4-7: Liquid front penetration for no interlocking
The maximum vertical length where the horizontal interlocking is captured is called the critical
length of penetration (𝐿𝑐𝑟). This length has been studied with the dynamic of impact, penetration
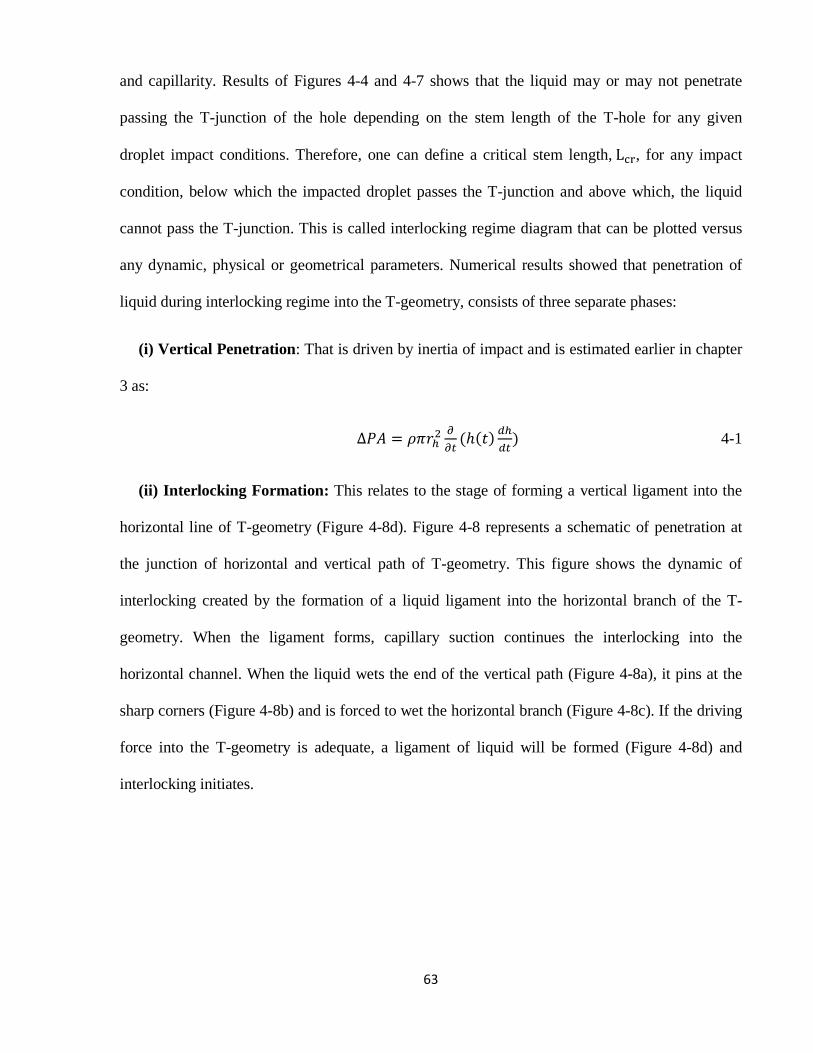
63
and capillarity. Results of Figures 4-4 and 4-7 shows that the liquid may or may not penetrate
passing the T-junction of the hole depending on the stem length of the T-hole for any given
droplet impact conditions. Therefore, one can define a critical stem length, Lcr, for any impact
condition, below which the impacted droplet passes the T-junction and above which, the liquid
cannot pass the T-junction. This is called interlocking regime diagram that can be plotted versus
any dynamic, physical or geometrical parameters. Numerical results showed that penetration of
liquid during interlocking regime into the T-geometry, consists of three separate phases:
(i) Vertical Penetration: That is driven by inertia of impact and is estimated earlier in chapter
3 as:
∆𝑃𝐴 = 𝜌𝜋𝑟ℎ2𝜕𝜕𝑡
(ℎ(𝑡) 𝑑ℎ𝑑𝑡
) 4-1
(ii) Interlocking Formation: This relates to the stage of forming a vertical ligament into the
horizontal line of T-geometry (Figure 4-8d). Figure 4-8 represents a schematic of penetration at
the junction of horizontal and vertical path of T-geometry. This figure shows the dynamic of
interlocking created by the formation of a liquid ligament into the horizontal branch of the T-
geometry. When the ligament forms, capillary suction continues the interlocking into the
horizontal channel. When the liquid wets the end of the vertical path (Figure 4-8a), it pins at the
sharp corners (Figure 4-8b) and is forced to wet the horizontal branch (Figure 4-8c). If the driving
force into the T-geometry is adequate, a ligament of liquid will be formed (Figure 4-8d) and
interlocking initiates.
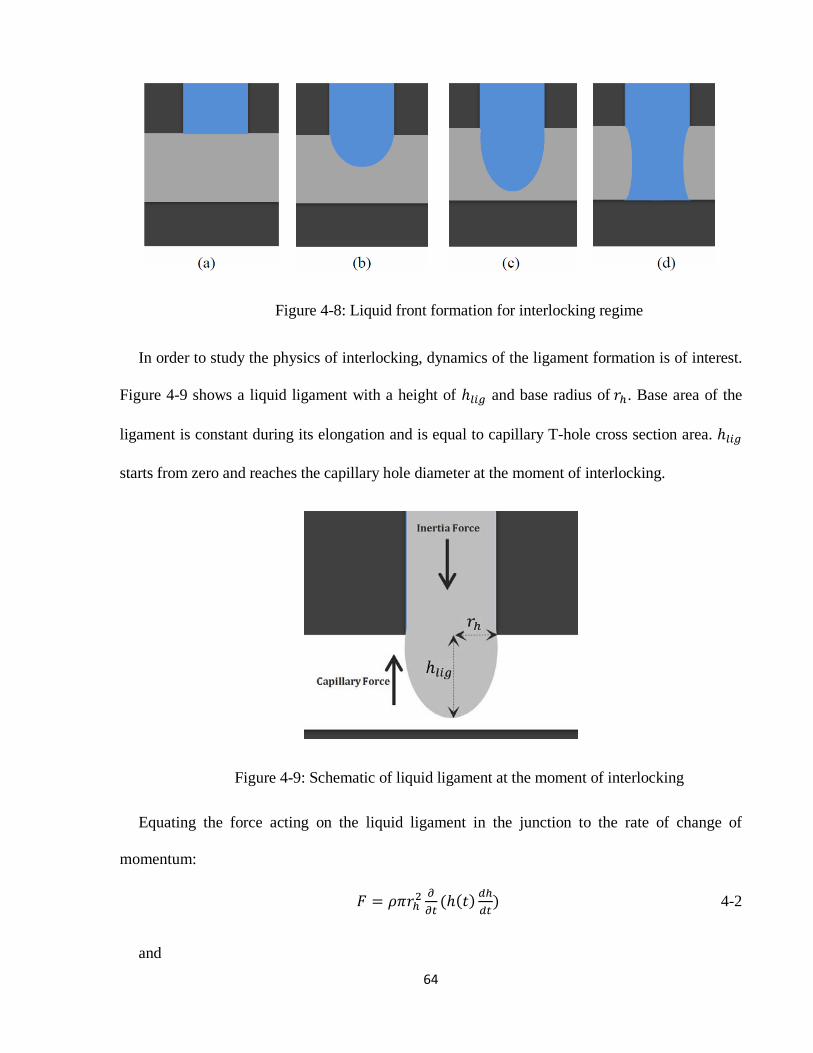
64
Figure 4-8: Liquid front formation for interlocking regime
In order to study the physics of interlocking, dynamics of the ligament formation is of interest.
Figure 4-9 shows a liquid ligament with a height of ℎ𝑙𝑖𝑔 and base radius of 𝑟ℎ. Base area of the
ligament is constant during its elongation and is equal to capillary T-hole cross section area. ℎ𝑙𝑖𝑔
starts from zero and reaches the capillary hole diameter at the moment of interlocking.
Figure 4-9: Schematic of liquid ligament at the moment of interlocking
Equating the force acting on the liquid ligament in the junction to the rate of change of
momentum:
𝐹 = 𝜌𝜋𝑟ℎ2𝜕𝜕𝑡
(ℎ(𝑡) 𝑑ℎ𝑑𝑡
) 4-2
and
65
𝐹 = 𝐹𝑖𝑛𝑒𝑟𝑡𝑖𝑎 + 𝐹𝑐𝑎𝑝𝑖𝑙𝑙𝑎𝑟𝑦 + 𝐹𝑔𝑟𝑎𝑣𝑖𝑡𝑦 + 𝐹𝑣𝑖𝑠𝑐𝑜𝑠𝑖𝑡𝑦 4-3
Inertia, capillary, viscous and gravity forces are all the sensible forces applies to the liquid
ligament while it pins at the junction of T-geometry. The relative magnitude of viscous forces and
capillary forces is estimated by the Ohnesorge number.
𝑂ℎ = 𝑣𝑖𝑠𝑐𝑜𝑢𝑠�𝑐𝑎𝑝𝑖𝑙𝑙𝑎𝑟𝑦 ×𝑖𝑛𝑒𝑟𝑡𝑖𝑎
= 𝜇�𝜌 𝜎 𝑑ℎ
≅ 0.01 … 0.03 4-4
Therefore, viscous effects are negligible compared to capillary forces in the calculations.
𝐹𝑣𝑖𝑠𝑐𝑜𝑠𝑖𝑡𝑦 ≪ 𝐹𝑖𝑛𝑒𝑟𝑡𝑖𝑎 + 𝐹𝑐𝑎𝑝𝑖𝑙𝑙𝑎𝑟𝑦 + 𝐹𝑔𝑟𝑎𝑣𝑖𝑡𝑦 4-5
The relative influence of gravity compared to capillary forces in stretching ligament period is
estimated by the value of the Bond number.
𝐵𝑜 = 𝑔𝑟𝑎𝑣𝑖𝑡𝑦𝑐𝑎𝑝𝑖𝑙𝑙𝑎𝑟𝑦
= 𝜌 𝑔 𝑑ℎ2
𝜎≅ 0.003 … 0.03 4-6
This ratio eliminates the effect of gravity in our calculations.
𝐹𝑔𝑟𝑎𝑣𝑖𝑡𝑦 ≪ 𝐹𝑖𝑛𝑒𝑟𝑡𝑖𝑎 + 𝐹𝑐𝑎𝑝𝑖𝑙𝑙𝑎𝑟𝑦 4-7
Therefore, the significant forces left are the inertia of impact acting as the driving force and the
capillary effect due to the surface tension acting as an opposing force during liquid ligament
formation.
The influence of surface tension and inertia of impact is evaluated by the value of Weber
number.
𝑊𝑒 = 𝐼𝑛𝑒𝑟𝑡𝑖𝑎𝑠𝑢𝑟𝑓𝑎𝑐𝑒 𝑡𝑒𝑛𝑠𝑖𝑜𝑛
= 𝜌 𝑉2𝐷𝜎
≅ 0.5 … 4 4-8
66
Weber range in our model shows that two significant effects in interlocking physics are: inertia
of impact and surface tension force. When the liquid ligament is slowly extended, the bridge has
time to adjust itself and stay in stable equilibrium shape at each instant of time.
For the cases that the inertia of impact is large enough to overcome the surface tension force at
the interface of the liquid in the capillary junction, ligament will be formed and interlocking
initiates. Otherwise, liquid droplet starts the retraction phase on top of the substrate and negative
pressure field will be applied into the T-geometry. Retraction pressure field tends to pull the
liquid ligament back to the vertical hole and in this case, interlocking of liquid into horizontal hole
will not occur (Figure 4-7).
Therefore, pressures acting on the liquid ligament are:
𝐹 ≅ 𝐹𝑖𝑛𝑒𝑟𝑡𝑖𝑎 − 𝐹𝑐𝑎𝑝𝑖𝑙𝑙𝑎𝑟𝑦 = 𝜌𝑉2
2− 2 𝜎
𝑟ℎ 4-9
With 𝑟h the curvature radius and V the liquid front velocity. At first moment of ligament
formation (Figure 4-8a), because of the small value of curvature radius
2 𝜎 𝑟≪ 𝜌𝑉2
2 4-10
Therefore;
𝐹 ≅ 𝜌𝑉2
2 Interlocking pressure 4-11
As the liquid ligament enlarges, the effect of surface tension increases, that depreciates the
value of F. This behavior continues up to the point that either interlocking happens (Figure 4-8d)
or surface tension force is larger than inertia of impact and F turns out to suck the liquid back into
the vertical line. This happens while the inertia of impact decreases due to the retraction of droplet
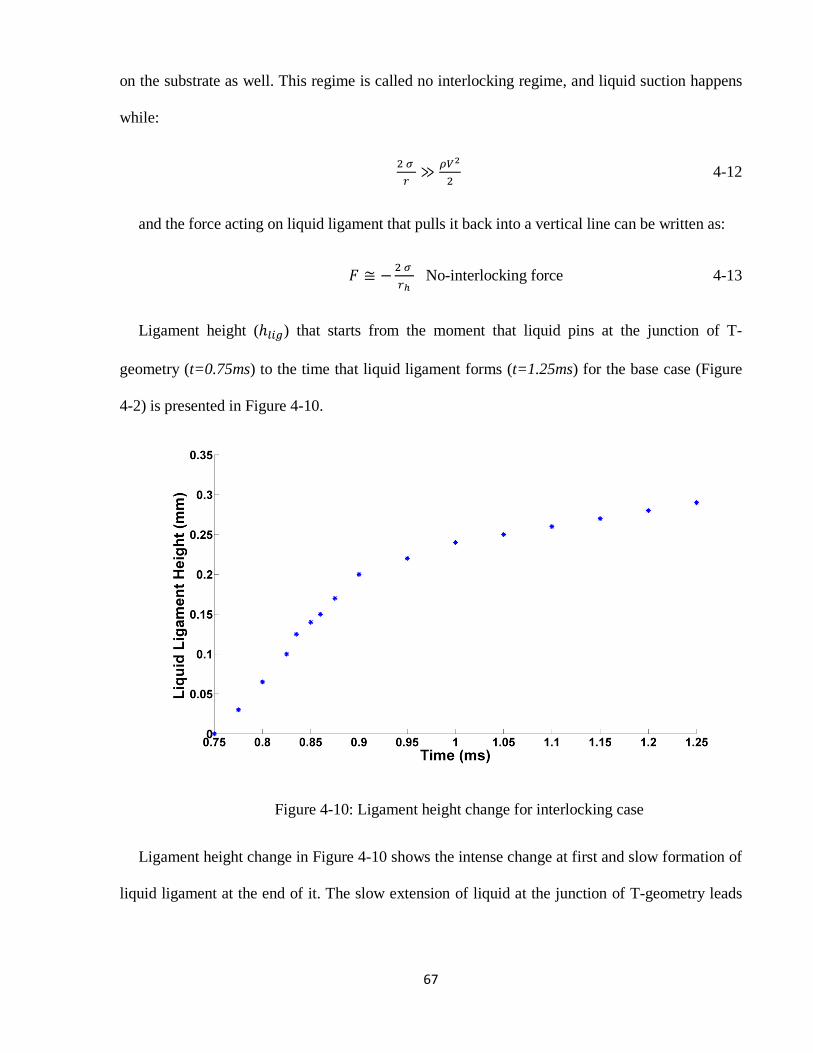
67
on the substrate as well. This regime is called no interlocking regime, and liquid suction happens
while:
2 𝜎 𝑟≫ 𝜌𝑉2
2 4-12
and the force acting on liquid ligament that pulls it back into a vertical line can be written as:
𝐹 ≅ −2 𝜎 𝑟ℎ
No-interlocking force 4-13
Ligament height (ℎ𝑙𝑖𝑔) that starts from the moment that liquid pins at the junction of T-
geometry (t=0.75ms) to the time that liquid ligament forms (t=1.25ms) for the base case (Figure
4-2) is presented in Figure 4-10.
Figure 4-10: Ligament height change for interlocking case
Ligament height change in Figure 4-10 shows the intense change at first and slow formation of
liquid ligament at the end of it. The slow extension of liquid at the junction of T-geometry leads
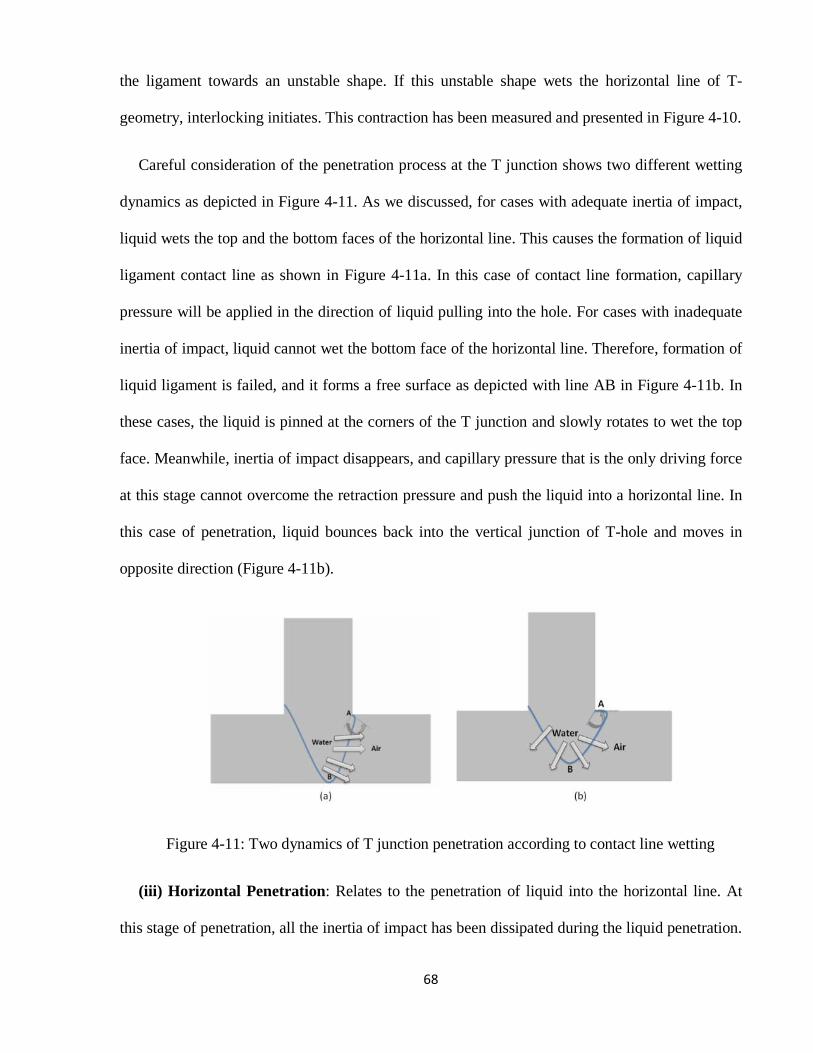
68
the ligament towards an unstable shape. If this unstable shape wets the horizontal line of T-
geometry, interlocking initiates. This contraction has been measured and presented in Figure 4-10.
Careful consideration of the penetration process at the T junction shows two different wetting
dynamics as depicted in Figure 4-11. As we discussed, for cases with adequate inertia of impact,
liquid wets the top and the bottom faces of the horizontal line. This causes the formation of liquid
ligament contact line as shown in Figure 4-11a. In this case of contact line formation, capillary
pressure will be applied in the direction of liquid pulling into the hole. For cases with inadequate
inertia of impact, liquid cannot wet the bottom face of the horizontal line. Therefore, formation of
liquid ligament is failed, and it forms a free surface as depicted with line AB in Figure 4-11b. In
these cases, the liquid is pinned at the corners of the T junction and slowly rotates to wet the top
face. Meanwhile, inertia of impact disappears, and capillary pressure that is the only driving force
at this stage cannot overcome the retraction pressure and push the liquid into a horizontal line. In
this case of penetration, liquid bounces back into the vertical junction of T-hole and moves in
opposite direction (Figure 4-11b).
Figure 4-11: Two dynamics of T junction penetration according to contact line wetting
(iii) Horizontal Penetration: Relates to the penetration of liquid into the horizontal line. At
this stage of penetration, all the inertia of impact has been dissipated during the liquid penetration.
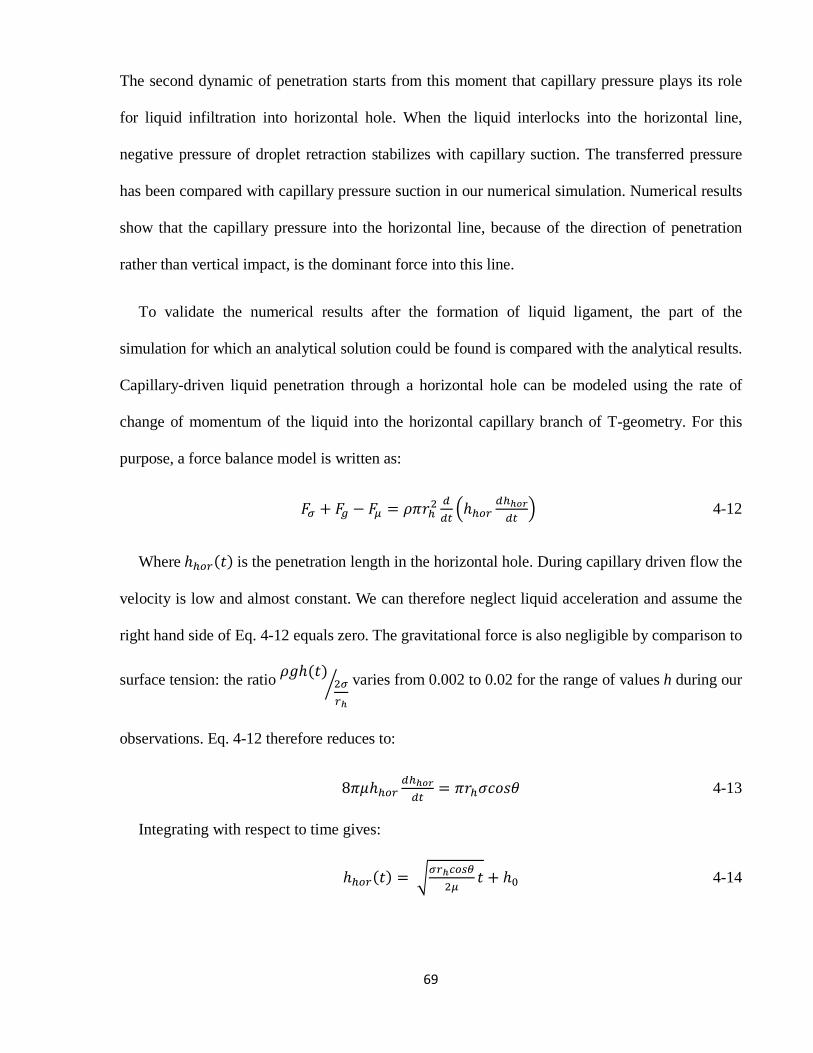
69
The second dynamic of penetration starts from this moment that capillary pressure plays its role
for liquid infiltration into horizontal hole. When the liquid interlocks into the horizontal line,
negative pressure of droplet retraction stabilizes with capillary suction. The transferred pressure
has been compared with capillary pressure suction in our numerical simulation. Numerical results
show that the capillary pressure into the horizontal line, because of the direction of penetration
rather than vertical impact, is the dominant force into this line.
To validate the numerical results after the formation of liquid ligament, the part of the
simulation for which an analytical solution could be found is compared with the analytical results.
Capillary-driven liquid penetration through a horizontal hole can be modeled using the rate of
change of momentum of the liquid into the horizontal capillary branch of T-geometry. For this
purpose, a force balance model is written as:
𝐹𝜎 + 𝐹𝑔 − 𝐹𝜇 = 𝜌𝜋𝑟ℎ2𝑑𝑑𝑡�ℎℎ𝑜𝑟
𝑑ℎℎ𝑜𝑟𝑑𝑡
� 4-12
Where ℎℎ𝑜𝑟(𝑡) is the penetration length in the horizontal hole. During capillary driven flow the
velocity is low and almost constant. We can therefore neglect liquid acceleration and assume the
right hand side of Eq. 4-12 equals zero. The gravitational force is also negligible by comparison to
surface tension: the ratio 𝜌𝑔ℎ(𝑡)2𝜎𝑟ℎ
� varies from 0.002 to 0.02 for the range of values h during our
observations. Eq. 4-12 therefore reduces to:
8𝜋𝜇ℎℎ𝑜𝑟𝑑ℎℎ𝑜𝑟𝑑𝑡
= 𝜋𝑟ℎ𝜎𝑐𝑜𝑠𝜃 4-13
Integrating with respect to time gives:
ℎℎ𝑜𝑟(𝑡) = �𝜎𝑟ℎ𝑐𝑜𝑠𝜃2𝜇
𝑡 + ℎ0 4-14
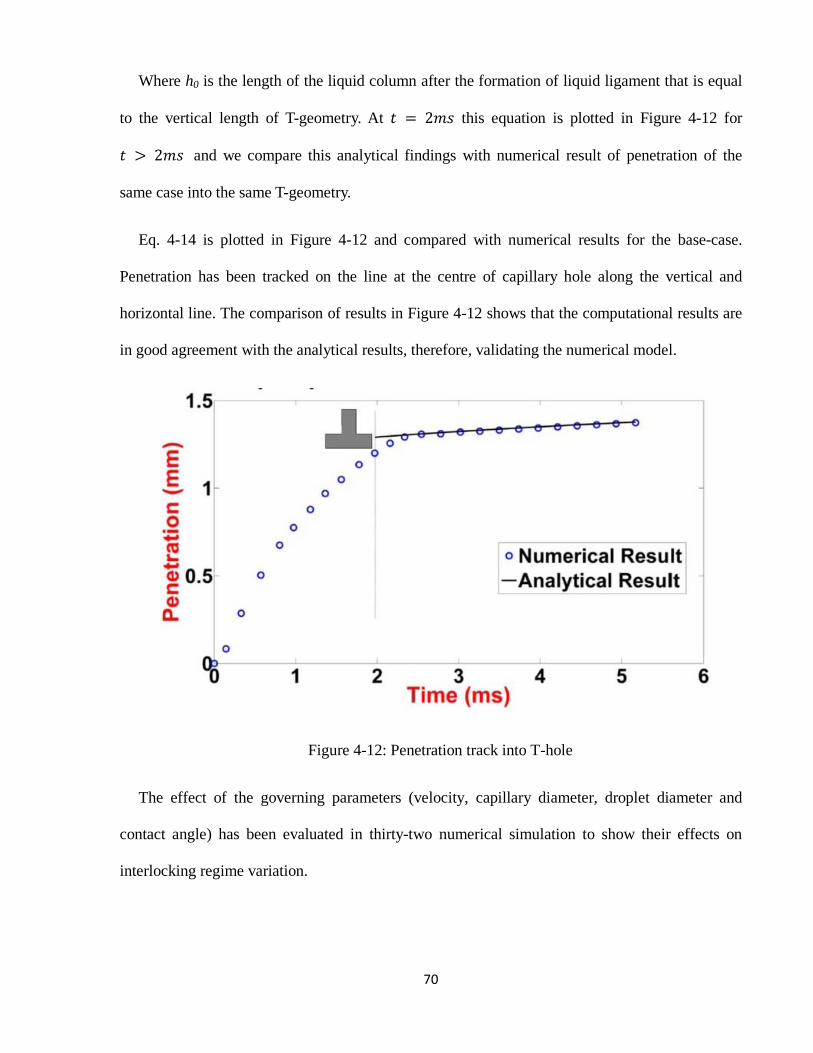
70
Where h0 is the length of the liquid column after the formation of liquid ligament that is equal
to the vertical length of T-geometry. At 𝑡 = 2𝑚𝑠 this equation is plotted in Figure 4-12 for
𝑡 > 2𝑚𝑠 and we compare this analytical findings with numerical result of penetration of the
same case into the same T-geometry.
Eq. 4-14 is plotted in Figure 4-12 and compared with numerical results for the base-case.
Penetration has been tracked on the line at the centre of capillary hole along the vertical and
horizontal line. The comparison of results in Figure 4-12 shows that the computational results are
in good agreement with the analytical results, therefore, validating the numerical model.
Figure 4-12: Penetration track into T-hole
The effect of the governing parameters (velocity, capillary diameter, droplet diameter and
contact angle) has been evaluated in thirty-two numerical simulation to show their effects on
interlocking regime variation.
71
4.3.2 Effect of governing parameters
4.3.2.1 Effect of droplet impact velocity
Effect of droplet impact velocity, pore size, contact angle and droplet diameter on the
interlocking length are studied in the rest of this chapter. Three different impact velocities of 0.5,
0.75 and 1 m/s are considered to specify interlocking regime. The impact velocity represents the
role of inertia force in spreading and penetration. In this study, impact velocity can also indicate
how fast the viscous forces dissipate inertia of the droplet in order to interlock into the horizontal
line.
For droplet impact on non-permeable substrates, the value of velocity considerably affects the
spreading factor. When a droplet impacts and spreads on the surface, axial momentum is
transformed into radial momentum and viscosity of the liquid tends to decrease the radial
velocities and lateral spreading. For cases of droplet impact on porous substrates, viscous effects
are important with respect to the amount of momentum transfers into lateral spreading and also in
the momentum dissipation due to viscous drag within the substrate. At three different velocities
(0.5, 0.75 and 1 m/s) the critical length has been evaluated while varying vertical channel length.
Considering the fact of 𝐿𝑐𝑟 estimation earlier in this section, interlocking has been studied directly
for each impact velocity. In order to specify this length six simulations of larger and smaller
values of vertical length has been performed, and centre value between the last two lengths is
assumed as critical length. The value of 𝐿𝑐𝑟 has been specified with an accuracy of 0.05mm in the
simulations.
As the impact velocity increases, vertical momentum of impact on the substrate increases too.
Contrary to that, the maximum droplet spreading time (the time it takes for the momentum to be
transferred into the hole network) decreases. These two values can be compared by considering
72
the value of Reynolds number and 𝑡𝑠𝑝𝑟 in each case. Simulations start from impact velocity of 0.4
m/s. For impact velocities smaller than this, inertia of impact is not adequate to infiltrate into the
horizontal line and evaluate the value of 𝐿𝑐𝑟. It can be also explained in the way that inertia of
impact is in the range that the vertical penetration starts with capillary suction entirely.
Figure 4-13 shows the critical length, for three different impact velocities. The critical length
for impact velocities of 0.5 m/s, 0.75m/s, and 1m/s is 0.2mm, 0.89mm and 1.25mm, respectively.
The vertical length of the T-hole is normalized with the hole diameter. The critical length
increases almost linearly with increasing the impact velocity. Impact velocity increases the inertia
of impact that is the driving force of horizontal infiltration. Range of impact velocity in our study
is specified in the range of interest in the ink-jet printing industry.
Figure 4-13: Parametric study of liquid interlocking at different impact velocities
4.3.2.2 Effect of droplet diameter
Interlocking regime has been specified for droplet diameter changing from 2mm to 3.5mm.
Droplet diameter represents the ratio of inertia of impact to viscous term. Increasing the value of
droplet diameter increases the effect of inertia in compare with surface tension as well. Less effect
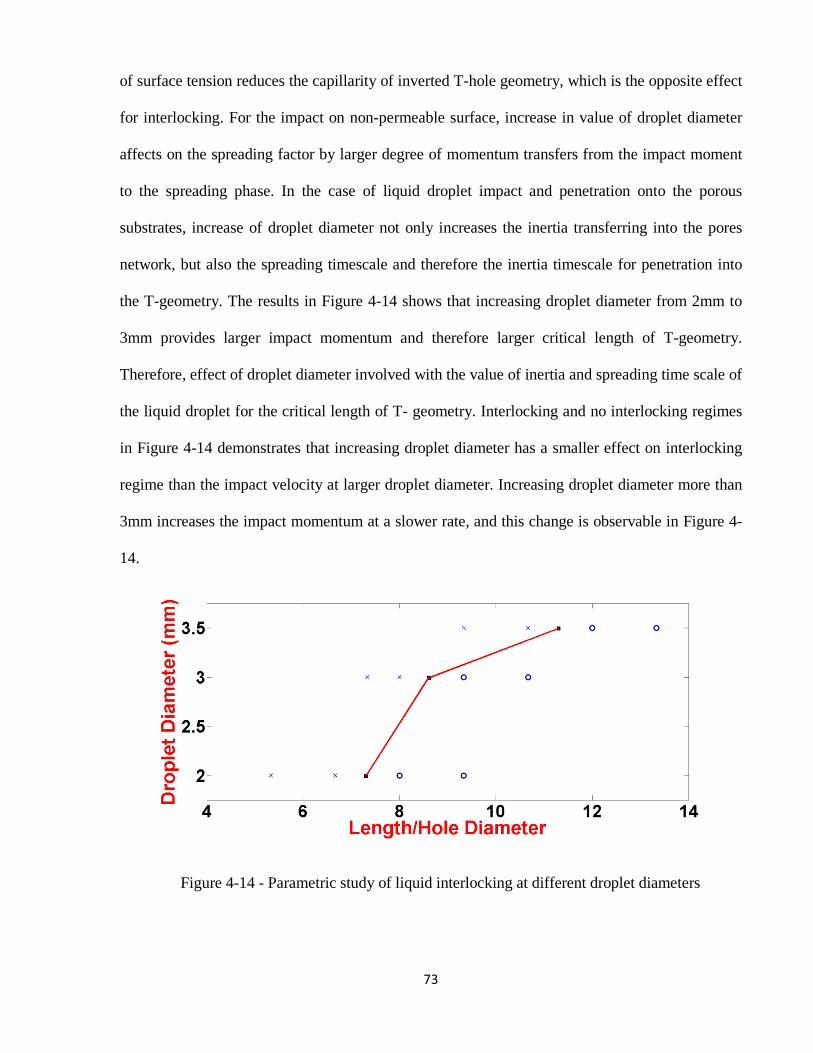
73
of surface tension reduces the capillarity of inverted T-hole geometry, which is the opposite effect
for interlocking. For the impact on non-permeable surface, increase in value of droplet diameter
affects on the spreading factor by larger degree of momentum transfers from the impact moment
to the spreading phase. In the case of liquid droplet impact and penetration onto the porous
substrates, increase of droplet diameter not only increases the inertia transferring into the pores
network, but also the spreading timescale and therefore the inertia timescale for penetration into
the T-geometry. The results in Figure 4-14 shows that increasing droplet diameter from 2mm to
3mm provides larger impact momentum and therefore larger critical length of T-geometry.
Therefore, effect of droplet diameter involved with the value of inertia and spreading time scale of
the liquid droplet for the critical length of T- geometry. Interlocking and no interlocking regimes
in Figure 4-14 demonstrates that increasing droplet diameter has a smaller effect on interlocking
regime than the impact velocity at larger droplet diameter. Increasing droplet diameter more than
3mm increases the impact momentum at a slower rate, and this change is observable in Figure 4-
14.
Figure 4-14 - Parametric study of liquid interlocking at different droplet diameters
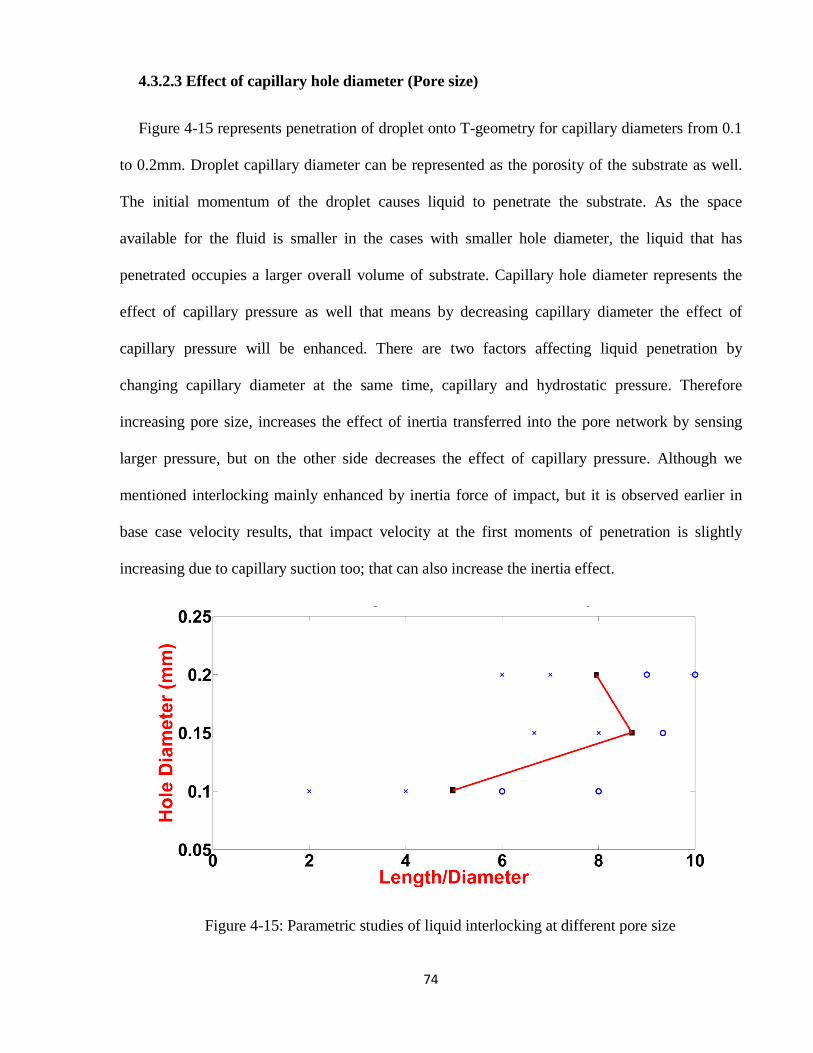
74
4.3.2.3 Effect of capillary hole diameter (Pore size)
Figure 4-15 represents penetration of droplet onto T-geometry for capillary diameters from 0.1
to 0.2mm. Droplet capillary diameter can be represented as the porosity of the substrate as well.
The initial momentum of the droplet causes liquid to penetrate the substrate. As the space
available for the fluid is smaller in the cases with smaller hole diameter, the liquid that has
penetrated occupies a larger overall volume of substrate. Capillary hole diameter represents the
effect of capillary pressure as well that means by decreasing capillary diameter the effect of
capillary pressure will be enhanced. There are two factors affecting liquid penetration by
changing capillary diameter at the same time, capillary and hydrostatic pressure. Therefore
increasing pore size, increases the effect of inertia transferred into the pore network by sensing
larger pressure, but on the other side decreases the effect of capillary pressure. Although we
mentioned interlocking mainly enhanced by inertia force of impact, but it is observed earlier in
base case velocity results, that impact velocity at the first moments of penetration is slightly
increasing due to capillary suction too; that can also increase the inertia effect.
Figure 4-15: Parametric studies of liquid interlocking at different pore size
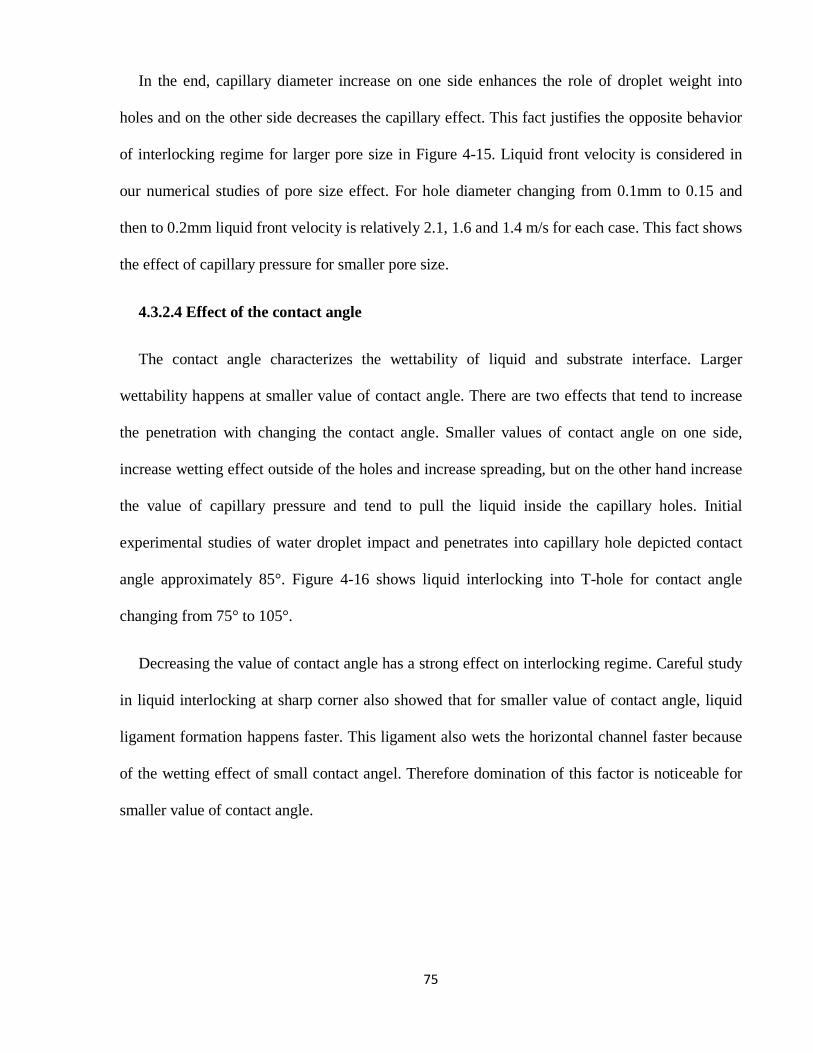
75
In the end, capillary diameter increase on one side enhances the role of droplet weight into
holes and on the other side decreases the capillary effect. This fact justifies the opposite behavior
of interlocking regime for larger pore size in Figure 4-15. Liquid front velocity is considered in
our numerical studies of pore size effect. For hole diameter changing from 0.1mm to 0.15 and
then to 0.2mm liquid front velocity is relatively 2.1, 1.6 and 1.4 m/s for each case. This fact shows
the effect of capillary pressure for smaller pore size.
4.3.2.4 Effect of the contact angle
The contact angle characterizes the wettability of liquid and substrate interface. Larger
wettability happens at smaller value of contact angle. There are two effects that tend to increase
the penetration with changing the contact angle. Smaller values of contact angle on one side,
increase wetting effect outside of the holes and increase spreading, but on the other hand increase
the value of capillary pressure and tend to pull the liquid inside the capillary holes. Initial
experimental studies of water droplet impact and penetrates into capillary hole depicted contact
angle approximately 85°. Figure 4-16 shows liquid interlocking into T-hole for contact angle
changing from 75° to 105°.
Decreasing the value of contact angle has a strong effect on interlocking regime. Careful study
in liquid interlocking at sharp corner also showed that for smaller value of contact angle, liquid
ligament formation happens faster. This ligament also wets the horizontal channel faster because
of the wetting effect of small contact angel. Therefore domination of this factor is noticeable for
smaller value of contact angle.
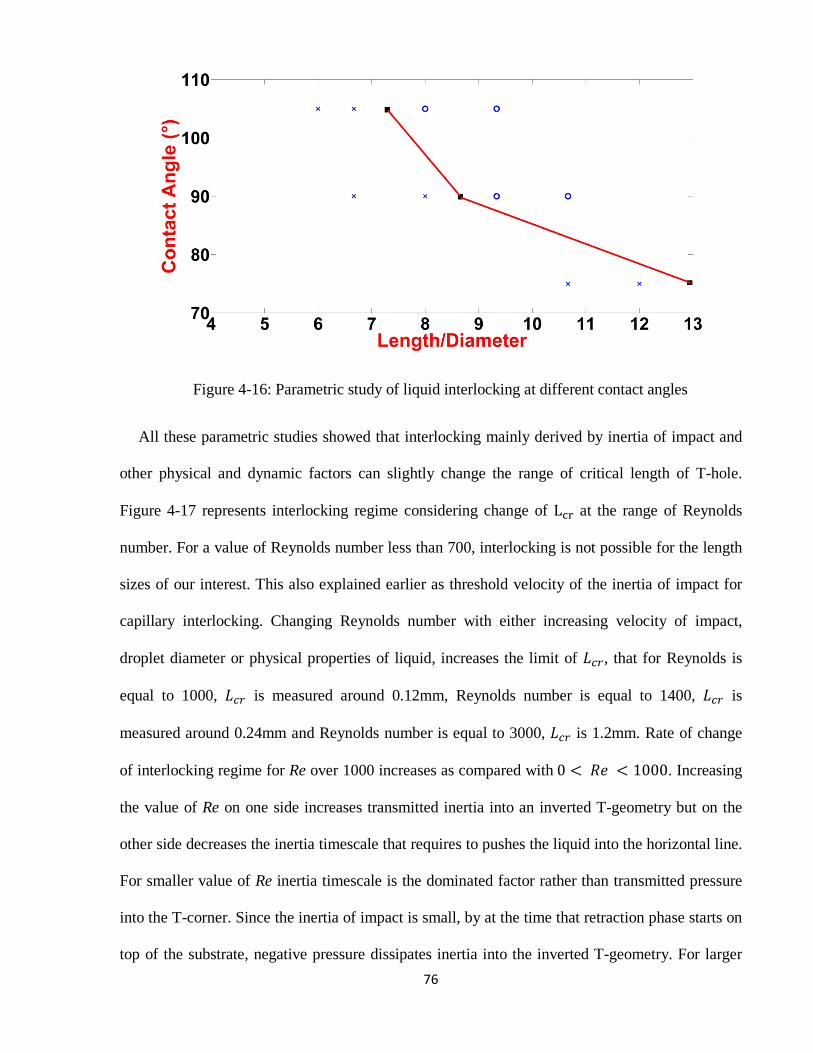
76
Figure 4-16: Parametric study of liquid interlocking at different contact angles
All these parametric studies showed that interlocking mainly derived by inertia of impact and
other physical and dynamic factors can slightly change the range of critical length of T-hole.
Figure 4-17 represents interlocking regime considering change of Lcr at the range of Reynolds
number. For a value of Reynolds number less than 700, interlocking is not possible for the length
sizes of our interest. This also explained earlier as threshold velocity of the inertia of impact for
capillary interlocking. Changing Reynolds number with either increasing velocity of impact,
droplet diameter or physical properties of liquid, increases the limit of 𝐿𝑐𝑟, that for Reynolds is
equal to 1000, 𝐿𝑐𝑟 is measured around 0.12mm, Reynolds number is equal to 1400, 𝐿𝑐𝑟 is
measured around 0.24mm and Reynolds number is equal to 3000, 𝐿𝑐𝑟 is 1.2mm. Rate of change
of interlocking regime for Re over 1000 increases as compared with 0 < 𝑅𝑒 < 1000. Increasing
the value of Re on one side increases transmitted inertia into an inverted T-geometry but on the
other side decreases the inertia timescale that requires to pushes the liquid into the horizontal line.
For smaller value of Re inertia timescale is the dominated factor rather than transmitted pressure
into the T-corner. Since the inertia of impact is small, by at the time that retraction phase starts on
top of the substrate, negative pressure dissipates inertia into the inverted T-geometry. For larger
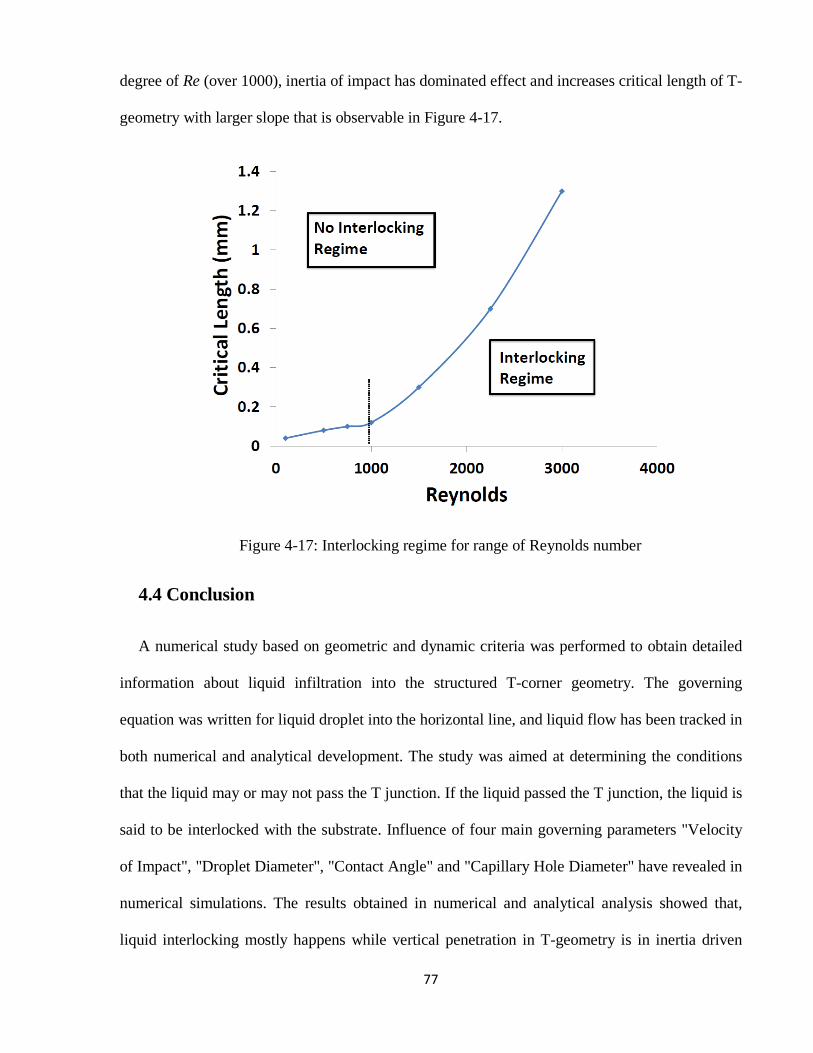
77
degree of Re (over 1000), inertia of impact has dominated effect and increases critical length of T-
geometry with larger slope that is observable in Figure 4-17.
Figure 4-17: Interlocking regime for range of Reynolds number
4.4 Conclusion
A numerical study based on geometric and dynamic criteria was performed to obtain detailed
information about liquid infiltration into the structured T-corner geometry. The governing
equation was written for liquid droplet into the horizontal line, and liquid flow has been tracked in
both numerical and analytical development. The study was aimed at determining the conditions
that the liquid may or may not pass the T junction. If the liquid passed the T junction, the liquid is
said to be interlocked with the substrate. Influence of four main governing parameters "Velocity
of Impact", "Droplet Diameter", "Contact Angle" and "Capillary Hole Diameter" have revealed in
numerical simulations. The results obtained in numerical and analytical analysis showed that,
liquid interlocking mostly happens while vertical penetration in T-geometry is in inertia driven
78
penetration regime. For the cases of vertical length larger than inertia driven penetration regime,
liquid cannot infiltrate into the horizontal branch.
In order to explore the influence of the governing parameters upon the dynamics of impact
and geometry of T-hole, several simulations were performed varying each parameter within the
range of the physical situations of interest. The results indicate that increasing impact velocity
linearly increases critical length of horizontal penetration and liquid infiltration regime. Similar
trend was observed for the droplet diameter, but the effect on the interlocking was less than the
impact velocity. Changing contact angle described wettability effect, which small contact angles,
define larger wettability and more liquid infiltration. Capillary hole diameter has two opposing
behaviors at the same time; (i) decreasing the hole diameter on one side increases the capillarity
of the hole and critical length of T-geometry and, (ii) hydrostatic pressure due to the weight of the
droplet plays a significant role at large capillary diameters. Therefore, changing capillary
diameter, highligh one behavior at the time.
79
Chapter 5
Droplet Impact and Penetration on
Structured 3D Pore Network
5.1 Overview
Chapter 3 provided results on the impact of a liquid droplet on a substrate having a line of
equally spaced holes. Chapter 4 provided results of a study on the penetration of liquid across a
T-junction. These two models were selected to provide a better understanding of the impact and
penetration of liquid into the porous material. However, there are a simple representation of a
porous material and can only provide limited information. This chapter presents result of a study
on a structured pore network geometry as a model for a fiber-based porous material. Effect of
several governing parameters on the liquid penetration into the pore network is investigated.
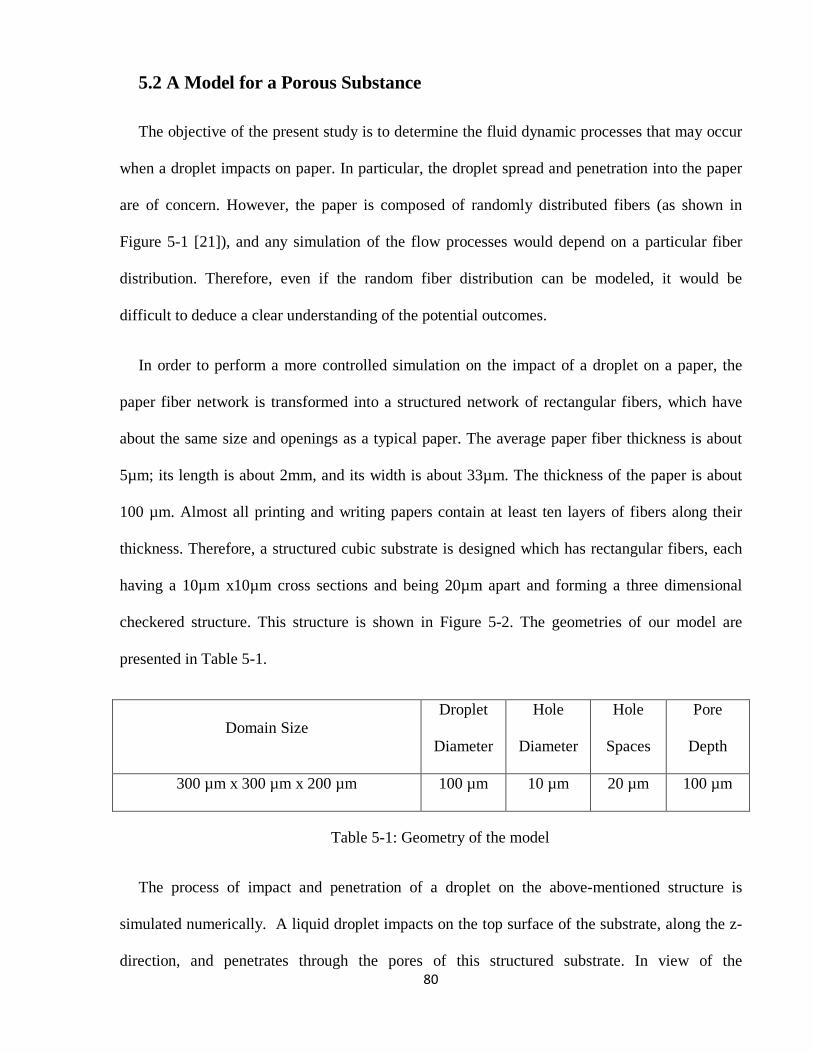
80
5.2 A Model for a Porous Substance
The objective of the present study is to determine the fluid dynamic processes that may occur
when a droplet impacts on paper. In particular, the droplet spread and penetration into the paper
are of concern. However, the paper is composed of randomly distributed fibers (as shown in
Figure 5-1 [21]), and any simulation of the flow processes would depend on a particular fiber
distribution. Therefore, even if the random fiber distribution can be modeled, it would be
difficult to deduce a clear understanding of the potential outcomes.
In order to perform a more controlled simulation on the impact of a droplet on a paper, the
paper fiber network is transformed into a structured network of rectangular fibers, which have
about the same size and openings as a typical paper. The average paper fiber thickness is about
5µm; its length is about 2mm, and its width is about 33µm. The thickness of the paper is about
100 µm. Almost all printing and writing papers contain at least ten layers of fibers along their
thickness. Therefore, a structured cubic substrate is designed which has rectangular fibers, each
having a 10µm x10µm cross sections and being 20µm apart and forming a three dimensional
checkered structure. This structure is shown in Figure 5-2. The geometries of our model are
presented in Table 5-1.
Domain Size Droplet
Diameter
Hole
Diameter
Hole
Spaces
Pore
Depth
300 µm x 300 µm x 200 µm 100 µm 10 µm 20 µm 100 µm
Table 5-1: Geometry of the model
The process of impact and penetration of a droplet on the above-mentioned structure is
simulated numerically. A liquid droplet impacts on the top surface of the substrate, along the z-
direction, and penetrates through the pores of this structured substrate. In view of the
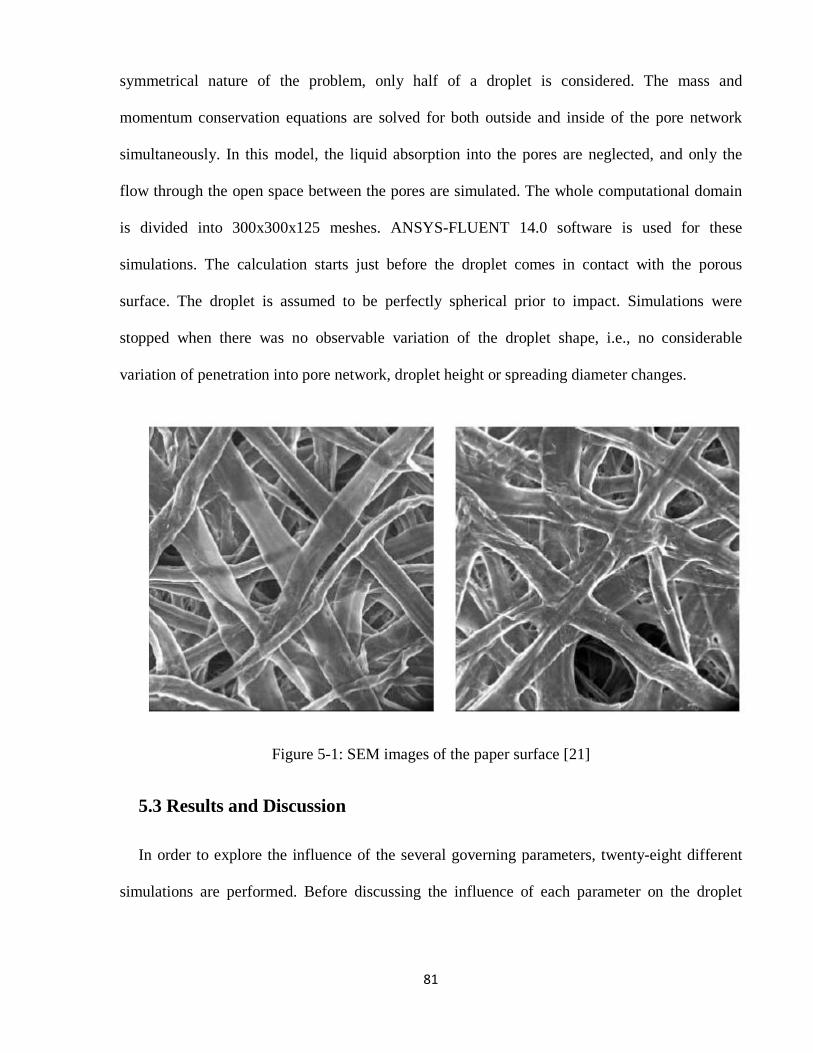
81
symmetrical nature of the problem, only half of a droplet is considered. The mass and
momentum conservation equations are solved for both outside and inside of the pore network
simultaneously. In this model, the liquid absorption into the pores are neglected, and only the
flow through the open space between the pores are simulated. The whole computational domain
is divided into 300x300x125 meshes. ANSYS-FLUENT 14.0 software is used for these
simulations. The calculation starts just before the droplet comes in contact with the porous
surface. The droplet is assumed to be perfectly spherical prior to impact. Simulations were
stopped when there was no observable variation of the droplet shape, i.e., no considerable
variation of penetration into pore network, droplet height or spreading diameter changes.
Figure 5-1: SEM images of the paper surface [21]
5.3 Results and Discussion
In order to explore the influence of the several governing parameters, twenty-eight different
simulations are performed. Before discussing the influence of each parameter on the droplet
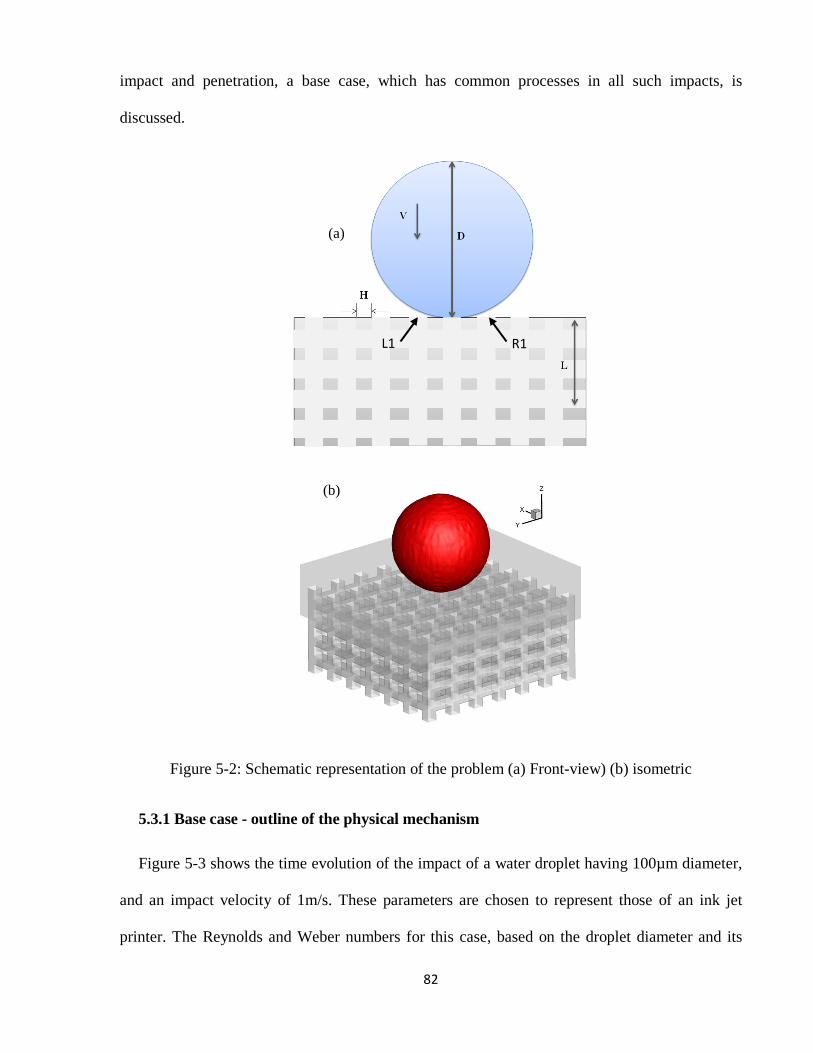
82
impact and penetration, a base case, which has common processes in all such impacts, is
discussed.
Figure 5-2: Schematic representation of the problem (a) Front-view) (b) isometric
5.3.1 Base case - outline of the physical mechanism
Figure 5-3 shows the time evolution of the impact of a water droplet having 100µm diameter,
and an impact velocity of 1m/s. These parameters are chosen to represent those of an ink jet
printer. The Reynolds and Weber numbers for this case, based on the droplet diameter and its
R1 L1
(a)
(b)
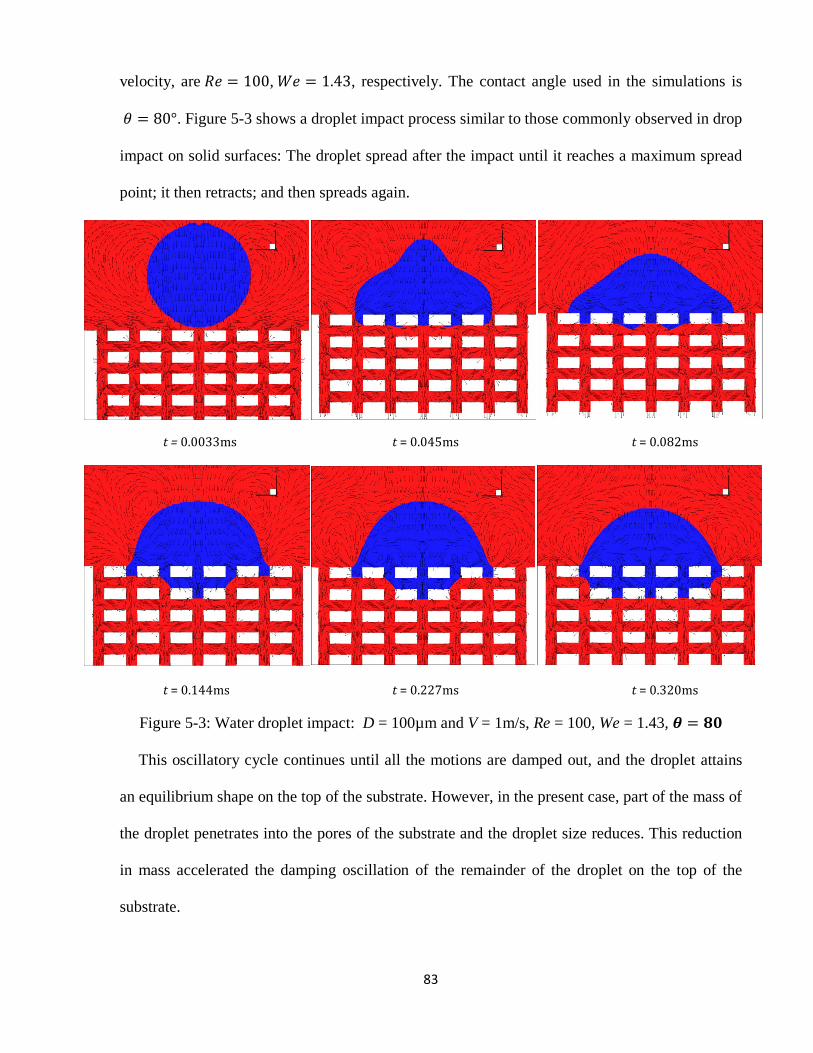
83
velocity, are 𝑅𝑒 = 100, 𝑊𝑒 = 1.43, respectively. The contact angle used in the simulations is
𝜃 = 80°. Figure 5-3 shows a droplet impact process similar to those commonly observed in drop
impact on solid surfaces: The droplet spread after the impact until it reaches a maximum spread
point; it then retracts; and then spreads again.
t = 0.0033ms t = 0.045ms t = 0.082ms
t = 0.144ms t = 0.227ms t = 0.320ms
Figure 5-3: Water droplet impact: D = 100µm and V = 1m/s, Re = 100, We = 1.43, 𝜽 = 𝟖𝟎
This oscillatory cycle continues until all the motions are damped out, and the droplet attains
an equilibrium shape on the top of the substrate. However, in the present case, part of the mass of
the droplet penetrates into the pores of the substrate and the droplet size reduces. This reduction
in mass accelerated the damping oscillation of the remainder of the droplet on the top of the
substrate.
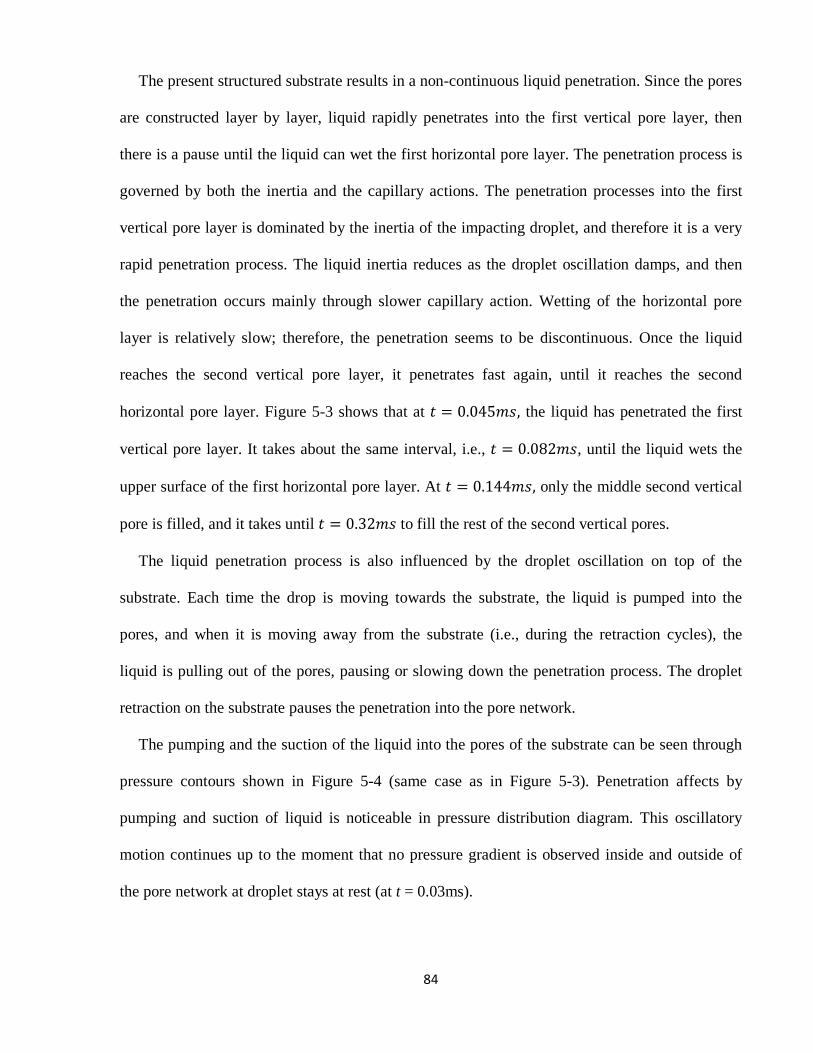
84
The present structured substrate results in a non-continuous liquid penetration. Since the pores
are constructed layer by layer, liquid rapidly penetrates into the first vertical pore layer, then
there is a pause until the liquid can wet the first horizontal pore layer. The penetration process is
governed by both the inertia and the capillary actions. The penetration processes into the first
vertical pore layer is dominated by the inertia of the impacting droplet, and therefore it is a very
rapid penetration process. The liquid inertia reduces as the droplet oscillation damps, and then
the penetration occurs mainly through slower capillary action. Wetting of the horizontal pore
layer is relatively slow; therefore, the penetration seems to be discontinuous. Once the liquid
reaches the second vertical pore layer, it penetrates fast again, until it reaches the second
horizontal pore layer. Figure 5-3 shows that at 𝑡 = 0.045𝑚𝑠, the liquid has penetrated the first
vertical pore layer. It takes about the same interval, i.e., 𝑡 = 0.082𝑚𝑠, until the liquid wets the
upper surface of the first horizontal pore layer. At 𝑡 = 0.144𝑚𝑠, only the middle second vertical
pore is filled, and it takes until 𝑡 = 0.32𝑚𝑠 to fill the rest of the second vertical pores.
The liquid penetration process is also influenced by the droplet oscillation on top of the
substrate. Each time the drop is moving towards the substrate, the liquid is pumped into the
pores, and when it is moving away from the substrate (i.e., during the retraction cycles), the
liquid is pulling out of the pores, pausing or slowing down the penetration process. The droplet
retraction on the substrate pauses the penetration into the pore network.
The pumping and the suction of the liquid into the pores of the substrate can be seen through
pressure contours shown in Figure 5-4 (same case as in Figure 5-3). Penetration affects by
pumping and suction of liquid is noticeable in pressure distribution diagram. This oscillatory
motion continues up to the moment that no pressure gradient is observed inside and outside of
the pore network at droplet stays at rest (at t = 0.03ms).
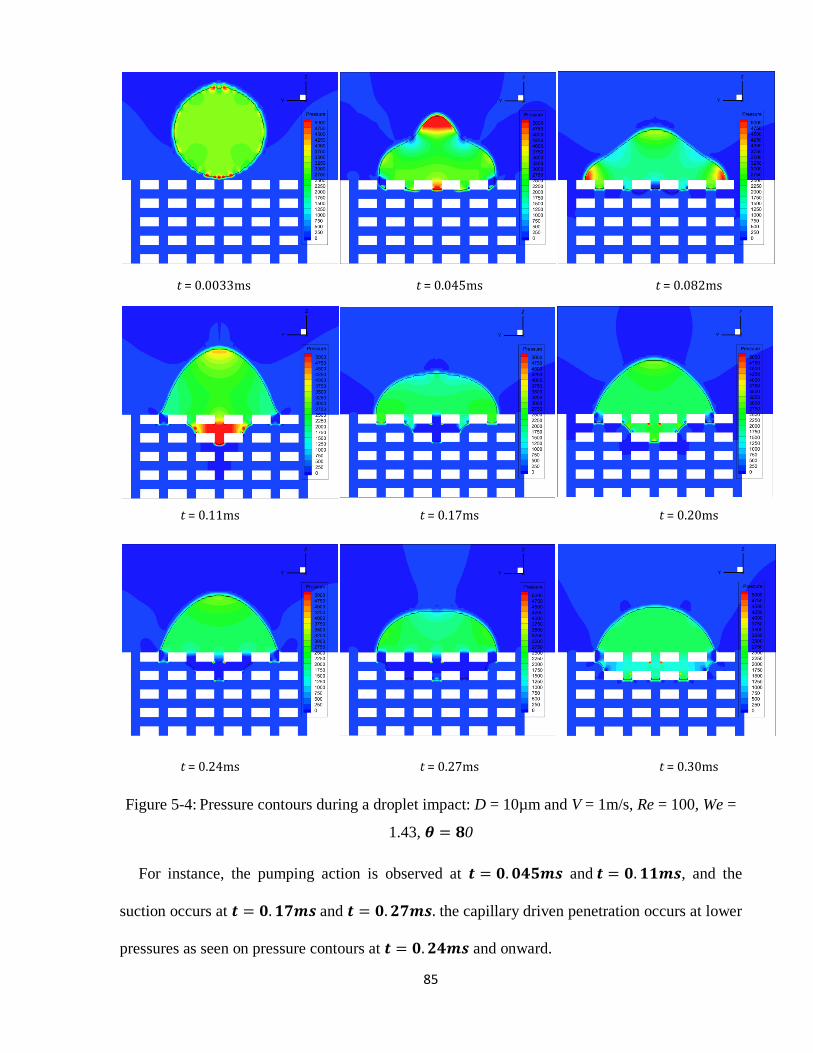
85
t = 0.0033ms t = 0.045ms t = 0.082ms
t = 0.11ms t = 0.17ms t = 0.20ms
t = 0.24ms t = 0.27ms t = 0.30ms
Figure 5-4: Pressure contours during a droplet impact: D = 10µm and V = 1m/s, Re = 100, We =
1.43, 𝜽 = 𝟖0
For instance, the pumping action is observed at 𝒕 = 𝟎.𝟎𝟒𝟓𝒎𝒔 and 𝒕 = 𝟎.𝟏𝟏𝒎𝒔, and the
suction occurs at 𝒕 = 𝟎.𝟏𝟕𝒎𝒔 and 𝒕 = 𝟎.𝟐𝟕𝒎𝒔. the capillary driven penetration occurs at lower
pressures as seen on pressure contours at 𝒕 = 𝟎.𝟐𝟒𝒎𝒔 and onward.
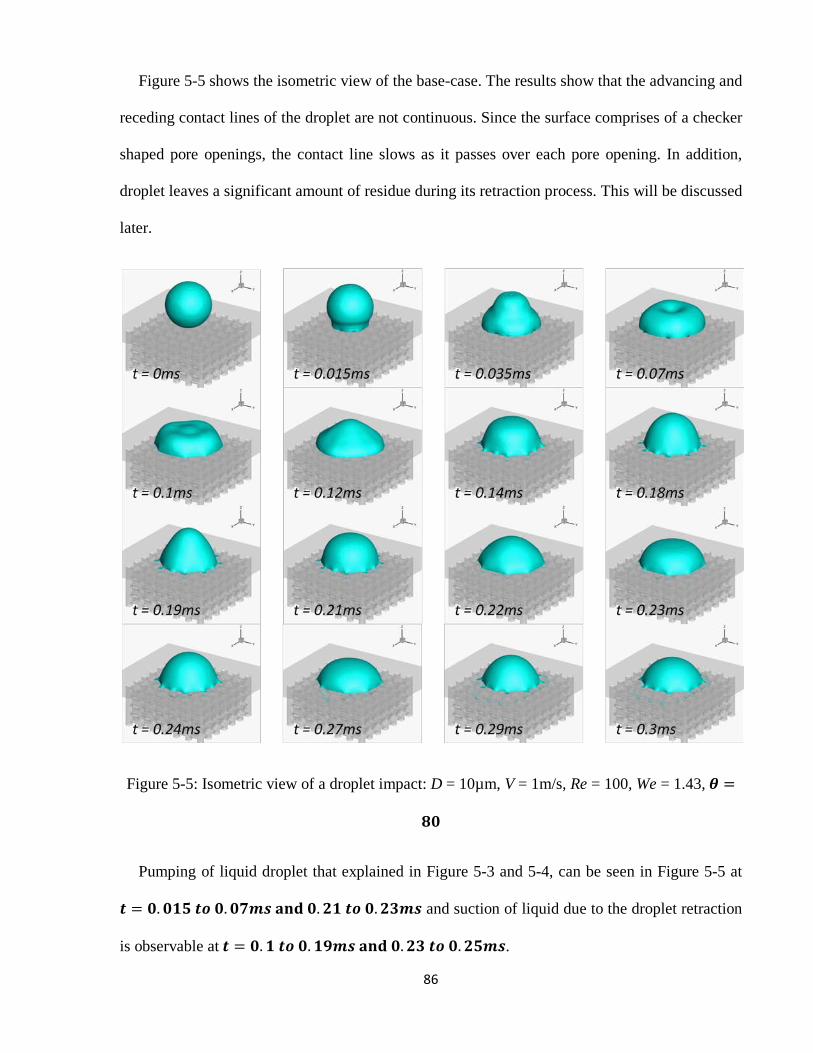
86
Figure 5-5 shows the isometric view of the base-case. The results show that the advancing and
receding contact lines of the droplet are not continuous. Since the surface comprises of a checker
shaped pore openings, the contact line slows as it passes over each pore opening. In addition,
droplet leaves a significant amount of residue during its retraction process. This will be discussed
later.
Figure 5-5: Isometric view of a droplet impact: D = 10µm, V = 1m/s, Re = 100, We = 1.43, 𝜽 =
𝟖𝟎
Pumping of liquid droplet that explained in Figure 5-3 and 5-4, can be seen in Figure 5-5 at
𝒕 = 𝟎.𝟎𝟏𝟓 𝒕𝒐 𝟎.𝟎𝟕𝒎𝒔 𝐚𝐧𝐝 𝟎.𝟐𝟏 𝒕𝒐 𝟎.𝟐𝟑𝒎𝒔 and suction of liquid due to the droplet retraction
is observable at 𝒕 = 𝟎.𝟏 𝒕𝒐 𝟎.𝟏𝟗𝒎𝒔 𝐚𝐧𝐝 𝟎.𝟐𝟑 𝒕𝒐 𝟎.𝟐𝟓𝒎𝒔.
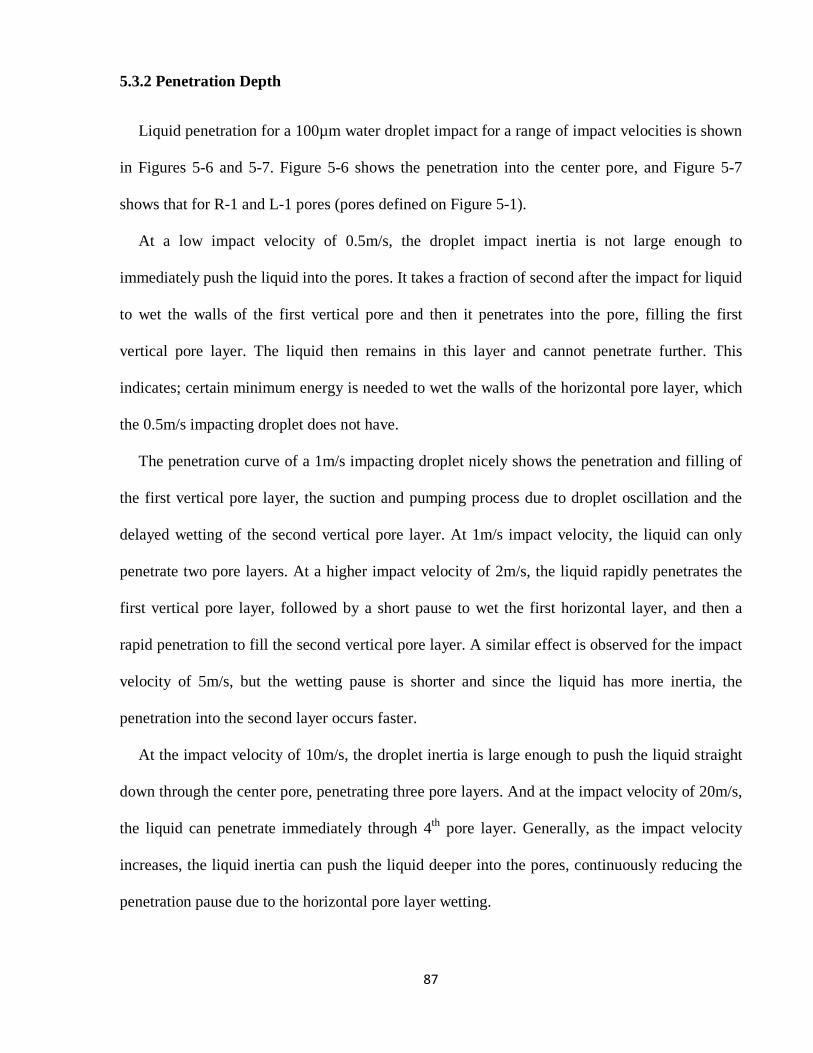
87
5.3.2 Penetration Depth
Liquid penetration for a 100µm water droplet impact for a range of impact velocities is shown
in Figures 5-6 and 5-7. Figure 5-6 shows the penetration into the center pore, and Figure 5-7
shows that for R-1 and L-1 pores (pores defined on Figure 5-1).
At a low impact velocity of 0.5m/s, the droplet impact inertia is not large enough to
immediately push the liquid into the pores. It takes a fraction of second after the impact for liquid
to wet the walls of the first vertical pore and then it penetrates into the pore, filling the first
vertical pore layer. The liquid then remains in this layer and cannot penetrate further. This
indicates; certain minimum energy is needed to wet the walls of the horizontal pore layer, which
the 0.5m/s impacting droplet does not have.
The penetration curve of a 1m/s impacting droplet nicely shows the penetration and filling of
the first vertical pore layer, the suction and pumping process due to droplet oscillation and the
delayed wetting of the second vertical pore layer. At 1m/s impact velocity, the liquid can only
penetrate two pore layers. At a higher impact velocity of 2m/s, the liquid rapidly penetrates the
first vertical pore layer, followed by a short pause to wet the first horizontal layer, and then a
rapid penetration to fill the second vertical pore layer. A similar effect is observed for the impact
velocity of 5m/s, but the wetting pause is shorter and since the liquid has more inertia, the
penetration into the second layer occurs faster.
At the impact velocity of 10m/s, the droplet inertia is large enough to push the liquid straight
down through the center pore, penetrating three pore layers. And at the impact velocity of 20m/s,
the liquid can penetrate immediately through 4th pore layer. Generally, as the impact velocity
increases, the liquid inertia can push the liquid deeper into the pores, continuously reducing the
penetration pause due to the horizontal pore layer wetting.
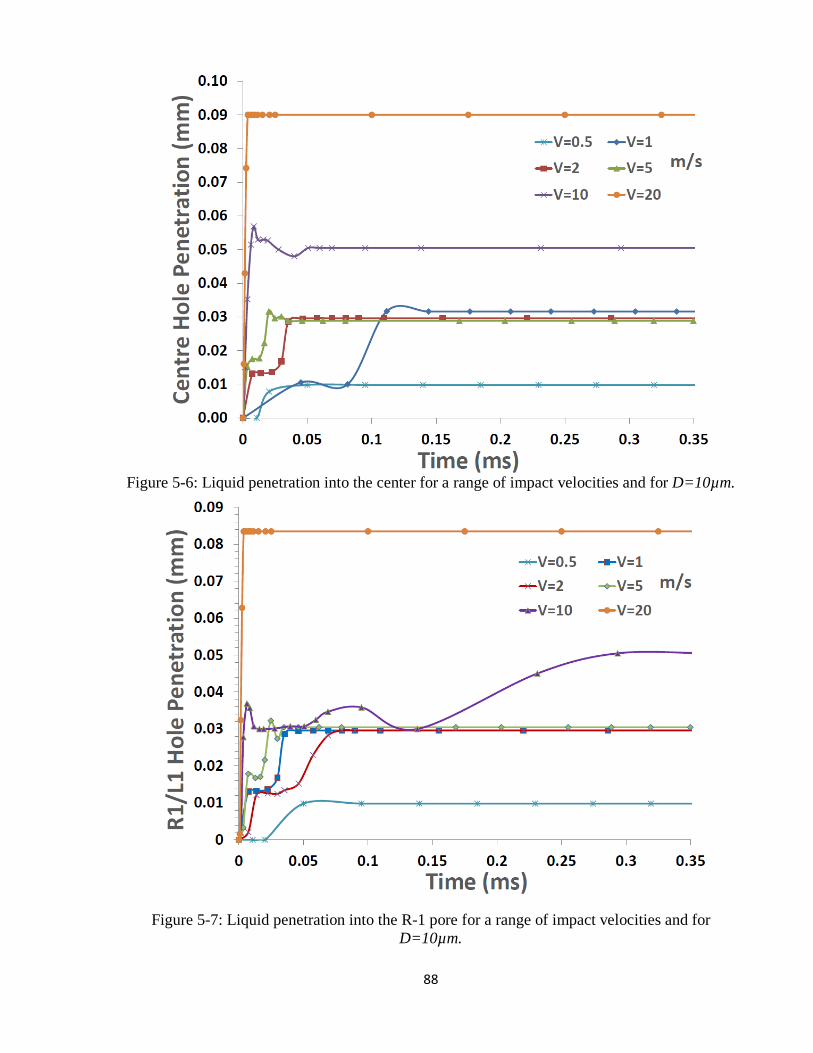
88
Figure 5-6: Liquid penetration into the center for a range of impact velocities and for D=10µm.
Figure 5-7: Liquid penetration into the R-1 pore for a range of impact velocities and for D=10µm.
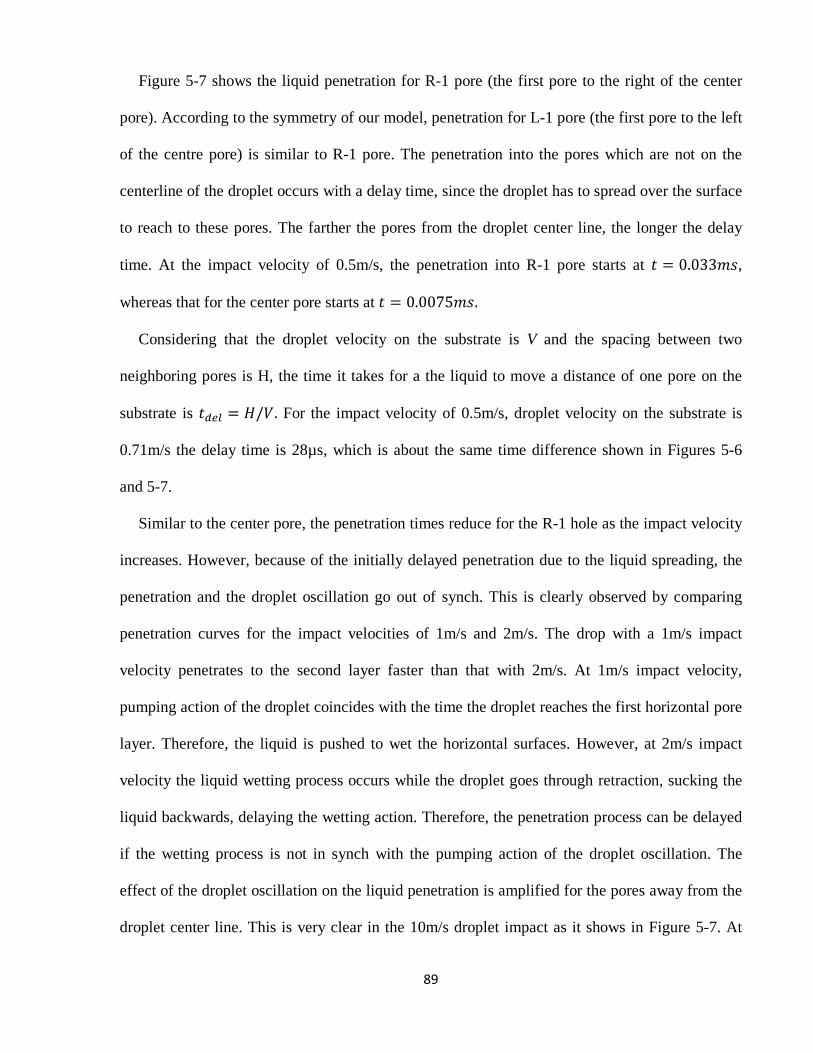
89
Figure 5-7 shows the liquid penetration for R-1 pore (the first pore to the right of the center
pore). According to the symmetry of our model, penetration for L-1 pore (the first pore to the left
of the centre pore) is similar to R-1 pore. The penetration into the pores which are not on the
centerline of the droplet occurs with a delay time, since the droplet has to spread over the surface
to reach to these pores. The farther the pores from the droplet center line, the longer the delay
time. At the impact velocity of 0.5m/s, the penetration into R-1 pore starts at 𝑡 = 0.033𝑚𝑠,
whereas that for the center pore starts at 𝑡 = 0.0075𝑚𝑠.
Considering that the droplet velocity on the substrate is V and the spacing between two
neighboring pores is H, the time it takes for a the liquid to move a distance of one pore on the
substrate is 𝑡𝑑𝑒𝑙 = 𝐻/𝑉. For the impact velocity of 0.5m/s, droplet velocity on the substrate is
0.71m/s the delay time is 28µs, which is about the same time difference shown in Figures 5-6
and 5-7.
Similar to the center pore, the penetration times reduce for the R-1 hole as the impact velocity
increases. However, because of the initially delayed penetration due to the liquid spreading, the
penetration and the droplet oscillation go out of synch. This is clearly observed by comparing
penetration curves for the impact velocities of 1m/s and 2m/s. The drop with a 1m/s impact
velocity penetrates to the second layer faster than that with 2m/s. At 1m/s impact velocity,
pumping action of the droplet coincides with the time the droplet reaches the first horizontal pore
layer. Therefore, the liquid is pushed to wet the horizontal surfaces. However, at 2m/s impact
velocity the liquid wetting process occurs while the droplet goes through retraction, sucking the
liquid backwards, delaying the wetting action. Therefore, the penetration process can be delayed
if the wetting process is not in synch with the pumping action of the droplet oscillation. The
effect of the droplet oscillation on the liquid penetration is amplified for the pores away from the
droplet center line. This is very clear in the 10m/s droplet impact as it shows in Figure 5-7. At
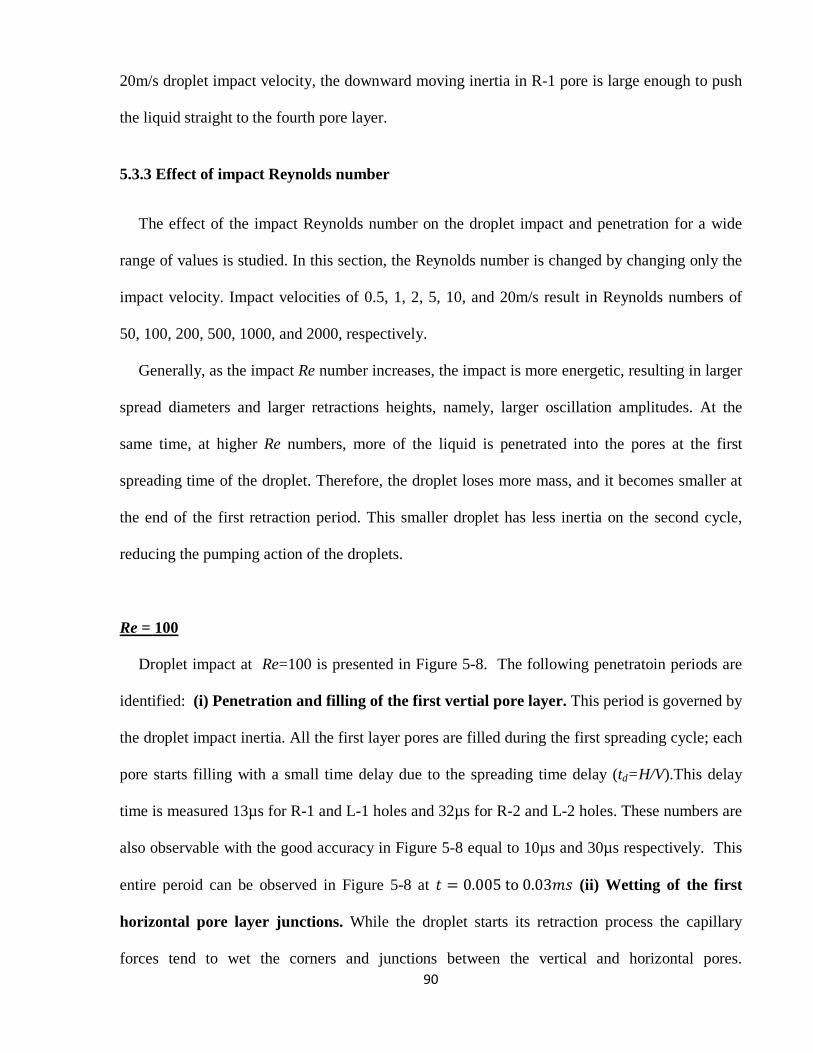
90
20m/s droplet impact velocity, the downward moving inertia in R-1 pore is large enough to push
the liquid straight to the fourth pore layer.
5.3.3 Effect of impact Reynolds number
The effect of the impact Reynolds number on the droplet impact and penetration for a wide
range of values is studied. In this section, the Reynolds number is changed by changing only the
impact velocity. Impact velocities of 0.5, 1, 2, 5, 10, and 20m/s result in Reynolds numbers of
50, 100, 200, 500, 1000, and 2000, respectively.
Generally, as the impact Re number increases, the impact is more energetic, resulting in larger
spread diameters and larger retractions heights, namely, larger oscillation amplitudes. At the
same time, at higher Re numbers, more of the liquid is penetrated into the pores at the first
spreading time of the droplet. Therefore, the droplet loses more mass, and it becomes smaller at
the end of the first retraction period. This smaller droplet has less inertia on the second cycle,
reducing the pumping action of the droplets.
Re = 100
Droplet impact at Re=100 is presented in Figure 5-8. The following penetratoin periods are
identified: (i) Penetration and filling of the first vertial pore layer. This period is governed by
the droplet impact inertia. All the first layer pores are filled during the first spreading cycle; each
pore starts filling with a small time delay due to the spreading time delay (td=H/V).This delay
time is measured 13µs for R-1 and L-1 holes and 32µs for R-2 and L-2 holes. These numbers are
also observable with the good accuracy in Figure 5-8 equal to 10µs and 30µs respectively. This
entire peroid can be observed in Figure 5-8 at 𝑡 = 0.005 to 0.03𝑚𝑠 (ii) Wetting of the first
horizontal pore layer junctions. While the droplet starts its retraction process the capillary
forces tend to wet the corners and junctions between the vertical and horizontal pores.
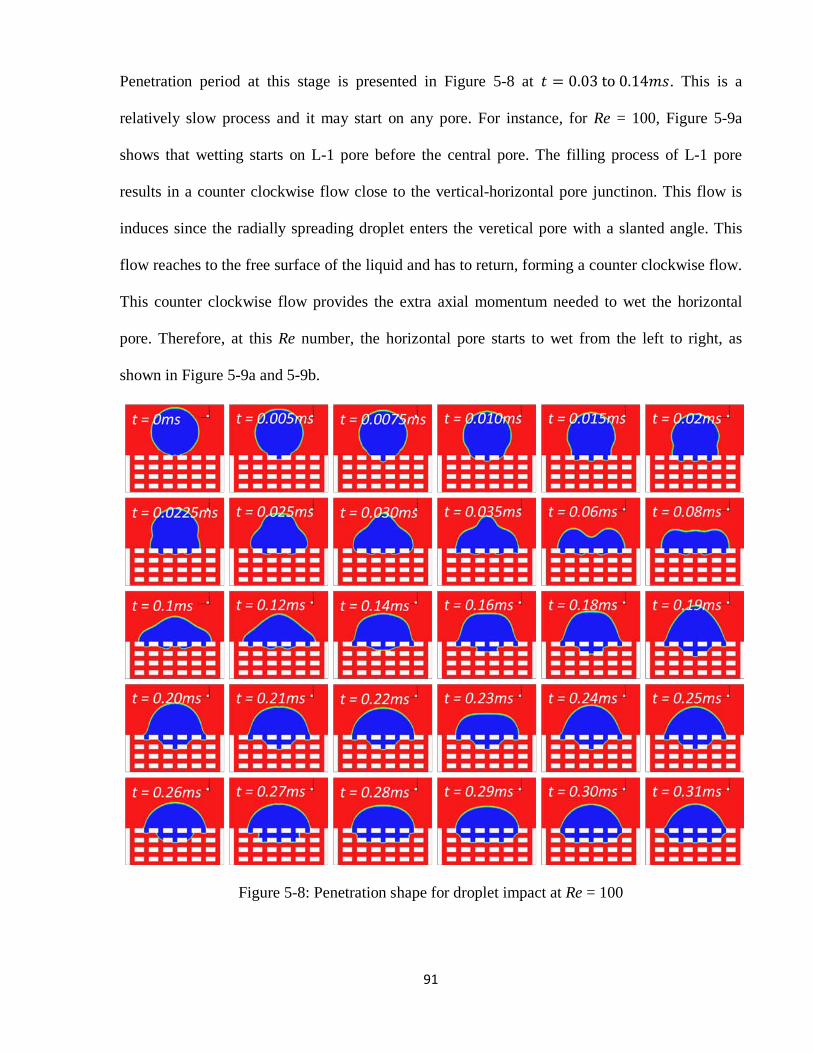
91
Penetration period at this stage is presented in Figure 5-8 at 𝑡 = 0.03 to 0.14𝑚𝑠. This is a
relatively slow process and it may start on any pore. For instance, for Re = 100, Figure 5-9a
shows that wetting starts on L-1 pore before the central pore. The filling process of L-1 pore
results in a counter clockwise flow close to the vertical-horizontal pore junctinon. This flow is
induces since the radially spreading droplet enters the veretical pore with a slanted angle. This
flow reaches to the free surface of the liquid and has to return, forming a counter clockwise flow.
This counter clockwise flow provides the extra axial momentum needed to wet the horizontal
pore. Therefore, at this Re number, the horizontal pore starts to wet from the left to right, as
shown in Figure 5-9a and 5-9b.
Figure 5-8: Penetration shape for droplet impact at Re = 100
92
(a) - 𝑡 = 0.0225𝑚𝑠
(b) - 𝑡 = 0.035𝑚𝑠
(c) - 𝑡 = 0.12𝑚𝑠
Figure 5-9: Liquid front wetting of the horizontal pore beneath central and L-1 pores for Re =
100
The same physcis of wetting happens at R-1 hole from right to left, therefore, wetting of the
first horizontal pore layer starts out of centre hole. (iii) Filling of the horizontal pores. Once the
liquid wets the corners, the capillary action tends to fill the horizontal pores. If this action is
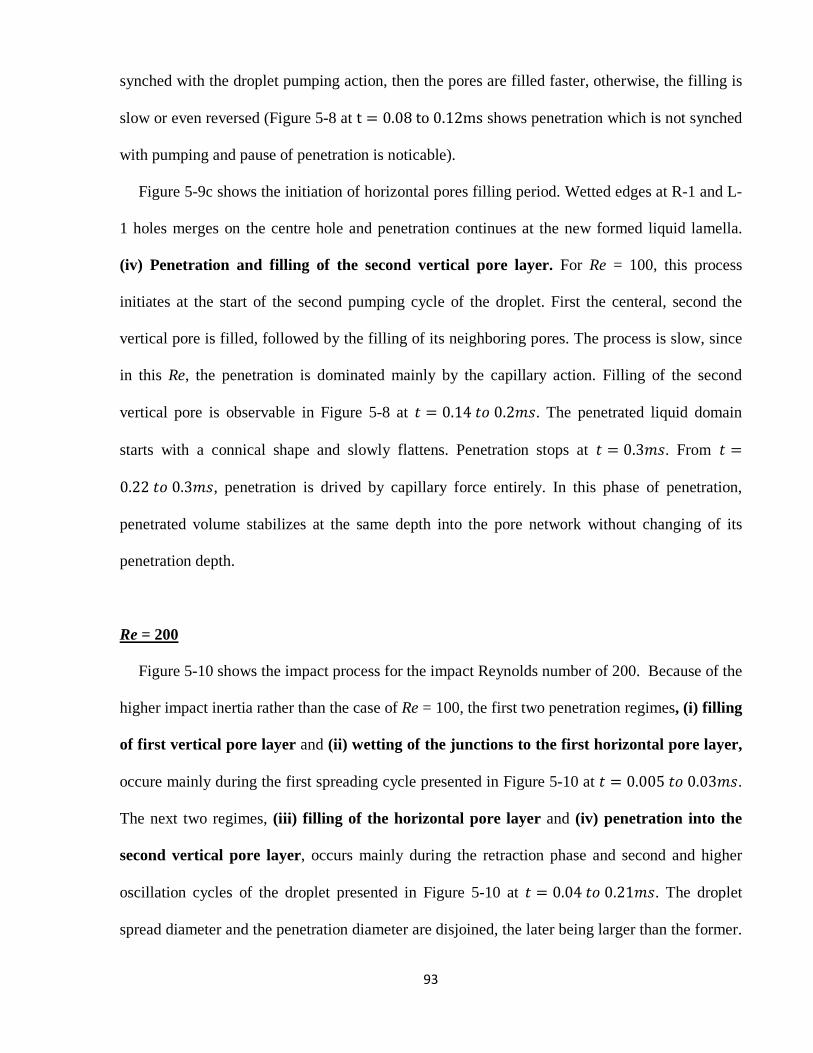
93
synched with the droplet pumping action, then the pores are filled faster, otherwise, the filling is
slow or even reversed (Figure 5-8 at t = 0.08 to 0.12ms shows penetration which is not synched
with pumping and pause of penetration is noticable).
Figure 5-9c shows the initiation of horizontal pores filling period. Wetted edges at R-1 and L-
1 holes merges on the centre hole and penetration continues at the new formed liquid lamella.
(iv) Penetration and filling of the second vertical pore layer. For Re = 100, this process
initiates at the start of the second pumping cycle of the droplet. First the centeral, second the
vertical pore is filled, followed by the filling of its neighboring pores. The process is slow, since
in this Re, the penetration is dominated mainly by the capillary action. Filling of the second
vertical pore is observable in Figure 5-8 at 𝑡 = 0.14 𝑡𝑜 0.2𝑚𝑠. The penetrated liquid domain
starts with a connical shape and slowly flattens. Penetration stops at 𝑡 = 0.3𝑚𝑠. From 𝑡 =
0.22 𝑡𝑜 0.3𝑚𝑠, penetration is drived by capillary force entirely. In this phase of penetration,
penetrated volume stabilizes at the same depth into the pore network without changing of its
penetration depth.
Re = 200
Figure 5-10 shows the impact process for the impact Reynolds number of 200. Because of the
higher impact inertia rather than the case of Re = 100, the first two penetration regimes, (i) filling
of first vertical pore layer and (ii) wetting of the junctions to the first horizontal pore layer,
occure mainly during the first spreading cycle presented in Figure 5-10 at 𝑡 = 0.005 𝑡𝑜 0.03𝑚𝑠.
The next two regimes, (iii) filling of the horizontal pore layer and (iv) penetration into the
second vertical pore layer, occurs mainly during the retraction phase and second and higher
oscillation cycles of the droplet presented in Figure 5-10 at 𝑡 = 0.04 𝑡𝑜 0.21𝑚𝑠. The droplet
spread diameter and the penetration diameter are disjoined, the later being larger than the former.
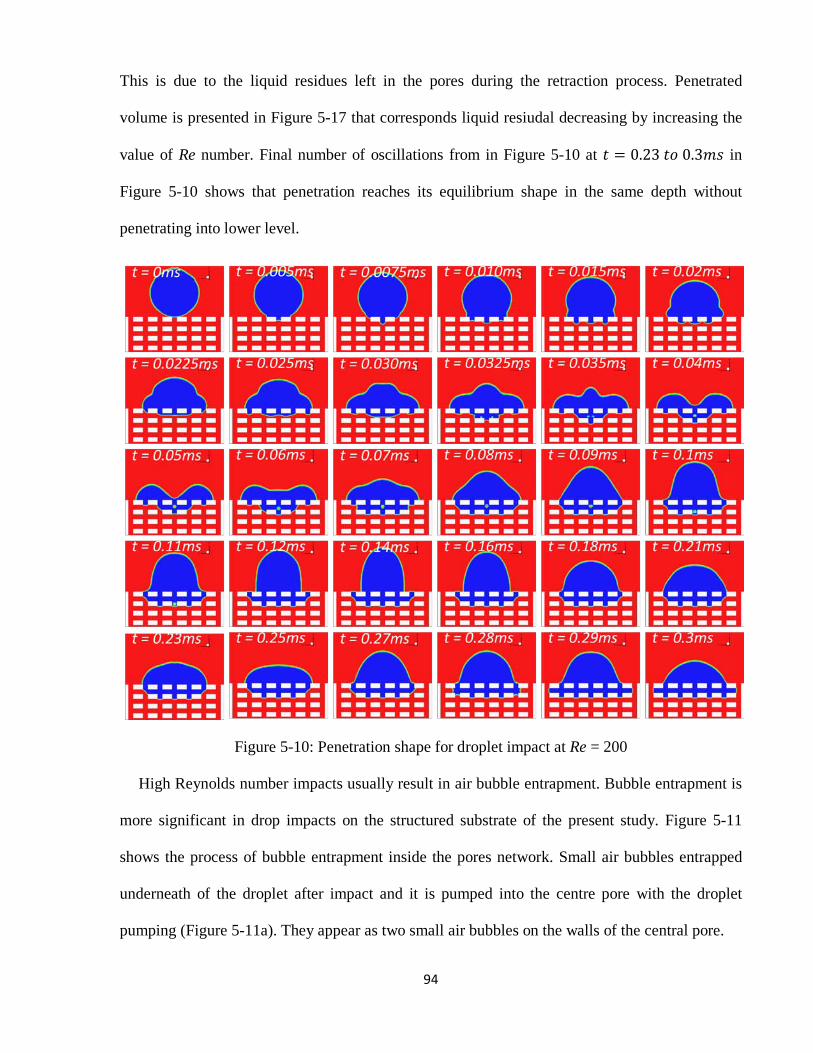
94
This is due to the liquid residues left in the pores during the retraction process. Penetrated
volume is presented in Figure 5-17 that corresponds liquid resiudal decreasing by increasing the
value of Re number. Final number of oscillations from in Figure 5-10 at 𝑡 = 0.23 𝑡𝑜 0.3𝑚𝑠 in
Figure 5-10 shows that penetration reaches its equilibrium shape in the same depth without
penetrating into lower level.
Figure 5-10: Penetration shape for droplet impact at Re = 200
High Reynolds number impacts usually result in air bubble entrapment. Bubble entrapment is
more significant in drop impacts on the structured substrate of the present study. Figure 5-11
shows the process of bubble entrapment inside the pores network. Small air bubbles entrapped
underneath of the droplet after impact and it is pumped into the centre pore with the droplet
pumping (Figure 5-11a). They appear as two small air bubbles on the walls of the central pore.
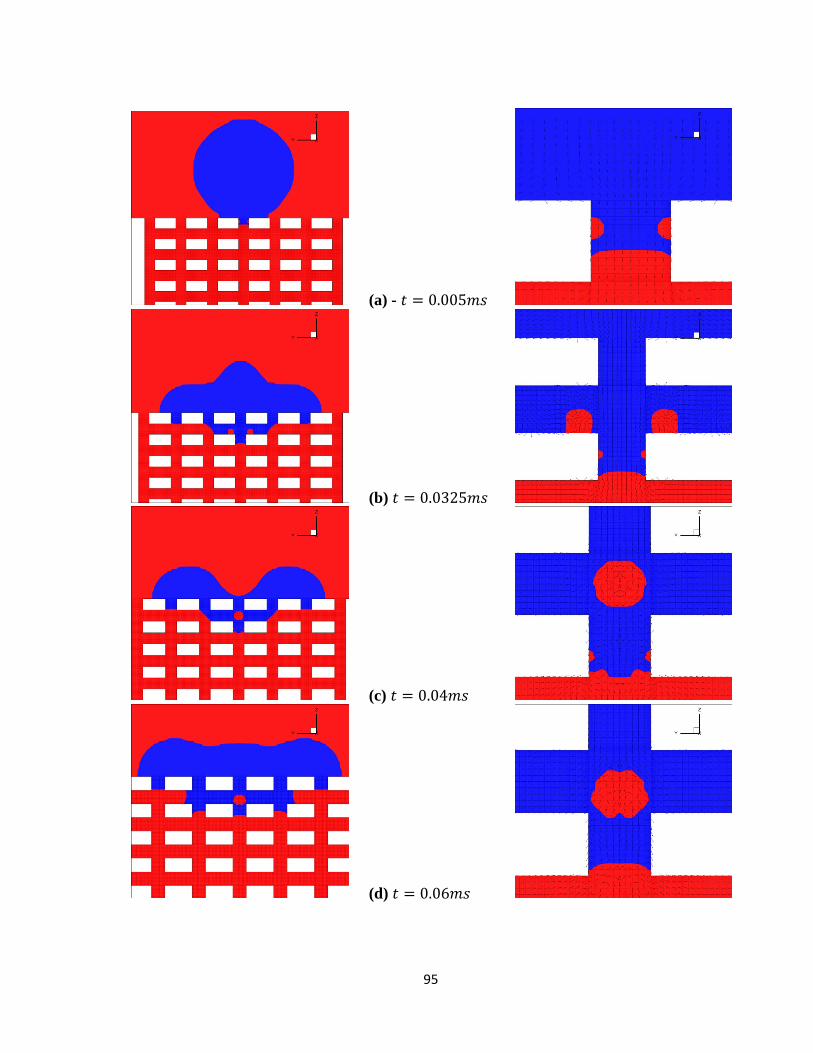
95
(a) - 𝑡 = 0.005𝑚𝑠
(b) 𝑡 = 0.0325𝑚𝑠
(c) 𝑡 = 0.04𝑚𝑠
(d) 𝑡 = 0.06𝑚𝑠
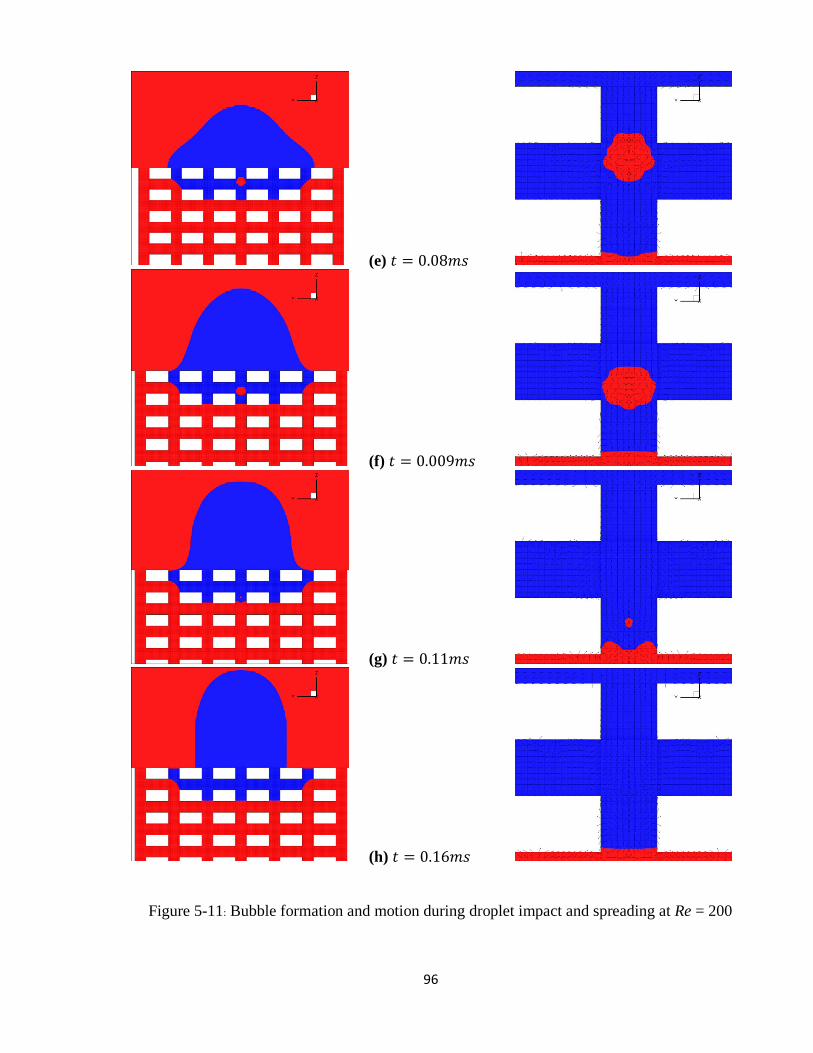
96
(e) 𝑡 = 0.08𝑚𝑠
(f) 𝑡 = 0.009𝑚𝑠
(g) 𝑡 = 0.11𝑚𝑠
(h) 𝑡 = 0.16𝑚𝑠
Figure 5-11: Bubble formation and motion during droplet impact and spreading at Re = 200
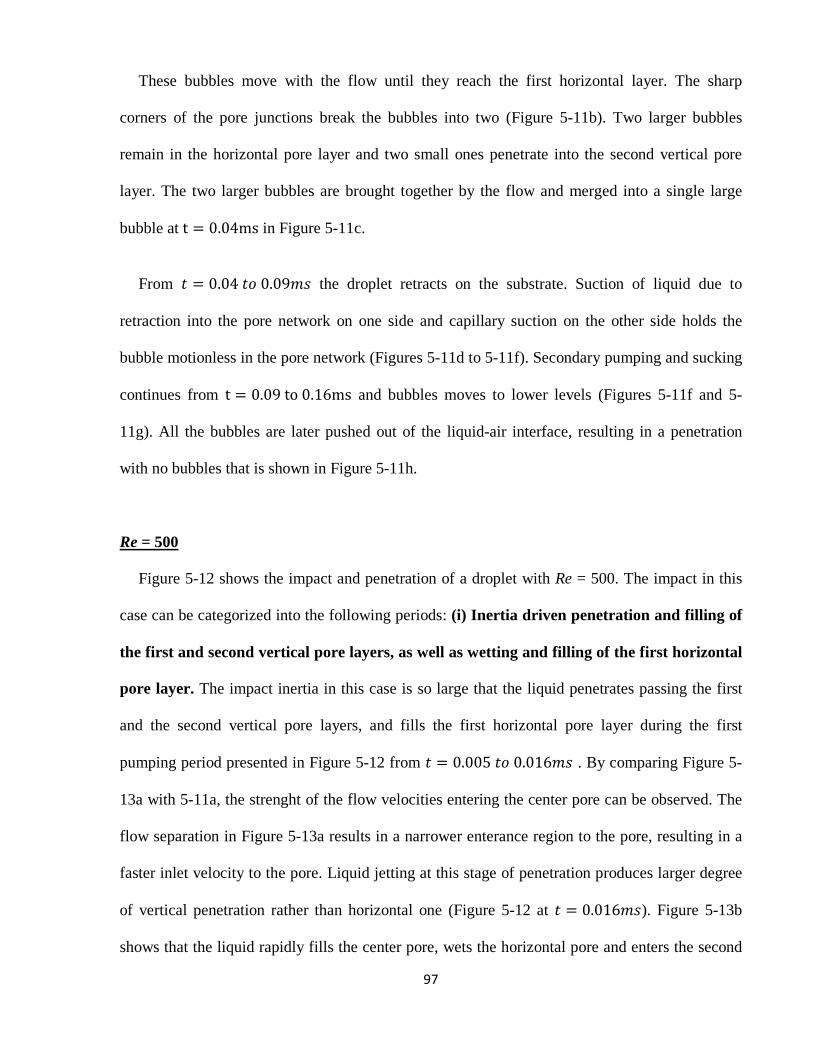
97
These bubbles move with the flow until they reach the first horizontal layer. The sharp
corners of the pore junctions break the bubbles into two (Figure 5-11b). Two larger bubbles
remain in the horizontal pore layer and two small ones penetrate into the second vertical pore
layer. The two larger bubbles are brought together by the flow and merged into a single large
bubble at t = 0.04ms in Figure 5-11c.
From 𝑡 = 0.04 𝑡𝑜 0.09𝑚𝑠 the droplet retracts on the substrate. Suction of liquid due to
retraction into the pore network on one side and capillary suction on the other side holds the
bubble motionless in the pore network (Figures 5-11d to 5-11f). Secondary pumping and sucking
continues from t = 0.09 to 0.16ms and bubbles moves to lower levels (Figures 5-11f and 5-
11g). All the bubbles are later pushed out of the liquid-air interface, resulting in a penetration
with no bubbles that is shown in Figure 5-11h.
Re = 500
Figure 5-12 shows the impact and penetration of a droplet with Re = 500. The impact in this
case can be categorized into the following periods: (i) Inertia driven penetration and filling of
the first and second vertical pore layers, as well as wetting and filling of the first horizontal
pore layer. The impact inertia in this case is so large that the liquid penetrates passing the first
and the second vertical pore layers, and fills the first horizontal pore layer during the first
pumping period presented in Figure 5-12 from 𝑡 = 0.005 𝑡𝑜 0.016𝑚𝑠 . By comparing Figure 5-
13a with 5-11a, the strenght of the flow velocities entering the center pore can be observed. The
flow separation in Figure 5-13a results in a narrower enterance region to the pore, resulting in a
faster inlet velocity to the pore. Liquid jetting at this stage of penetration produces larger degree
of vertical penetration rather than horizontal one (Figure 5-12 at 𝑡 = 0.016𝑚𝑠). Figure 5-13b
shows that the liquid rapidly fills the center pore, wets the horizontal pore and enters the second
98
vertical pore layer. In the mean time, R-1 and L-1 pores are also filled with a small delay. The
liquids from the center pore, as well as R-1 and L-1 pores enters the horizontal pore and merge
with each other (Figure 5-13c). The inertia driven penetration is completed at the end of the first
droplet spreading period. There is not much internal fluid movement during the retraction period
of the droplet, and the penetration remains substatially the same as what it have come to at the
end of the spreading period as it is shown in Figure 5-12 from 𝑡 = 0.018 𝑡𝑜 0.15𝑚𝑠. At this
Reynollds number the liquid remains at the second vertical pore layer. After this stage liquid
oscillates on top of the substrate but penetrated volume only stabilizes into the pore network
rather than penetrated into the lower level (Figure 5-12 from 𝑡 = 0.16 𝑡𝑜 0.25𝑚𝑠). Figure 5-17
shows penetrated volume ratio to the initial droplet volume that is 30% for Re = 500 rather than
22% and 19% for Re = 200 and Re = 100 respectively. The more the penetrated volume
achieves, the samller the power of pumping of dropler left on top of the surface transfers into the
pore network. Penetration intpo the second vertical layer for Re = 500 as well as Re = 200
corresponds the flattened behavior of penetrated volume ratio in Figure 5-17 between these two
values of Reynolds number.
99
Figure 5-12: Penetration shape for droplet impact at Re = 500
Bubble entrapment processes are shown in magnified images of Figure 5-13. Bubble entraps
at two different stages at this Reynolds number. (i) Initial bubble entrapment during liquid
jetting period. Small bubbles are pulled into the pore network during the pumping phase. Large
degree of inertia of impact at Re = 500 represents jetting penetration while pumping phase.
(Figure 5-13a to Figure 5-13e).
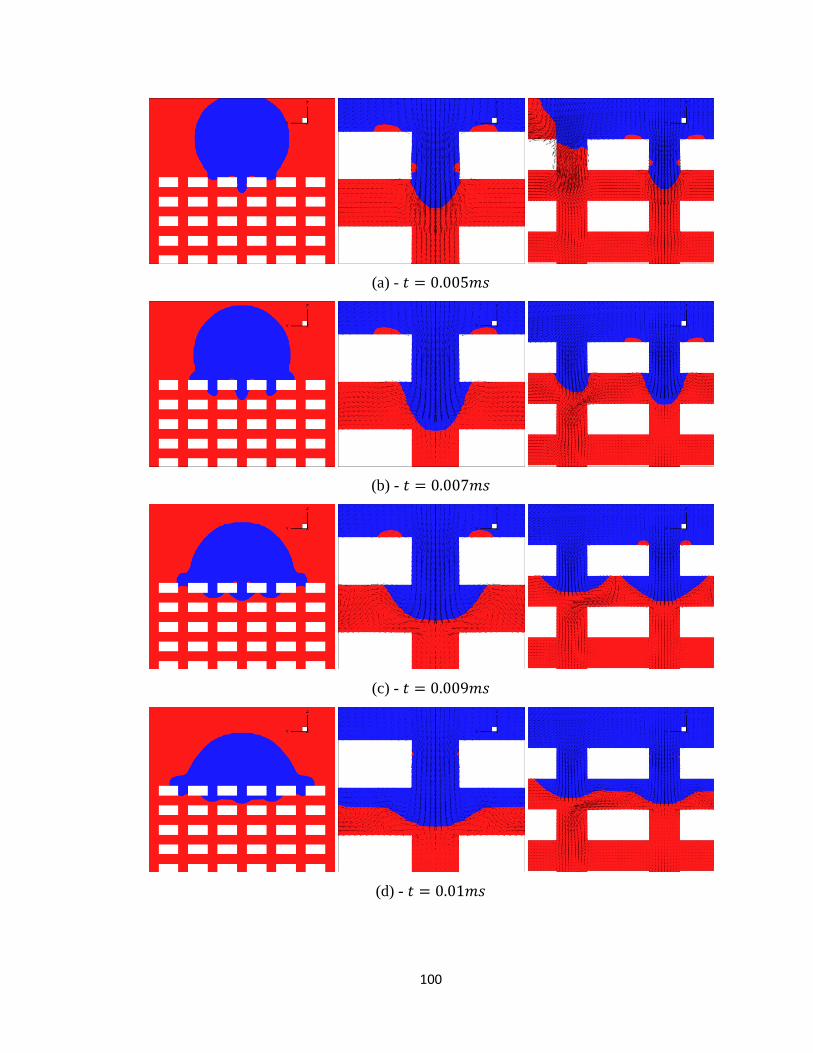
100
(a) - 𝑡 = 0.005𝑚𝑠
(b) - 𝑡 = 0.007𝑚𝑠
(c) - 𝑡 = 0.009𝑚𝑠
(d) - 𝑡 = 0.01𝑚𝑠
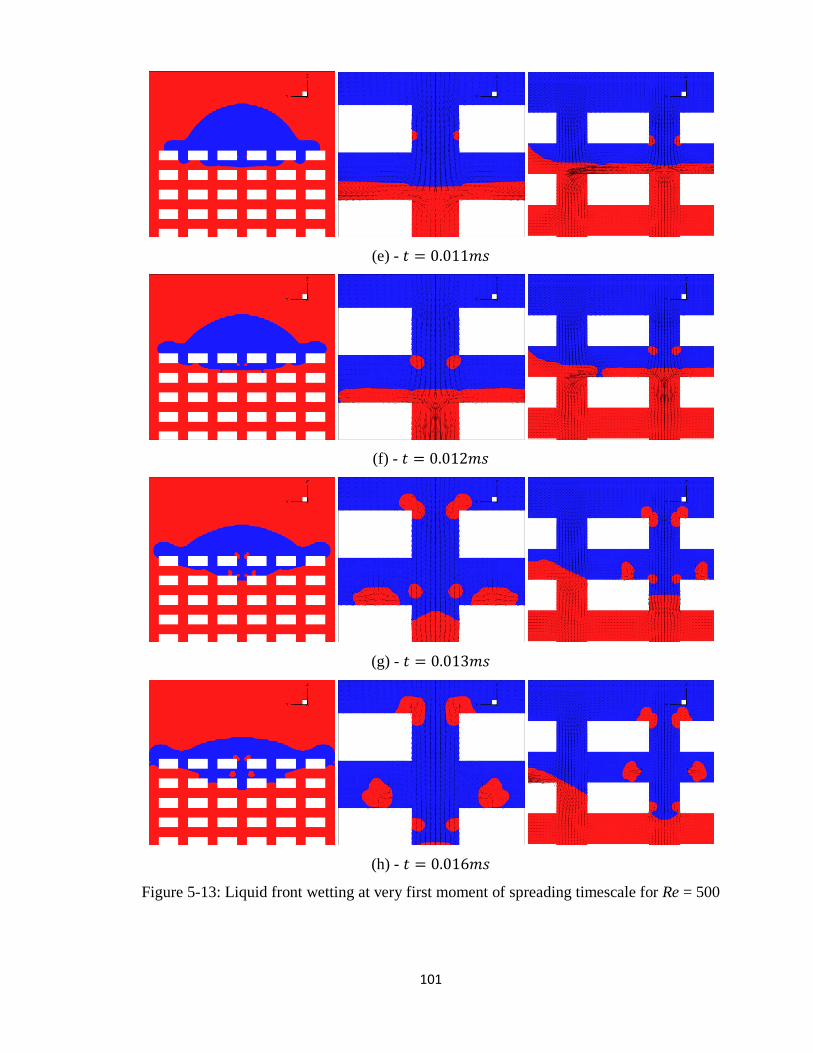
101
(e) - 𝑡 = 0.011𝑚𝑠
(f) - 𝑡 = 0.012𝑚𝑠
(g) - 𝑡 = 0.013𝑚𝑠
(h) - 𝑡 = 0.016𝑚𝑠
Figure 5-13: Liquid front wetting at very first moment of spreading timescale for Re = 500
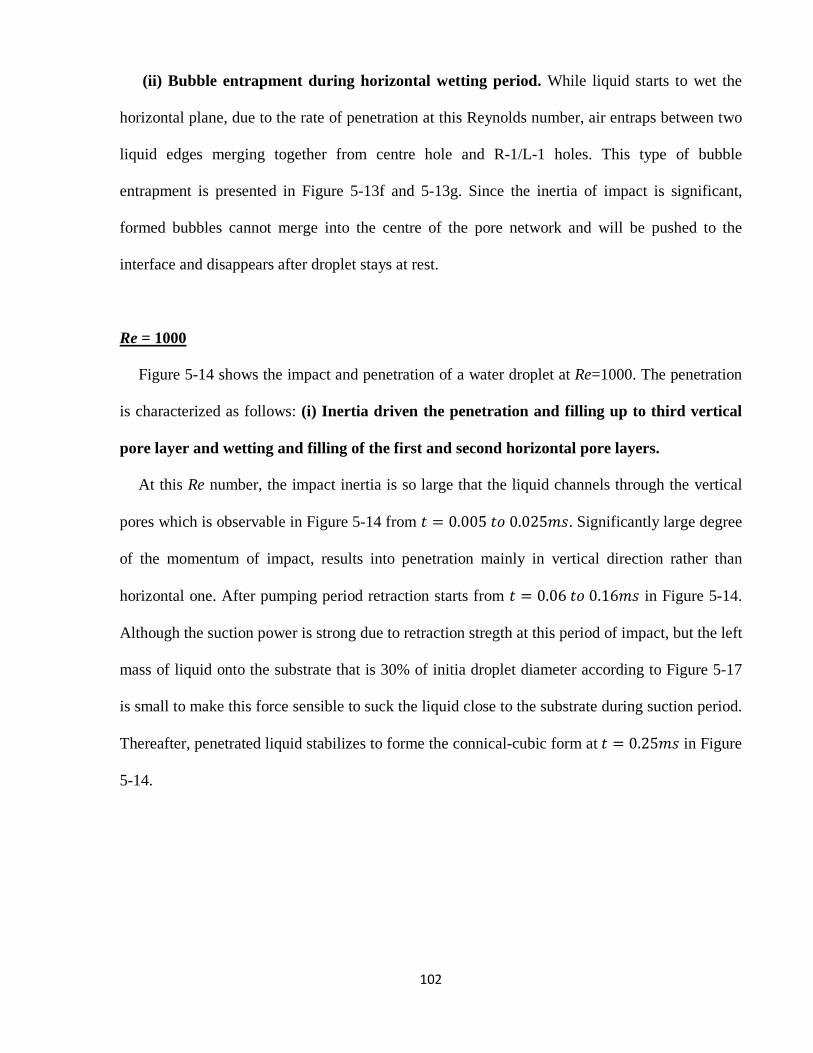
102
(ii) Bubble entrapment during horizontal wetting period. While liquid starts to wet the
horizontal plane, due to the rate of penetration at this Reynolds number, air entraps between two
liquid edges merging together from centre hole and R-1/L-1 holes. This type of bubble
entrapment is presented in Figure 5-13f and 5-13g. Since the inertia of impact is significant,
formed bubbles cannot merge into the centre of the pore network and will be pushed to the
interface and disappears after droplet stays at rest.
Re = 1000
Figure 5-14 shows the impact and penetration of a water droplet at Re=1000. The penetration
is characterized as follows: (i) Inertia driven the penetration and filling up to third vertical
pore layer and wetting and filling of the first and second horizontal pore layers.
At this Re number, the impact inertia is so large that the liquid channels through the vertical
pores which is observable in Figure 5-14 from 𝑡 = 0.005 𝑡𝑜 0.025𝑚𝑠. Significantly large degree
of the momentum of impact, results into penetration mainly in vertical direction rather than
horizontal one. After pumping period retraction starts from 𝑡 = 0.06 𝑡𝑜 0.16𝑚𝑠 in Figure 5-14.
Although the suction power is strong due to retraction stregth at this period of impact, but the left
mass of liquid onto the substrate that is 30% of initia droplet diameter according to Figure 5-17
is small to make this force sensible to suck the liquid close to the substrate during suction period.
Thereafter, penetrated liquid stabilizes to forme the connical-cubic form at 𝑡 = 0.25𝑚𝑠 in Figure
5-14.
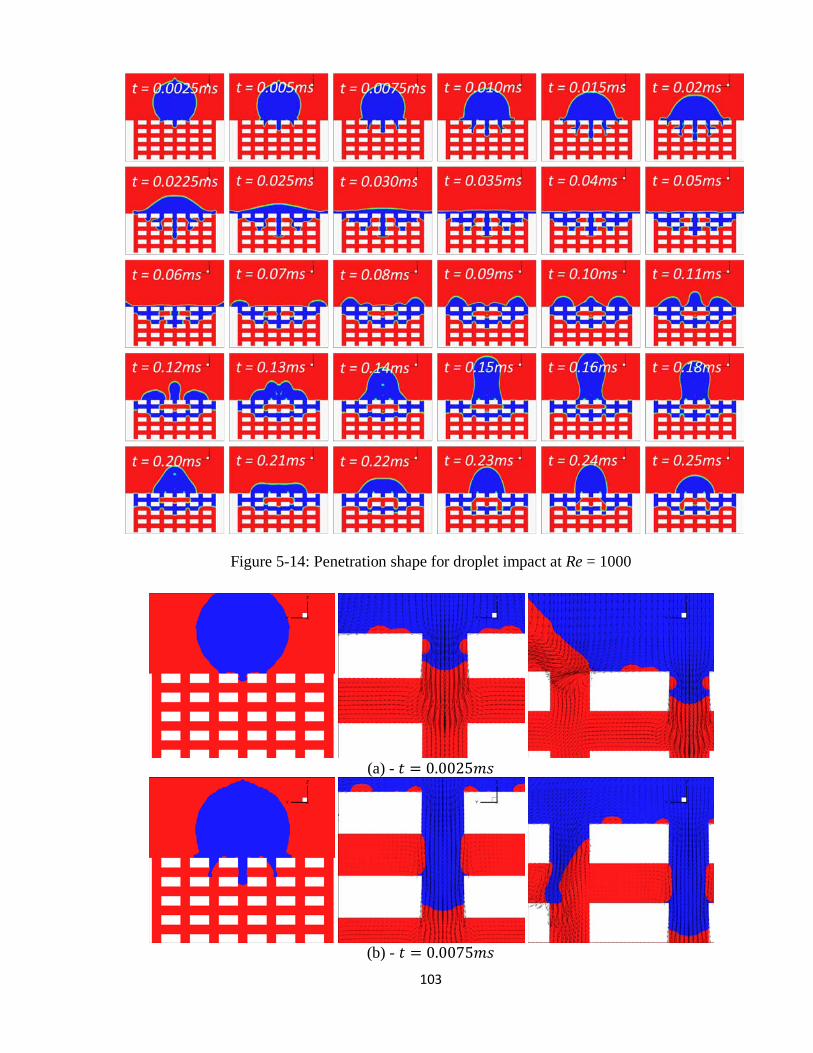
103
Figure 5-14: Penetration shape for droplet impact at Re = 1000
(a) - 𝑡 = 0.0025𝑚𝑠
(b) - 𝑡 = 0.0075𝑚𝑠
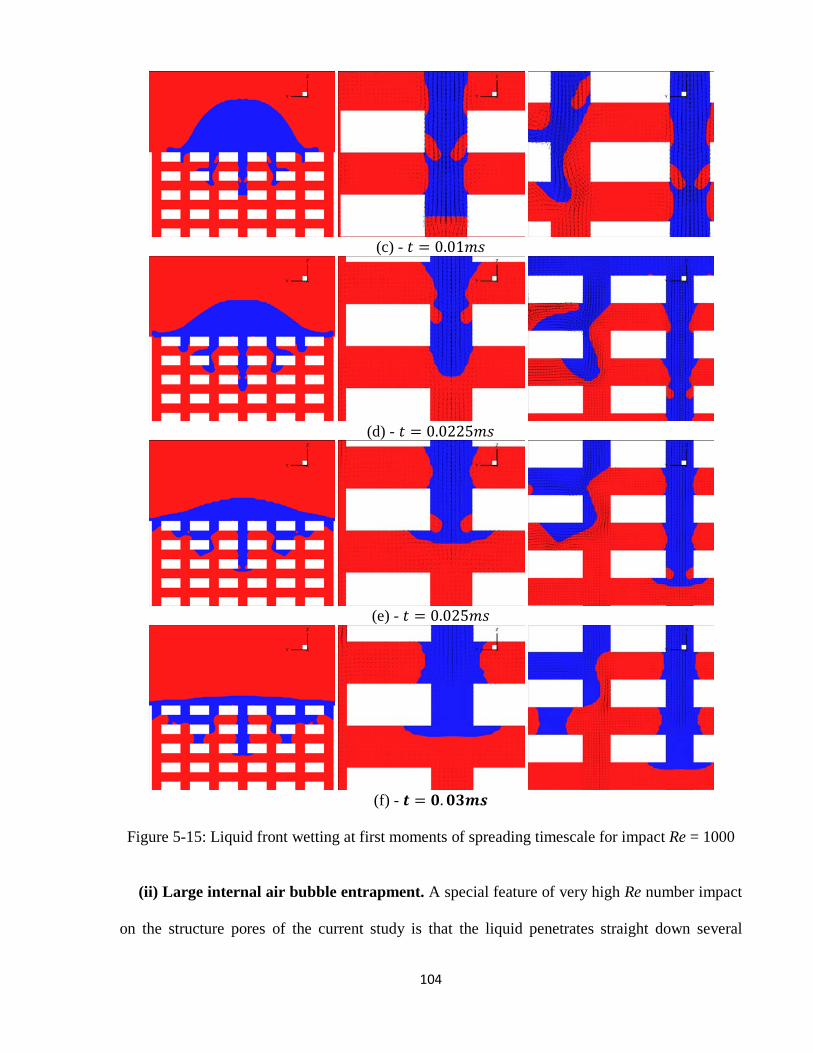
104
(c) - 𝑡 = 0.01𝑚𝑠
(d) - 𝑡 = 0.0225𝑚𝑠
(e) - 𝑡 = 0.025𝑚𝑠
(f) - 𝒕 = 𝟎.𝟎𝟑𝒎𝒔
Figure 5-15: Liquid front wetting at first moments of spreading timescale for impact Re = 1000
(ii) Large internal air bubble entrapment. A special feature of very high Re number impact
on the structure pores of the current study is that the liquid penetrates straight down several
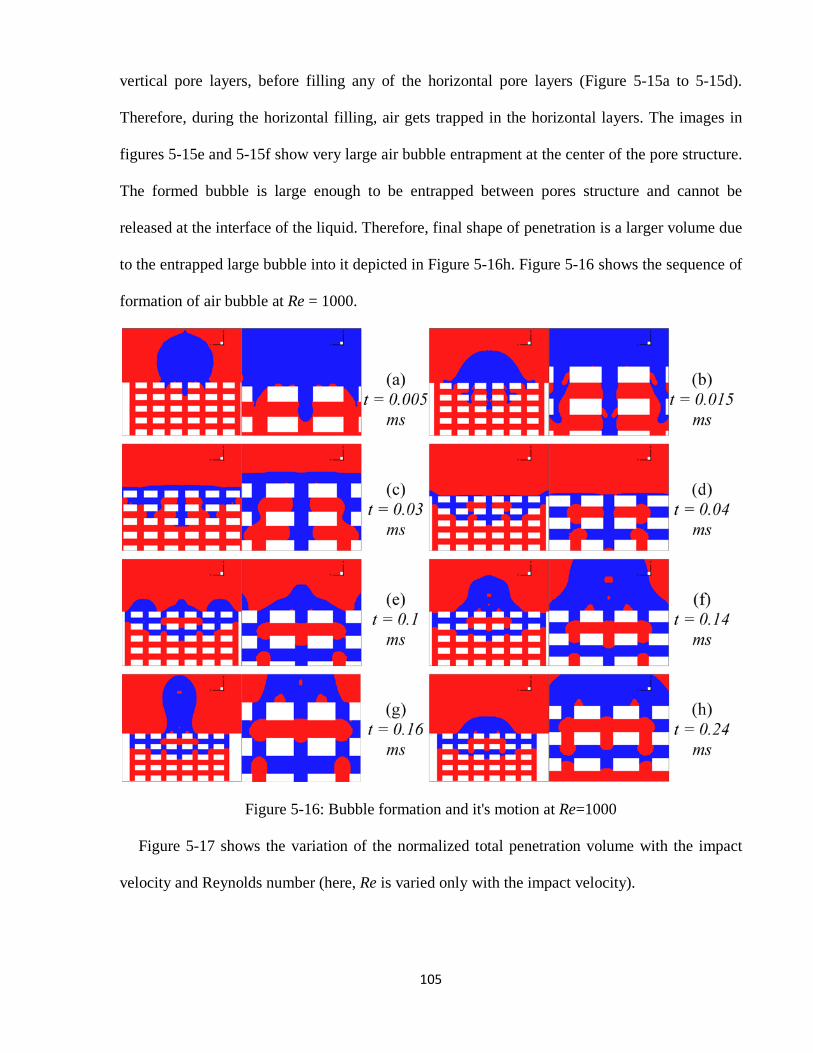
105
vertical pore layers, before filling any of the horizontal pore layers (Figure 5-15a to 5-15d).
Therefore, during the horizontal filling, air gets trapped in the horizontal layers. The images in
figures 5-15e and 5-15f show very large air bubble entrapment at the center of the pore structure.
The formed bubble is large enough to be entrapped between pores structure and cannot be
released at the interface of the liquid. Therefore, final shape of penetration is a larger volume due
to the entrapped large bubble into it depicted in Figure 5-16h. Figure 5-16 shows the sequence of
formation of air bubble at Re = 1000.
Figure 5-16: Bubble formation and it's motion at Re=1000
Figure 5-17 shows the variation of the normalized total penetration volume with the impact
velocity and Reynolds number (here, Re is varied only with the impact velocity).
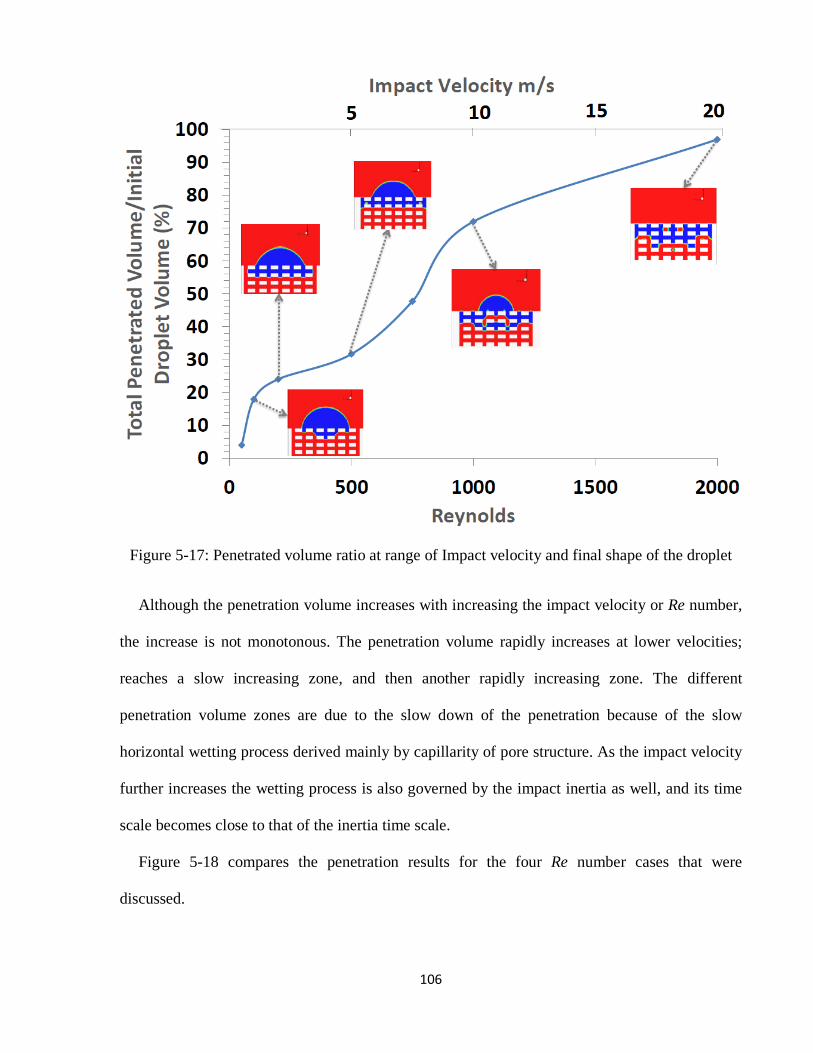
106
Figure 5-17: Penetrated volume ratio at range of Impact velocity and final shape of the droplet
Although the penetration volume increases with increasing the impact velocity or Re number,
the increase is not monotonous. The penetration volume rapidly increases at lower velocities;
reaches a slow increasing zone, and then another rapidly increasing zone. The different
penetration volume zones are due to the slow down of the penetration because of the slow
horizontal wetting process derived mainly by capillarity of pore structure. As the impact velocity
further increases the wetting process is also governed by the impact inertia as well, and its time
scale becomes close to that of the inertia time scale.
Figure 5-18 compares the penetration results for the four Re number cases that were
discussed.
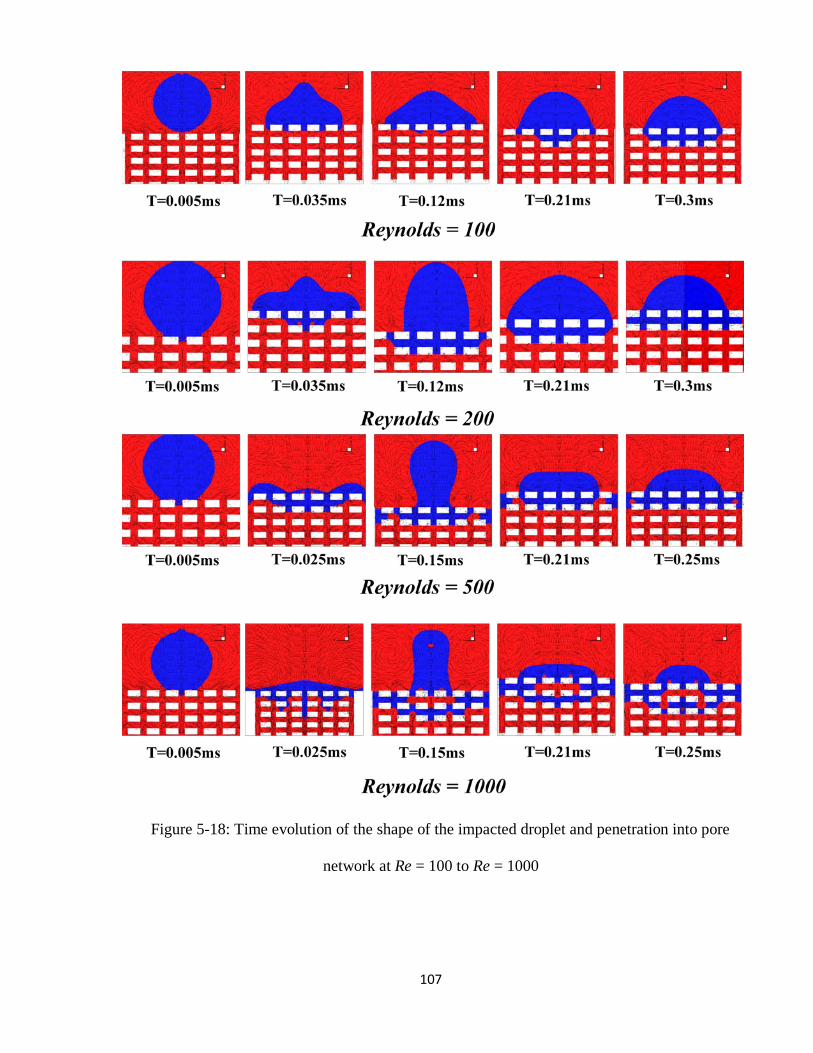
107
Figure 5-18: Time evolution of the shape of the impacted droplet and penetration into pore
network at Re = 100 to Re = 1000
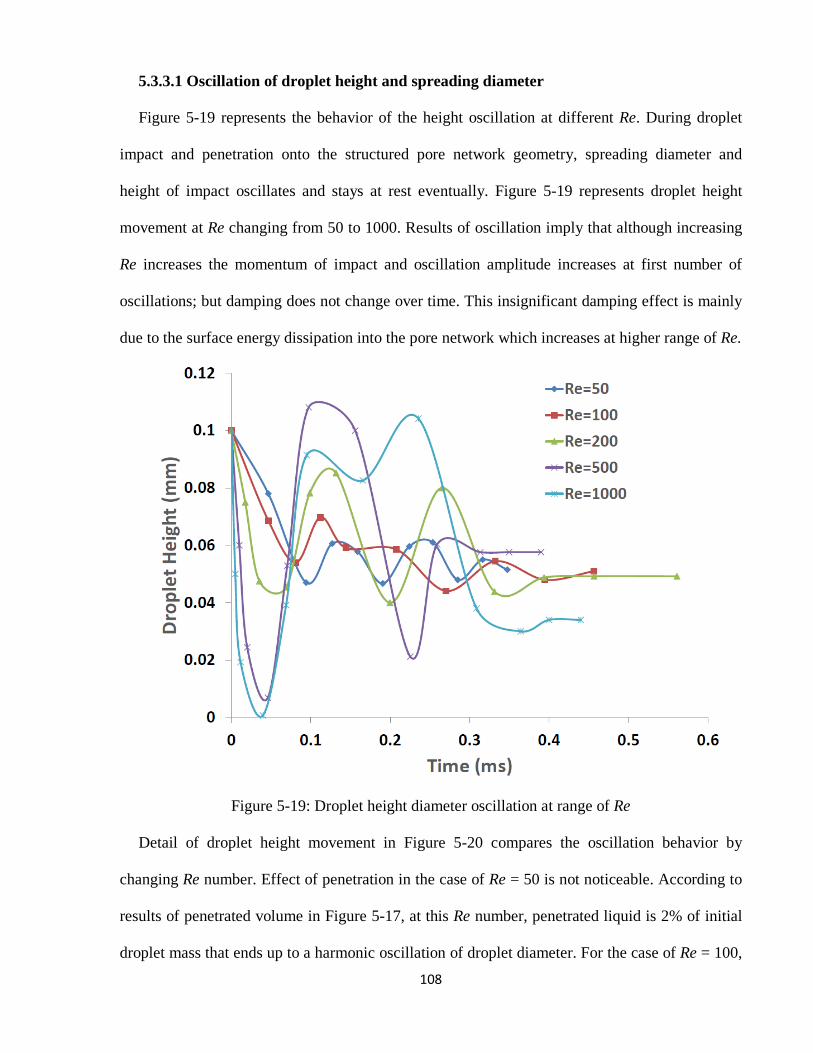
108
5.3.3.1 Oscillation of droplet height and spreading diameter
Figure 5-19 represents the behavior of the height oscillation at different Re. During droplet
impact and penetration onto the structured pore network geometry, spreading diameter and
height of impact oscillates and stays at rest eventually. Figure 5-19 represents droplet height
movement at Re changing from 50 to 1000. Results of oscillation imply that although increasing
Re increases the momentum of impact and oscillation amplitude increases at first number of
oscillations; but damping does not change over time. This insignificant damping effect is mainly
due to the surface energy dissipation into the pore network which increases at higher range of Re.
Figure 5-19: Droplet height diameter oscillation at range of Re
Detail of droplet height movement in Figure 5-20 compares the oscillation behavior by
changing Re number. Effect of penetration in the case of Re = 50 is not noticeable. According to
results of penetrated volume in Figure 5-17, at this Re number, penetrated liquid is 2% of initial
droplet mass that ends up to a harmonic oscillation of droplet diameter. For the case of Re = 100,
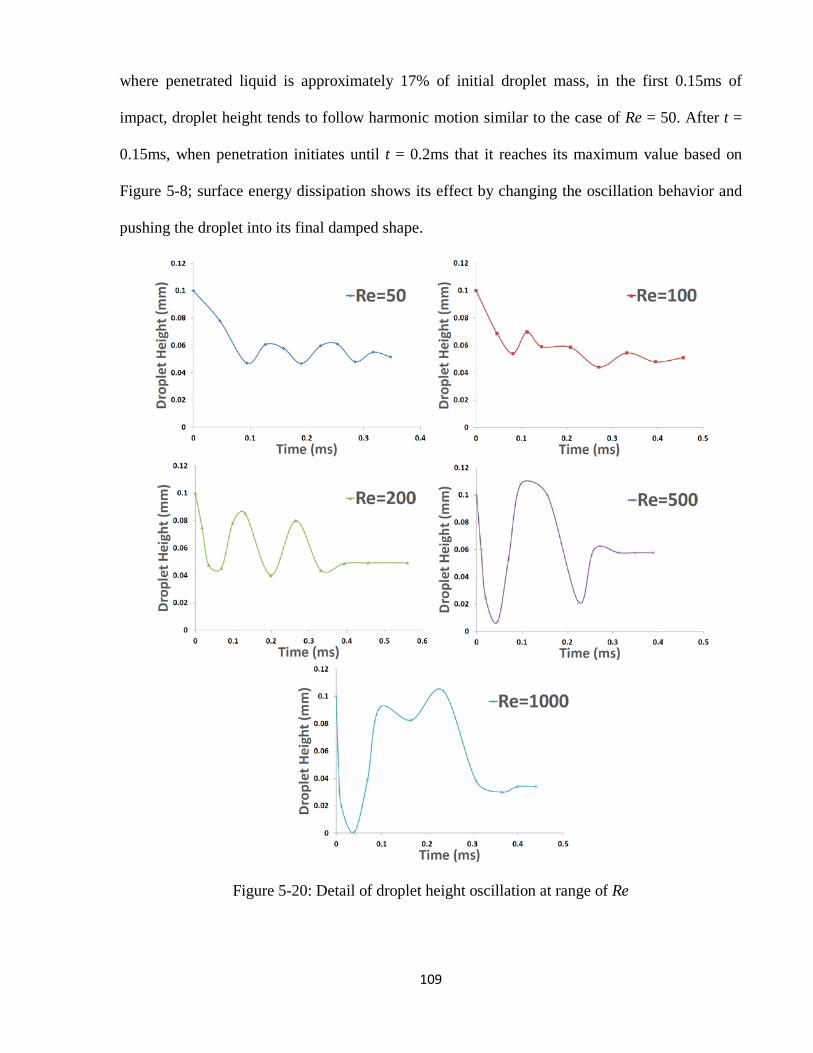
109
where penetrated liquid is approximately 17% of initial droplet mass, in the first 0.15ms of
impact, droplet height tends to follow harmonic motion similar to the case of Re = 50. After t =
0.15ms, when penetration initiates until t = 0.2ms that it reaches its maximum value based on
Figure 5-8; surface energy dissipation shows its effect by changing the oscillation behavior and
pushing the droplet into its final damped shape.
Figure 5-20: Detail of droplet height oscillation at range of Re
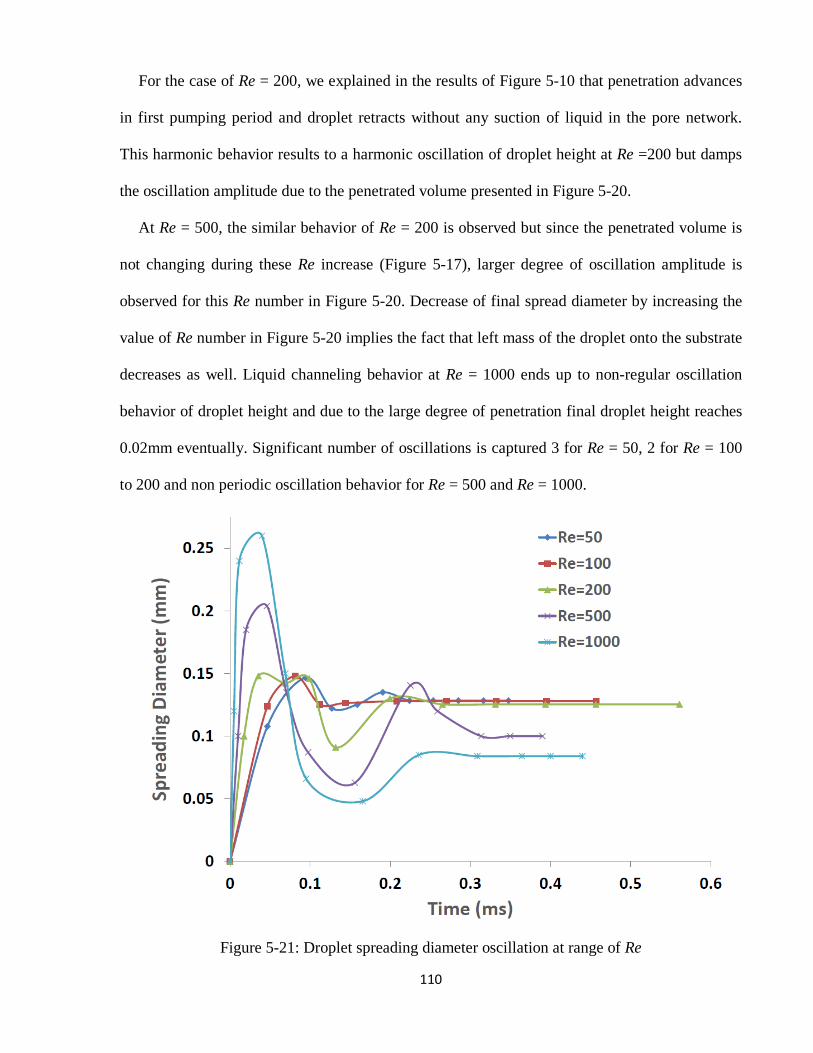
110
For the case of Re = 200, we explained in the results of Figure 5-10 that penetration advances
in first pumping period and droplet retracts without any suction of liquid in the pore network.
This harmonic behavior results to a harmonic oscillation of droplet height at Re =200 but damps
the oscillation amplitude due to the penetrated volume presented in Figure 5-20.
At Re = 500, the similar behavior of Re = 200 is observed but since the penetrated volume is
not changing during these Re increase (Figure 5-17), larger degree of oscillation amplitude is
observed for this Re number in Figure 5-20. Decrease of final spread diameter by increasing the
value of Re number in Figure 5-20 implies the fact that left mass of the droplet onto the substrate
decreases as well. Liquid channeling behavior at Re = 1000 ends up to non-regular oscillation
behavior of droplet height and due to the large degree of penetration final droplet height reaches
0.02mm eventually. Significant number of oscillations is captured 3 for Re = 50, 2 for Re = 100
to 200 and non periodic oscillation behavior for Re = 500 and Re = 1000.
Figure 5-21: Droplet spreading diameter oscillation at range of Re
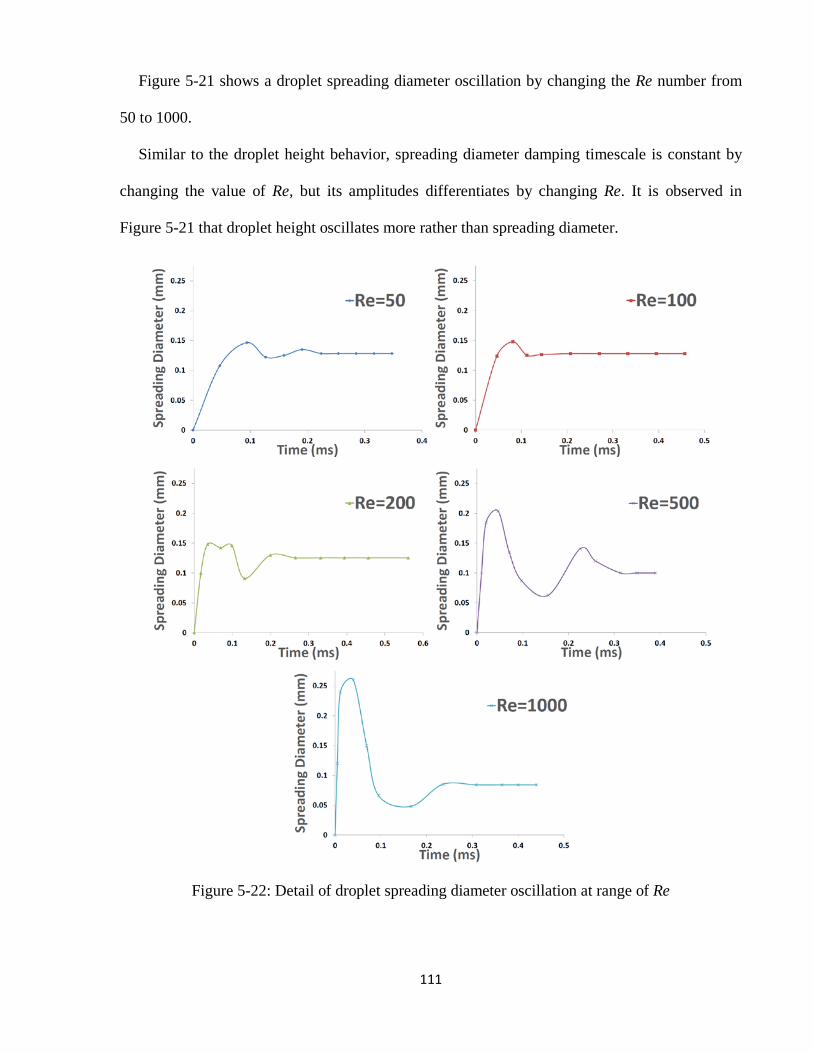
111
Figure 5-21 shows a droplet spreading diameter oscillation by changing the Re number from
50 to 1000.
Similar to the droplet height behavior, spreading diameter damping timescale is constant by
changing the value of Re, but its amplitudes differentiates by changing Re. It is observed in
Figure 5-21 that droplet height oscillates more rather than spreading diameter.
Figure 5-22: Detail of droplet spreading diameter oscillation at range of Re
112
At Re = 1000, we can see that droplet height oscillates to minimum of zero which means that
it touches the substrate as well nut the spreading diameter oscillates to minimum of 0.05mm.
According to the penetrated volume of the liquid droplet into the substrate, droplet spreading
diameter when it is at rest damps at lower value by increasing the Re.
Detailed results of droplet spreading diameter oscillation in Figure 5-22 represents oscillation
amplitude damps by increasing the value of Re number similar to droplet height oscillation.
Since pumping and suction are in a vertical direction rather than axial one, droplet spreading
oscillation behavior is lower in amplitude and number in compare with height oscillation in
Figure 5-20. Droplet adhesion onto the solid substrate in compare with droplet interface contact
with air around it, is the other reason that shows smaller degree of oscillation for spreading
diameter rather than droplet height. Final droplet spreading diameter decreases similar to droplet
height by increasing Re number. This decreasing happens slower since the liquid film residual
stays onto the substrate for the cases of large degree of penetration e.g. Re =500 to Re = 1000.
5.3.3.2 Final shape of the droplet
The final shapes of the impacted droplets for impact Reynolds numbers of 50 to 2000 are
presented in Figure 5-23. Three different views of the final shapes are provided: (a) Cross
sectional view of the final droplet shape and the penetrated volume (Figure 5-23a), (b) tilted top
view of the final droplet shape (Figure 5-23b), and (c) tilted bottom view of penetrated liquid,
not showing the pores.
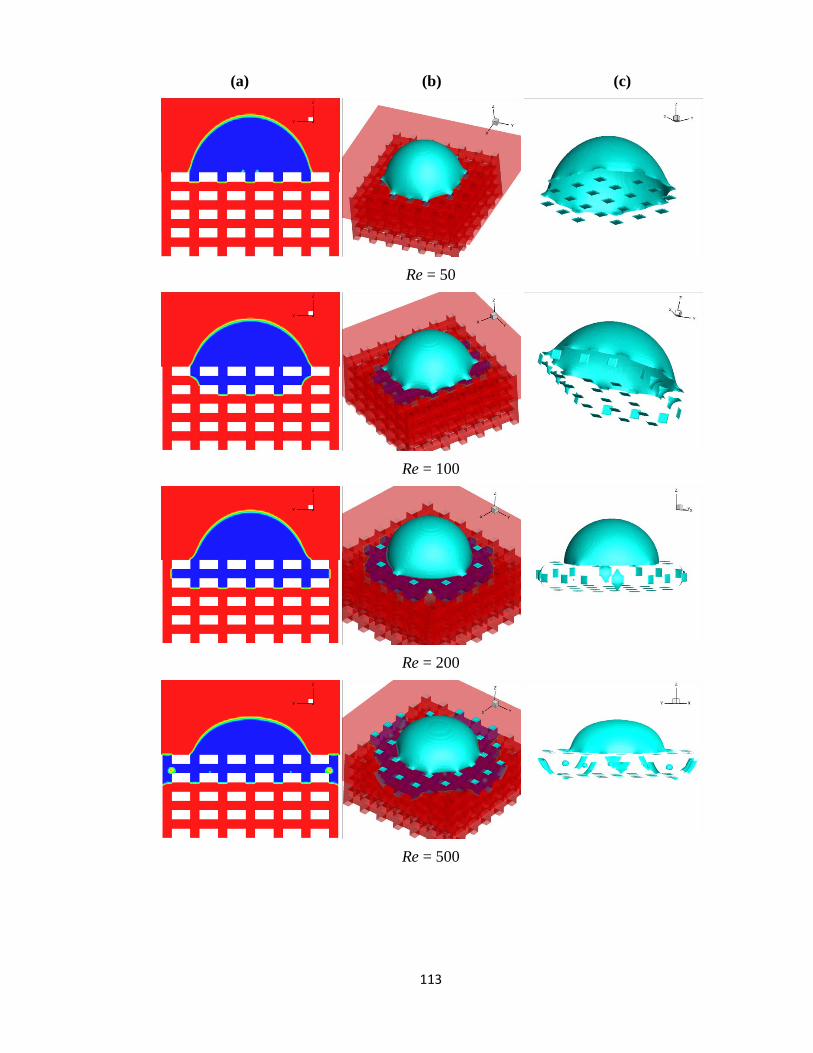
113
(a) (b) (c)
Re = 50
Re = 100
Re = 200
Re = 500
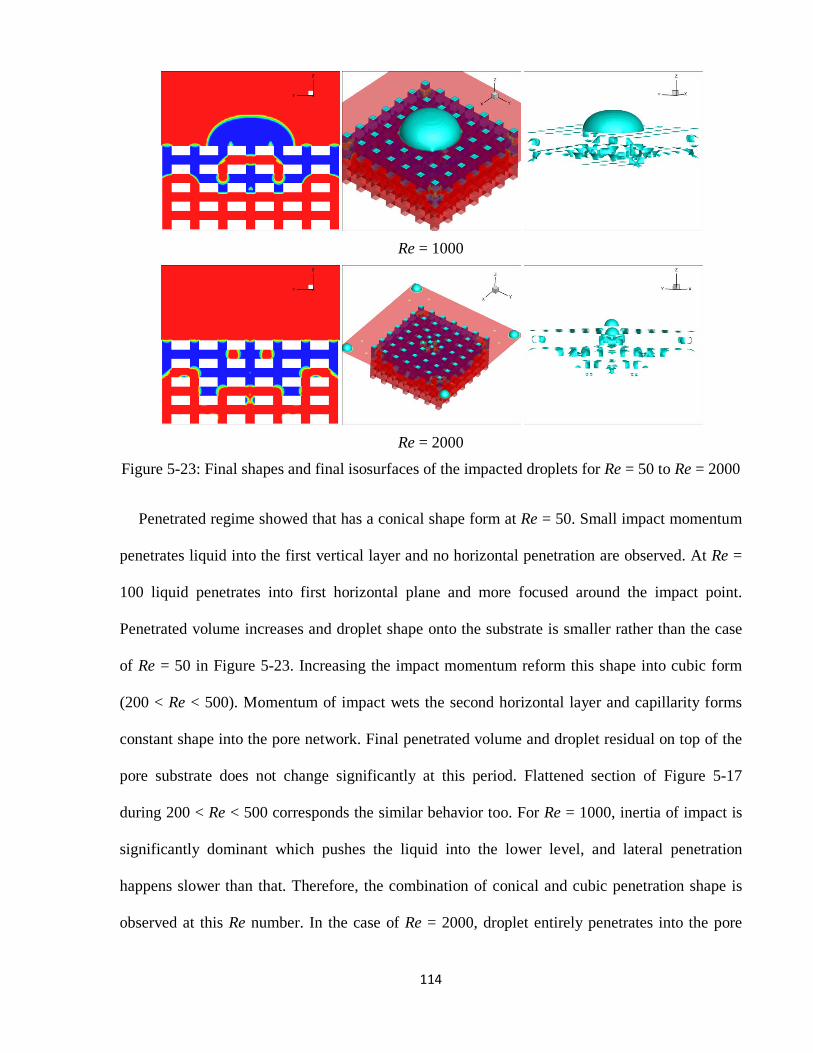
114
Re = 1000
Re = 2000
Figure 5-23: Final shapes and final isosurfaces of the impacted droplets for Re = 50 to Re = 2000
Penetrated regime showed that has a conical shape form at Re = 50. Small impact momentum
penetrates liquid into the first vertical layer and no horizontal penetration are observed. At Re =
100 liquid penetrates into first horizontal plane and more focused around the impact point.
Penetrated volume increases and droplet shape onto the substrate is smaller rather than the case
of Re = 50 in Figure 5-23. Increasing the impact momentum reform this shape into cubic form
(200 < Re < 500). Momentum of impact wets the second horizontal layer and capillarity forms
constant shape into the pore network. Final penetrated volume and droplet residual on top of the
pore substrate does not change significantly at this period. Flattened section of Figure 5-17
during 200 < Re < 500 corresponds the similar behavior too. For Re = 1000, inertia of impact is
significantly dominant which pushes the liquid into the lower level, and lateral penetration
happens slower than that. Therefore, the combination of conical and cubic penetration shape is
observed at this Re number. In the case of Re = 2000, droplet entirely penetrates into the pore
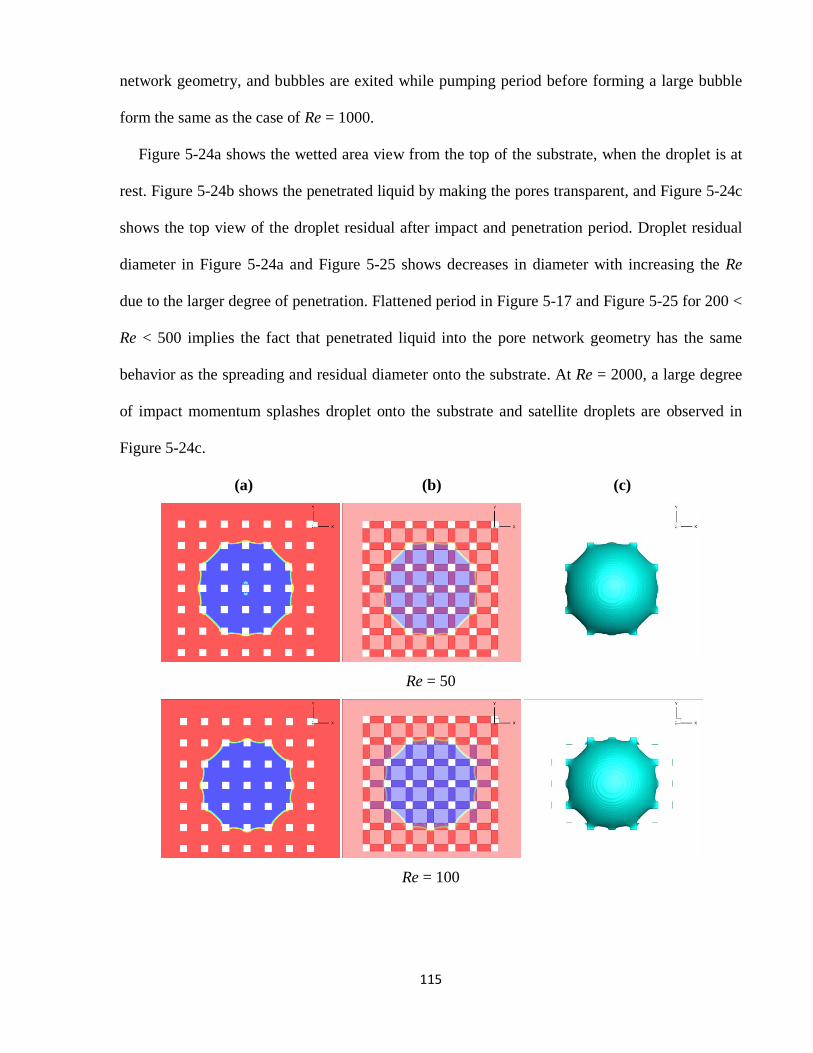
115
network geometry, and bubbles are exited while pumping period before forming a large bubble
form the same as the case of Re = 1000.
Figure 5-24a shows the wetted area view from the top of the substrate, when the droplet is at
rest. Figure 5-24b shows the penetrated liquid by making the pores transparent, and Figure 5-24c
shows the top view of the droplet residual after impact and penetration period. Droplet residual
diameter in Figure 5-24a and Figure 5-25 shows decreases in diameter with increasing the Re
due to the larger degree of penetration. Flattened period in Figure 5-17 and Figure 5-25 for 200 <
Re < 500 implies the fact that penetrated liquid into the pore network geometry has the same
behavior as the spreading and residual diameter onto the substrate. At Re = 2000, a large degree
of impact momentum splashes droplet onto the substrate and satellite droplets are observed in
Figure 5-24c.
(a) (b) (c)
Re = 50
Re = 100
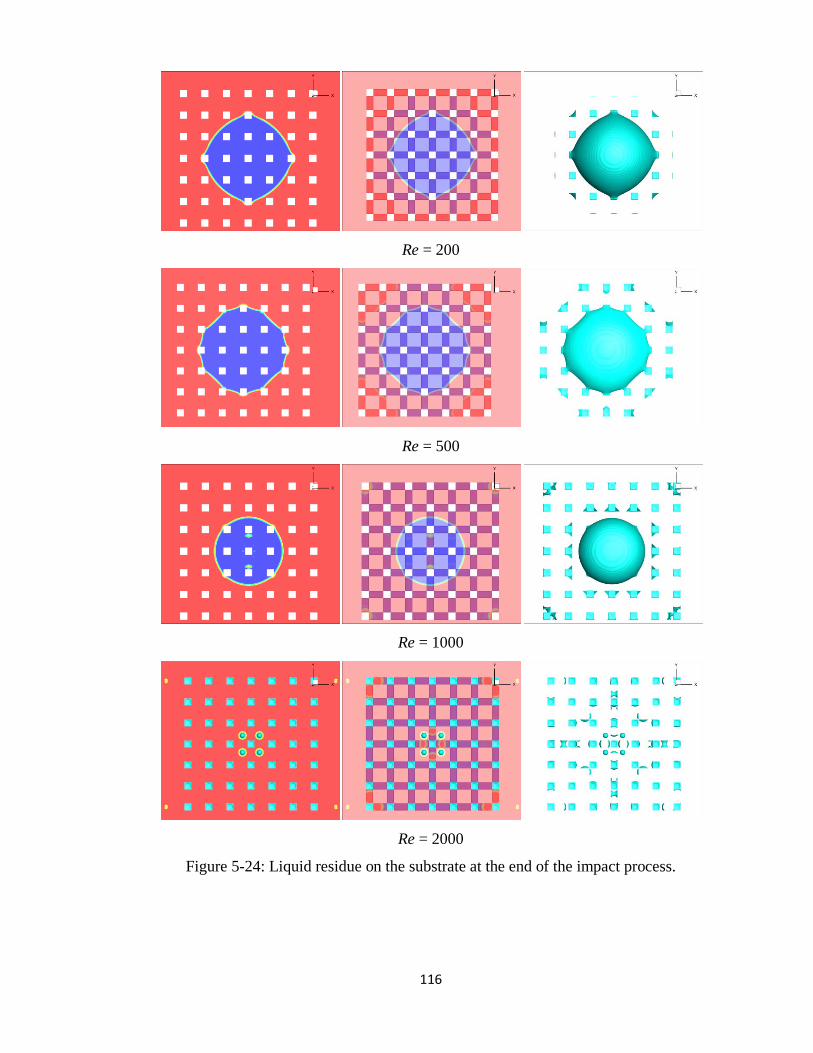
116
Re = 200
Re = 500
Re = 1000
Re = 2000
Figure 5-24: Liquid residue on the substrate at the end of the impact process.
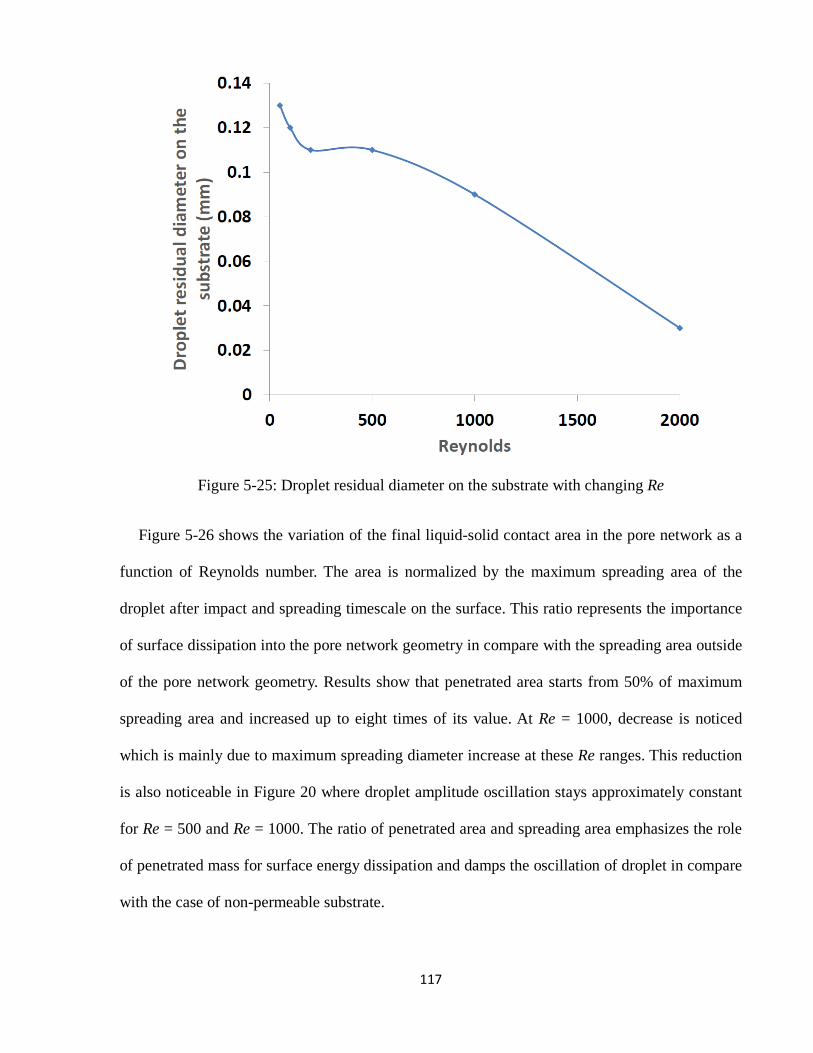
117
Figure 5-25: Droplet residual diameter on the substrate with changing Re
Figure 5-26 shows the variation of the final liquid-solid contact area in the pore network as a
function of Reynolds number. The area is normalized by the maximum spreading area of the
droplet after impact and spreading timescale on the surface. This ratio represents the importance
of surface dissipation into the pore network geometry in compare with the spreading area outside
of the pore network geometry. Results show that penetrated area starts from 50% of maximum
spreading area and increased up to eight times of its value. At Re = 1000, decrease is noticed
which is mainly due to maximum spreading diameter increase at these Re ranges. This reduction
is also noticeable in Figure 20 where droplet amplitude oscillation stays approximately constant
for Re = 500 and Re = 1000. The ratio of penetrated area and spreading area emphasizes the role
of penetrated mass for surface energy dissipation and damps the oscillation of droplet in compare
with the case of non-permeable substrate.
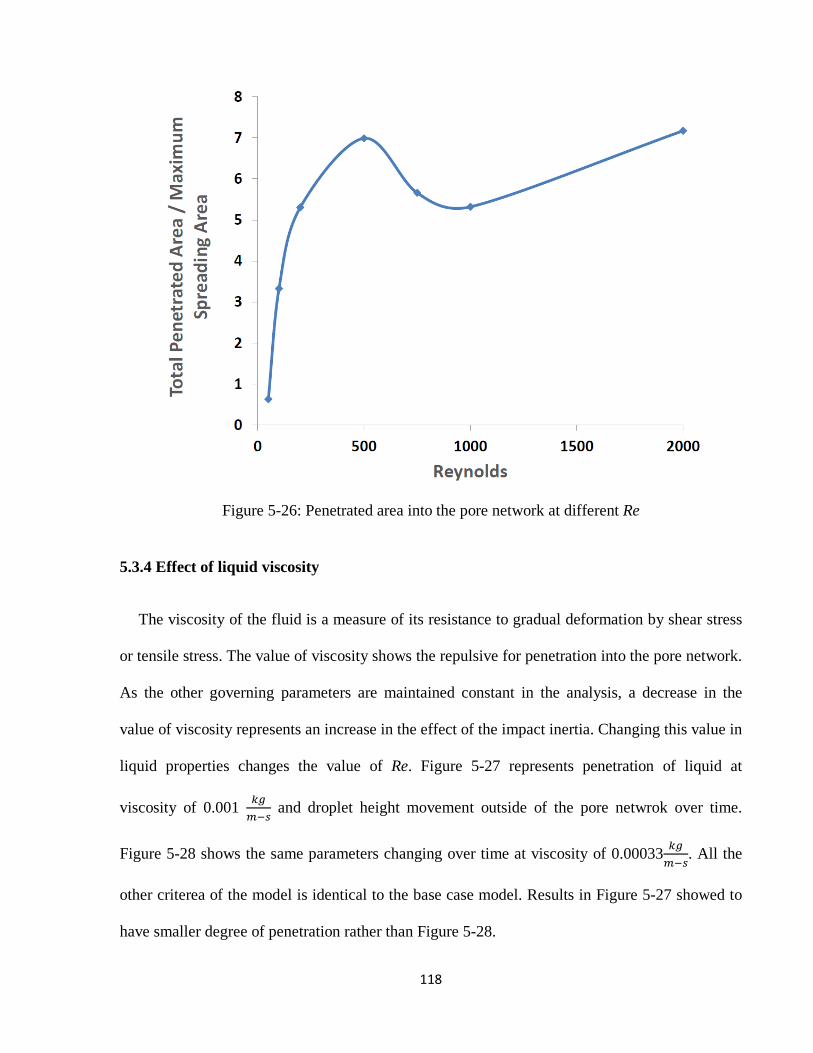
118
Figure 5-26: Penetrated area into the pore network at different Re
5.3.4 Effect of liquid viscosity
The viscosity of the fluid is a measure of its resistance to gradual deformation by shear stress
or tensile stress. The value of viscosity shows the repulsive for penetration into the pore network.
As the other governing parameters are maintained constant in the analysis, a decrease in the
value of viscosity represents an increase in the effect of the impact inertia. Changing this value in
liquid properties changes the value of Re. Figure 5-27 represents penetration of liquid at
viscosity of 0.001 𝑘𝑔𝑚−𝑠
and droplet height movement outside of the pore netwrok over time.
Figure 5-28 shows the same parameters changing over time at viscosity of 0.00033 𝑘𝑔𝑚−𝑠
. All the
other criterea of the model is identical to the base case model. Results in Figure 5-27 showed to
have smaller degree of penetration rather than Figure 5-28.
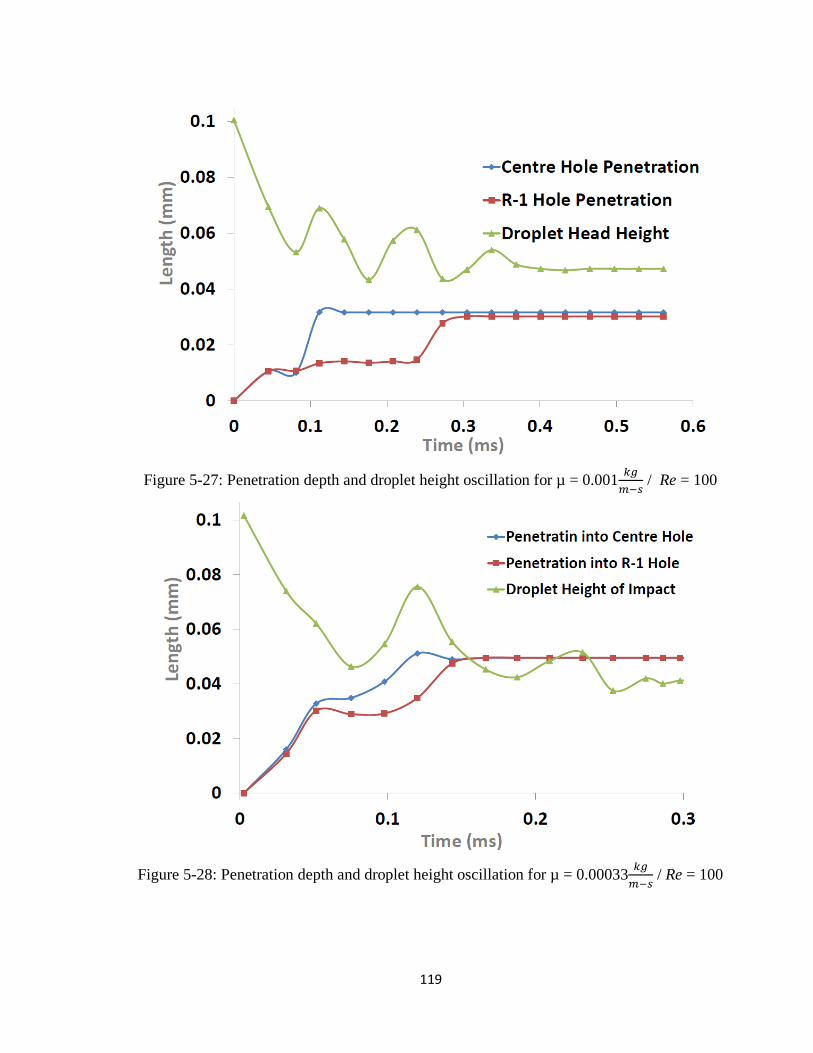
119
Figure 5-27: Penetration depth and droplet height oscillation for µ = 0.001 𝑘𝑔𝑚−𝑠
/ Re = 100
Figure 5-28: Penetration depth and droplet height oscillation for µ = 0.00033 𝑘𝑔𝑚−𝑠
/ Re = 100
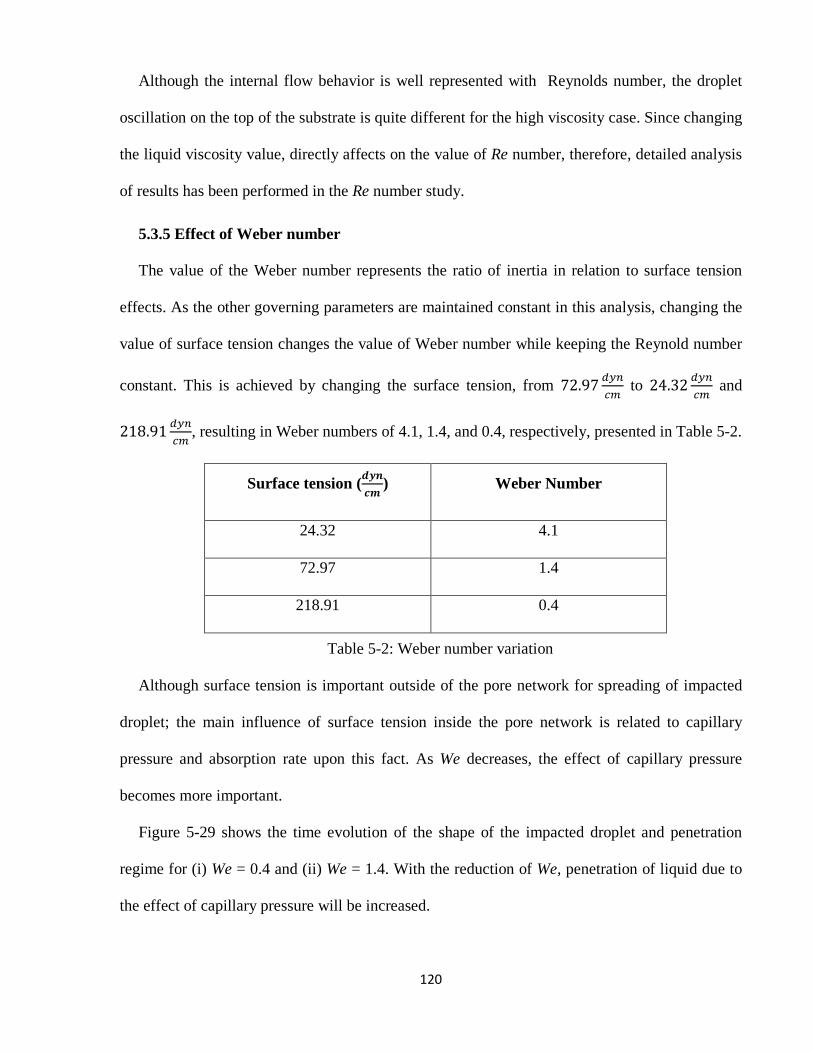
120
Although the internal flow behavior is well represented with Reynolds number, the droplet
oscillation on the top of the substrate is quite different for the high viscosity case. Since changing
the liquid viscosity value, directly affects on the value of Re number, therefore, detailed analysis
of results has been performed in the Re number study.
5.3.5 Effect of Weber number
The value of the Weber number represents the ratio of inertia in relation to surface tension
effects. As the other governing parameters are maintained constant in this analysis, changing the
value of surface tension changes the value of Weber number while keeping the Reynold number
constant. This is achieved by changing the surface tension, from 72.97 𝑑𝑦𝑛𝑐𝑚
to 24.32 𝑑𝑦𝑛𝑐𝑚
and
218.91 𝑑𝑦𝑛𝑐𝑚
, resulting in Weber numbers of 4.1, 1.4, and 0.4, respectively, presented in Table 5-2.
Surface tension (𝒅𝒚𝒏𝒄𝒎
) Weber Number
24.32 4.1
72.97 1.4
218.91 0.4
Table 5-2: Weber number variation
Although surface tension is important outside of the pore network for spreading of impacted
droplet; the main influence of surface tension inside the pore network is related to capillary
pressure and absorption rate upon this fact. As We decreases, the effect of capillary pressure
becomes more important.
Figure 5-29 shows the time evolution of the shape of the impacted droplet and penetration
regime for (i) We = 0.4 and (ii) We = 1.4. With the reduction of We, penetration of liquid due to
the effect of capillary pressure will be increased.
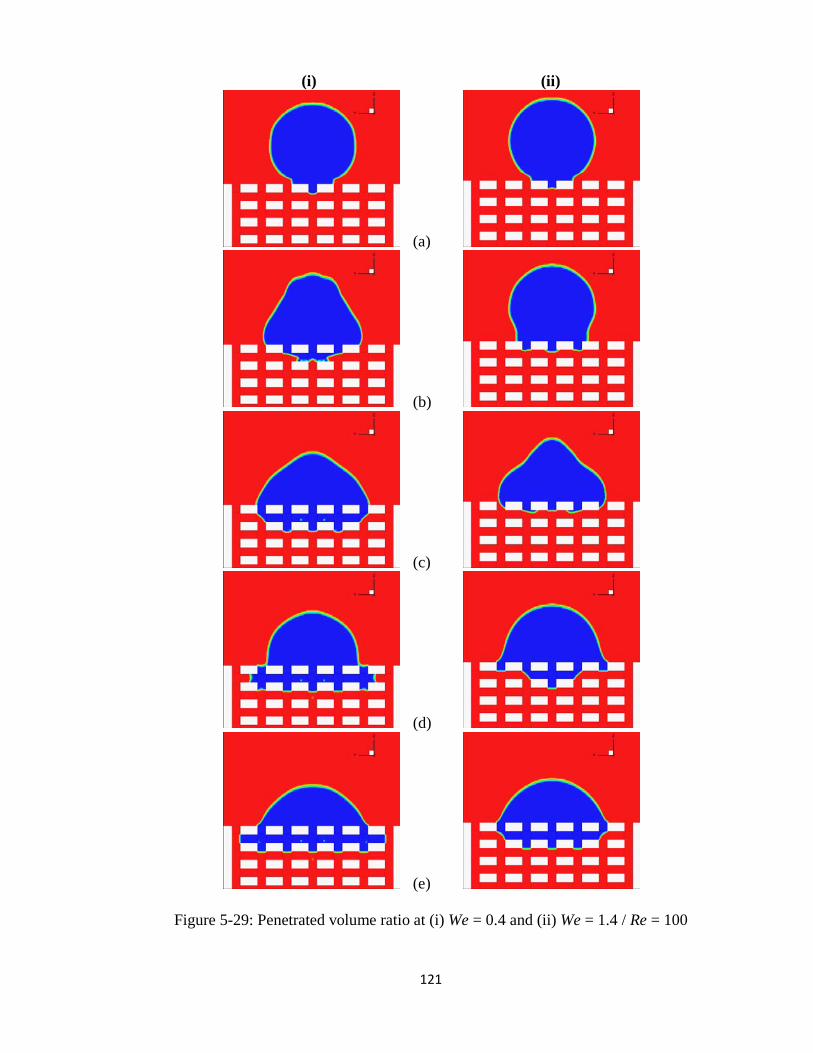
121
(i) (ii)
(a)
(b)
(c)
(d)
(e)
Figure 5-29: Penetrated volume ratio at (i) We = 0.4 and (ii) We = 1.4 / Re = 100
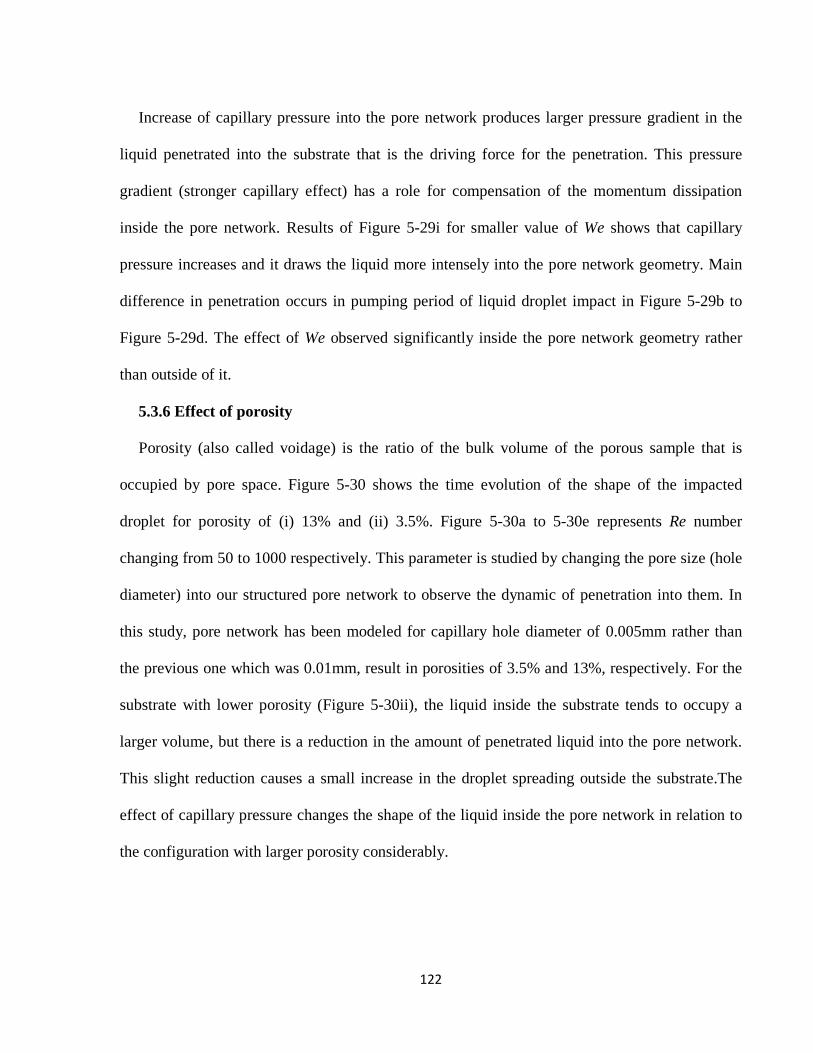
122
Increase of capillary pressure into the pore network produces larger pressure gradient in the
liquid penetrated into the substrate that is the driving force for the penetration. This pressure
gradient (stronger capillary effect) has a role for compensation of the momentum dissipation
inside the pore network. Results of Figure 5-29i for smaller value of We shows that capillary
pressure increases and it draws the liquid more intensely into the pore network geometry. Main
difference in penetration occurs in pumping period of liquid droplet impact in Figure 5-29b to
Figure 5-29d. The effect of We observed significantly inside the pore network geometry rather
than outside of it.
5.3.6 Effect of porosity
Porosity (also called voidage) is the ratio of the bulk volume of the porous sample that is
occupied by pore space. Figure 5-30 shows the time evolution of the shape of the impacted
droplet for porosity of (i) 13% and (ii) 3.5%. Figure 5-30a to 5-30e represents Re number
changing from 50 to 1000 respectively. This parameter is studied by changing the pore size (hole
diameter) into our structured pore network to observe the dynamic of penetration into them. In
this study, pore network has been modeled for capillary hole diameter of 0.005mm rather than
the previous one which was 0.01mm, result in porosities of 3.5% and 13%, respectively. For the
substrate with lower porosity (Figure 5-30ii), the liquid inside the substrate tends to occupy a
larger volume, but there is a reduction in the amount of penetrated liquid into the pore network.
This slight reduction causes a small increase in the droplet spreading outside the substrate.The
effect of capillary pressure changes the shape of the liquid inside the pore network in relation to
the configuration with larger porosity considerably.
123
(i) (ii)
(a)
(b)
(c)
(d)
(e)
Figure 5-30: Penetration regime at porosity (i) 13% and (ii) 3.5% for range of Re
124
Figure 5-30a (Re = 50) shows that the penetration depth is larger for lower porosity rather
than the larger one. Since the space available for the fluid is smaller in the condition with smaller
porosity, fluid penetrates deeper but it does not mean that penetrated liquid is necessarily larger.
Comparison in Figure 5-30b (Re = 100) shows the cubic shape rather than conical shape
penetration.
As explained earlier in this chapter, capillary pressure stabilizes liquid in horizontal planes.
Larger degree of capillary pressure tends the penetration regime more into cubic form. In Figure
5-30c (Re = 200) penetration depth shows the same value but smaller bubbles are entrapped in
the pore network. The main reason that these bubbles could not release similar to larger porosity
is voidage and resistance of pores that entraps and holds the bubbles.
Figure 5-30d (Re = 500) also shows the same depth of penetration. Figure 5-30e (Re = 1000)
shows that stronger capillary penetration changes the shape of the penetration into constant form.
Figure 5-31 shows the normalized penetrated volume of the 5 and 10 micron pores. Figure 5-
28a (Re=50) shows that the penetration depth is larger for the smaller size pore structure. The
fluid, however, penetrates deeper into more pore layer. This is obvious, since the same amount of
fluid has to Since the space available for the fluid is smaller in the condition occupy pores with
smaller volumes.
Figure 5-31 shows the normalized total penetrated volume with respect to the Re number for
two different porosities. Results of penetrated volume in Figure 5-31 implies the fact that
although depth of penetration increases for cases with smaller porosity at some value of Re
number, but total volume of liquid penetrated into the pore network decreases because of the
smaller space available into the pore network geometry for the case of 0.005mm of pore diameter
(porosity = 3.5%). This reduction can be observed in residual of droplet outside of the pore
geometry in Figure 30-ii as well. On the other hand, Figure 5-31 showed that the main distinction
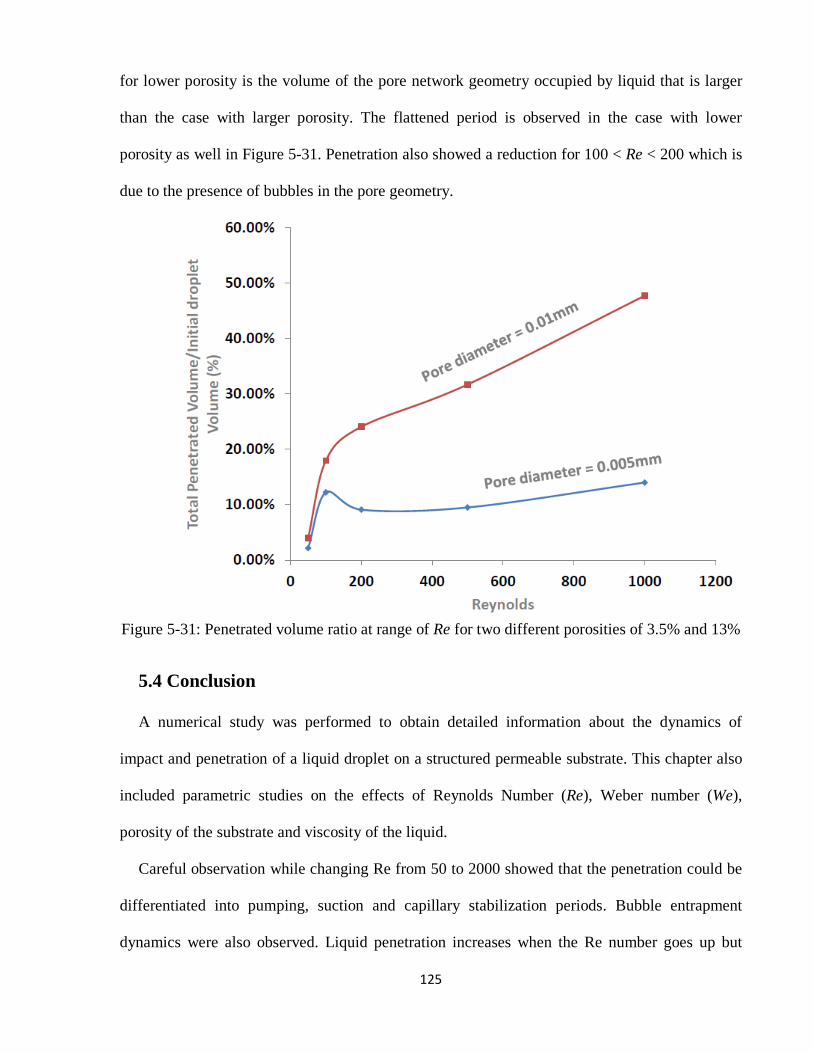
125
for lower porosity is the volume of the pore network geometry occupied by liquid that is larger
than the case with larger porosity. The flattened period is observed in the case with lower
porosity as well in Figure 5-31. Penetration also showed a reduction for 100 < Re < 200 which is
due to the presence of bubbles in the pore geometry.
Figure 5-31: Penetrated volume ratio at range of Re for two different porosities of 3.5% and 13%
5.4 Conclusion
A numerical study was performed to obtain detailed information about the dynamics of
impact and penetration of a liquid droplet on a structured permeable substrate. This chapter also
included parametric studies on the effects of Reynolds Number (Re), Weber number (We),
porosity of the substrate and viscosity of the liquid.
Careful observation while changing Re from 50 to 2000 showed that the penetration could be
differentiated into pumping, suction and capillary stabilization periods. Bubble entrapment
dynamics were also observed. Liquid penetration increases when the Re number goes up but
126
horizontal penetration that has a slower rate showed that slows down this rate. Small bubbles
entrapped into the pore network from Re = 200 but disappears when droplet stays at rest. For Re
> 200 small bubbles form and merges inside the pore network. Large bubbles forms at Re > 500
beneath the droplet inside the pore network geometry. This occurs because the liquid entering
from the lateral holes trapps large central bubbles inside the substrate Oscillation of spreading
diameter and droplet height onto the substrate is affected by the penetration of liquid into the
pore geometry. These two values follow the same behavior but height of impact oscillates with a
larger amplitude. For larger degree of penetration oscillation is non-periodic but damps at the
same time range for different value of Re. Solid/liquid area inside the pore network is shown to
have an important role in surface energy dissipation and oscillation damping outside the pore
network.
Effect of the porosity of the substrate at two different pore size studied in this chapter showed
that penetration volume decreases due to smaller voidage volume in lower porosity substrates.
However, penetration depth itself increases in lower porosities due to the smaller voidage. Effect
of We number has also been studied by changing the surface tension of the liquid droplet. The
smaller the value of the Weber number,\ the larger the volume of penetration. The Reynolds
lumber was varied to study the effect of liquid viscosity and found to have a similar behavior as
We number. However, viscosity studies showed that Re has a direct effect on the oscillation
inside and outside of the pore geometry.
127
Chapter 6
Conclusions
In this chapter, the summary of this dissertation is presented, conclusions are explained, and
recommendations for future studies are offered.
6.1 Summary and Conclusions
The fluid dynamics of the impact of a liquid droplet on a permeable substrate is investigated
both experimentally and numerically.
In the experimental study, as presented in chapter 3, a permeable substrate was constructed by
drilling a series of parallel holes in a transparent polyethylene material. A water droplet was
impacted on the top of the substrate, and the dynamics of the water spreading on the top surface of
the substrate and its penetration into the substrate were investigated using high-speed
videography. Several different droplet diameters and impact velocities were tested to validate the
results of the penetration, and selected results are presented and analyzed. The findings of our
experimental studies are as follows:
128
• The experimental results revealed two different penetration periods: an initially
fast penetration period, which occurs immediately after the droplet impact, referred
to as the inertia driven penetration; and a slow penetration period, governed by
capillary action, and referred to as the capillary driven penetration.
• Careful consideration of the results of different impact velocities showed that the
first phase of penetration occurs as the droplet spreads on the substrate regardless
of the effects of viscosity and surface tension. At the end of the spreading stage,
penetration halts and droplet retraction occurs on the substrate.
• During droplet oscillation on top of the substrate, penetration was observed to be
proportional to the square root of time, ℎ(𝑡) ∝ √𝑡.
• Droplet oscillation on the substrate with parallel holes showed a significant
difference when compared with non-permeable substrate. The area and volume of
liquid penetration into the parallel holes network showed that penetrated area is
significant in comparison with the spreading area between liquid and solid
substrate, but penetrated volume is negligible in comparison with initial droplet
volume. This finding implies that droplet height oscillation up to the moment of it
coming to rest on the substrate damps significantly in the case of a substrate with
parallel holes.
The numerical study was performed using ANSYS-Fluent 14.0 software. Initially, the
numerical model was validated by comparing its results with those of the experimental study of
droplet impact on parallel holes. This allowed for the determination of proper mesh sizes as well
as contact angle values. This was presented at the end of chapter 3. After validation, the fluid
dynamics of flow through a capillary with a junction was considered. Chapter 4 presents the
129
results of the numerical modeling of a droplet impacting on an inverted T-hole geometry. The
study was aimed at determining the conditions under which the liquid may or may not pass the T
junction. If the liquid passes the T junction, the liquid is said to be interlocked with the substrate.
• Penetration results showed that liquid interlocking into horizontal line of T-geometry
occurs while the vertical length of T-geometry stays in the range of the inertia driven
penetration regime. In other words in order to form a liquid ligament at the junction of
the T-geometry, the main driving force is momentum of impact. For vertical lengths
exceeding the inertia driven penetration regime, liquid will not be able to penetrate
into the horizontal line and will pull back during the droplet retraction phase on the
substrate. This is called no-interlocking regime in our studies.
• Parametric studies showed that impact velocity and contact angle effect are dominant
rather than droplet diameter and hole size. Increasing the first two parameters
increased horizontal penetration significantly. In the case of ink droplet impact onto a
paper substrate impact velocity and contact angle would have significant role in ink
adhesion to the paper as well. In other words, interlocking is the representation of
adhesion of liquid into the substrate in printing applications because of the fabric-
based geometry of paper as the permeable substrate.
Phase three of the numerical study considered the impact of a liquid droplet on a
structured permeable substrate. This is presented in chapter 5. The penetrated volume of the
liquid droplet impacted on the permeable substrate is the main factor in defining the adhesion
of ink drops to the paper in printing applications. It is important for this volume to take a
cylindrical or cubic form. Entrapment of air bubbles into the penetrated volume also
significantly changes the droplet’s adhesion. For these reasons, penetrated volume is
considered in our numerical simulations. Parametric studies and its effect into the penetrated
130
volume are evaluated by changing the value of Re number, We number, porosity of the
substrate, and liquid viscosity. Our noticeable findings are as follows:
• Changing the value of Re number from 50 to 2000 showed an increase in
penetrated volume that corresponded to an increase in the value of Re number. The
structure of the pore network, which is similar to structure of fiber-based paper,
produces noticeably flattened patterns in penetrated volume increase with
increasing Re number. This flattened pattern is due to wetting next horizontal
planes.
• It was observed that vertical penetration mainly happens within the inertia driven
penetration regime and that the capillary regime mainly stabilizes penetrated liquid
into the adjacent horizontal plane rather than push it lower in the vertical.
• Bubble entrapment occurs at impacts of Re > 200. At values of Re below 200, a
small bubble forms at the first moment of impact, and is released at the edge of the
liquid solid interface. A large air bubble was entrapped in the central part of the
permeable substrate during the Re > 500 impact. This occurred because the
penetrated liquid entered from the lateral holes, travelling inwardly, and trapping
large central bubbles inside the substrate. This affects the shape of penetrated
volume, forcing it to occupy a larger volume into the pore geometry. However it
does not affect the total mass of the penetrated liquid.
• Oscillatory behavior of spreading diameter and droplet height on top of substrate
showed that increasing the impact Re significantly dissipates kinetic energy of
impact by surface energy dissipation. Results showed that ratio of penetrated area
into the pore network in compare with spreading area on the substrate are going up
131
to 8 times of it. A larger volume of liquid penetrated into the pore network leaves
a smaller volume of liquid on top of the substrate, decreasing the droplet spreading
diameter.
• The effects of the porosity of the substrate at two different pore size studied in this
chapter showed that penetration volume decreases due to smaller voidage volume
in lower porosity substrates. However, penetration depth itself increases in lower
porosities due to the smaller voids
• Changes in Weber number showed a direct effect on capillarity of the pore
network geometry. Decreasing the value of We number increases the effect of
surface tension which increases the capillarity of the pore network geometry.
Increased surface tension stabilizes liquid into the horizontal plane that it wets and
does not significantly affect the penetrated volume.
6.2 Future Work Recommendations
It is recommended that experimental studies on parallel hole substrate be extended to
corner modeling, specifically considering the quality of the corner roughness. Sharp edge
corners can be fabricated, and the effects of liquid penetration at the edges can be observed to
interfere the role of surface roughness and contact line motion at the edges in our
experimental studies.
Numerical simulation in this thesis focused on the dynamics of impact and penetration
regardless of any temperature gradient. Thermal studies of impact and penetration that
change the behavior of the viscosity, surface tension, and contact angle can be the next step
of numerical simulation. Solidification of liquid inside the pore network is expected to
change the dynamic of penetration significantly and interlocking study will have stronger

132
meaning in the cases of variable viscosity. With such simulations, dynamics of impact and
penetration would make this research even more relevant to understanding ink droplet impact
and penetration on the paper substrate.
133
References
1. Bussmann M, Chandra S, Mostaghimi J., Modeling the splash of a droplet impacting
a solid surface. Phys. Fluids, vol. 12, pp.3121–32, 2000.
2. Chandra S., Avedisian CT., On the collision of a droplet with a solid surface. Proc. R. Soc.
London Ser. A, 432:13–41188, 1991.
3. Clanet C, Beguin C, Richard D, Quere D., Maximal deformation of an impacting drop. J.
Fluid Mech. vol. 517, pp. 199–208. 2004.
4. Cossali GE, Coghe A, Marengo M., The impact of a single drop on a wetted solid surface.
Exp. Fluids, vol. 22, pp. 463–472, 1997.
5. Gentner F, Rioboo R, Baland JP, De Coninck J., Low inertia impact dynamics for
nanodrops. Langmuir, vol. 20, pp. 4748–4755, 2004.
6. Reznik SN, Yarin AL., Spreading of a viscous drop due to gravity and capillarity on a
horizontal or an inclined dry wall. Phys. Fluids, vol. 14, pp. 118–132, 2002.
7. Kim HY, Chun JH., The recoiling of liquid droplets upon collision with solid surfaces.
Phys. Fluids, vol. 13, pp. 643–659, 2001.
8. Kim HY, Feng ZC, Chun JH., Instability of a liquid jet emerging from a droplet upon
collision with a solid surface. Phys. Fluids, vol. 12, pp. 531–541, 2000.
9. Mehdi-Nejad V, Mostaghimi J, Chandra S., Air bubble entrapment under an impacting
droplet. Phys. Fluids, vol. 15, pp. 173–183, 2003.
10. Roux DCD, Cooper-White JJ., Dynamics of water spreading on a glass surface. J. Colloid
Interface Sci., vol. 277, pp. 424–436, 2004.
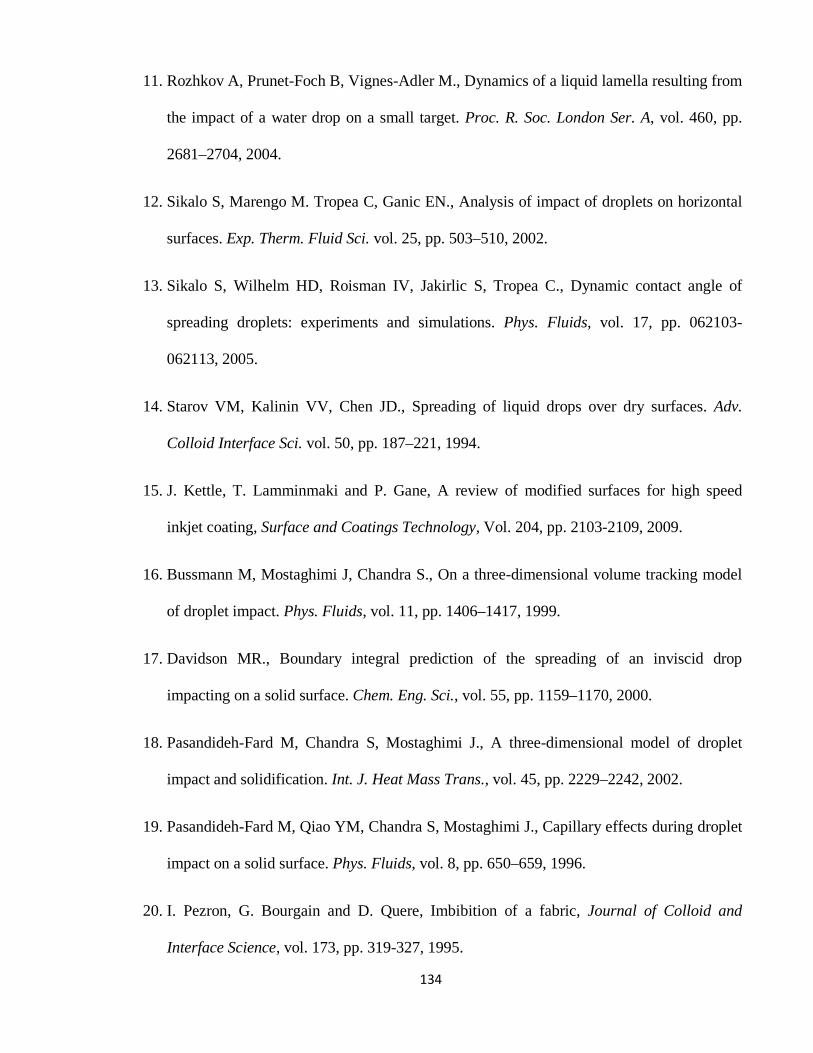
134
11. Rozhkov A, Prunet-Foch B, Vignes-Adler M., Dynamics of a liquid lamella resulting from
the impact of a water drop on a small target. Proc. R. Soc. London Ser. A, vol. 460, pp.
2681–2704, 2004.
12. Sikalo S, Marengo M. Tropea C, Ganic EN., Analysis of impact of droplets on horizontal
surfaces. Exp. Therm. Fluid Sci. vol. 25, pp. 503–510, 2002.
13. Sikalo S, Wilhelm HD, Roisman IV, Jakirlic S, Tropea C., Dynamic contact angle of
spreading droplets: experiments and simulations. Phys. Fluids, vol. 17, pp. 062103-
062113, 2005.
14. Starov VM, Kalinin VV, Chen JD., Spreading of liquid drops over dry surfaces. Adv.
Colloid Interface Sci. vol. 50, pp. 187–221, 1994.
15. J. Kettle, T. Lamminmaki and P. Gane, A review of modified surfaces for high speed
inkjet coating, Surface and Coatings Technology, Vol. 204, pp. 2103-2109, 2009.
16. Bussmann M, Mostaghimi J, Chandra S., On a three-dimensional volume tracking model
of droplet impact. Phys. Fluids, vol. 11, pp. 1406–1417, 1999.
17. Davidson MR., Boundary integral prediction of the spreading of an inviscid drop
impacting on a solid surface. Chem. Eng. Sci., vol. 55, pp. 1159–1170, 2000.
18. Pasandideh-Fard M, Chandra S, Mostaghimi J., A three-dimensional model of droplet
impact and solidification. Int. J. Heat Mass Trans., vol. 45, pp. 2229–2242, 2002.
19. Pasandideh-Fard M, Qiao YM, Chandra S, Mostaghimi J., Capillary effects during droplet
impact on a solid surface. Phys. Fluids, vol. 8, pp. 650–659, 1996.
20. I. Pezron, G. Bourgain and D. Quere, Imbibition of a fabric, Journal of Colloid and
Interface Science, vol. 173, pp. 319-327, 1995.
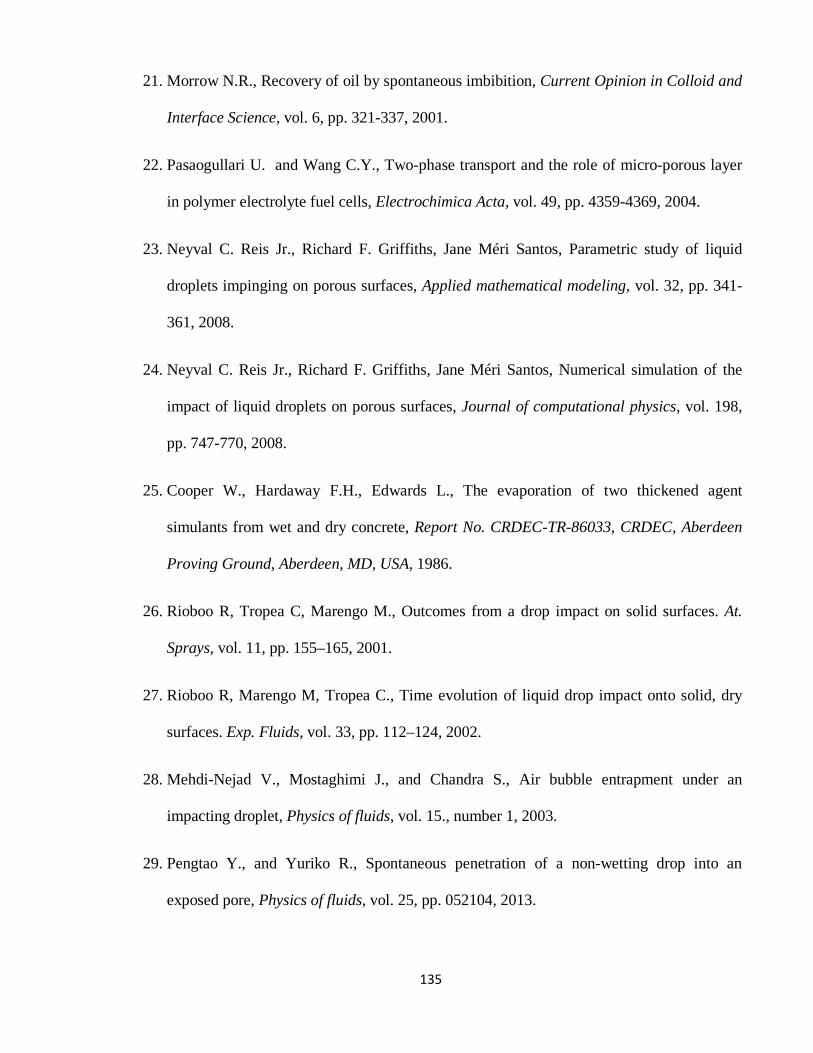
135
21. Morrow N.R., Recovery of oil by spontaneous imbibition, Current Opinion in Colloid and
Interface Science, vol. 6, pp. 321-337, 2001.
22. Pasaogullari U. and Wang C.Y., Two-phase transport and the role of micro-porous layer
in polymer electrolyte fuel cells, Electrochimica Acta, vol. 49, pp. 4359-4369, 2004.
23. Neyval C. Reis Jr., Richard F. Griffiths, Jane Méri Santos, Parametric study of liquid
droplets impinging on porous surfaces, Applied mathematical modeling, vol. 32, pp. 341-
361, 2008.
24. Neyval C. Reis Jr., Richard F. Griffiths, Jane Méri Santos, Numerical simulation of the
impact of liquid droplets on porous surfaces, Journal of computational physics, vol. 198,
pp. 747-770, 2008.
25. Cooper W., Hardaway F.H., Edwards L., The evaporation of two thickened agent
simulants from wet and dry concrete, Report No. CRDEC-TR-86033, CRDEC, Aberdeen
Proving Ground, Aberdeen, MD, USA, 1986.
26. Rioboo R, Tropea C, Marengo M., Outcomes from a drop impact on solid surfaces. At.
Sprays, vol. 11, pp. 155–165, 2001.
27. Rioboo R, Marengo M, Tropea C., Time evolution of liquid drop impact onto solid, dry
surfaces. Exp. Fluids, vol. 33, pp. 112–124, 2002.
28. Mehdi-Nejad V., Mostaghimi J., and Chandra S., Air bubble entrapment under an
impacting droplet, Physics of fluids, vol. 15., number 1, 2003.
29. Pengtao Y., and Yuriko R., Spontaneous penetration of a non-wetting drop into an
exposed pore, Physics of fluids, vol. 25, pp. 052104, 2013.
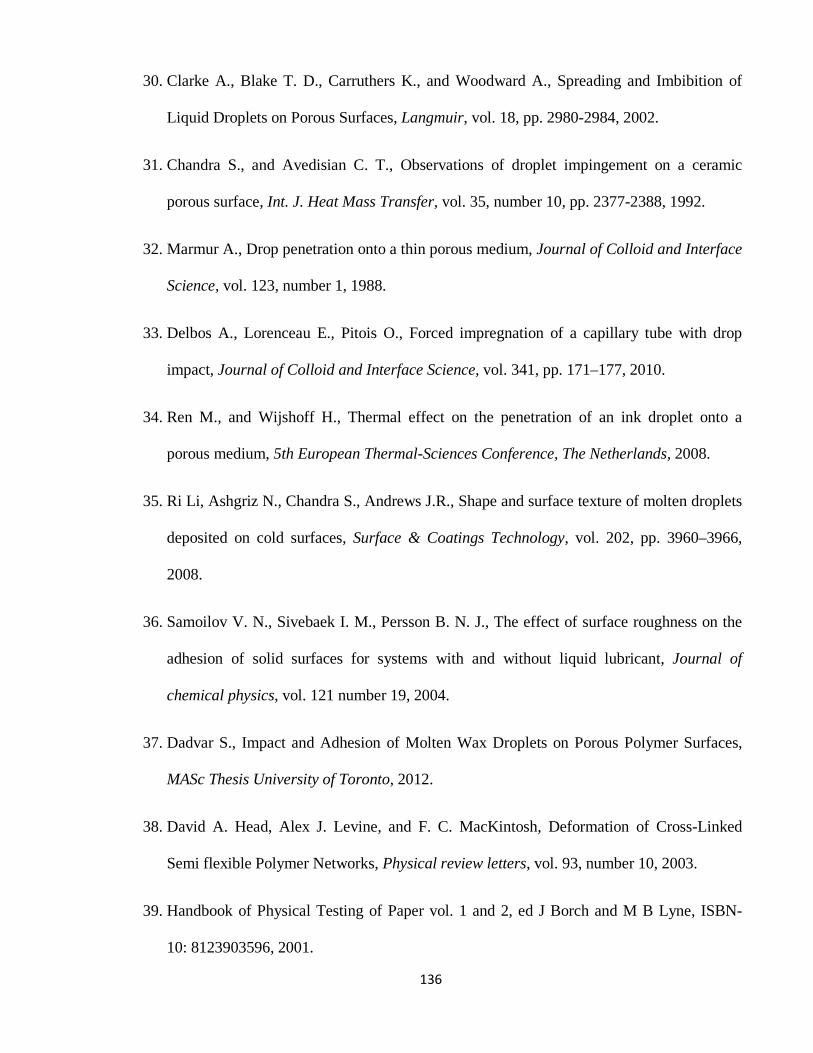
136
30. Clarke A., Blake T. D., Carruthers K., and Woodward A., Spreading and Imbibition of
Liquid Droplets on Porous Surfaces, Langmuir, vol. 18, pp. 2980-2984, 2002.
31. Chandra S., and Avedisian C. T., Observations of droplet impingement on a ceramic
porous surface, Int. J. Heat Mass Transfer, vol. 35, number 10, pp. 2377-2388, 1992.
32. Marmur A., Drop penetration onto a thin porous medium, Journal of Colloid and Interface
Science, vol. 123, number 1, 1988.
33. Delbos A., Lorenceau E., Pitois O., Forced impregnation of a capillary tube with drop
impact, Journal of Colloid and Interface Science, vol. 341, pp. 171–177, 2010.
34. Ren M., and Wijshoff H., Thermal effect on the penetration of an ink droplet onto a
porous medium, 5th European Thermal-Sciences Conference, The Netherlands, 2008.
35. Ri Li, Ashgriz N., Chandra S., Andrews J.R., Shape and surface texture of molten droplets
deposited on cold surfaces, Surface & Coatings Technology, vol. 202, pp. 3960–3966,
2008.
36. Samoilov V. N., Sivebaek I. M., Persson B. N. J., The effect of surface roughness on the
adhesion of solid surfaces for systems with and without liquid lubricant, Journal of
chemical physics, vol. 121 number 19, 2004.
37. Dadvar S., Impact and Adhesion of Molten Wax Droplets on Porous Polymer Surfaces,
MASc Thesis University of Toronto, 2012.
38. David A. Head, Alex J. Levine, and F. C. MacKintosh, Deformation of Cross-Linked
Semi flexible Polymer Networks, Physical review letters, vol. 93, number 10, 2003.
39. Handbook of Physical Testing of Paper vol. 1 and 2, ed J Borch and M B Lyne, ISBN-
10: 8123903596, 2001.
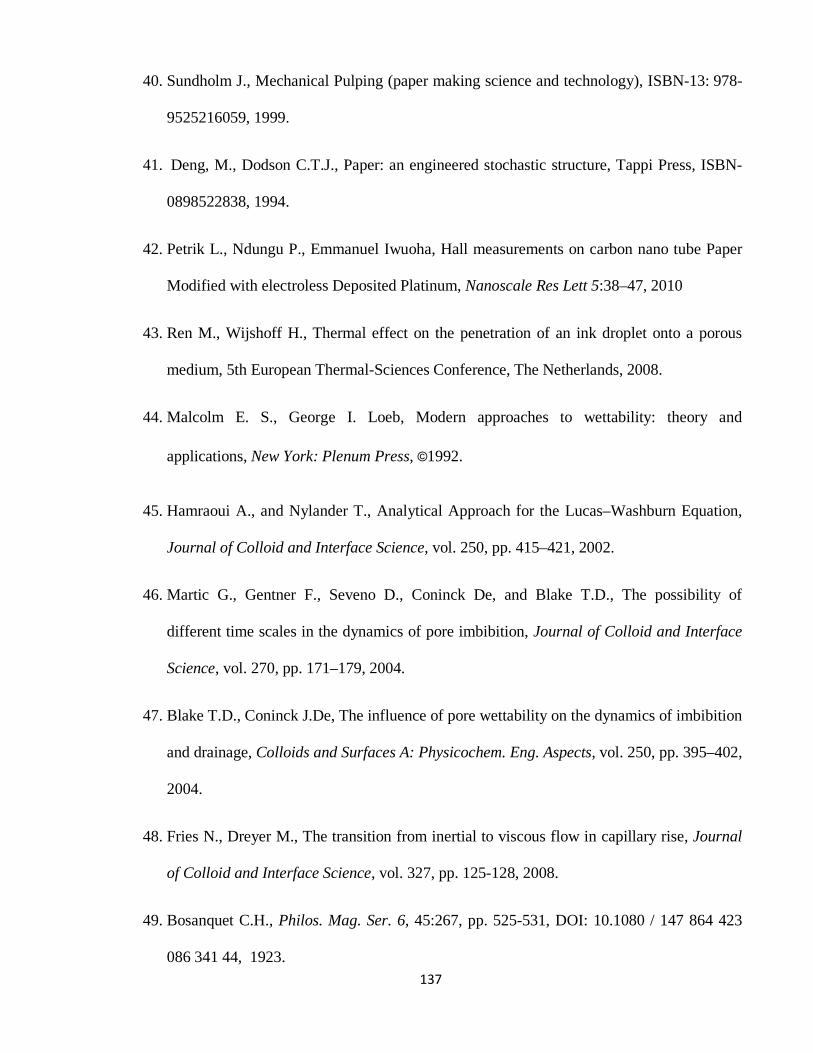
137
40. Sundholm J., Mechanical Pulping (paper making science and technology), ISBN-13: 978-
9525216059, 1999.
41. Deng, M., Dodson C.T.J., Paper: an engineered stochastic structure, Tappi Press, ISBN-
0898522838, 1994.
42. Petrik L., Ndungu P., Emmanuel Iwuoha, Hall measurements on carbon nano tube Paper
Modified with electroless Deposited Platinum, Nanoscale Res Lett 5:38–47, 2010
43. Ren M., Wijshoff H., Thermal effect on the penetration of an ink droplet onto a porous
medium, 5th European Thermal-Sciences Conference, The Netherlands, 2008.
44. Malcolm E. S., George I. Loeb, Modern approaches to wettability: theory and
applications, New York: Plenum Press, ©1992.
45. Hamraoui A., and Nylander T., Analytical Approach for the Lucas–Washburn Equation,
Journal of Colloid and Interface Science, vol. 250, pp. 415–421, 2002.
46. Martic G., Gentner F., Seveno D., Coninck De, and Blake T.D., The possibility of
different time scales in the dynamics of pore imbibition, Journal of Colloid and Interface
Science, vol. 270, pp. 171–179, 2004.
47. Blake T.D., Coninck J.De, The influence of pore wettability on the dynamics of imbibition
and drainage, Colloids and Surfaces A: Physicochem. Eng. Aspects, vol. 250, pp. 395–402,
2004.
48. Fries N., Dreyer M., The transition from inertial to viscous flow in capillary rise, Journal
of Colloid and Interface Science, vol. 327, pp. 125-128, 2008.
49. Bosanquet C.H., Philos. Mag. Ser. 6, 45:267, pp. 525-531, DOI: 10.1080 / 147 864 423
086 341 44, 1923.
138
50. Quere D., Inertial Capillarity, Europhysics Letters, 39(5), pp. 533-538, 1997.
51. Berberovi_c E., Investigation of free-surface flow associated with drop impact: Numerical
Simulations and Theoretical Modeling, Technischen Universitat Darmstadt, pp. 115-129,
2010.
52. Joung Y., S., and Buie C., R., Scaling laws for drop impingement on porous films and
papers, Physical Review, vol. 89, pp. 13-15, 2014.
53. Hsu C. F., Ashgriz N., Impaction of a droplet on an orifice plate, Physics of Fluids, vol.
16, number 2, 2004.
54. Hsu N., and Ashgriz N., Nonlinear penetration of liquid drops into radial capillaries,
Journal of Colloid and Interface Science, vol. 270, pp. 146–162, 2004.
55. Range K., and Feuillebois F., Influence of Surface Roughness on Liquid Drop Impact,
Journal of Colloid and Interface Science, vol. 203, pp. 16–30, 1998.