dropoff detection blind - github pages
TRANSCRIPT
1
ME4913 Independent Study, Advanced Mechatronics 5 May 2017, Spring 2017 San Antonio, TX, USA
Drop Off Detection Sensor for Blind Persons
Kyle Lamoureux Undergraduate UTSA
Robotics and Motion Laboratory Dept. of Mechanical Engineering San Antonio, Texas, 78255, USA
(210) 563-1989 [email protected]
ABSTRACT
Humans use a complex sensory system to maneuver and navigate in their environment making the sense of sight a vitally important factor to most of the population’s ability to function. In the visually impaired community, navigation of one’s surroundings can be difficult, heightening the need for tools or sensors to supplement and compensate for lack of visual capability. The visually disabled community has adapted many innovations like the seeing cane and a variety of integrated sensors meant to detect obstacles to help them obtain a more accurate reading of their surroundings. However, there is a lack of products aimed at detecting drop offs which have the potential to be as hazardous to a blind person as a common obstacle. This project’s purpose is to develop a system which can be used in concert with current tools and sensors to detect and alert a user of the existence of a drop off. The project conducted a series of tests to select a sensor type, mounting location, and mounting orientation to optimize the accuracy of the sensor’s reading. An Arduino controller was used to collect data from the sensor to develop a code and logic system which attempted to identify when the sensor was detecting a significant change in ground level. Furthermore, an alert system which combined audio and visual cues was developed to alert the user to the existence of such a drop off. The project was developed and manufactured based on initial calibration tests, then validated against 3 different drop off scenarios. The system proved capable of its objective, but exposed many limitations of a single sensor system mounted on an unpredictable user.
NOMENCLATURE
C length of seeing cane D theoretical distance forward from user DC distance forward reached by cane H height of user HW waist height of user IR infrared LED light emitting diode T theoretical sensor reading USAA united services automobile association θ mounting angle of sensor in degrees below
the horizontal
INTRODUCTION
Through the course of daily life, humans use a complex combination of sensory methods to navigate through their environment. Among these, vision is arguably the most important because people rely heavily on their eyes to detect the features of their surroundings. When a person has impaired vision, it can sometimes be a challenge to navigate the world efficiently and safely.
One very common tool people with impaired vison have adapted to the purpose of navigation is the “seeing” cane. This easy to spot device serves several purposes for a visually impaired individual. The cane is swept back and forth in front of the user to relay information about ground conditions or the existence of possible obstacles. The very sight of the cane by most people helps them to recognize that the operator of the cane has a visual impairment. Generally, this lets people know to take extra precautions or even to offer assistance if the person seems to be having trouble navigating an unfamiliar area.
2
The seeing cane has been the subject of technological innovation for many years. Companies and “do it yourself1” enthusiast alike have improved the cane with a wide variety of features ranging from twenty-dollar type solutions to thousands of dollar type solutions. Sonar adapted or driven canes 2are everywhere as obstacle detection is the name of the game for most companies trying to develop products for the visually impaired community. This extends to most other solutions like vest mounted, head mounted, or shoe mounted sensor arrays.
The problem this project addresses is the other side of the coin when it comes to detecting possible hazards. After an interview with Patrick Steudevant3, a member and leader in the visually impaired community, a different sort of problem was mentioned. Patrick’s list of problems navigating included detecting obstacles, people, and drop offs. This was an intriguing perspective as drop-offs are the opposite of obstacles. Encountering a stairwell, escalator, or end of a train platform can be a hazardous because a visually impaired person may not know it exist until they are falling. While most sensor arrays, and even the seeing canes, are good at detecting obstacles, they may be poor at detecting the sudden lack of, say, the floor in front of the operator.
This was the inspiration for the project. A visually impaired person could benefit from a piece of technology which could detect when the person is approaching a drop off. The purpose of this project is to detect the existence of a drop-off and alert the user before the seeing cane of the visually impaired person reaches the drop off. The project would supplement systems already in place such as the seeing can. The project does not seek to replace other products, but instead to amplify their usefulness by working in concert with them. The goal is to make it easier and less hazardous for a visually impaired person to navigate the world around them.
METHODS
Concept The general concept or starting point when detecting drop offs is first attempting to detect the floor some distance in the direction of travel of the user. The system was first developed to simply attempt to detect the floor. Later this could be leveraged to detect the lack of a floor indicating a drop off. Sensor mounting on a human is the next step as the sensor would need to travel with the user on a day to day basis. This system would need to be integrated with a controller and alert system. This would allow the controller to monitor the sensor and using its coding to determine if it should alert the user. To decide many aspects of the conceptual setup, calibration and testing experimentation must be completed to determine optimal configuration. Sensor Type Selection
The first step in creating a system to detect the features of one’s surroundings, or lack of said features, is to select the
1 https://diyhacking.com/arduino-smart-cane-for-the-blind/ 2 http://www.cnn.com/2014/06/20/tech/innovation/sonar-sticks-use-
ultrasound-blind/
appropriate sensor/s. This project detects the ground some distance in front of the user. The floor qualifies as solid object some distance from the sensor so it was an obvious choice to use a distance or proximity sensor. The two types that came to mind were ultrasonic sensors and infrared (IR) sensors.
These types of sensors can detect objects and how far away they are. An ultrasonic sensor sends out pulses of sound at a certain frequency and listens for a response on that frequency. Hearing a response means that the sound bounced off an object and returned to the sensor. The time it took for the pulse to return can be used to gauge distance. IR sensors work similarly but they use infrared light instead of sound. Focused blast of infrared light are emitted from one side of the sensor while the other side detects the IR light returning due to reflection. If the light is reflecting off something this betrays the existence of an object. The problem is that, when detecting the floor, the sensors would be trying to detect a surface at some angle. This is a problem because both types of pulses, sound and light, may reflect off the floor at an angle that doesn’t allow them to return and be detected by the sensors.
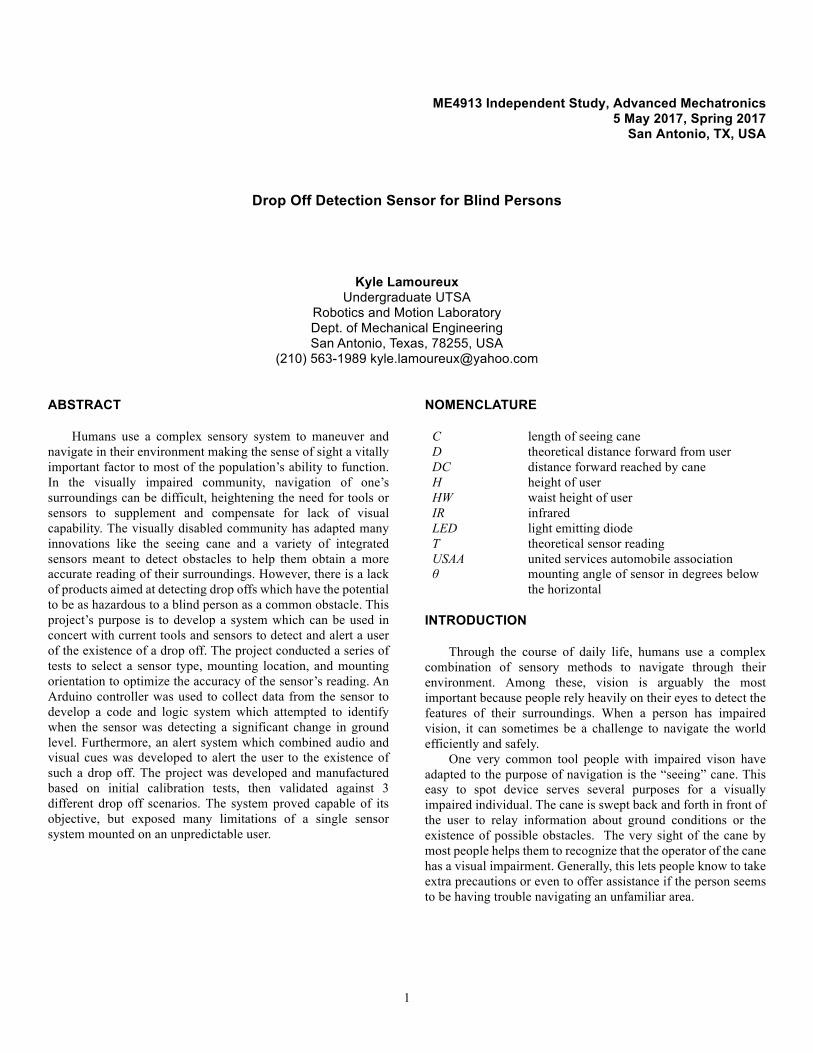
Testing would be required to choose which sensor if any would be capable of detecting the ground at a significant distance in front of the user. Available sensors that had roughly the range required were the [1]SHARP GP2Y0A710K0F IR sensor, with a range of 1-5m, and the [2]Matribox Ultrasonic Rangefinder LZ-EZ4, with a range of 0-6m. Comparison of these two sensors would determine which was ultimately used.
Figure 1 Ultrasonic(Left) IR (Right)
Sensor Mounting Location
With these sensors selected, the question then became where to mount them. Easy mounting point candidates were on the user’s shoes, belt, cane, arm, vest, glasses, head, and hat. Because angle of incidence with the ground was going to be an issue, the higher up the sensor could be mounted, the higher the angle of incidence would be with the ground while still detecting ground a significant distance from the user. Mounting the sensor on the brim of a baseball cap would be the best way to get the sensor in the orientation desired at a decent elevation.
It should be noted that the height of the user would need to be calibrated into the system as the altitude of the hat located mounting system would vary between individuals.
In order to get the sensor mounted on the brim of a baseball cap, a simple bracket was developed and 3D printed. It utilized 3 parts with bolts running through them. The brim of the cap is
3 San Antonio Light House for the Blind Board Member/ USSA Lead
Testing Engineer/ Chairmen of the USAA Accessibility User Group

3
sandwiched between platform 1 & 2 while the sensor is captured between 2 & 3. This simple method allows the sensor to be held at some angle down from the horizontal. Detailed Drawings and pictures of the mounting system can be seen in Appendix B Bracket Drawings/Design. Controls and Wiring
The controller selected to interface with the two proximity sensors was and Arduino Uno R3. The schematic shown in Figure 2 shows the Arduino wired to a single sensor and the alert system. The sensors could be wired in at the same time in parallel taking another analog slot or interchanged. In the interest of simplicity, the sensors were used one at a time to eliminate any possible interference. Each sensor required 5V of power from the Arduino and had an Analog Output Voltage between .5 and 4.5V which is a standard operating range for the Arduino. The sensors and alert systems were grounded separately and a capacitor was added between the power and ground of the sensor to clean up noise in the system for a more accurate reading. The alert system utilized two LEDs and a Buzzer to alert the user in the event of a detected drop off. These components utilized 3 digital outlets as seen in the diagram.
Figure 2 Wiring Diagram
Code Development
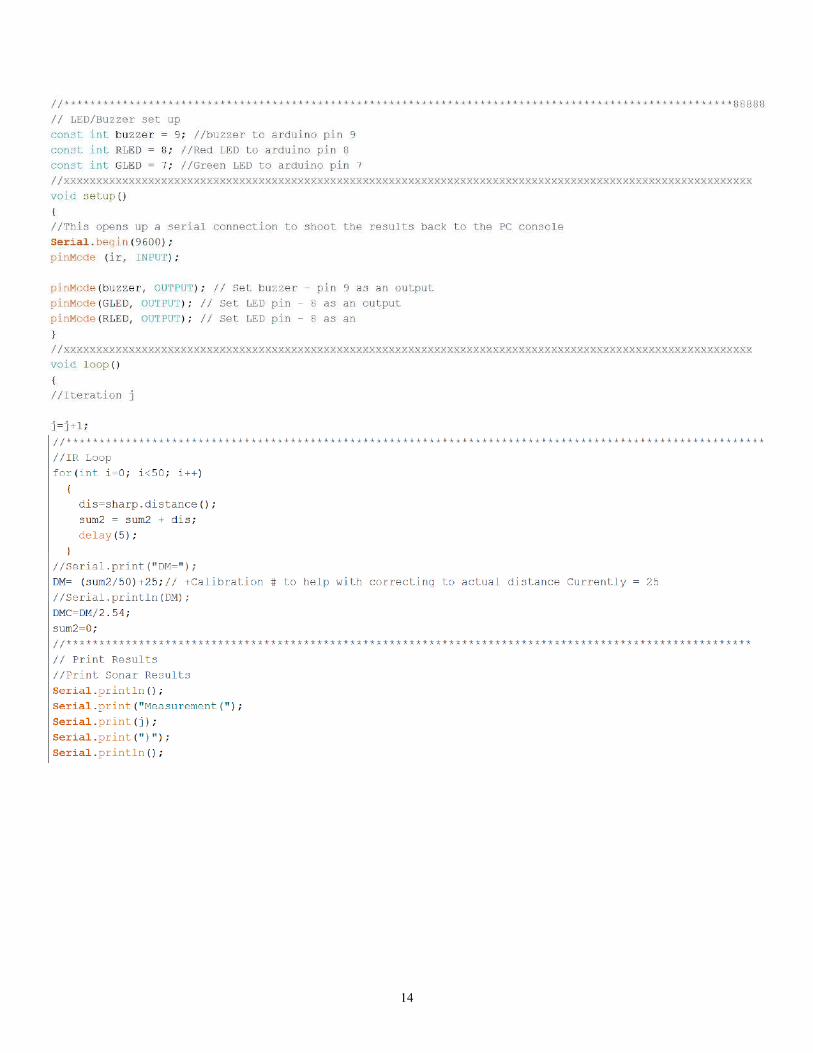
Coding for this system was closely tied to how the system was wired. The complete code with descriptive call outs as well as wiring diagrams schematics and pictures can be found in Appendix C Wiring Controls & Code. This section will cover the main points of the code. Step 1 is to setup and initialize libraries, integer variables, and defined input or output variables. The code shows setup sections for the Ultrasonic sensor (nicknamed sonar), the IR sensor and its library, and the LEDs and Buzzer. Later in the experiment the Ultrasonic sensor was found to be
unreliable and was cut from the final code, but it had a similar build to the IR sensor coding we will discuss. Step 2 in the code in the void setup section. In this section which runs once at the beginning of the code, pins are defined as input or output pins. In this project, the analog sensor pin is the input and the Alert system is the output. Additionally, a serial port is opened so that the program can be tested against a readout on a computer during development. Step 3 starts in the void loop which is repeated as long as the system is active or until it has overloaded. In step 3 the sensors signal is sampled and averaged. The averaged value is converted to inches and displayed on the serial readout. These averaged measurements are numbered as they are sent to the serial monitor. Step 4 in the code is the logic portion. This is found at the end of the void loop. The Logic portion is a series of if statements which compare the averaged measurements to calibrated ranges. Depending on what range the measurement falls in, the if statements can categorize the measurement as a detected drop off or normal ground. If a drop off is detected the Red LED is illuminated and the Buzzer sounds at a designated frequency. “Drop Detected” is sent with the measurement to the serial monitor. If no drop off is detected the Green LED is illuminated and “No Drop Detected” is sent with the measurement to the serial monitor. The system is relatively simple and the final code is meant to interface with a computer. A standalone system would need its own power source. All the serial port and monitoring lines could be eliminated from the code to increase operating speed and thus reduce the reaction time of the code in detecting a drop off. Experiments
Over the course of the project there were three experiments conducted. The sensor comparison and mounting angle experiments were conducted to help make key decisions about the final system. The final validation test was conducted to determine if the final system could actually benefit a user across a variety of encounters with drop offs. Sensor Comparison and Rough Angle Optimization
The first experiment is designed to determine which sensor if any would be feasible for the project. Each sensor was tested at a variety of angles utilizing a wooden jig. The sensors were mounted to a block of wood on the larger structure which was roughly 6 3” off the ground. The block was allowed to rotate allowing a variety of angles to be tested. Each sensor was tested at angles of 0deg (Horizontal to the ground) to 90deg(Pointing at the ground) in 5 degree increments. The jig was set up in an empty hallway so that any measurement was a result of the ground only. In other words, at 0 degrees the nearest wall was far outside the range of the sensor resulting in no feedback from the sensor at all.

4
Figure 3 Sensor Testing Jig on Roller
Figure 4 Sensor Block Adjustable Mounting Angle
The procedure for this experiment was to upload the
program to the Arduino with the sensor in the 0deg orientation. A level built into a smartphone was calibrated and used to determine what was level. Watch the readout on the serial port and record the measurement value in excel. Make note of any
extreme variation or outlier measurements. For the next reading, the mounting block was adjusted by rotating it about the center bolt. Using the same smartphone level, the block was rotated until it was 5deg below level. The measurement new measurement was recorded and the process is repeated until the sensor is pointing straight down. The experiment is repeated for the second sensor.
Results can be graphed to derive trends. These will be compared to a theoretical measurement which the sensor should be detecting. The theoretical measurement is found using a small amount of trigonometry. Using the known height of the sensor (H) and the angle of orientation (θ) the theoretical sensor reading (T) can be found.
𝑇ℎ𝑒𝑜𝑟𝑒𝑡𝑖𝑐𝑎𝑙 𝑆𝑒𝑛𝑠𝑜𝑟 𝑅𝑒𝑎𝑑𝑖𝑛𝑔 = 𝑇 =𝐻
sin 𝜃
At each angle it can also be determined how far in front of the user the sensor is detecting the ground or lack there of. This theoretical distance (D) forward can be found using the theoretical sensor reading and the height of the sensor.
𝑇ℎ𝑒𝑜𝑟𝑒𝑡𝑖𝑐𝑎𝑙 𝐷𝑖𝑠𝑡𝑎𝑛𝑐𝑒 = 𝑇9 − 𝐻9
This theoretical distance is compared to the reach of a seeing
cane to determine the feasibility of that angle setting. Cane reach (DC) is determined by the height of the waist of the user (HW) and the length of the cane(C).
𝐷𝐶 = ( 𝐶9 − 𝐻𝑊9
If the sensor is capable of consistently reading close to the theoretical sensor reading at an angle which the theoretical distance is higher than the canes reach it will be feasible for the projects application.
Figure 5 Variable Visualization
Figure 6 Cap Mounted Sensor Orientation

5
Dynamic Fine Angle Optimization
The first experiment narrowed the possible angles down to a smaller range as well as determined which sensor is superior for this application. This sensor was then be tested dynamically. The jig discussed is built to fit on a rolling platform. For the smaller range of angles in 5deg increments, the jig was rolled towards a drop off. When the system activated the alert system the test is stopped and the distance to the drop off is measured and recorded using a measuring tape. The sensor measurement before and after the drop off was used to help fine tune the logic in the program to know what kind of numbers the sensor outputs when presented with normal ground versus a drop. This portion of the experiment was designed to determine what the optimal sensor mounting angle would be as well as if the sensor could be used in a dynamic setting to detect a drop off. The results of this section would allow for final system fabrication and fine tuning of the code before validation testing.
Image??? Validation Test
Once the sensor and mounting, wiring, and coding where complete, the system was able to utilize the LEDs and Buzzer to give visual and audible ques about what it was sensing. These were tested while scrutinizing the actual sensor measurements to determine what conclusion the logic should be coming to and the system acted as intended. Completing this step allowed validation testing to begin.
The Validation Test was the final experiment conducted. Using the final system configuration and code a series of trials were completed on various drop offs. The user with the cap mounted system walks at normal walking speed towards various drop offs like stairs, exposed balconies, or other potentially hazardous drop offs. When the system alerts them of a drop off they stop and the distance to the drop off is measured. If the distance is greater than the reach of a seeing cane, the trial is a success. If the drop off is not detected or detected too late the trial is a failure. 30 trials were to be conducted on each drop off type encountered to gather significant data. This can help to determine the chances of detecting the drop and the chances of the detection coming in time.
Validation testing is important because it shows that the final system with no alterations between test can operate on a variety of drop off types and encounters as well as prove the system does not alert the user when various regular grounds are encountered.
RESULTS
Sensor Comparison and Rough Angle Optimization The initial test results illustrated the capabilities of the IR
and ultrasonic sensors. Testing at a variety of angles were compared with the theoretical results to determine which sensor performed best.
Figure 7 Angle Test /Sensor Comparison
0.050.0
100.0150.0200.0250.0300.0350.0400.0450.0500.0550.0600.0650.0700.0750.0800.0850.0900.0950.01000.0
0 5 1015202530354045505560657075808590
Distance in cm
Angle of Drop from Horizontal in degrees
Sonar VS IR sensing tile floor at an angle.
Sensor Reading Sonar cm
Sensor Reading IR cm
Expected (Calculated) cm

6
More detailed results can be found in Appendix D Results, but the graph in Figure 7 is the main take away from this experiment. This graph shows the results of IR and Ultrasonic Sensor readings at varying angles compared to the theoretical or expected reading.
Figure 8 Sensor vs cane Reach
Figure 8 is a secondary graph which shows which angles would theoretically see farther than a seeing can to narrow the range of feasible mounting angles further.
Fine Tuning Mounting Angle
This experiments results were used to determine the optimal mounting angle for the sensor and confirmed that it could be used dynamically to alert the user to an impending drop in their direction of travel. The initial test narrowed down the range of angles tested to between 25 and 45 degrees. The detailed results of this section are found in Appendix D Results. The main point taken away from this test was that a 35 deg mounting angle gave the best advantage as far as distance forward detected while staying consistent. This experiment also proved that the sensor could follow the theoretical reading curve well and would make some major change in reading when confronted with a drop off.
Figure 9 Sensor Values Pre/Post Drop Off
Validation Test
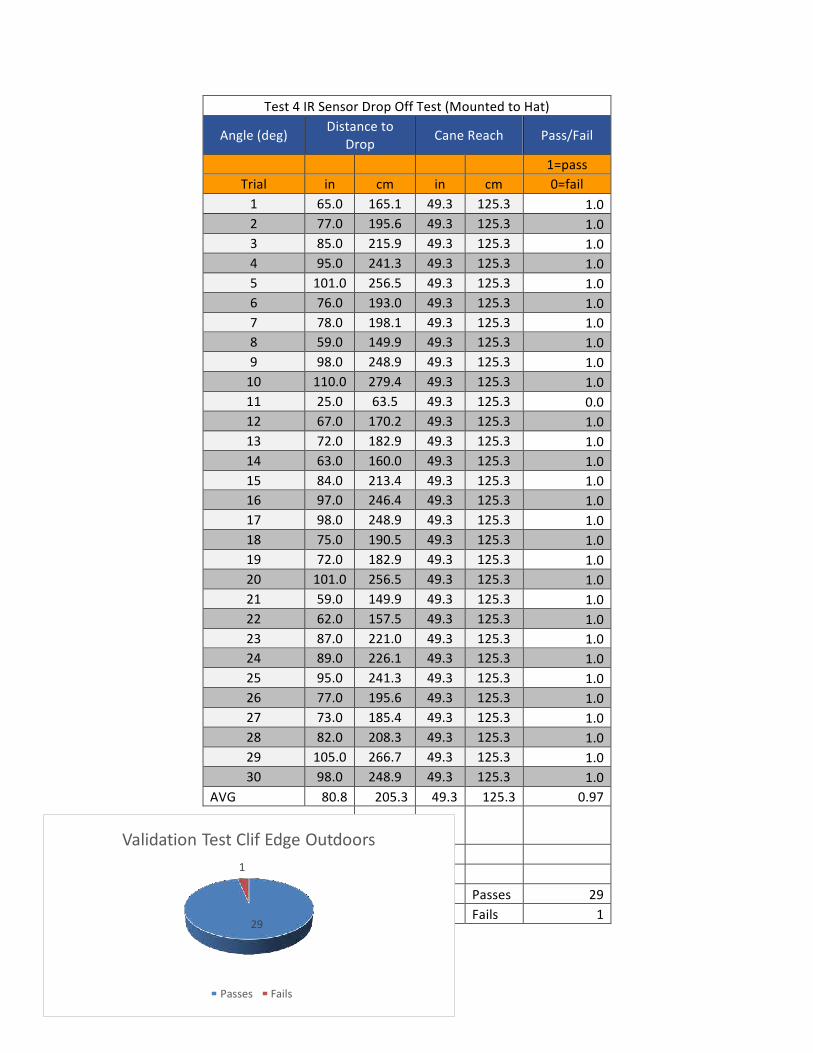
Validation testing results from various drop offs encountered yielded promising numbers. On stair cases there was a 90% success rate. On a straight drop off of about 4ft (like a train platform) there was a 97% detection rate. Never was the drop off not detected, but the failures are when the sensor did not alert the user of a drop off before the walking cane would have reached the edge.
Figure 10 100% Detection Rate 90% Success Rate
0.0
50.0
100.0
150.0
200.0
250.0
300.0
350.0
400.0
0 5 1015202530354045505560657075808590
Distance in cm
Angle of Drop from Horizontal in degrees
Potential Reach Extension
Theoretical IR Sensor Reach Cane Reach
0.0
500.0
1000.0
25 30 35 40 45
Distance in cm
Angle of Drop from Horizontal in degrees
IR Dynamic Drop Off Test
Expected (Calculated)
Sensor Reading IR Pre Drop
Sensor Reading IR Post Drop
27
3
Validation Test Staircase Outdoors
Passes Fails

7
Figure 11 100% Detection Rate 90% Success Rate
Figure 12 100% Detection Rate 97% Success Rate
DISCUSSION
Initial Testing Impact The point of initial testing was to compare IR and ultrasonic
sensors while also determining what mounting angles were possible. This test determined immediately that the IR sensor was not only capable of detecting the ground at different angles, but it was also able to do it with accuracy. The ultrasonic sensor did eventually detect the ground, but the results varied wildly. This led to the decision to use the IR sensor for the final build.
Initial testing also revealed that the IR sensor could detect the ground accurately when mounted at 25deg-90deg angles. In order for the IR sensor to see father than a seeing cane it had to be mounted at an angle greater than 45 deg. This set the stage for fine tuning and building as it narrowed the mounting angle window substation ally. Fine Tuning and Building
Even though the initial testing was successful in narrowing the mounting angles and selecting a sensor. It was questionable whether the sensor would continue to perform during dynamic testing. The fine-tuning test results confirm that, as the sensor was rolled towards a drop off on the jig, it continued to sense the ground in an accurate way until it encountered the drop off at which time it took a sudden jump. This allows for a program to tell the difference between what is and is not a drop off. The fine tuning test resulted in the choice of a mounting angle which
could be designed into the mounting bracket for the final configuration. The 25 deg to 40 deg range generally worked so choosing a middle ground angle meant that any angle error from head or hat positioning would be 35deg plus or minus some 5 deg. This error would still fall into an operational range. The final system was built following this test and prepared for validation testing. Validation Impact on Feasibility
The final system was constructed based on the first two initial test to be ready for validation testing.
Figure 13 Final System
The cap mounted bracket fit well with the sensor, but could use some adjustment to insure straightness.
Figure 14 Sensor Mounting Bracket
The same controls system used in the initial two test was used again in validation testing.
27
3
Validation Test Staircase Indoors
Passes Fails
29
1
Validation Test Clif Edge Outdoors
Passes Fails
8
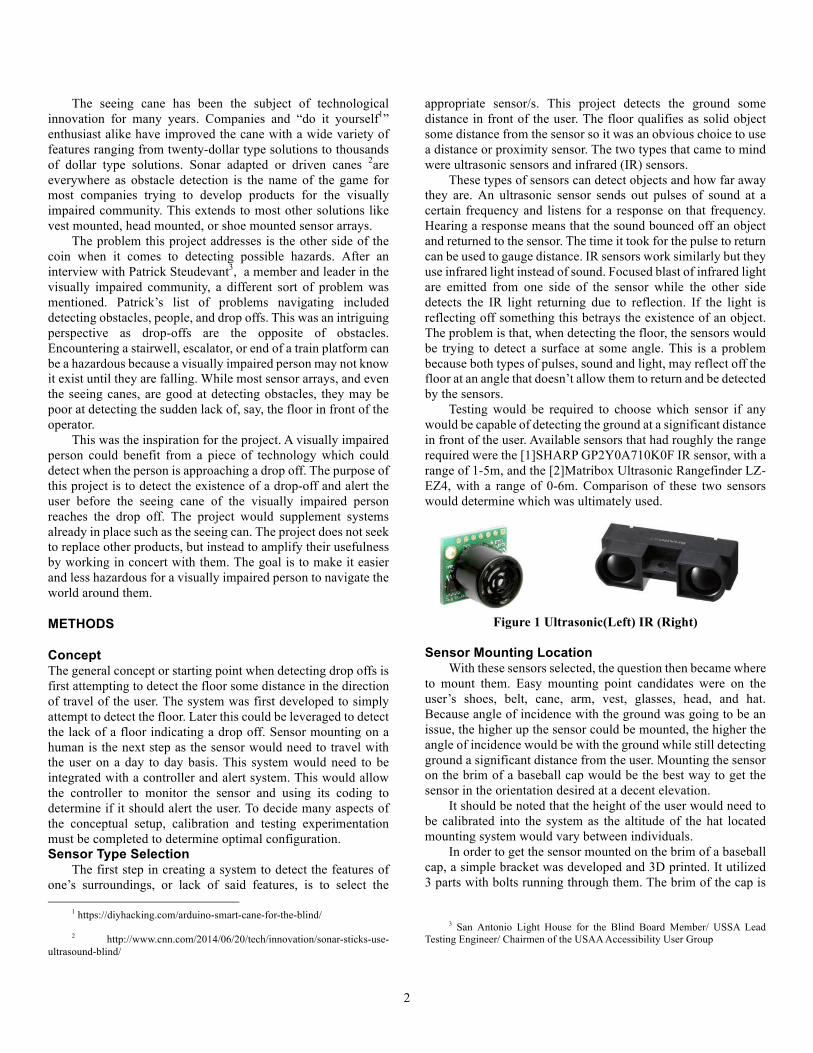
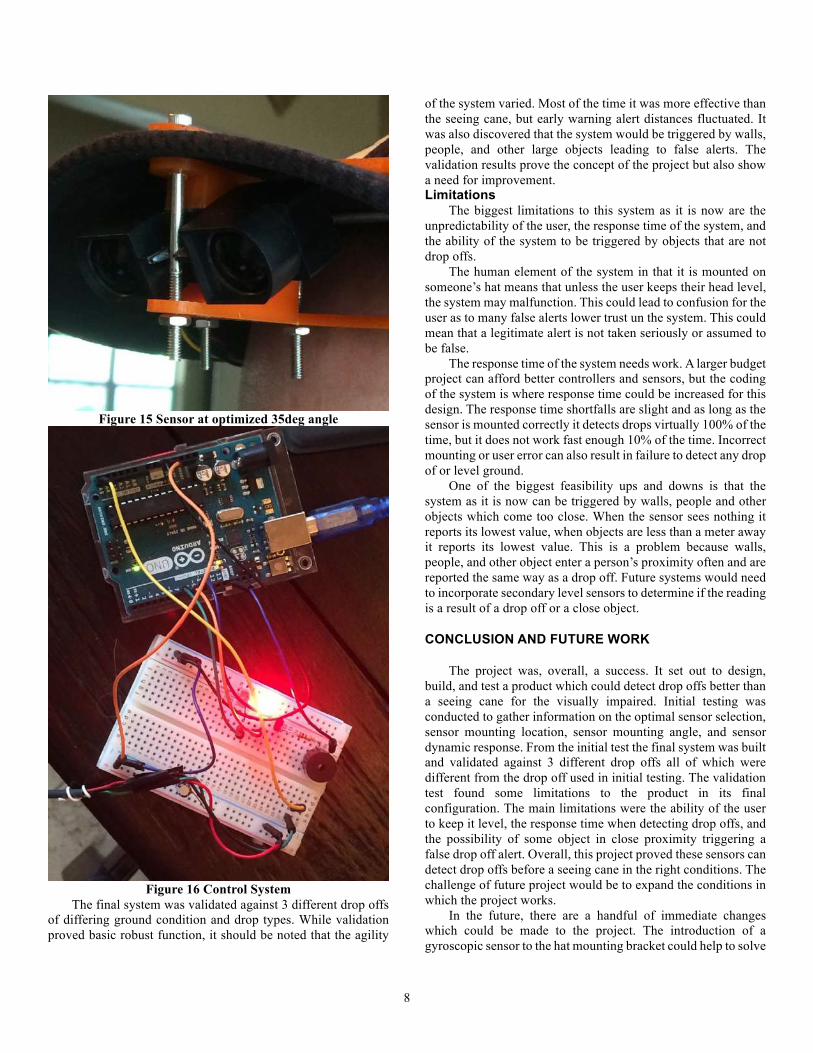
Figure 15 Sensor at optimized 35deg angle
Figure 16 Control System
The final system was validated against 3 different drop offs of differing ground condition and drop types. While validation proved basic robust function, it should be noted that the agility
of the system varied. Most of the time it was more effective than the seeing cane, but early warning alert distances fluctuated. It was also discovered that the system would be triggered by walls, people, and other large objects leading to false alerts. The validation results prove the concept of the project but also show a need for improvement. Limitations
The biggest limitations to this system as it is now are the unpredictability of the user, the response time of the system, and the ability of the system to be triggered by objects that are not drop offs.
The human element of the system in that it is mounted on someone’s hat means that unless the user keeps their head level, the system may malfunction. This could lead to confusion for the user as to many false alerts lower trust un the system. This could mean that a legitimate alert is not taken seriously or assumed to be false.
The response time of the system needs work. A larger budget project can afford better controllers and sensors, but the coding of the system is where response time could be increased for this design. The response time shortfalls are slight and as long as the sensor is mounted correctly it detects drops virtually 100% of the time, but it does not work fast enough 10% of the time. Incorrect mounting or user error can also result in failure to detect any drop of or level ground.
One of the biggest feasibility ups and downs is that the system as it is now can be triggered by walls, people and other objects which come too close. When the sensor sees nothing it reports its lowest value, when objects are less than a meter away it reports its lowest value. This is a problem because walls, people, and other object enter a person’s proximity often and are reported the same way as a drop off. Future systems would need to incorporate secondary level sensors to determine if the reading is a result of a drop off or a close object.
CONCLUSION AND FUTURE WORK
The project was, overall, a success. It set out to design, build, and test a product which could detect drop offs better than a seeing cane for the visually impaired. Initial testing was conducted to gather information on the optimal sensor selection, sensor mounting location, sensor mounting angle, and sensor dynamic response. From the initial test the final system was built and validated against 3 different drop offs all of which were different from the drop off used in initial testing. The validation test found some limitations to the product in its final configuration. The main limitations were the ability of the user to keep it level, the response time when detecting drop offs, and the possibility of some object in close proximity triggering a false drop off alert. Overall, this project proved these sensors can detect drop offs before a seeing cane in the right conditions. The challenge of future project would be to expand the conditions in which the project works.
In the future, there are a handful of immediate changes which could be made to the project. The introduction of a gyroscopic sensor to the hat mounting bracket could help to solve

9
the problem of unsteadiness in the user. It could potentially correct for head positioning or disable the system in the event of a loss of acceptable sensor orientation.
The best way to increase response time of the sensors would to be shortening the code down and playing with the clock speed of the controller used. More expensive sensors may be able to more accurately detect drop offs and may be utilized as well. The best way to make this system better will probably be the addition of more sensors.
The way the system works now is by categorizing sensor inputs as in the drop off range or in the non-drop off range. If there where say three sensors stacked on top of each other at different mounting angles than this concept could be changed. Instead of looking at the sensor input directly, comparison of the sensor results could be conducted to determine if the difference in values was a drop off or obstacle. Repeating this configuration 3 or more around the brim of the cap, facing to the left and right of center, would expand the system’s ability to detect objects and drop offs in the area around the user instead of only in their direction of travel. With alteration, there will come new challenges, but this project could contribute to changing the way the visually impaired navigate there surroundings.
ACKNOWLEDGMENTS
Thank you to Dr. Bhounsule for allowing me to work in the lab and pursue an independent project of my own choosing. Thank you to the RAM Lab for their support, discussions, and advice over the course of project.
REFERENCES
[1] “MaxSonar EZ™ LV MaxSonar EZ™ Series - MaxBotix Inc.” [Online]. Available: http://www.bing.com/cr?IG=9196AA794F184CC1BE1A295C7B57573C&CID=17D17330DCDE6B8F1D21794EDD4E6ADC&rd=1&h=qB1S9PrBhCYfa8ehKKeaCJmtONL-GSShAvfFQj8cg9s&v=1&r=http%3a%2f%2fmaxbotix.com%2fdocuments%2fLV-MaxSonar-EZ_Datasheet.pdf&p=DevEx,5061.1. [Accessed: 10-May-2017].
[2] “SHARP IR” [Online] Available https://cdn-shop.adafruit.com/datasheets/gp2y0a710k.pdf [Accessed 10-May-2017]
[3] 1999, “ASME Template Sample” [Online]. Available: https://www.asme.org/getmedia/3df72b8c-3984-46fa-a4eb-8b118ed8a69b/author-templates-asmetemplate-sample.aspx. [Accessed: 20-Jun-2016].
[4] 2016, “Formatting the Paper,” Guide to Conference Publications [Online]. Available: https://www.asme.org/shop/proceedings/conference-
publications/formatting-the-paper. [Accessed: 20-Jun-2016].
10
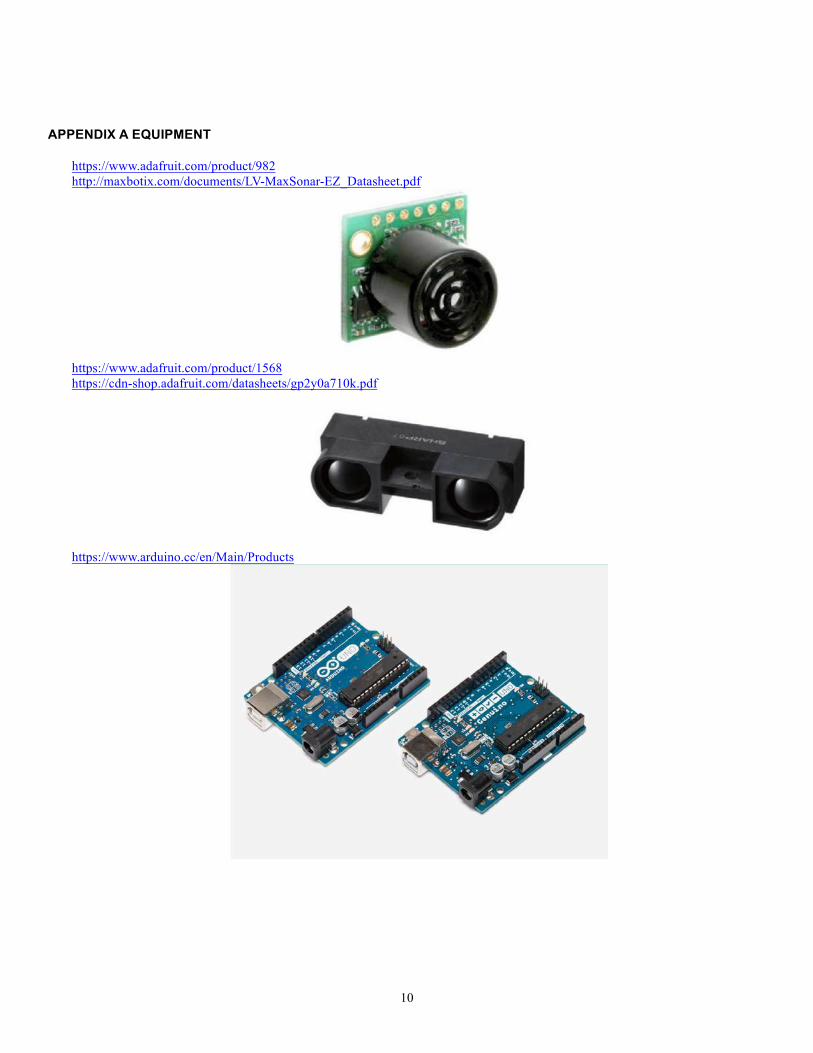
APPENDIX A EQUIPMENT
https://www.adafruit.com/product/982 http://maxbotix.com/documents/LV-MaxSonar-EZ_Datasheet.pdf
https://www.adafruit.com/product/1568 https://cdn-shop.adafruit.com/datasheets/gp2y0a710k.pdf
https://www.arduino.cc/en/Main/Products

11
APPENDIX B BRACKET DRAWINGS/DESIGN

12
APPENDIX C WIRING CONTROLS & CODE

13
14

15
16
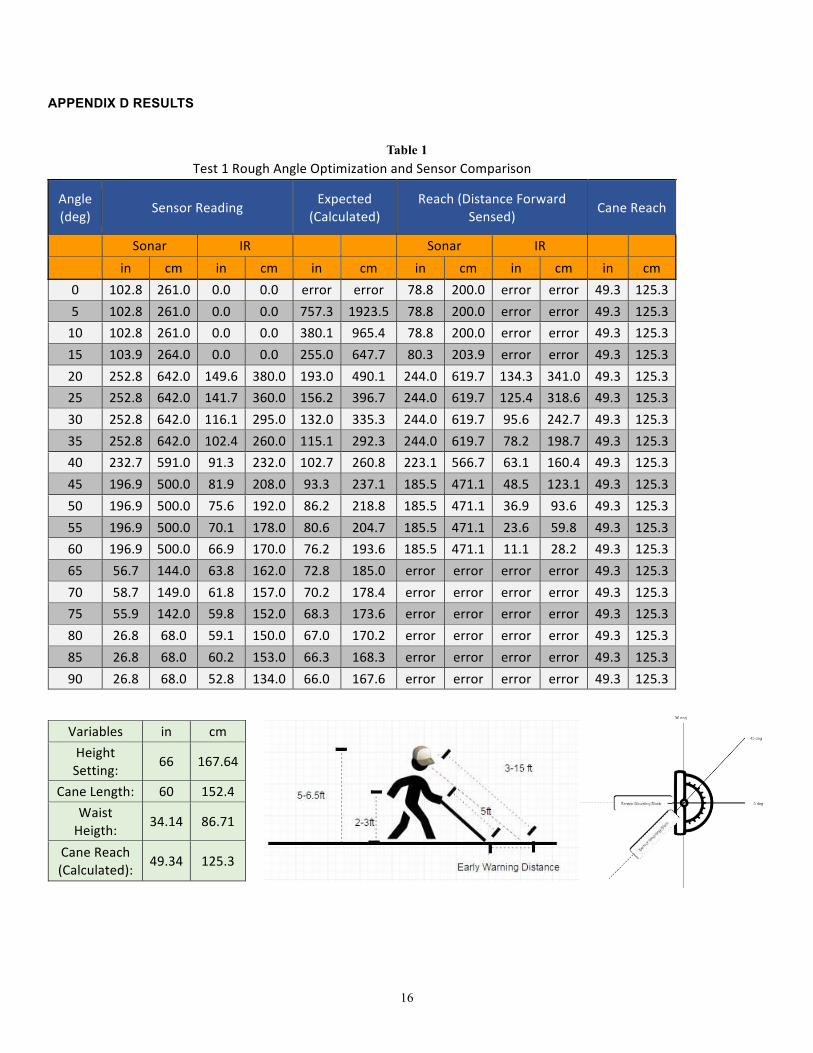
APPENDIX D RESULTS
Table 1
Test 1 Rough Angle Optimization and Sensor Comparison
Angle (deg) Sensor Reading Expected
(Calculated) Reach (Distance Forward
Sensed) Cane Reach
Sonar IR Sonar IR
in cm in cm in cm in cm in cm in cm 0 102.8 261.0 0.0 0.0 error error 78.8 200.0 error error 49.3 125.3 5 102.8 261.0 0.0 0.0 757.3 1923.5 78.8 200.0 error error 49.3 125.3 10 102.8 261.0 0.0 0.0 380.1 965.4 78.8 200.0 error error 49.3 125.3 15 103.9 264.0 0.0 0.0 255.0 647.7 80.3 203.9 error error 49.3 125.3 20 252.8 642.0 149.6 380.0 193.0 490.1 244.0 619.7 134.3 341.0 49.3 125.3 25 252.8 642.0 141.7 360.0 156.2 396.7 244.0 619.7 125.4 318.6 49.3 125.3 30 252.8 642.0 116.1 295.0 132.0 335.3 244.0 619.7 95.6 242.7 49.3 125.3 35 252.8 642.0 102.4 260.0 115.1 292.3 244.0 619.7 78.2 198.7 49.3 125.3 40 232.7 591.0 91.3 232.0 102.7 260.8 223.1 566.7 63.1 160.4 49.3 125.3 45 196.9 500.0 81.9 208.0 93.3 237.1 185.5 471.1 48.5 123.1 49.3 125.3 50 196.9 500.0 75.6 192.0 86.2 218.8 185.5 471.1 36.9 93.6 49.3 125.3 55 196.9 500.0 70.1 178.0 80.6 204.7 185.5 471.1 23.6 59.8 49.3 125.3 60 196.9 500.0 66.9 170.0 76.2 193.6 185.5 471.1 11.1 28.2 49.3 125.3 65 56.7 144.0 63.8 162.0 72.8 185.0 error error error error 49.3 125.3 70 58.7 149.0 61.8 157.0 70.2 178.4 error error error error 49.3 125.3 75 55.9 142.0 59.8 152.0 68.3 173.6 error error error error 49.3 125.3 80 26.8 68.0 59.1 150.0 67.0 170.2 error error error error 49.3 125.3 85 26.8 68.0 60.2 153.0 66.3 168.3 error error error error 49.3 125.3 90 26.8 68.0 52.8 134.0 66.0 167.6 error error error error 49.3 125.3
Variables in cm Height Setting: 66 167.64
Cane Length: 60 152.4 Waist Heigth: 34.14 86.71
Cane Reach (Calculated): 49.34 125.3

17
Figure 17
0.0
50.0
100.0
150.0
200.0
250.0
300.0
350.0
400.0
450.0
500.0
550.0
600.0
650.0
700.0
750.0
800.0
850.0
900.0
950.0
1000.0
0 5 10 15 20 25 30 35 40 45 50 55 60 65 70 75 80 85 90
Distance in cm
Angle of Drop from Horizontal in degrees
Sonar VS IR sensing tile floor at an angle.
Sensor Reading Sonar cm Sensor Reading IR cm Expected (Calculated) cm
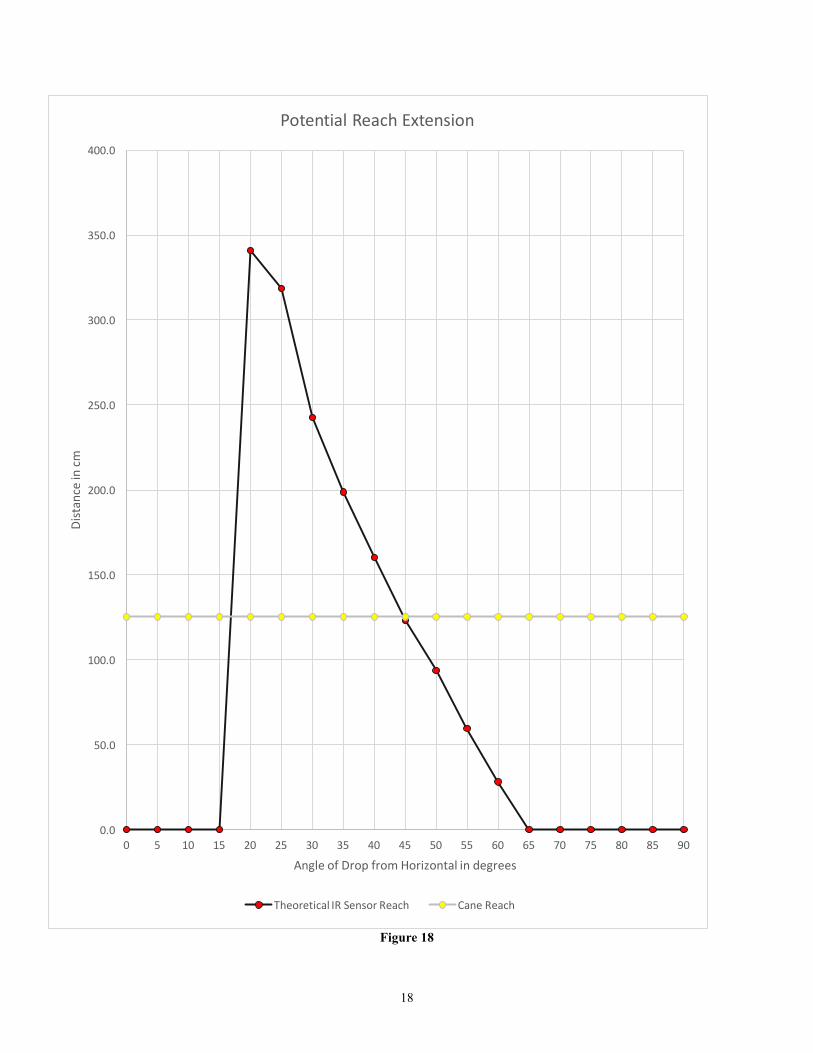
18
Figure 18
0.0
50.0
100.0
150.0
200.0
250.0
300.0
350.0
400.0
0 5 10 15 20 25 30 35 40 45 50 55 60 65 70 75 80 85 90
Distance in cm
Angle of Drop from Horizontal in degrees
Potential Reach Extension
Theoretical IR Sensor Reach Cane Reach

19
Table 2 Test 2 IR Sensor Drop Off Test (Dynamic Fine Angle Calibration On Rig)
Angle (deg) Sensor Reading Distance to Drop Cane Reach
Pre-‐Drop Post-‐Drop
in cm in cm in cm in cm 0 0.0 0.0 0.0 0.0 0.0 0.0 49.3 125.3 5 0.0 0.0 0.0 0.0 0.0 0.0 49.3 125.3 10 0.0 0.0 0.0 0.0 0.0 0.0 49.3 125.3 15 0.0 0.0 0.0 0.0 0.0 0.0 49.3 125.3 20 0.0 0.0 0.0 0.0 0.0 0.0 49.3 125.3 25 147.6 375.0 9.8 25.0 131.0 332.7 49.3 125.3 30 127.6 324.0 9.8 25.0 102.0 259.1 49.3 125.3 35 115.7 294.0 9.8 25.0 80.0 203.2 49.3 125.3 40 100.8 256.0 9.8 25.0 56.0 142.2 49.3 125.3 45 94.1 239.0 162.2 412.0 27.0 68.6 49.3 125.3 50 0.0 0.0 0.0 0.0 0.0 0.0 49.3 125.3 55 0.0 0.0 0.0 0.0 0.0 0.0 49.3 125.3 60 0.0 0.0 0.0 0.0 0.0 0.0 49.3 125.3 65 0.0 0.0 0.0 0.0 0.0 0.0 49.3 125.3 70 0.0 0.0 0.0 0.0 0.0 0.0 49.3 125.3 75 0.0 0.0 0.0 0.0 0.0 0.0 49.3 125.3 80 0.0 0.0 0.0 0.0 0.0 0.0 49.3 125.3 85 0.0 0.0 0.0 0.0 0.0 0.0 49.3 125.3 90 0.0 0.0 0.0 0.0 0.0 0.0 49.3 125.3

20
Figure 19
0.0
100.0
200.0
300.0
400.0
500.0
600.0
700.0
800.0
900.0
1000.0
25 30 35 40 45
Distance in cm
Angle of Drop from Horizontal in degrees
IR Dynamic Drop Off Test
Expected (Calculated) Sensor Reading IR Pre Drop Sensor Reading IR Post Drop
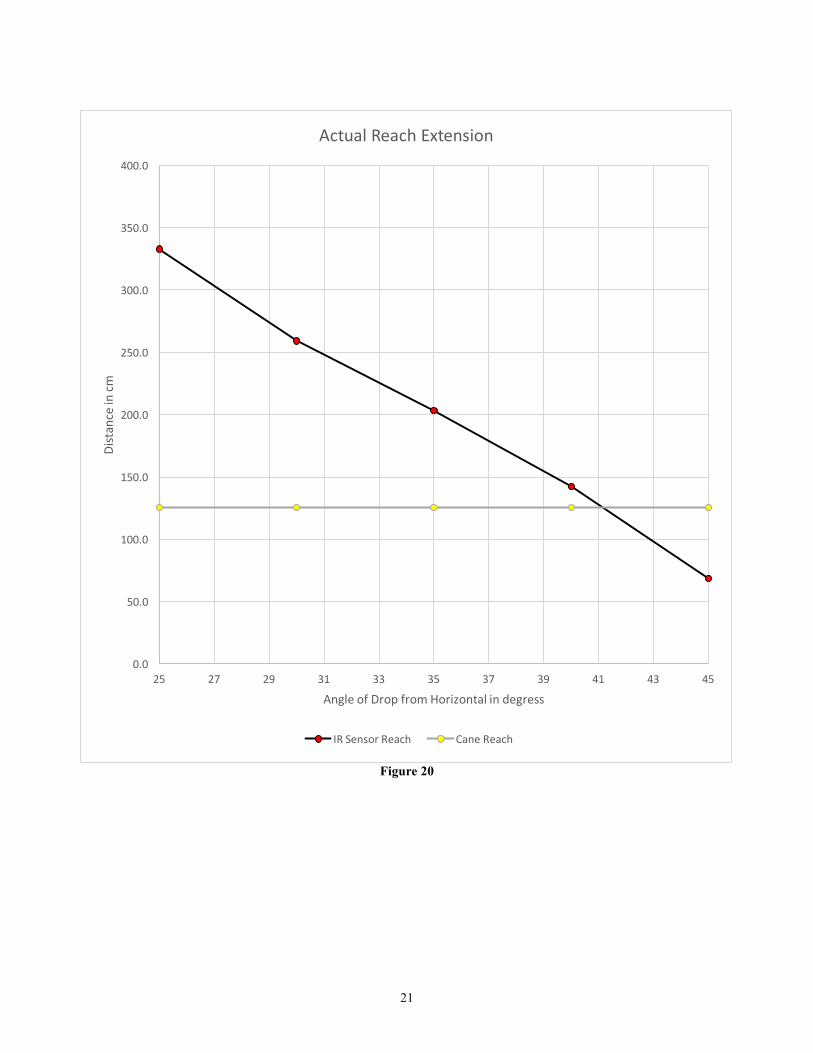
21
Figure 20
0.0
50.0
100.0
150.0
200.0
250.0
300.0
350.0
400.0
25 27 29 31 33 35 37 39 41 43 45
Distance in cm
Angle of Drop from Horizontal in degress
Actual Reach Extension
IR Sensor Reach Cane Reach

22
Table 3 Test 4 IR Sensor Drop Off Test (Mounted to Hat)
Angle (deg) Distance to Drop Cane Reach Pass/Fail
1=pass Trial in cm in cm 0=fail 1 94.0 238.8 49.3 125.3 1.0 2 85.0 215.9 49.3 125.3 1.0 3 117.0 297.2 49.3 125.3 1.0 4 81.0 205.7 49.3 125.3 1.0 5 82.0 208.3 49.3 125.3 1.0 6 98.0 248.9 49.3 125.3 1.0 7 115.0 292.1 49.3 125.3 1.0 8 95.0 241.3 49.3 125.3 1.0 9 93.0 236.2 49.3 125.3 1.0 10 115.0 292.1 49.3 125.3 1.0 11 97.0 246.4 49.3 125.3 1.0 12 100.0 254.0 49.3 125.3 1.0 13 117.0 297.2 49.3 125.3 1.0 14 120.0 304.8 49.3 125.3 1.0 15 83.0 210.8 49.3 125.3 1.0 16 20.0 50.8 49.3 125.3 0.0 17 50.0 127.0 49.3 125.3 1.0 18 125.0 317.5 49.3 125.3 1.0 19 135.0 342.9 49.3 125.3 1.0 20 103.0 261.6 49.3 125.3 1.0 21 30.0 76.2 49.3 125.3 0.0 22 70.0 177.8 49.3 125.3 1.0 23 98.0 248.9 49.3 125.3 1.0 24 106.0 269.2 49.3 125.3 1.0 25 126.0 320.0 49.3 125.3 1.0 26 126.0 320.0 49.3 125.3 1.0 27 10.0 25.4 49.3 125.3 0.0 28 93.0 236.2 49.3 125.3 1.0 29 95.0 241.3 49.3 125.3 1.0 30 106 269.24 49.34 125.3 1.0
AVG 92.8 235.8 49.3 125.3 0.90 Passes 27 Fails 3 27
3
Validation Test Staircase Outdoors
Passes Fails

23
Test 4 IR Sensor Drop Off Test (Mounted to Hat)
Angle (deg) Distance to Drop Cane Reach Pass/Fail
1=pass Trial in cm in cm 0=fail 1 53.0 134.6 49.3 125.3 1.0 2 59.0 149.9 49.3 125.3 1.0 3 62.0 157.5 49.3 125.3 1.0 4 58.0 147.3 49.3 125.3 1.0 5 75.0 190.5 49.3 125.3 1.0 6 77.0 195.6 49.3 125.3 1.0 7 78.0 198.1 49.3 125.3 1.0 8 76.0 193.0 49.3 125.3 1.0 9 87.0 221.0 49.3 125.3 1.0 10 78.0 198.1 49.3 125.3 1.0 11 83.0 210.8 49.3 125.3 1.0 12 59.0 149.9 49.3 125.3 1.0 13 69.0 175.3 49.3 125.3 1.0 14 77.0 195.6 49.3 125.3 1.0 15 63.0 160.0 49.3 125.3 1.0 16 65.0 165.1 49.3 125.3 1.0 17 84.0 213.4 49.3 125.3 1.0 18 65.0 165.1 49.3 125.3 1.0 19 78.0 198.1 49.3 125.3 1.0 20 79.0 200.7 49.3 125.3 1.0 21 59.0 149.9 49.3 125.3 1.0 22 63.0 160.0 49.3 125.3 1.0 23 64.0 162.6 49.3 125.3 1.0 24 14.0 35.6 49.3 125.3 0.0 25 47.0 119.4 49.3 125.3 0.0 26 77.0 195.6 49.3 125.3 1.0 27 78.0 198.1 49.3 125.3 1.0 28 68.0 172.7 49.3 125.3 1.0 29 54.0 137.2 49.3 125.3 1.0 30 15.0 38.1 49.3 125.3 0.0
AVG 65.5 166.3 49.3 125.3 0.90
Passes 27 Fails 3
27
3
Validation Test Staircase Indoors
Passes Fails
24
Test 4 IR Sensor Drop Off Test (Mounted to Hat)
Angle (deg) Distance to Drop Cane Reach Pass/Fail
1=pass Trial in cm in cm 0=fail 1 65.0 165.1 49.3 125.3 1.0 2 77.0 195.6 49.3 125.3 1.0 3 85.0 215.9 49.3 125.3 1.0 4 95.0 241.3 49.3 125.3 1.0 5 101.0 256.5 49.3 125.3 1.0 6 76.0 193.0 49.3 125.3 1.0 7 78.0 198.1 49.3 125.3 1.0 8 59.0 149.9 49.3 125.3 1.0 9 98.0 248.9 49.3 125.3 1.0 10 110.0 279.4 49.3 125.3 1.0 11 25.0 63.5 49.3 125.3 0.0 12 67.0 170.2 49.3 125.3 1.0 13 72.0 182.9 49.3 125.3 1.0 14 63.0 160.0 49.3 125.3 1.0 15 84.0 213.4 49.3 125.3 1.0 16 97.0 246.4 49.3 125.3 1.0 17 98.0 248.9 49.3 125.3 1.0 18 75.0 190.5 49.3 125.3 1.0 19 72.0 182.9 49.3 125.3 1.0 20 101.0 256.5 49.3 125.3 1.0 21 59.0 149.9 49.3 125.3 1.0 22 62.0 157.5 49.3 125.3 1.0 23 87.0 221.0 49.3 125.3 1.0 24 89.0 226.1 49.3 125.3 1.0 25 95.0 241.3 49.3 125.3 1.0 26 77.0 195.6 49.3 125.3 1.0 27 73.0 185.4 49.3 125.3 1.0 28 82.0 208.3 49.3 125.3 1.0 29 105.0 266.7 49.3 125.3 1.0 30 98.0 248.9 49.3 125.3 1.0
AVG 80.8 205.3 49.3 125.3 0.97
Passes 29 Fails 1
29
1
Validation Test Clif Edge Outdoors
Passes Fails