dtf econ study opening slides - diesel technology forum · 27/09/2011 · – johnson matthey –...
TRANSCRIPT

9/27/2011
1
Welcome to the National Press ClubWelcome to the National Press ClubWashington, DC
September 28, 2011
Today’s Event
• Introductions
• Opening Remarks – DTF Executive Director Allen Schaeffer
• Presentation of Study Findings – Dr. Richard McCann, Aspen Environmental Group
• Questions
Copyright © 2011 Diesel Technology Forum
Dieselforum.org
Questions
• Luncheon

9/27/2011
2
Members of Diesel Technology Forum
– Amyris– BASF – BorgWarner
BOSCH
– Ford Motor Company– General Motors – Honeywell
– BOSCH– BP– Caterpillar Inc. – Chrysler– Corning– Cummins Inc. – Daimler – Deere & Company
– Johnson Matthey– Mazda North American Operations– MTU– Navistar – Terra Environmental Technologies– Umicore– Volkswagen of America– Volvo Group
Copyright © 2011 Diesel Technology Forum
Dieselforum.org
Deere & Company– Delphi Automotive– Donaldson Company– Dow Automotive
Volvo Group
Allied Members– Association of Diesel Specialists– Western States Petroleum
Association
Aspen Environmental Group
Environmental services focused on energy infrastructure› Contracts with many state and federal agencies› Reviewed environmental studies for most of
California’s large renewable and fossil-fueled power plants
Integrated Energy Analysis and Planning Division› Statewide and West-wide energy plans and
regulatory analyses
Copyright © 2011 Diesel Technology Forum
Dieselforum.org
regulatory analyses› Focused on AB 32 implementation
9/27/2011
3
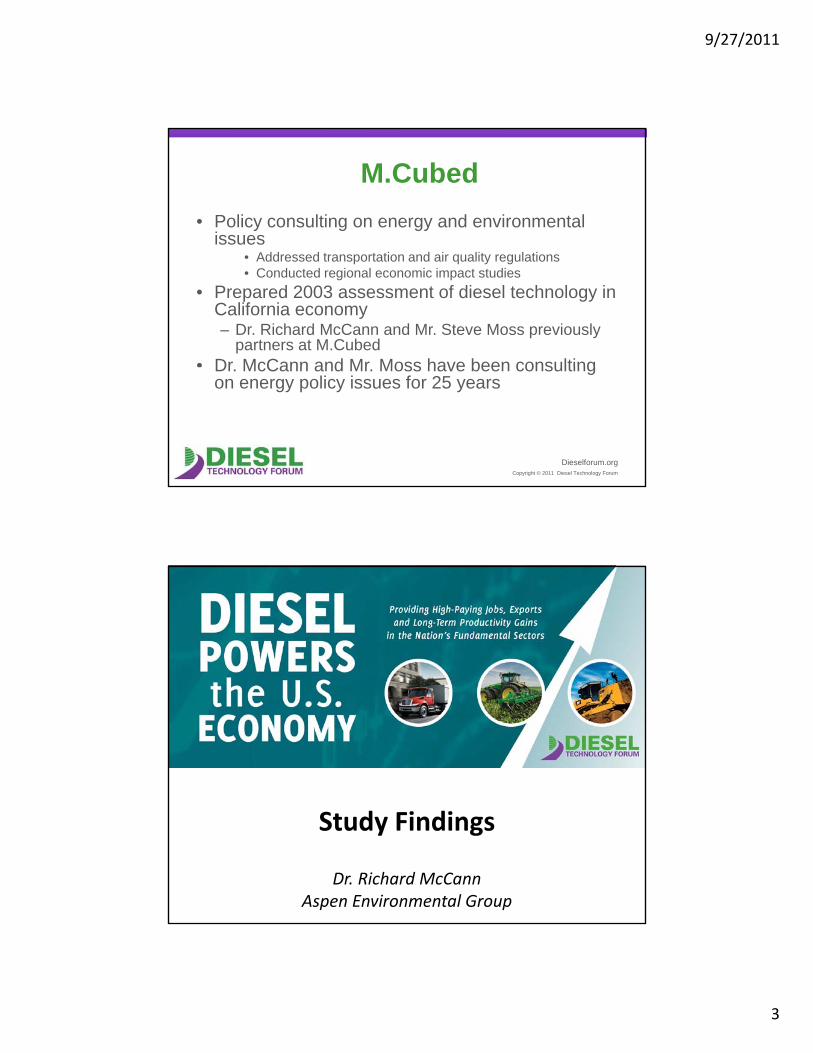
M.Cubed
• Policy consulting on energy and environmental issues
• Addressed transportation and air quality regulations• Conducted regional economic impact studies
• Prepared 2003 assessment of diesel technology in California economy– Dr. Richard McCann and Mr. Steve Moss previously
partners at M.Cubed• Dr McCann and Mr Moss have been consulting
Copyright © 2011 Diesel Technology Forum
Dieselforum.org
Dr. McCann and Mr. Moss have been consulting on energy policy issues for 25 years
Study Findings
Dr. Richard McCann Aspen Environmental Group

9/27/2011
Aspen Environmental Group 1
Richard McCann MPP PhDRichard McCann, MPP, PhDAspen Environmental Group
with M.CubedFor the Diesel Technology Forum
September 28, 2011
9/27/2011
Aspen Environmental Group 2
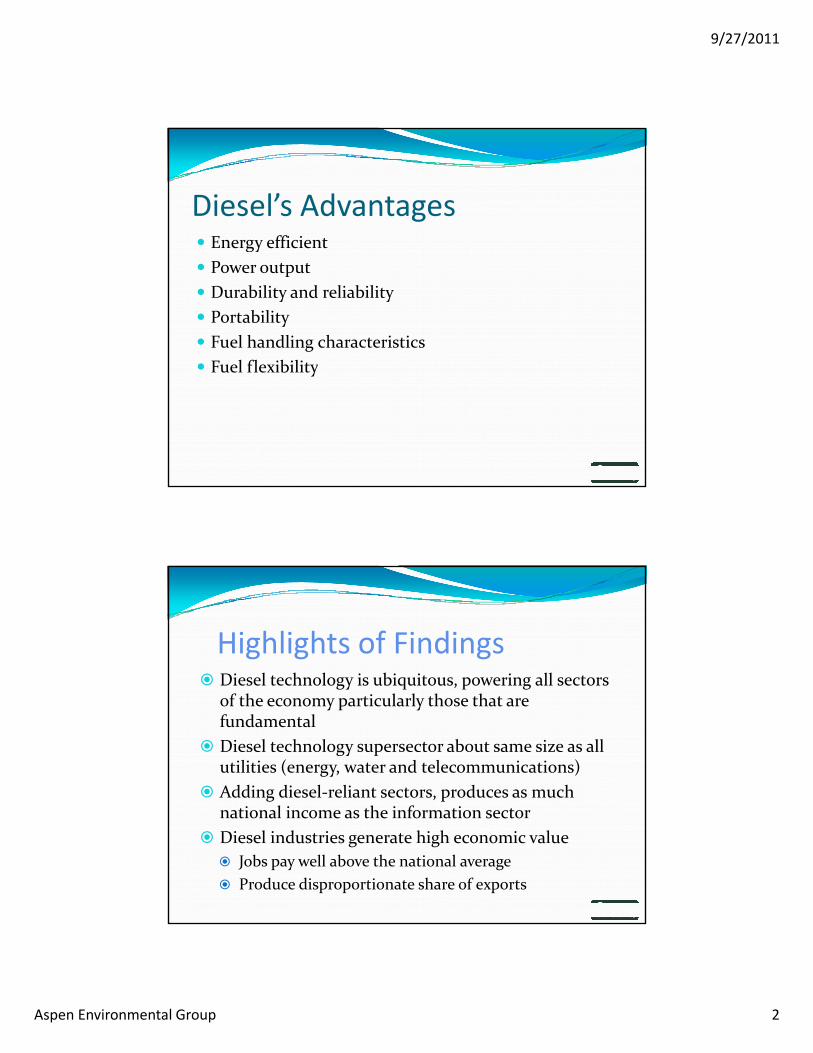
Diesel’s Advantages Energy efficientEnergy efficient
Power output
Durability and reliability
Portability
Fuel handling characteristics
Fuel flexibility Fuel flexibility
Highlights of Findings Diesel technology is ubiquitous, powering all sectors Diesel technology is ubiquitous, powering all sectors
of the economy particularly those that are fundamental
Diesel technology supersector about same size as all utilities (energy, water and telecommunications)
Adding diesel‐reliant sectors, produces as much national income as the information sector
Diesel industries generate high economic value
Jobs pay well above the national average
Produce disproportionate share of exports

9/27/2011
Aspen Environmental Group 3
Highlights of Diesel Importance to Specific Sectors
90% of agriculture’s $1.2 trillion in shipments used 90% of agriculture s $1.2 trillion in shipments used diesel vehicles
98.5% of construction and mining fuel use is diesel
85% of transit vehicles and 49% of transit passenger‐miles were diesel powered
83% of Army and Marine vehicles and engines are 3 y gdiesel powered
Many Public Sector Functions Rely on Diesel
Virtually all emergency vehicles, such as ambulances, Virtually all emergency vehicles, such as ambulances, fire engines and tow trucks use diesel engines
Hospitals, data centers, air traffic control towers, pipelines and other critical service sectors often rely on diesel generators for emergency standby power
National defense relies on diesel to move material, munitions and weapons, both between theatres and on the battlefield
Non‐rail transit mostly diesel powered
9/27/2011
Aspen Environmental Group 4
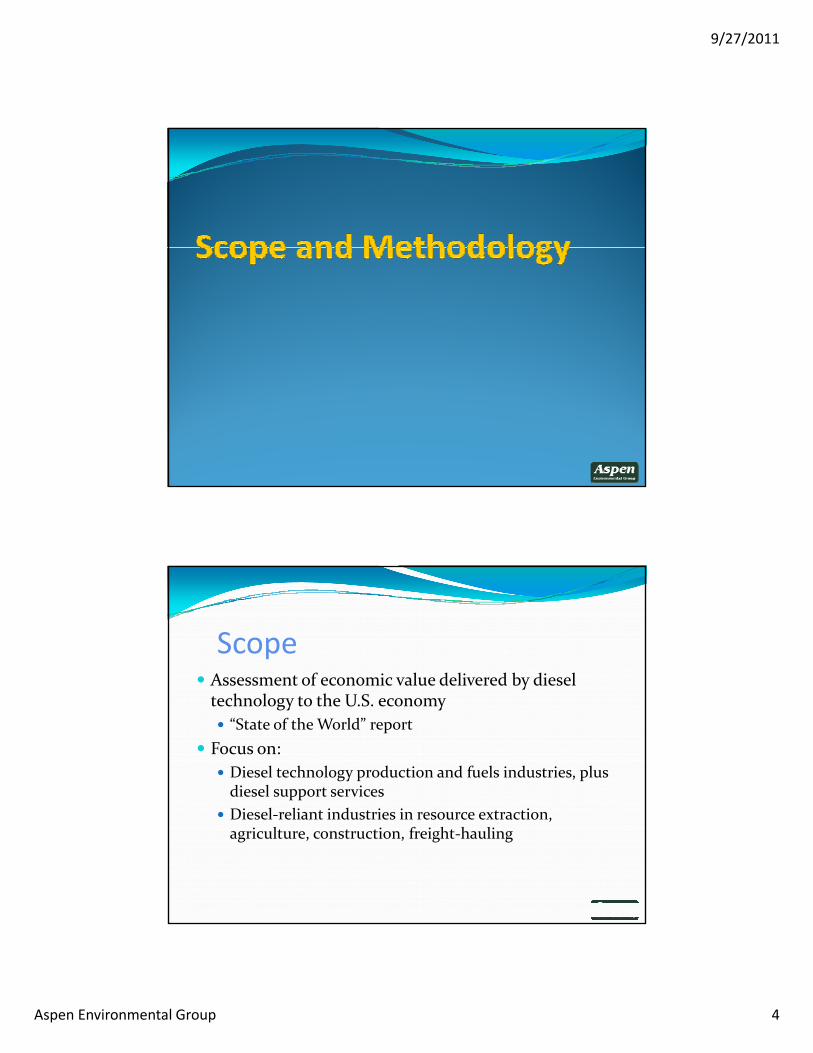
Scope Assessment of economic value delivered by diesel Assessment of economic value delivered by diesel technology to the U.S. economy
“State of the World” report
Focus on:
Diesel technology production and fuels industries, plus diesel support services
Diesel‐reliant industries in resource extraction, agriculture, construction, freight‐hauling

9/27/2011
Aspen Environmental Group 5
Methodology Use regional impact assessment approach Use regional impact assessment approach
› Rely on IMPLAN and U.S. economic data sources
Identify relationships of diesel technology and fuel industries to key economic sectors
› Assign economic output causation from diesel use
Assess share of U.S. GDP and employment produced p y pwhen using diesel = technology enabled activity
Diesel Industries Covered Diesel Fuel Diesel Fuel
› Oil production and refining
Diesel Technology Manufacturing
› Auto and truck
› Rail
› Shipsp
› Tractors and other off‐road and industrial equipment
› Military vehicles, ships and equipment
Diesel Servicing

9/27/2011
Aspen Environmental Group 6
Key Diesel‐Reliant Industries AgricultureAgriculture
Mining
Oil and Gas Production
Construction
Trade and Freight Hauling
Utilities Utilities
Passenger Transport
Government Services
9/27/2011
Aspen Environmental Group 7
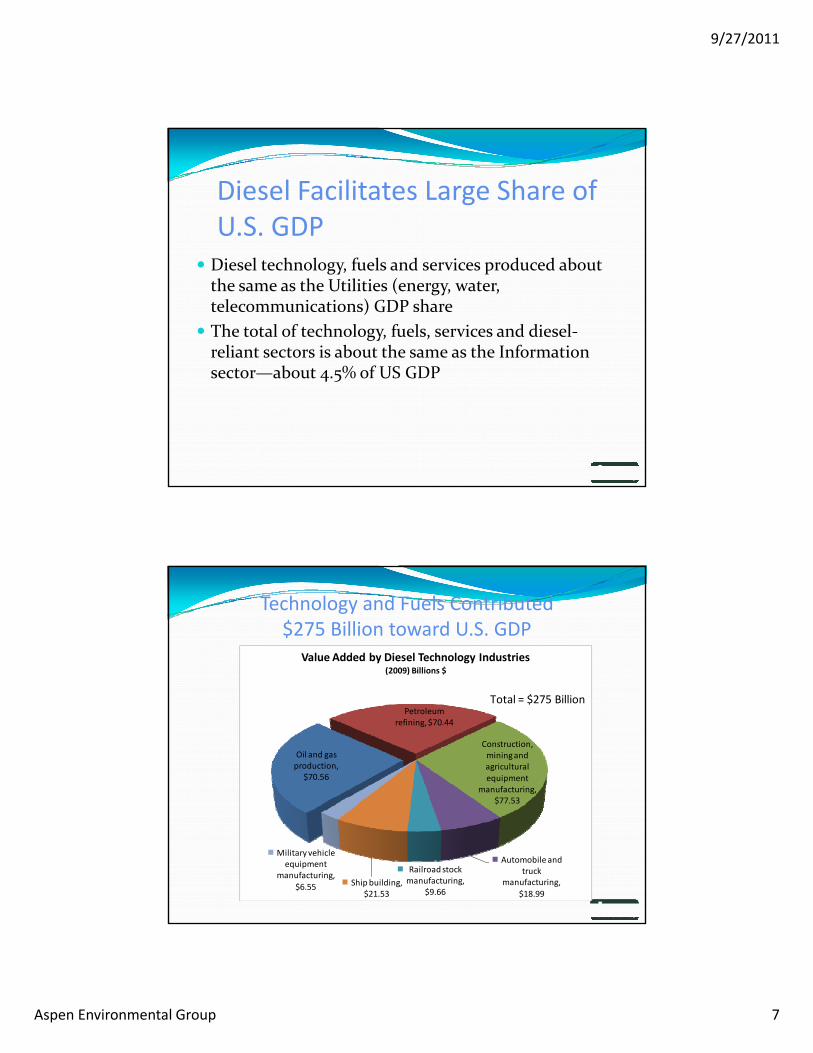
Diesel Facilitates Large Share of U.S. GDP
Diesel technology, fuels and services produced about the same as the Utilities (energy, water, telecommunications) GDP share
The total of technology, fuels, services and diesel‐reliant sectors is about the same as the Information
b % f US GDPsector—about 4.5% of US GDP
Technology and Fuels Contributed $275 Billion toward U.S. GDP
Value Added by Diesel Technology Industries (2009) Billions $
Oil and gas production,
$70.56
Petroleum refining, $70.44
Construction, mining and agricultural equipment
manufacturing, $77.53
Total = $275 Billion
Automobile and truck
manufacturing,
$18.99
Railroad stock manufacturing,
$9.66Ship building,
$21.53
Military vehicle equipment
manufacturing,
$6.55
9/27/2011
Aspen Environmental Group 8
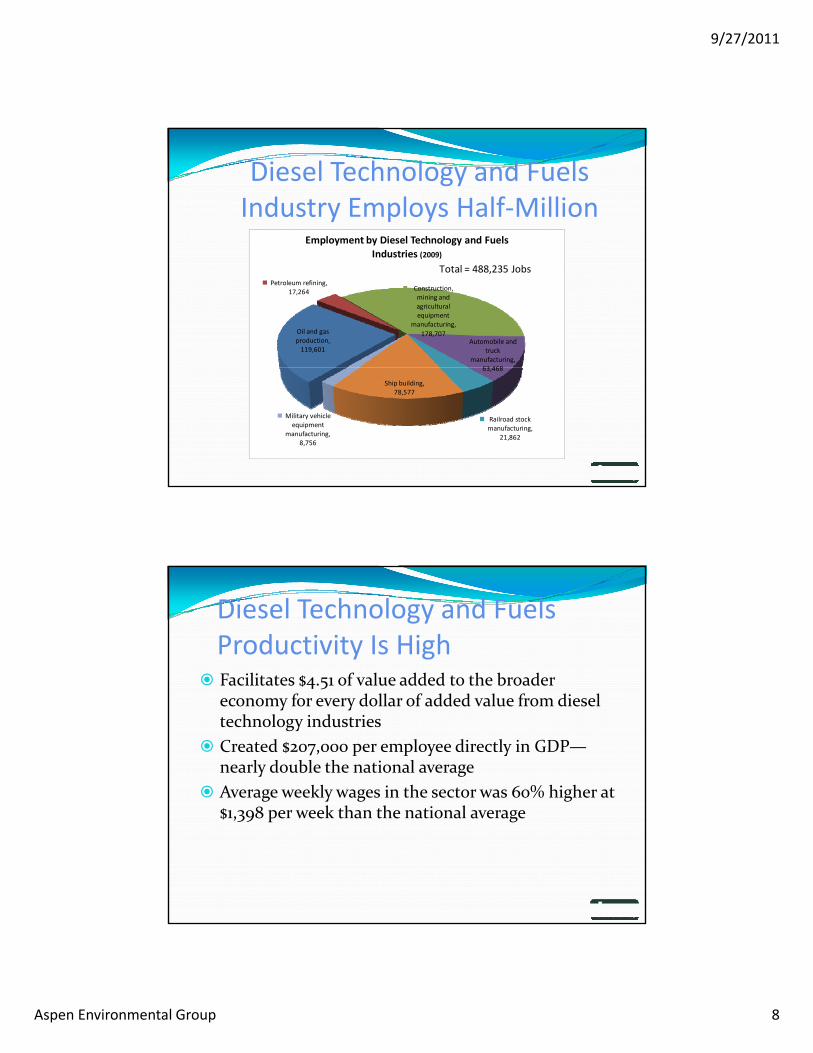
Diesel Technology and Fuels Industry Employs Half‐Million
Employment by Diesel Technology and Fuels
Oil and gas production, 119,601
Petroleum refining, 17,264 Construction,
mining and agricultural equipment
manufacturing,
178,707Automobile and
truck manufacturing,
63 468
Industries (2009)
Total = 488,235 Jobs
63,468
Railroad stock manufacturing,
21,862
Ship building, 78,577
Military vehicle equipment
manufacturing, 8,756
Diesel Technology and Fuels Productivity Is High
Facilitates $4.51 of value added to the broader Facilitates $4.51 of value added to the broader economy for every dollar of added value from diesel technology industries
Created $207,000 per employee directly in GDP—nearly double the national average
Average weekly wages in the sector was 60% higher at $1,398 per week than the national average

9/27/2011
Aspen Environmental Group 9
Diesel Services Employ Three Quarters of a Million Diesel services support deployment, operations and Diesel services support deployment, operations and maintenance of diesel vehicles and equipment, often embedded in other related industries
Added $82 billion directly and $207 billion in total to the U.S. economy.
Created 764,000 jobs
Diesel a Prime U.S. Export Exports 9% of output, five times higher than national Exports 9% of output, five times higher than national
average for manufacturing industries
4.4% of all U.S. exports

9/27/2011
Aspen Environmental Group 10
In Key Diesel‐Reliant Sectors, Creates $455 Billion for GDP
Value Added from Diesel Contribution in Key Sectors (2009) Billions $
T t l $455 Billi
Agriculture, $40.3Nonresidential
Construction, $49.3
Manufacturing, $161.4
Warehousing, $3.6
Water and Sewage Utilities, $0.5
Wholesale Trade, $51.9
Total = $455 Billion
Coal Mining, $4.4
Electric Power Utilities, $47.0
Mineral Mining, $4.9
Air Transport, $9.5Oil and Gas
Production, $25.1
Couriers and Messengers, $8.5
Residential Construction,
$21.4
US Postal Service, $7.4
Government, $15.1
Scenic and Sightseeing,
$5.2

9/27/2011
Aspen Environmental Group 11
83% of Freight Value Shipped Using Diesel
U.S. Freight Shipments: Value by Mode 1997‐2007
$4,000
$5,000
$6,000
$7,000
$8,000
$9,000
$10,000
$6 848$7,546
$8,772
$98
$103
$115
(Billion 2007 dollars)
Air
Pipeline
Water
$0
$1,000
$2,000
$3,000
1997 2002 2007
$6,848
Value
Land (truck + rail)
Bureau of Transportation Statistics, Commodity Flow Surveys
Diesel Share of Highway Fuel Use Has Grown 50% Since 1980

9/27/2011
Aspen Environmental Group 12
Diesel Fuel Use and GDP Growth Highly Correlated
Comparison of U.S Heavy Duty Truck Fuel Consumption and Gross Domestic Product
(1970‐2008)
$6,000
$8,000
$10,000
$12,000
$14,000
1,000
1,500
2,000
2,500
3,000
omestic Product (B
illions 2005$)
ck Fuel Use (Thousand Gallons per Day)
( )
1970‐2008 Growth Rates:GDP = 3.0%
Truck Fuel Use = 3 1%
$0
$2,000
$4,000
0
500
Gross Do
Heavy Duty Truc
Heavy Duty Truck Fuel Use U.S. Gross Domestic Product
Transportation Energy Data Book, 2009, Table 1.14
Bureau of Economic Affairs, 2011.
Truck Fuel Use = 3.1%
Non‐Highway Diesel‐Powered Freight Modes IncreasedFreight Modes Increased Dramatically
Locomotive efficiency improved more than doubled from 235 ton‐miles / gal in 1980 to 480 in 2009
Rail ton‐miles more than doubled from 1981 to 2008Rail ton miles more than doubled from 1981 to 2008
International trade by ship almost doubled from 1983 to 2008
9/27/2011
Aspen Environmental Group 13
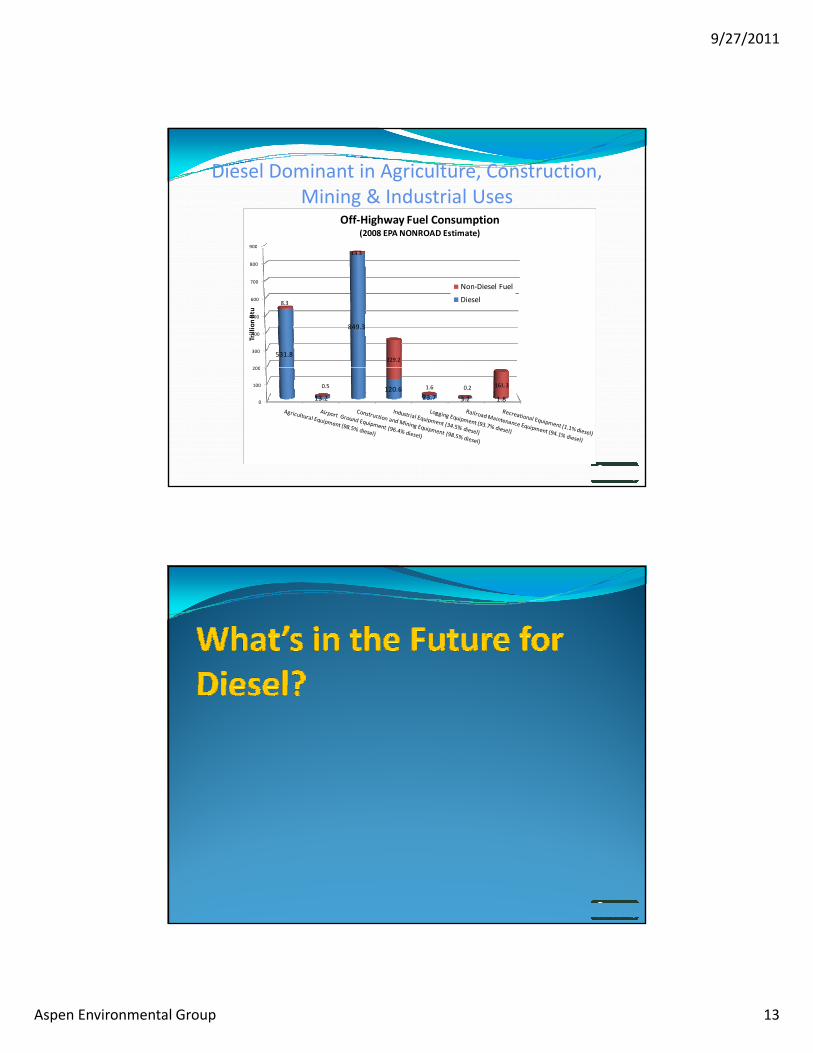
Diesel Dominant in Agriculture, Construction, Mining & Industrial Uses
900
Off‐Highway Fuel Consumption (2008 EPA NONROAD Estimate)
200
300
400
500
600
700
800
900
531.8
849.3
8.3
13.3
229.2
Trillion Btu
Non‐Diesel Fuel
Diesel
0
100
200
13.2120.6
23.7 3.2 1.8
0.5 1.6 0.2 161.3

9/27/2011
Aspen Environmental Group 14
Diesel Fits with Environmental Goals Diesel 20‐40% more efficient than spark‐ignition Diesel 20 40% more efficient than spark ignition technologies
50% of European auto market
Fuel economy standards will favor diesel technologies
Federal and state policies lead to clean diesel technologies that use a range of fuels, including g g gbiofuels
U.S. energy R&D has a 60:1 benefit‐cost ratio
Diesel retrofit programs return a 13:1 benefit‐cost ratio

9/27/2011
Aspen Environmental Group 15
Diesel Industry Contributions
Diesel Industry S b t
Total Output Value Added EmploymentDiesel Technology and Fuels Industry Statistics
SubsectorVehicle, Equipment & Engine Manufacturing
$178.2 billion $45.7 billion 349,000
Oil Production & Refining
$218.6 billion $55.3 billion 137,000
Sales, Repair & $120.7 billion $82.1 billion 764,000ServicingTotal $517.5 billion $183.0 billion 1,252,000 Multiplier Effect $300.1 billionTotal Value Added $483.1 billion
Diesel Reliance and 2009 U.S. GDPDiesel GDP Share
($ billions)Agriculture 35.0% $40.30 Sectors
% Diesel Contribution or Influence
g cu tu e 35 0% $ 0 30Coal Mining 26.8% $4.40 Electric Power Utilities 24.6% $47.00 Mineral Mining 17.0% $4.90 Air Transport 16.8% $9.50 Oil and Gas Production 15.9% $25.10 Couriers and Messengers 15.2% $8.50 Residential Construction 14.0% $21.40 US Postal Service 13.7% $7.40 Government 13.3% $15.10 Scenic and Sightseeing 12.4% $5.20 Nonresidential Construction 11.7% $49.30 Manufacturing 10.5% $161.40 Warehousing 8.8% $3.60 Water and Sewage Utilities 7.0% $0.50 Wholesale Trade 6.8% $51.90 Total for Diesel Reliant Sectors $455

9/27/2011
Aspen Environmental Group 16
Conclusions Diesel technology is ubiquitous throughout the U.S. Diesel technology is ubiquitous throughout the U.S. economy—key to producing fundamental resources and goods, and prime mover of four‐fifths of all freight
Technology and fuels sectors are twice as productive and wages are three‐fifths higher than U.S. average
Exports five times more of sector output than national average, over 4% of national exports
Richard McCann, Aspen [email protected](530) 757‐6363
[email protected] Technology Forum301‐668‐7230