dtrace topics: java - brendan greggdtrace topics: java • this presentation is about dtrace and...
TRANSCRIPT
1
# ./jflow.d
<- java/lang/Thread.sleep
-> Greeting.greet
-> java/io/PrintStream.println
-> java/io/PrintStream.print
-> java/io/PrintStream.write
-> java/io/PrintStream.ensureOpen
<- java/io/PrintStream.ensureOpen
-> java/io/Writer.write
-> java/io/BufferedWriter.write
-> java/io/BufferedWriter.ensureO
<- java/io/BufferedWriter.ensureO
-> java/io/BufferedWriter.min
<- java/io/BufferedWriter.min
-> java/lang/String.getChars
-> java/lang/System.arraycopy
<- java/lang/System.arraycopy
<- java/lang/String.getChars
<- java/io/BufferedWriter.write
<- java/io/Writer.write
-> java/io/BufferedWriter.flushBuff
-> java/io/BufferedWriter.ensureOp
<- java/io/BufferedWriter.ensureOp
-> java/io/OutputStreamWriter.writ
-> sun/nio/cs/StreamEncoder.write
-> sun/nio/cs/StreamEncoder.ensu
<- sun/nio/cs/StreamEncoder.ensu
-> sun/nio/cs/StreamEncoder.impl
-> java/nio/CharBuffer.wrap
DTrace Topics:Java
Brendan GreggSun MicrosystemsMarch 2007
1
2
DTrace Topics: Java
• This presentation is about DTrace and Java, and is part of the “DTrace Topics” collection.• These slides cover:> DTrace Recap> Java and DTrace> The hotspot Provider> hotspot Examples> Resources
3
DTrace Recap
• A general understanding of DTrace is assumed knowledge for this presentation.• If you are new to DTrace, try starting with the
presentation called “DTrace Topics: Intro”.• The next two slides are a short summary of DTrace,
if needed.
4
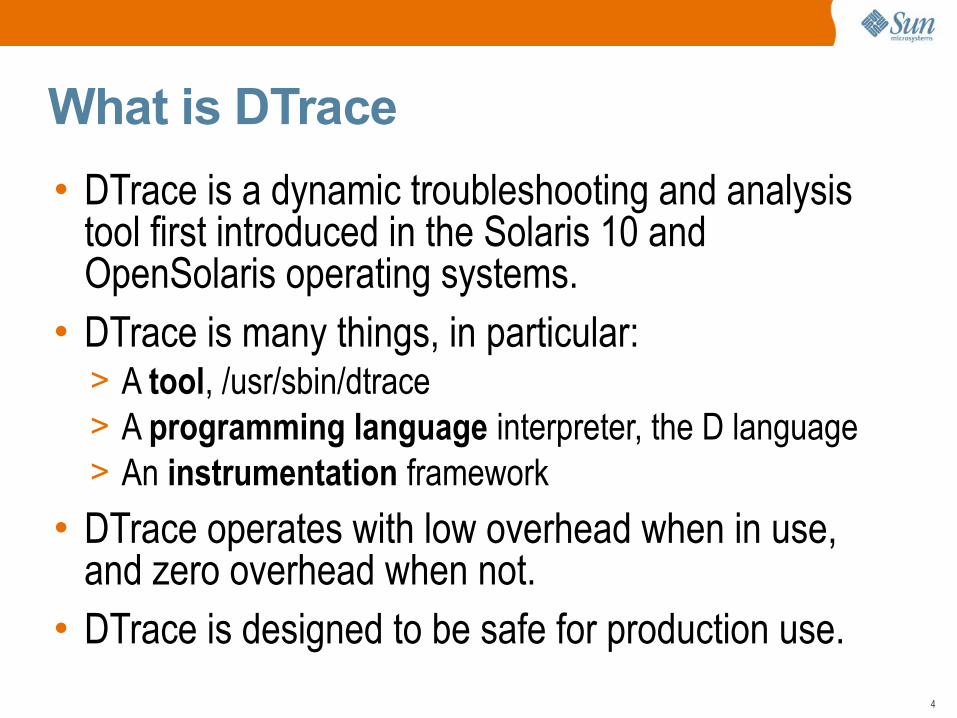
What is DTrace
• DTrace is a dynamic troubleshooting and analysis tool first introduced in the Solaris 10 and OpenSolaris operating systems.• DTrace is many things, in particular:> A tool, /usr/sbin/dtrace> A programming language interpreter, the D language> An instrumentation framework
• DTrace operates with low overhead when in use, and zero overhead when not.• DTrace is designed to be safe for production use.
5
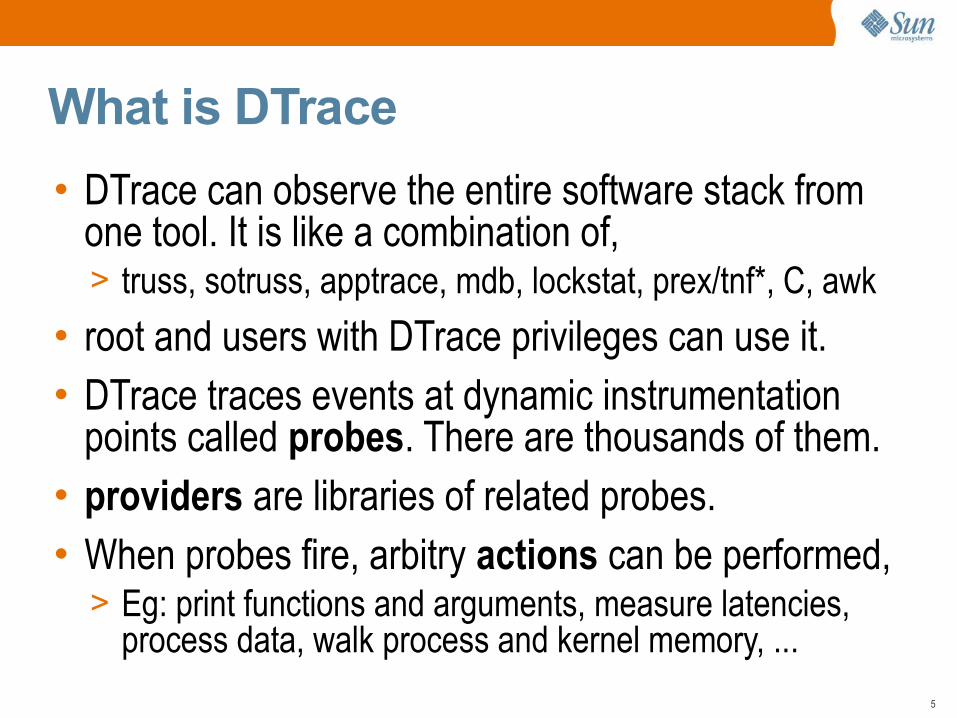
What is DTrace
• DTrace can observe the entire software stack from one tool. It is like a combination of,> truss, sotruss, apptrace, mdb, lockstat, prex/tnf*, C, awk
• root and users with DTrace privileges can use it. • DTrace traces events at dynamic instrumentation
points called probes. There are thousands of them.• providers are libraries of related probes.• When probes fire, arbitry actions can be performed, > Eg: print functions and arguments, measure latencies,
process data, walk process and kernel memory, ...
6
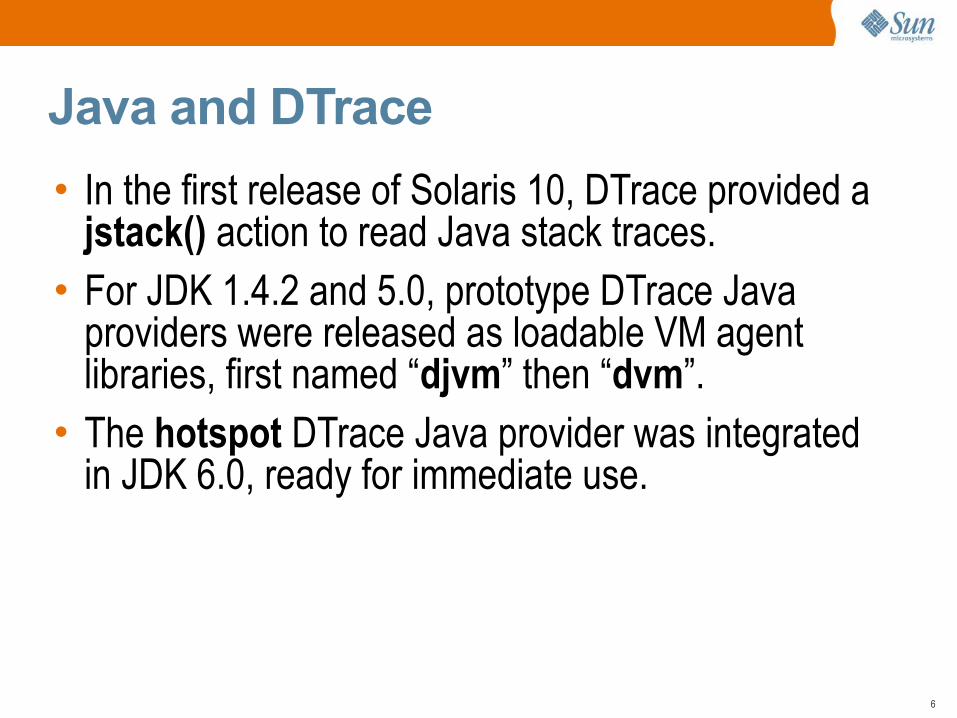
Java and DTrace
• In the first release of Solaris 10, DTrace provided a jstack() action to read Java stack traces.• For JDK 1.4.2 and 5.0, prototype DTrace Java
providers were released as loadable VM agent libraries, first named “djvm” then “dvm”. • The hotspot DTrace Java provider was integrated
in JDK 6.0, ready for immediate use.
7
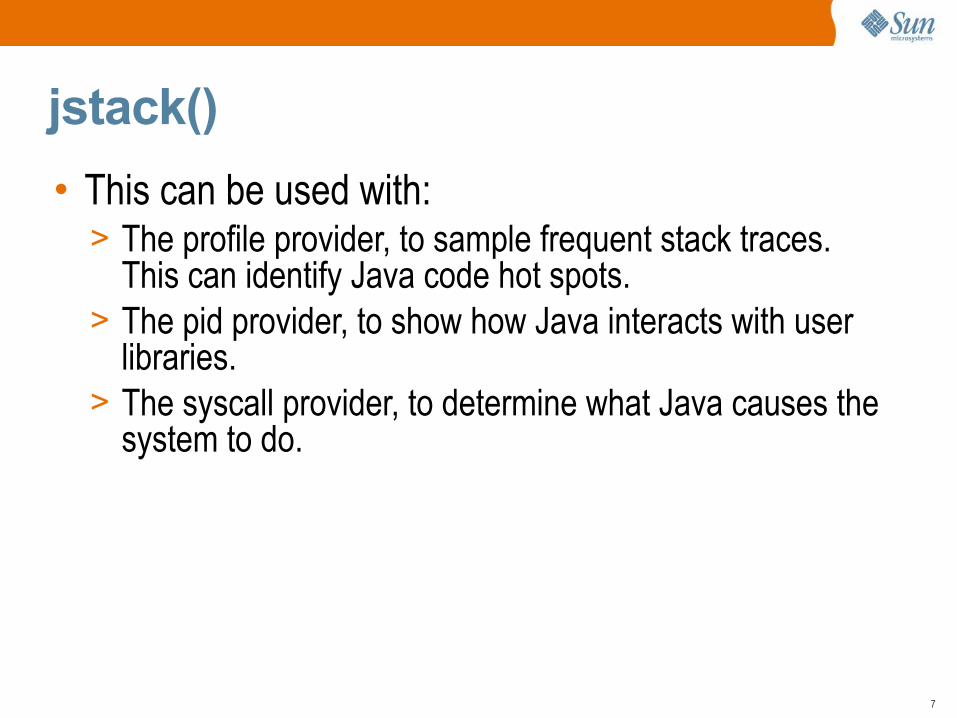
jstack()
• This can be used with:> The profile provider, to sample frequent stack traces.
This can identify Java code hot spots.> The pid provider, to show how Java interacts with user
libraries.> The syscall provider, to determine what Java causes the
system to do.
8
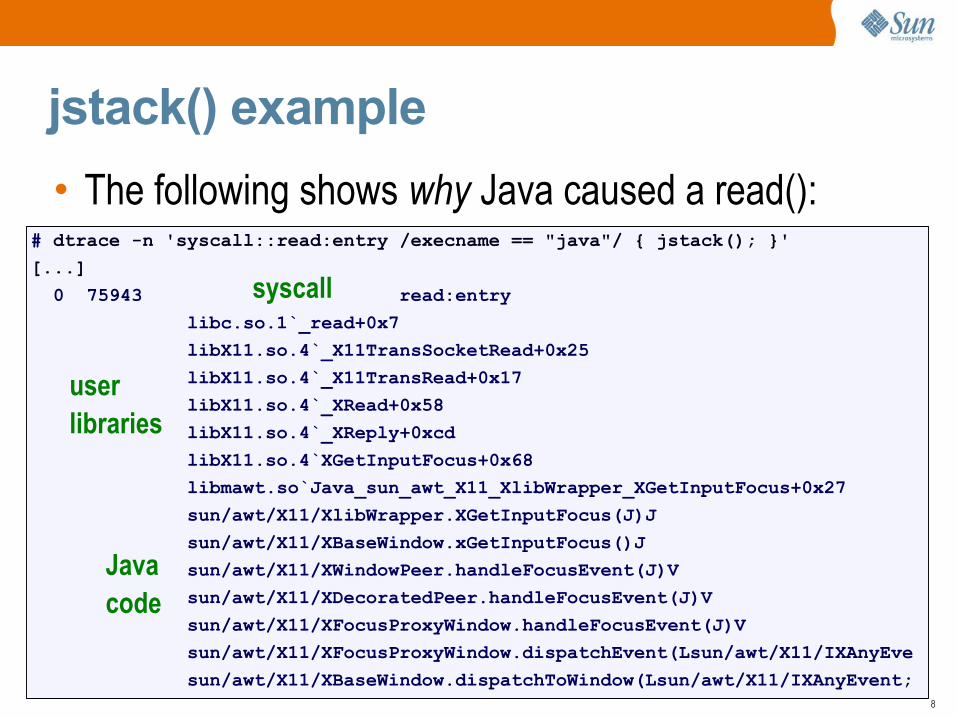
jstack() example
• The following shows why Java caused a read():# dtrace -n 'syscall::read:entry /execname == "java"/ { jstack(); }'
[...]
0 75943 read:entry
libc.so.1`_read+0x7
libX11.so.4`_X11TransSocketRead+0x25
libX11.so.4`_X11TransRead+0x17
libX11.so.4`_XRead+0x58
libX11.so.4`_XReply+0xcd
libX11.so.4`XGetInputFocus+0x68
libmawt.so`Java_sun_awt_X11_XlibWrapper_XGetInputFocus+0x27
sun/awt/X11/XlibWrapper.XGetInputFocus(J)J
sun/awt/X11/XBaseWindow.xGetInputFocus()J
sun/awt/X11/XWindowPeer.handleFocusEvent(J)V
sun/awt/X11/XDecoratedPeer.handleFocusEvent(J)V
sun/awt/X11/XFocusProxyWindow.handleFocusEvent(J)V
sun/awt/X11/XFocusProxyWindow.dispatchEvent(Lsun/awt/X11/IXAnyEve
sun/awt/X11/XBaseWindow.dispatchToWindow(Lsun/awt/X11/IXAnyEvent;
syscall
userlibraries
Javacode
9
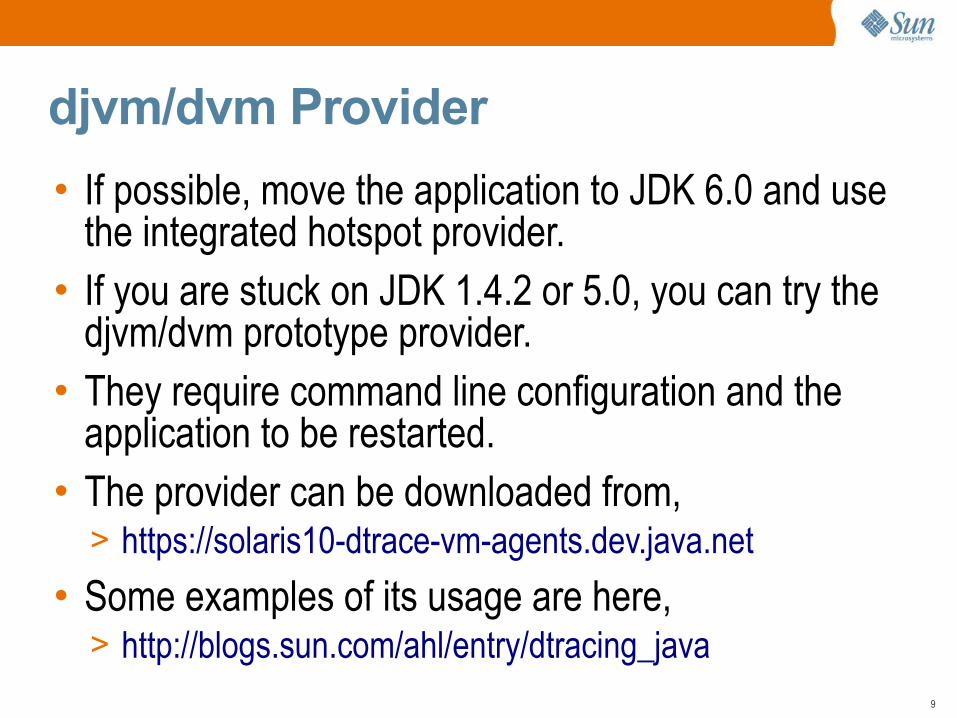
djvm/dvm Provider
• If possible, move the application to JDK 6.0 and use the integrated hotspot provider.• If you are stuck on JDK 1.4.2 or 5.0, you can try the
djvm/dvm prototype provider.• They require command line configuration and the
application to be restarted.• The provider can be downloaded from,> https://solaris10-dtrace-vm-agents.dev.java.net
• Some examples of its usage are here,> http://blogs.sun.com/ahl/entry/dtracing_java
10
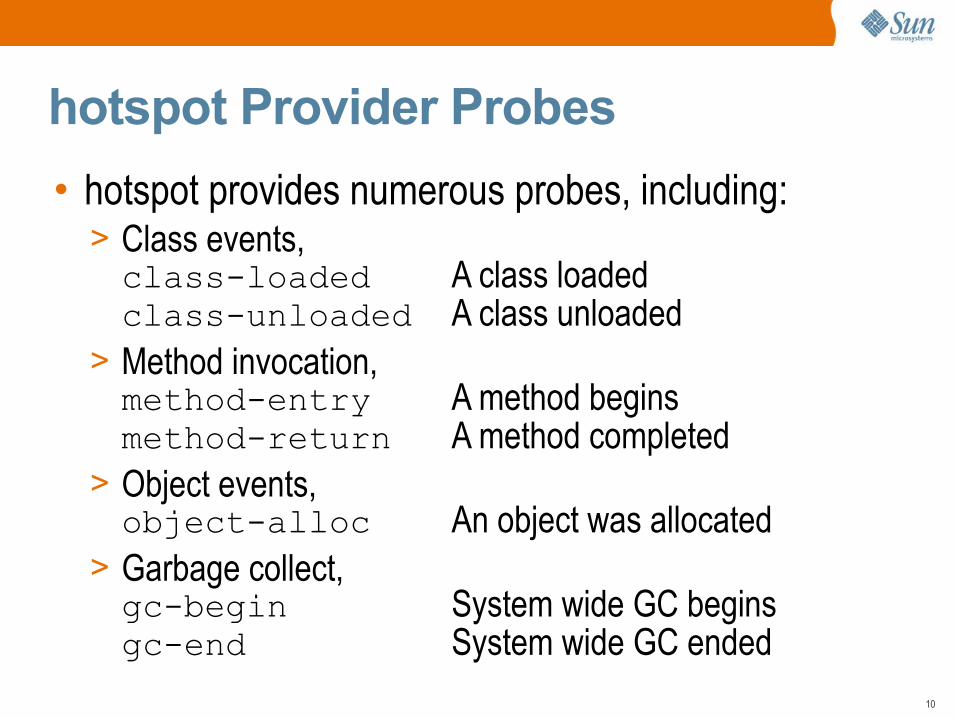
hotspot Provider Probes
• hotspot provides numerous probes, including:> Class events,class-loaded A class loadedclass-unloaded A class unloaded
> Method invocation,method-entry A method beginsmethod-return A method completed
> Object events,object-alloc An object was allocated
> Garbage collect,gc-begin System wide GC beginsgc-end System wide GC ended
11
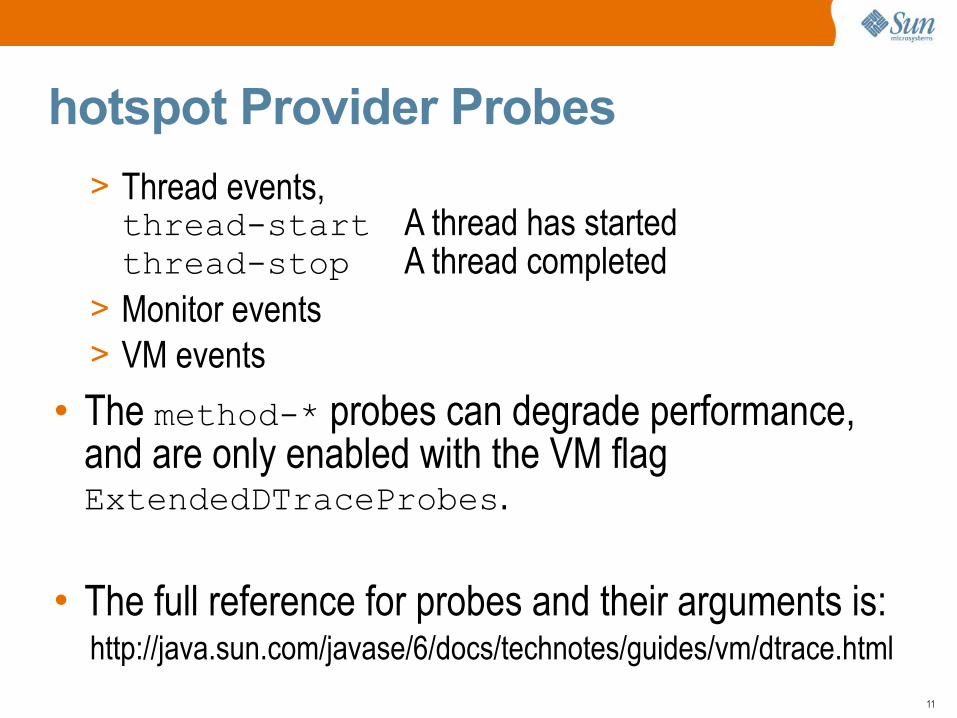
hotspot Provider Probes
> Thread events,thread-start A thread has startedthread-stop A thread completed
> Monitor events> VM events
• The method-* probes can degrade performance, and are only enabled with the VM flag ExtendedDTraceProbes.
• The full reference for probes and their arguments is:http://java.sun.com/javase/6/docs/technotes/guides/vm/dtrace.html
12
hotspot Example #1
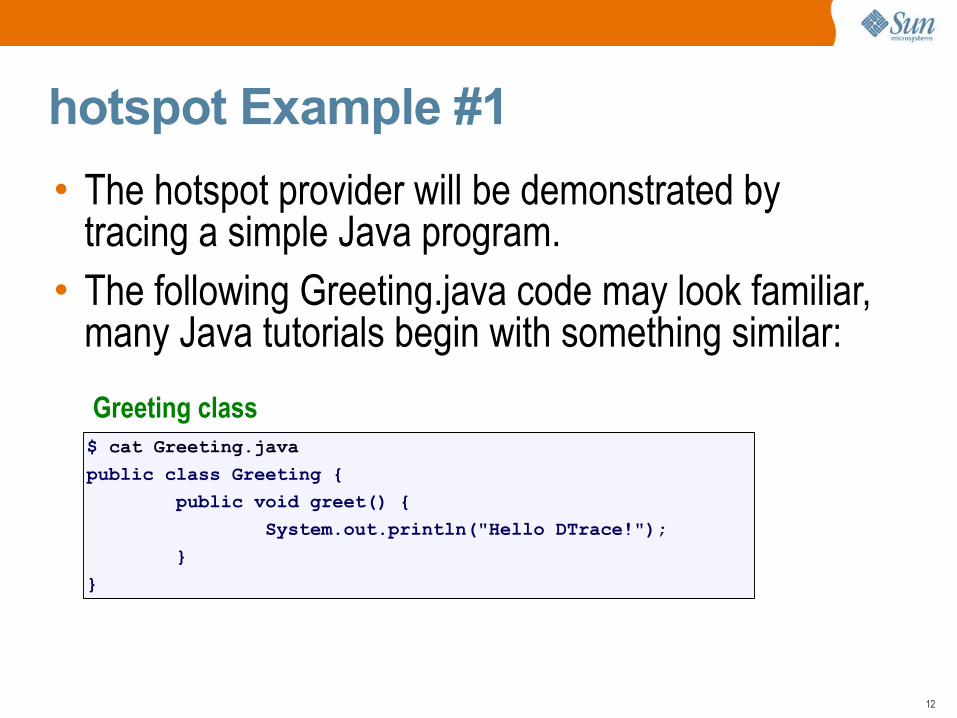
• The hotspot provider will be demonstrated by tracing a simple Java program.• The following Greeting.java code may look familiar,
many Java tutorials begin with something similar:
$ cat Greeting.java
public class Greeting {
public void greet() {
System.out.println("Hello DTrace!");
}
}
Greeting class
13
hotspot Example #1
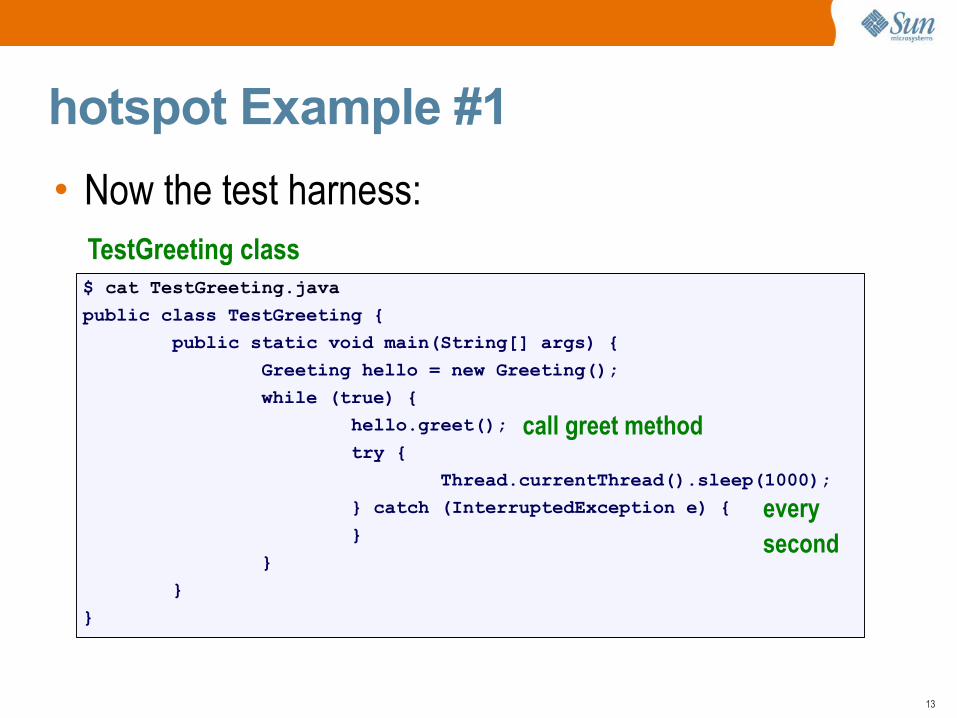
• Now the test harness:
$ cat TestGreeting.java
public class TestGreeting {
public static void main(String[] args) {
Greeting hello = new Greeting();
while (true) {
hello.greet();
try {
Thread.currentThread().sleep(1000);
} catch (InterruptedException e) {
}
}
}
}
TestGreeting class
call greet method
everysecond
14
hotspot Example #1
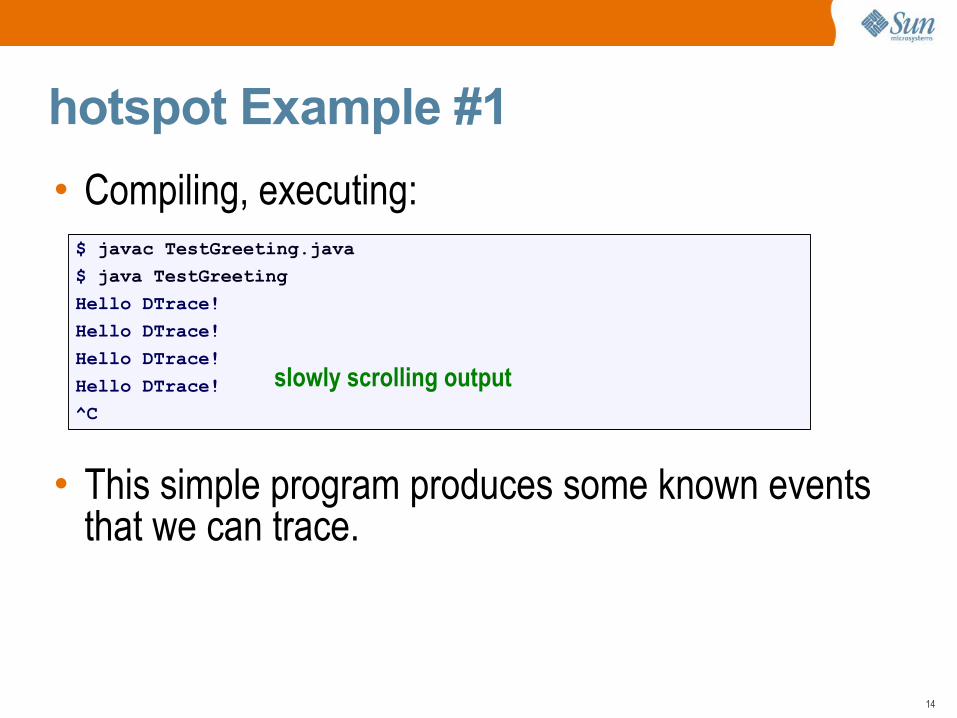
• Compiling, executing:
• This simple program produces some known events that we can trace.
$ javac TestGreeting.java
$ java TestGreeting
Hello DTrace!
Hello DTrace!
Hello DTrace!
Hello DTrace!
^C
slowly scrolling output
15
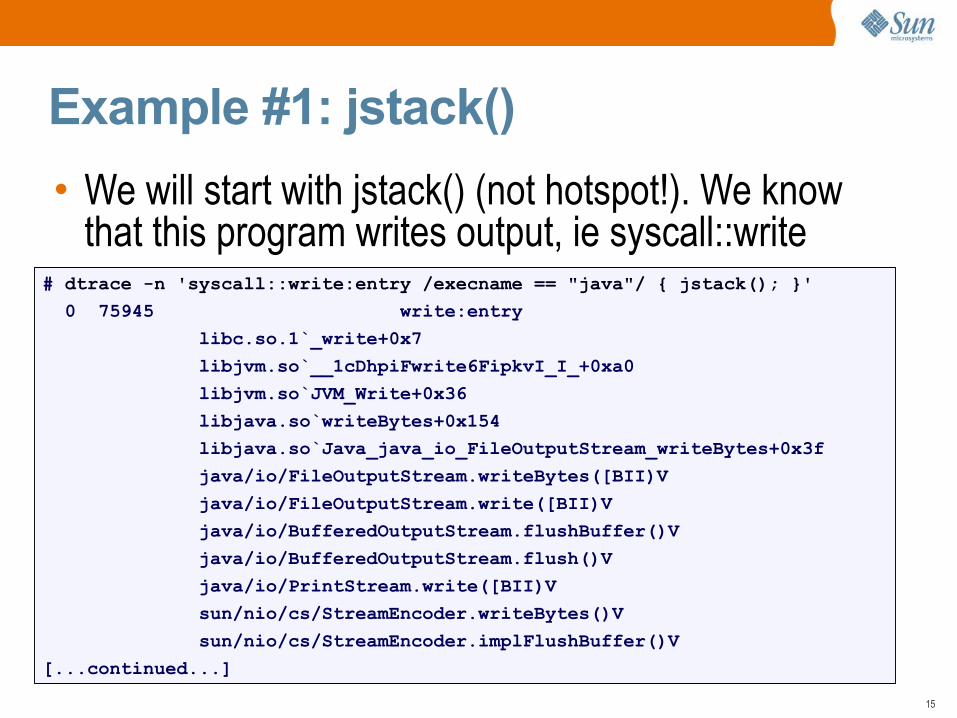
Example #1: jstack()
• We will start with jstack() (not hotspot!). We know that this program writes output, ie syscall::write
# dtrace -n 'syscall::write:entry /execname == "java"/ { jstack(); }'
0 75945 write:entry
libc.so.1`_write+0x7
libjvm.so`__1cDhpiFwrite6FipkvI_I_+0xa0
libjvm.so`JVM_Write+0x36
libjava.so`writeBytes+0x154
libjava.so`Java_java_io_FileOutputStream_writeBytes+0x3f
java/io/FileOutputStream.writeBytes([BII)V
java/io/FileOutputStream.write([BII)V
java/io/BufferedOutputStream.flushBuffer()V
java/io/BufferedOutputStream.flush()V
java/io/PrintStream.write([BII)V
sun/nio/cs/StreamEncoder.writeBytes()V
sun/nio/cs/StreamEncoder.implFlushBuffer()V
[...continued...]

16
Example #1: jstack()
> Read the stack trace above Greeting.greet carefully. How many Java classes do you recognize?
sun/nio/cs/StreamEncoder.flushBuffer()V
java/io/OutputStreamWriter.flushBuffer()V
java/io/PrintStream.newLine()V
java/io/PrintStream.println(Ljava/lang/String;)V
Greeting.greet()V
TestGreeting.main([Ljava/lang/String;)V
StubRout
libjvm.so`__1cJJavaCallsLcall_helper6FpnJJavaValue_pnMmethodHan
libjvm.so`__1cCosUos_exception_wrapper6FpFpnJJavaValue_pnMmetho
libjvm.so`__1cJJavaCallsEcall6FpnJJavaValue_nMmethodHandle_pnRJ
libjvm.so`__1cRjni_invoke_static6FpnHJNIEnv__pnJJavaValue_pnI_j
libjvm.so`jni_CallStaticVoidMethod+0x15d
java`JavaMain+0xd30
libc.so.1`_thr_setup+0x52
libc.so.1`_lwp_start
Ah-ha!

17
Example #1: Listing Probes
• Now to see what the hotspot provider can do:
> 1014 probes, 498 unique probe names == deep visibility!
# dtrace -ln 'hotspot*:::'
ID PROVIDER MODULE FUNCTION NAME
52103 hotspot_jni278338 libjvm.so jni_GetObjectRefType GetOb
52104 hotspot_jni278338 libjvm.so jni_GetObjectRefType GetOb
52105 hotspot_jni278338 libjvm.so jni_GetPrimitiveArrayCritical GetPr
52106 hotspot_jni278338 libjvm.so jni_GetPrimitiveArrayCritical GetPr
52107 hotspot_jni278338 libjvm.so jni_GetShortArrayElements GetSh
[...]
# dtrace -ln 'hotspot*:::' | wc -l
1015
# dtrace -ln 'hotspot*:::' | awk '{print $5}' | sort -u | wc -l
499
18
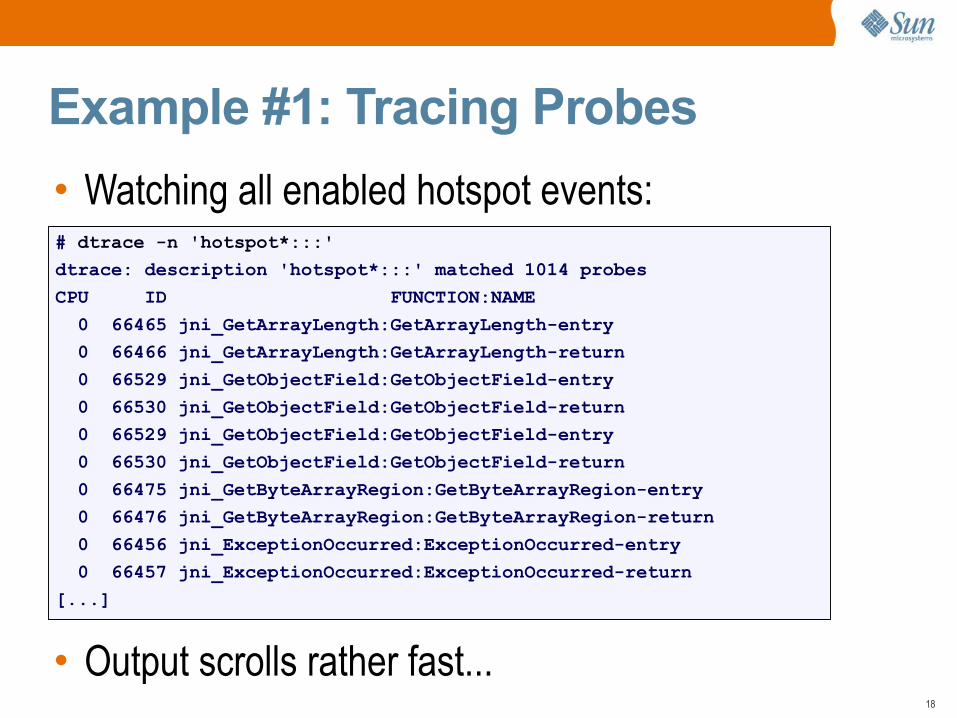
Example #1: Tracing Probes
• Watching all enabled hotspot events:
• Output scrolls rather fast...
# dtrace -n 'hotspot*:::'
dtrace: description 'hotspot*:::' matched 1014 probes
CPU ID FUNCTION:NAME
0 66465 jni_GetArrayLength:GetArrayLength-entry
0 66466 jni_GetArrayLength:GetArrayLength-return
0 66529 jni_GetObjectField:GetObjectField-entry
0 66530 jni_GetObjectField:GetObjectField-return
0 66529 jni_GetObjectField:GetObjectField-entry
0 66530 jni_GetObjectField:GetObjectField-return
0 66475 jni_GetByteArrayRegion:GetByteArrayRegion-entry
0 66476 jni_GetByteArrayRegion:GetByteArrayRegion-return
0 66456 jni_ExceptionOccurred:ExceptionOccurred-entry
0 66457 jni_ExceptionOccurred:ExceptionOccurred-return
[...]
19
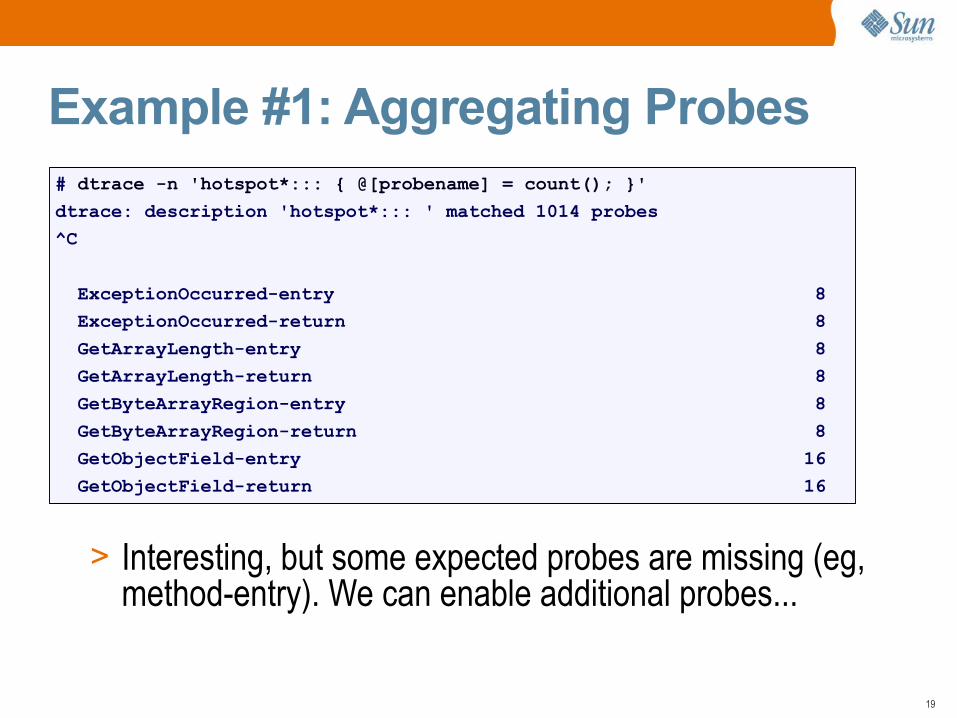
Example #1: Aggregating Probes
> Interesting, but some expected probes are missing (eg, method-entry). We can enable additional probes...
# dtrace -n 'hotspot*::: { @[probename] = count(); }'
dtrace: description 'hotspot*::: ' matched 1014 probes
^C
ExceptionOccurred-entry 8
ExceptionOccurred-return 8
GetArrayLength-entry 8
GetArrayLength-return 8
GetByteArrayRegion-entry 8
GetByteArrayRegion-return 8
GetObjectField-entry 16
GetObjectField-return 16
20
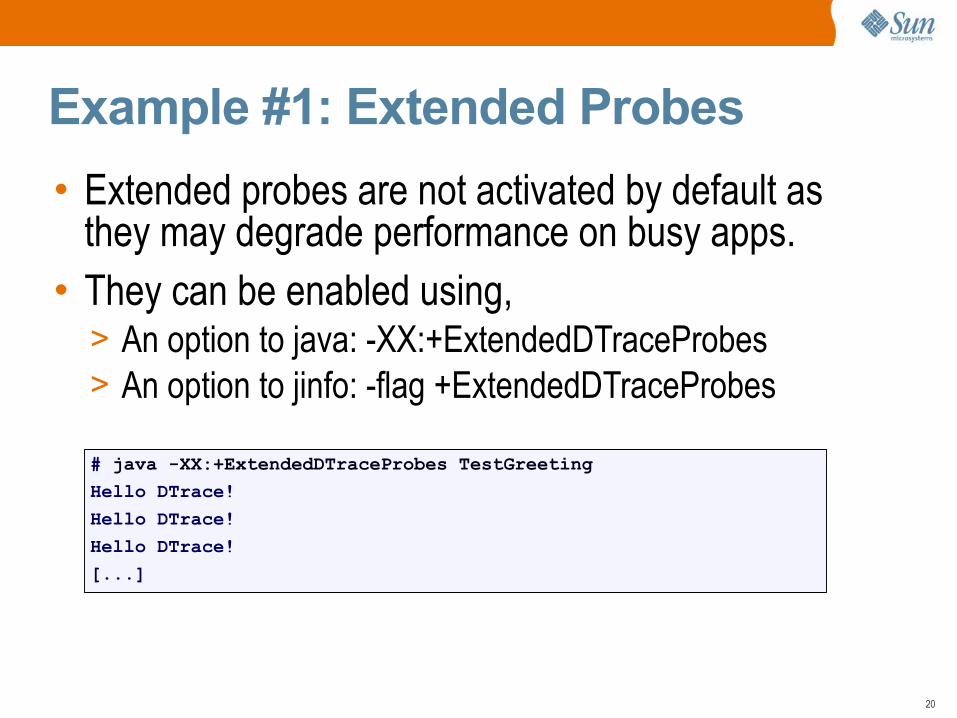
Example #1: Extended Probes
• Extended probes are not activated by default as they may degrade performance on busy apps.• They can be enabled using,> An option to java: -XX:+ExtendedDTraceProbes> An option to jinfo: -flag +ExtendedDTraceProbes
# java -XX:+ExtendedDTraceProbes TestGreeting
Hello DTrace!
Hello DTrace!
Hello DTrace!
[...]
21
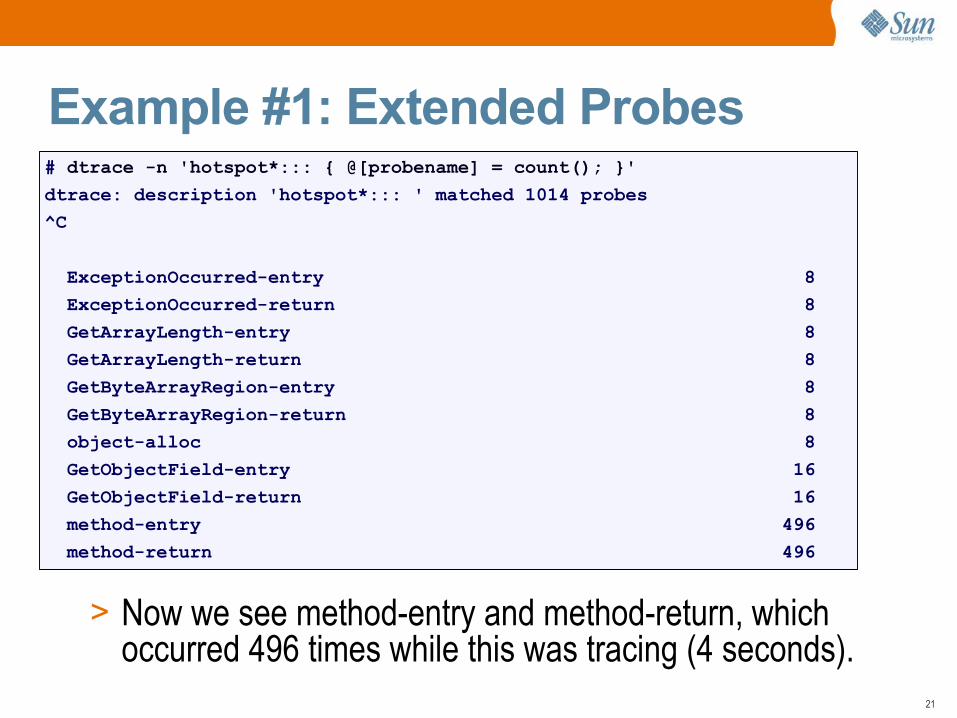
Example #1: Extended Probes
> Now we see method-entry and method-return, which occurred 496 times while this was tracing (4 seconds).
# dtrace -n 'hotspot*::: { @[probename] = count(); }'
dtrace: description 'hotspot*::: ' matched 1014 probes
^C
ExceptionOccurred-entry 8
ExceptionOccurred-return 8
GetArrayLength-entry 8
GetArrayLength-return 8
GetByteArrayRegion-entry 8
GetByteArrayRegion-return 8
object-alloc 8
GetObjectField-entry 16
GetObjectField-return 16
method-entry 496
method-return 496
22
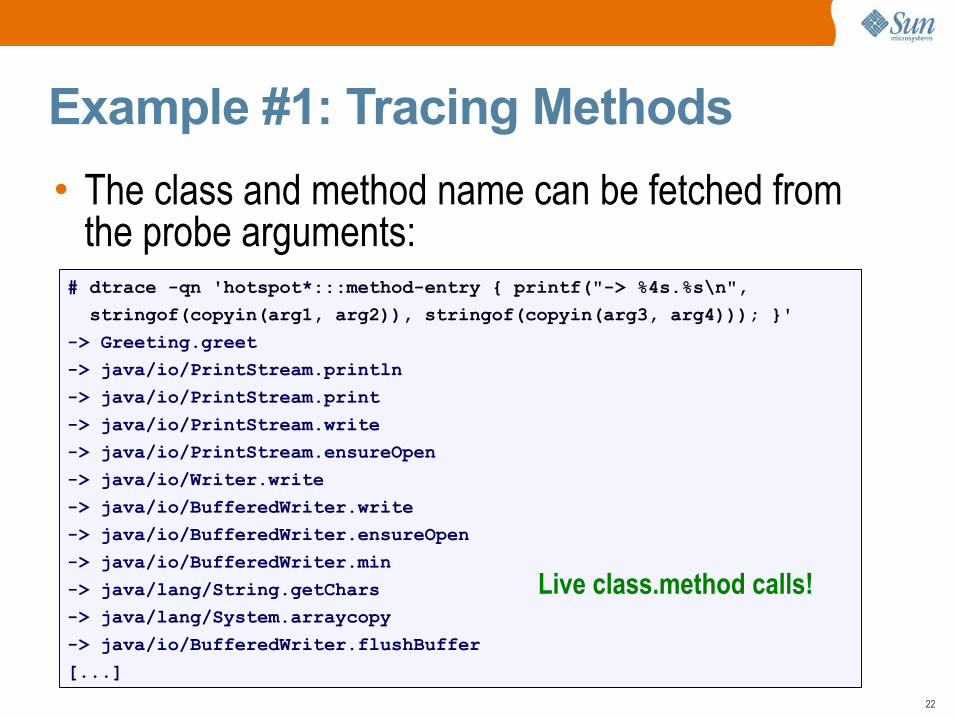
Example #1: Tracing Methods
• The class and method name can be fetched from the probe arguments:
# dtrace -qn 'hotspot*:::method-entry { printf("-> %4s.%s\n",
stringof(copyin(arg1, arg2)), stringof(copyin(arg3, arg4))); }'
-> Greeting.greet
-> java/io/PrintStream.println
-> java/io/PrintStream.print
-> java/io/PrintStream.write
-> java/io/PrintStream.ensureOpen
-> java/io/Writer.write
-> java/io/BufferedWriter.write
-> java/io/BufferedWriter.ensureOpen
-> java/io/BufferedWriter.min
-> java/lang/String.getChars
-> java/lang/System.arraycopy
-> java/io/BufferedWriter.flushBuffer
[...]
Live class.method calls!

23
Example #1: Aggregating Methods
> Identify most frequently called methods.
# dtrace -qn 'hotspot*:::method-entry { @calls[stringof(copyin(arg1, arg2)),
stringof(copyin(arg3,arg4))] = count(); }
END { printa("%48s.%-24s %@4d\n", @calls); }'
^C
Greeting.greet 2
java/io/BufferedWriter.ensureOpen 2
java/io/BufferedWriter.minureOpen 2
java/io/BufferedWriter.writeeOpen 2
java/io/BufferedWriteropflushBuffer.ensureOpenr 2
java/io/BufferedWriteropyinureOpen.flushBuffer 2
java/io/OutputStreamWritersureOpenr.write 2
java/io/PrintStream.ensureOpen 2
[...truncated...]
java/nio/CharBuffer$EncoarrayOffsetodeArrayLoop.arrayOffsetodeArrayLoop 20
java/nio/ByteBuffer$EncoarrayOffsetodeArrayLoop.arrayOffsetodeArrayLoop 30
24
Example #1: Aggregating Methods
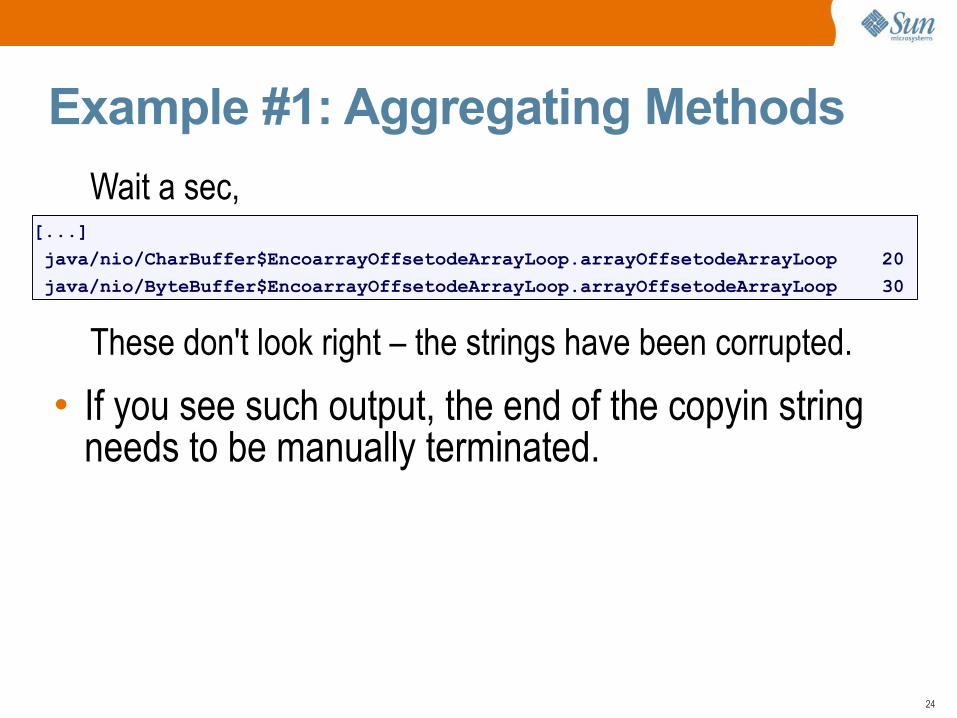
Wait a sec,
These don't look right – the strings have been corrupted.
• If you see such output, the end of the copyin string needs to be manually terminated.
[...]
java/nio/CharBuffer$EncoarrayOffsetodeArrayLoop.arrayOffsetodeArrayLoop 20
java/nio/ByteBuffer$EncoarrayOffsetodeArrayLoop.arrayOffsetodeArrayLoop 30
25
Example #1: Aggregating Methods
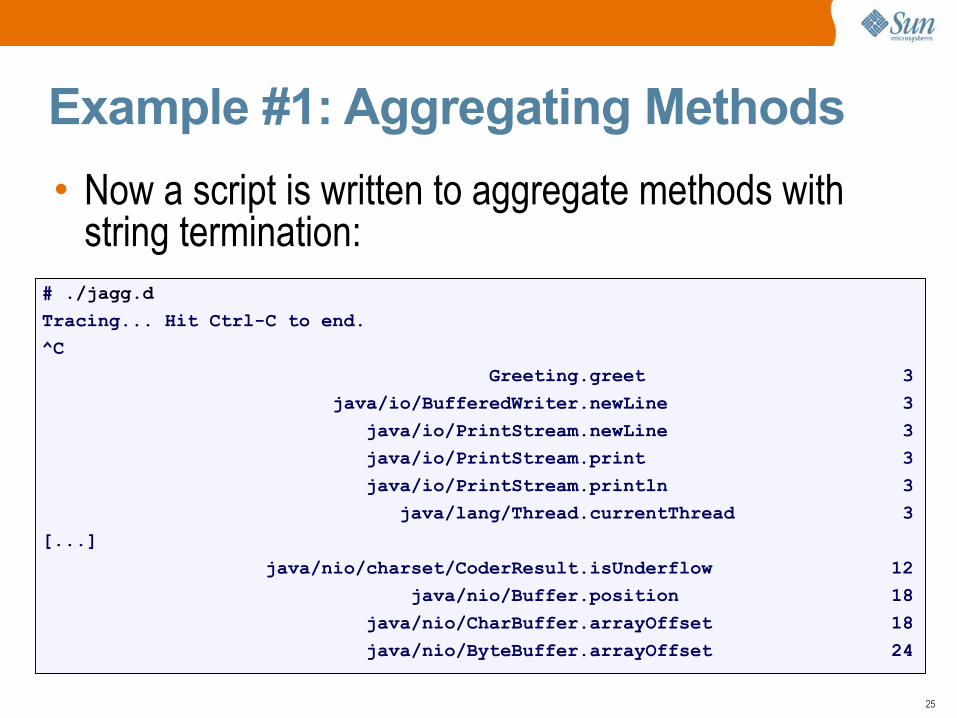
• Now a script is written to aggregate methods with string termination:
# ./jagg.d
Tracing... Hit Ctrl-C to end.
^C
Greeting.greet 3
java/io/BufferedWriter.newLine 3
java/io/PrintStream.newLine 3
java/io/PrintStream.print 3
java/io/PrintStream.println 3
java/lang/Thread.currentThread 3
[...]
java/nio/charset/CoderResult.isUnderflow 12
java/nio/Buffer.position 18
java/nio/CharBuffer.arrayOffset 18
java/nio/ByteBuffer.arrayOffset 24
26
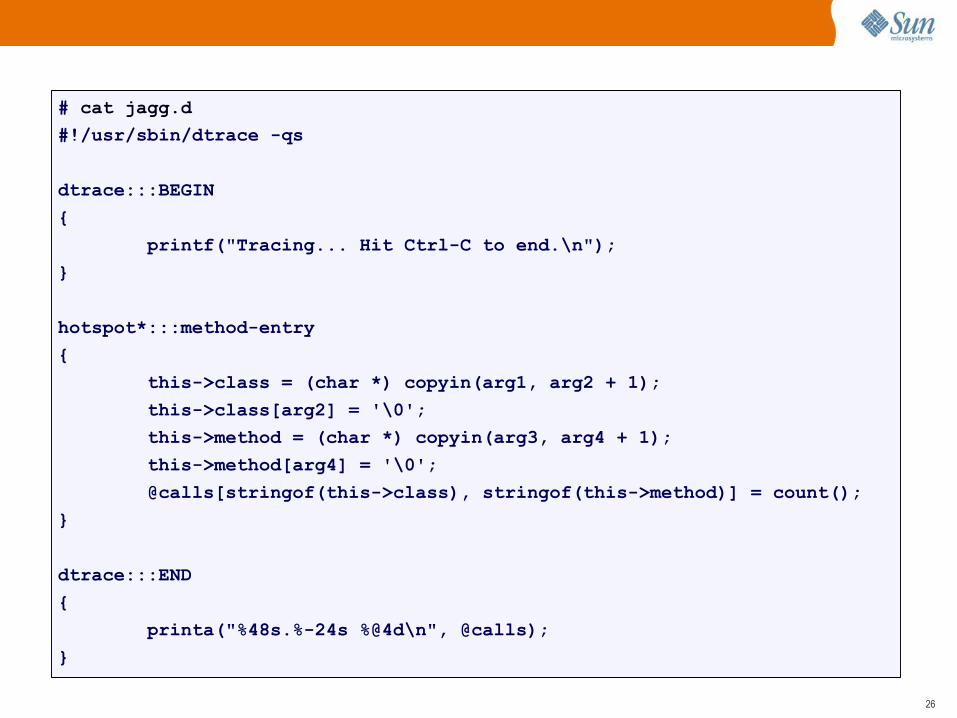
# cat jagg.d
#!/usr/sbin/dtrace -qs
dtrace:::BEGIN
{
printf("Tracing... Hit Ctrl-C to end.\n");
}
hotspot*:::method-entry
{
this->class = (char *) copyin(arg1, arg2 + 1);
this->class[arg2] = '\0';
this->method = (char *) copyin(arg3, arg4 + 1);
this->method[arg4] = '\0';
@calls[stringof(this->class), stringof(this->method)] = count();
}
dtrace:::END
{
printa("%48s.%-24s %@4d\n", @calls);
}
27
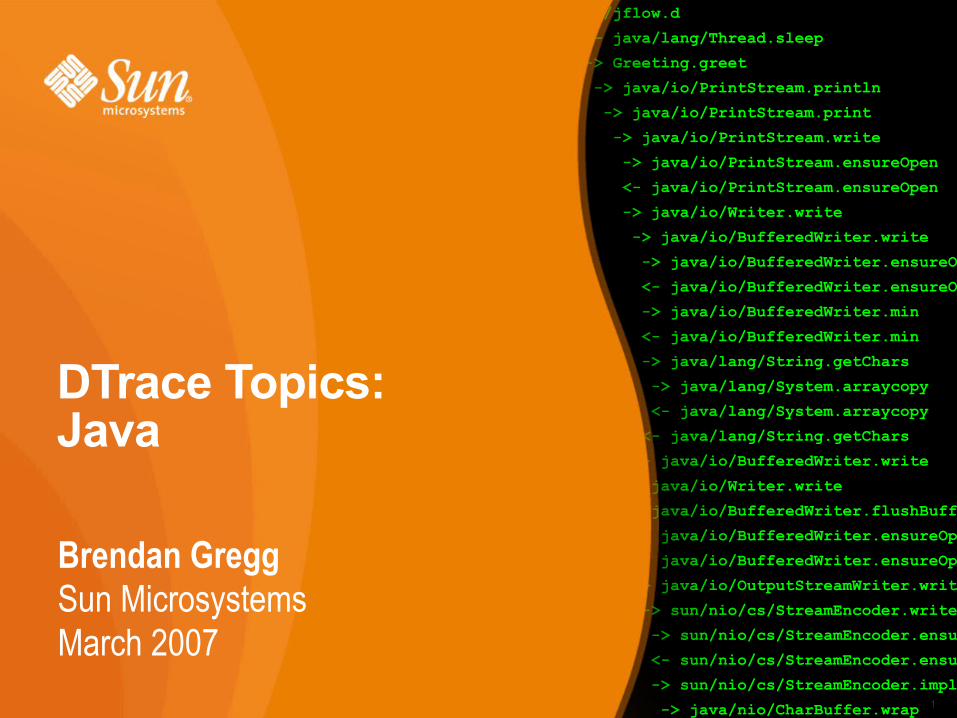
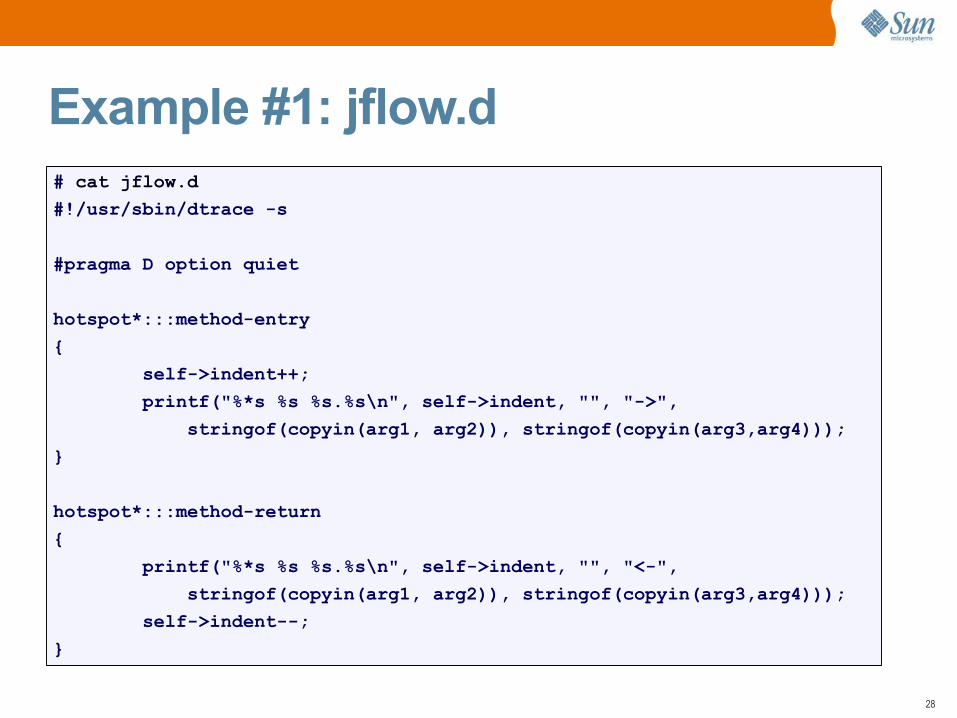
Example #1: Method Flow
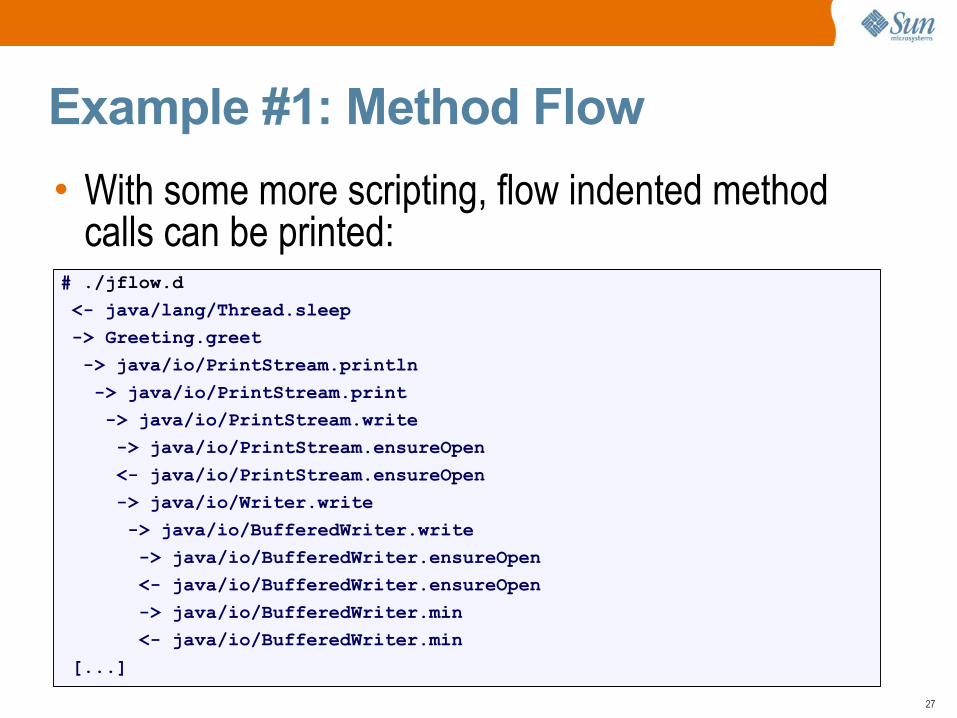
• With some more scripting, flow indented method calls can be printed:
# ./jflow.d
<- java/lang/Thread.sleep
-> Greeting.greet
-> java/io/PrintStream.println
-> java/io/PrintStream.print
-> java/io/PrintStream.write
-> java/io/PrintStream.ensureOpen
<- java/io/PrintStream.ensureOpen
-> java/io/Writer.write
-> java/io/BufferedWriter.write
-> java/io/BufferedWriter.ensureOpen
<- java/io/BufferedWriter.ensureOpen
-> java/io/BufferedWriter.min
<- java/io/BufferedWriter.min
[...]
28
Example #1: jflow.d# cat jflow.d
#!/usr/sbin/dtrace -s
#pragma D option quiet
hotspot*:::method-entry
{
self->indent++;
printf("%*s %s %s.%s\n", self->indent, "", "->",
stringof(copyin(arg1, arg2)), stringof(copyin(arg3,arg4)));
}
hotspot*:::method-return
{
printf("%*s %s %s.%s\n", self->indent, "", "<-",
stringof(copyin(arg1, arg2)), stringof(copyin(arg3,arg4)));
self->indent--;
}
29
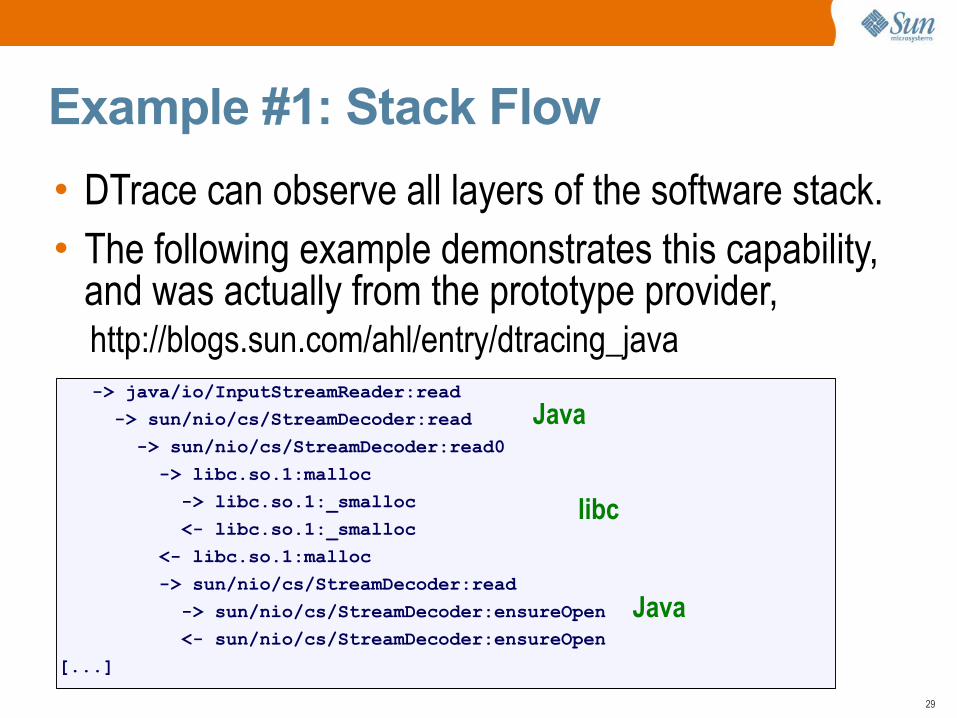
Example #1: Stack Flow
• DTrace can observe all layers of the software stack.• The following example demonstrates this capability,
and was actually from the prototype provider,http://blogs.sun.com/ahl/entry/dtracing_java
-> java/io/InputStreamReader:read
-> sun/nio/cs/StreamDecoder:read
-> sun/nio/cs/StreamDecoder:read0
-> libc.so.1:malloc
-> libc.so.1:_smalloc
<- libc.so.1:_smalloc
<- libc.so.1:malloc
-> sun/nio/cs/StreamDecoder:read
-> sun/nio/cs/StreamDecoder:ensureOpen
<- sun/nio/cs/StreamDecoder:ensureOpen
[...]
Java
Java
libc
30
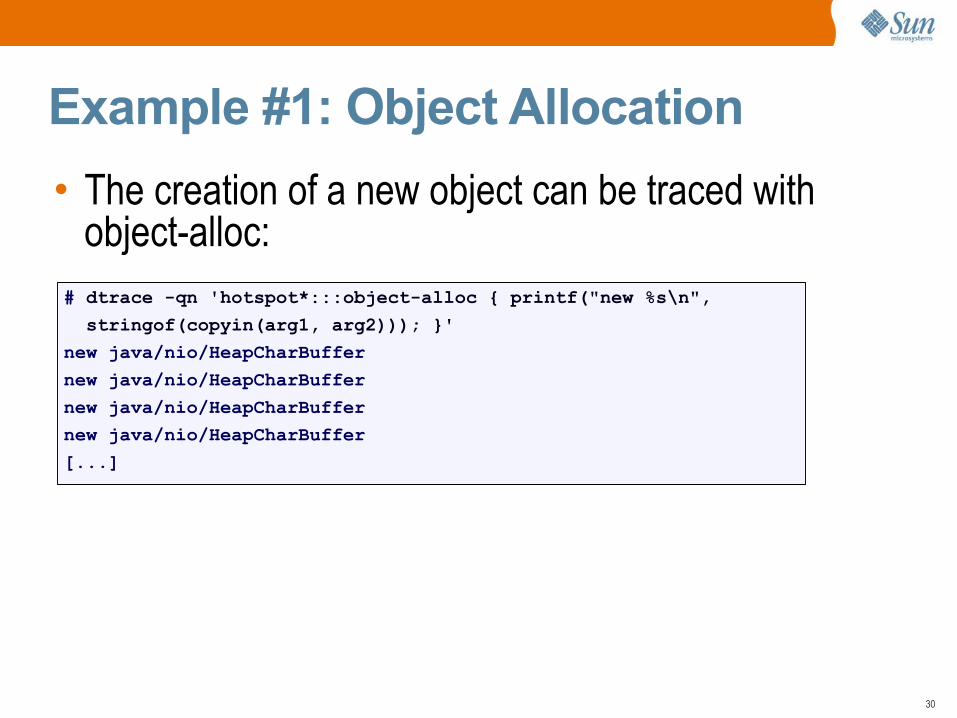
Example #1: Object Allocation
• The creation of a new object can be traced with object-alloc:
# dtrace -qn 'hotspot*:::object-alloc { printf("new %s\n",
stringof(copyin(arg1, arg2))); }'
new java/nio/HeapCharBuffer
new java/nio/HeapCharBuffer
new java/nio/HeapCharBuffer
new java/nio/HeapCharBuffer
[...]
31
Example #1: Method Times
• With method-entry and method-return probes, and DTrace's ability to measure nanosecond timestamps, the time to execute methods can be measured.• This can help identify bottlenecks in Java code.• Things start to get a little harder. Be aware of,> overlapping methods> multiple Java threads executing concurrently> Java threads context switching off the CPUs> DTrace overheads at nanosecond resolutions> recursive methods?

32
Example #1: What's next
• Further analysis can be performed using:> Other hotspot probes> Other DTrace providers> Scripting to identify events of interest
• The possibilities for analysis are near-endless. This is great if you are troubleshooting a known problem – as DTrace should have the power to find it.
33
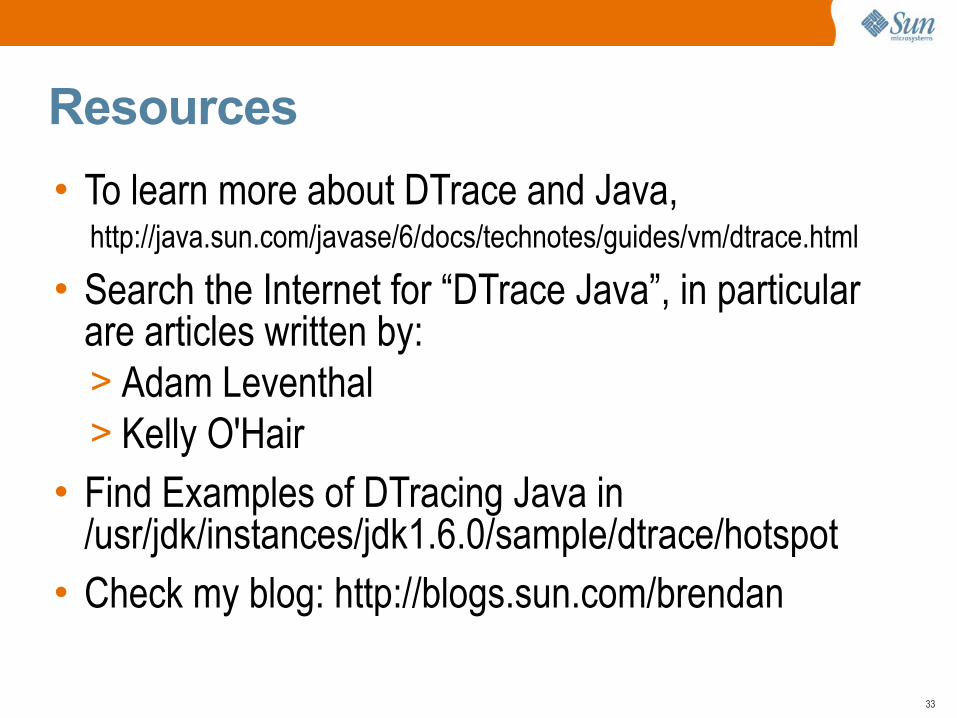
Resources
• To learn more about DTrace and Java,http://java.sun.com/javase/6/docs/technotes/guides/vm/dtrace.html
• Search the Internet for “DTrace Java”, in particular are articles written by:> Adam Leventhal> Kelly O'Hair
• Find Examples of DTracing Java in /usr/jdk/instances/jdk1.6.0/sample/dtrace/hotspot• Check my blog: http://blogs.sun.com/brendan