dunkin brands group technical analysis charts
TRANSCRIPT

November 6, 2015
DNKN: Dunkin Brands Group technical analysis charts
On Thursday, compared to Wednesday, price action opened lower (41.54, vs
Wednesday’s close of 41.64), saw a lower high (41.71, vs Wednesday’s high of
41.84) and lower low (41.14, vs Wednesday’s low of 41.37); and closed lower
(41.45, vs Wednesday’s close of 41.64). The day’s range was 57 ticks.
On the 20-DAY MOVING AVERAGE ENVELOPE CHART below, price action fell away
from the bottom of the 20 day moving average envelope (41.59). The parameters
of the envelope (40.34-42.83) are pointing lower.
The RSI (41.18) below is in neutral mode between the key 20 (oversold) and 80
(overbought) levels.

November 6, 2015
The MACD 12 day moving average is above the MACD 26 day moving average;
both are above zero and falling.
The Slow Stochastics, below, are in positive mode, with the K line above the D
line.
The Commodity Channel Index (-30.49), below, is in positive mode above the
oversold -200 level.
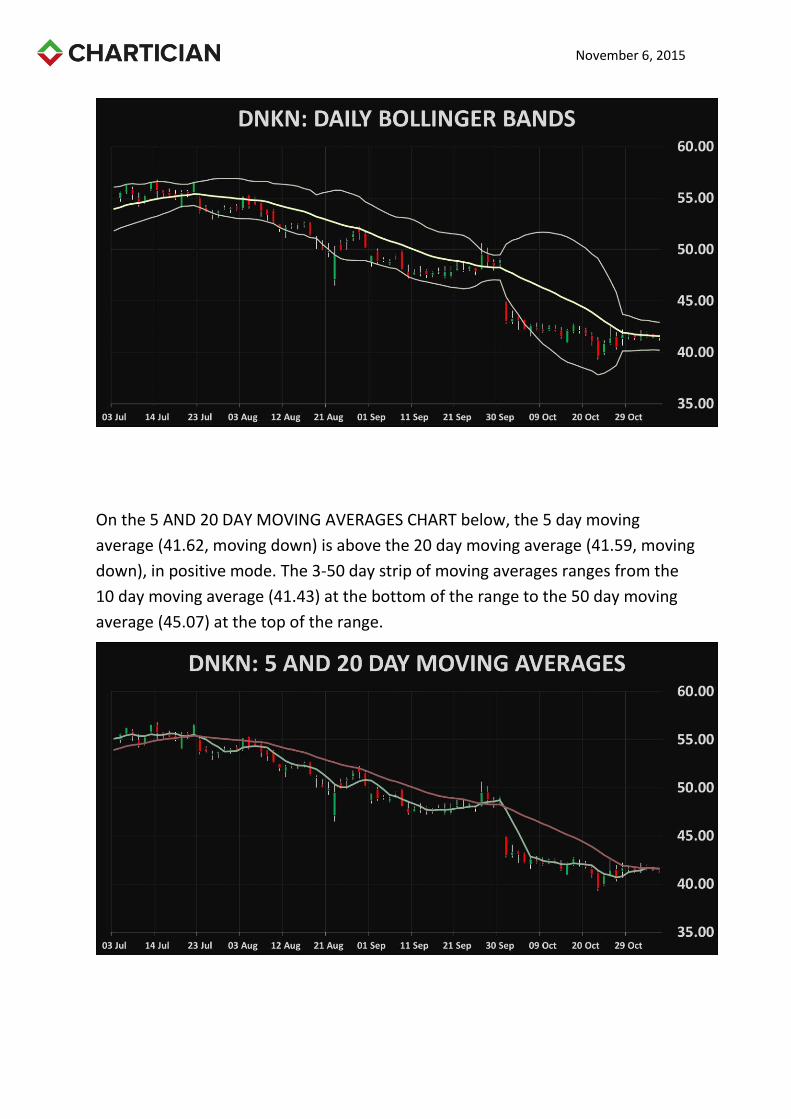
On the DAILY BOLLINGER BANDS CHART below, Thursday represents the 3rd
consecutive close below the middle of the Bollinger Band envelope (41.59). The
Bollinger Bands (40.23-42.94) are pointing lower; and narrowed from a width of
276 ticks on Wednesday to a width of 271 ticks on Thursday.
November 6, 2015
On the 5 AND 20 DAY MOVING AVERAGES CHART below, the 5 day moving
average (41.62, moving down) is above the 20 day moving average (41.59, moving
down), in positive mode. The 3-50 day strip of moving averages ranges from the
10 day moving average (41.43) at the bottom of the range to the 50 day moving
average (45.07) at the top of the range.

November 6, 2015
The Parabolic Stop and Reverse (39.88) below is in the 9th day of buy mode.
On the WEEKLY BOLLINGER BANDS CHART below, last week represents the 2nd
consecutive close below the middle of the Bollinger Bands envelope (49.09). The
Bollinger Bands (38.63-59.54) are pointing lower; expanding from a width of 2,000
ticks on Wednesday to a width of 2,091 ticks on Thursday.