dynamic commercialization strategies for …
TRANSCRIPT

NBER WORKING PAPER SERIES
DYNAMIC COMMERCIALIZATION STRATEGIES FOR DISRUPTIVE TECHNOLOGIES:EVIDENCE FROM THE SPEECH RECOGNITION INDUSTRY
Matt MarxJoshua S. GansDavid H. Hsu
Working Paper 19764http://www.nber.org/papers/w19764
NATIONAL BUREAU OF ECONOMIC RESEARCH1050 Massachusetts Avenue
Cambridge, MA 02138December 2013
We thank Ronnie Chatterji, Jason Davis, Chuck Eesley, April Franco, Thomas Hellmann, RamanaNanda, Henry Sauermann, Scott Stern, and Ezra Zuckerman, as well as audience members at the AtlantaCompetitive Advantage Conference, the BYU-Utah Winter Strategy Conference, Carnegie Mellon,University of Chicago, the Duke Strategy Conference, Georgia Tech, Harvard Business School, theHBS-MIT Strategy Conference, INFORMS, London Business School, Stanford, University of Toronto,and Wharton for helpful comments. We acknowledge funding from the Wharton Mack Institute forInnovation Management and the MIT Sloan Roberts E-Center Fund. We thank Greg Hum, JacalynMartelli, Lydia Volaitis, and Tianyu Wang for research assistance and are especially indebted to WaltTetschner of ASRNews and Bill Meisel of TMA Associates for help obtaining archival materials.The views expressed herein are those of the authors and do not necessarily reflect the views of theNational Bureau of Economic Research.
At least one co-author has disclosed a financial relationship of potential relevance for this research.Further information is available online at http://www.nber.org/papers/w19764.ack
NBER working papers are circulated for discussion and comment purposes. They have not been peer-reviewed or been subject to the review by the NBER Board of Directors that accompanies officialNBER publications.
© 2013 by Matt Marx, Joshua S. Gans, and David H. Hsu. All rights reserved. Short sections of text,not to exceed two paragraphs, may be quoted without explicit permission provided that full credit,including © notice, is given to the source.
Dynamic Commercialization Strategies for Disruptive Technologies: Evidence from the SpeechRecognition IndustryMatt Marx, Joshua S. Gans, and David H. HsuNBER Working Paper No. 19764December 2013JEL No. O32
ABSTRACT
When startup innovation involves a potentially disruptive technology – initially lagging in the predominantperformance metric, but with a potentially favorable trajectory of improvement – incumbents maybe wary of engaging in cooperative commercialization with the startup. While the prevailing theoryof disruptive innovation suggests that this will lead to (exclusively) competitive commercializationand the eventual replacement of incumbents, we consider a dynamic strategy involving product marketentry before switching to a cooperative commercialization strategy. Empirical evidence from the automatedspeech recognition industry from 1952-2010 confirms the main prediction of the model.
Matt MarxMassachusetts Institute of Technology50 Memorial Dr., E52-561Cambridge, MA [email protected]
Joshua S. GansRotman School of ManagementUniversity of Toronto105 St. George StreetToronto ON M5S 3E6and [email protected]
David H. HsuUniversity of PennsylvaniaWharton School2000 Steinberg-Dietrich HallPhiladelphia, PA [email protected]

"
""
2
1 Introduction
Entrepreneurs seeking to commercialize their technical innovations often rely on cooperative
strategies, such as technology licensing, with other organizations. They do so both to access the skills or
assets they may not possess and to minimize competitive effects. Given that the decision to cooperate
with incumbents is not unilateral, the incumbent must see some advantage in accessing the technology
from the innovator. If the incumbent is unsure about the value of the technology, cooperation may be
initially infeasible. Thus the entrant may find it necessary to compete in the product market, at least until
the incumbent becomes convinced regarding the value of the technology.
Consider the case of Qualcomm’s code-division multiple access (CDMA) technology for
handling cellular communications. CDMA took the controversial approach of handling multiple calls on
the same frequency simultaneously and managing the interference as opposed to sequentially as in TDMA
(time-division multiple access). Although CDMA promised to be more efficient than TDMA, there were
many skeptics including a Stanford University professor who declared that the frequency-sharing
approach would “violate the laws of physics” (Brodsky 2008: 199) and accused Qualcomm of faking its
first demonstration. Qualcomm temporarily abandoned licensing and began manufacturing both base
stations and handsets in order to prove the value of CDMA technology. It retained these complementary
businesses for several years before selling the former to Ericsson and the latter to Kyocera. In personal
communication, Qualcomm co-founder Andrew Viterbi (2012) recounted:
[F]or this large and complex opportunity it was essential to produce the infrastructure as well as the handsets…it was necessary to convince the carriers that CDMA was indeed a workable technology which had a major advantage over alternates: GSM, U.S. and Japanese TDMA standards. All of this took a lot of effort, several successful demonstrations, some luck and about three or four years; there were many skeptics.”
Qualcomm’s strategy of temporarily entering the product market and subsequently switching to the
preferred licensing model serves as an example of how firms can demonstrate the value of their
technology to would-be partners.
One category of innovations that may be particularly difficult to commercialize in a cooperative
setup are “disruptive” technologies. Disruptive technologies exhibit an initially worse performance profile
on the dimension valued by mainstream consumers (Christensen, 1997), so the gains to trade with
incumbents required for cooperative commercialization may not exist. If deployed, however, they may
exhibit a favorable trajectory of improvement. Under such a circumstance, the commercialization partner
may have little financial incentive early on to develop the innovation in-house or access it via contractual

"
""
3
means, as combining it with their existing activities is costly. However, should a potentially disruptive
technology prove to be valuable, these incentives may change. Thus, in contrast to the main predictions of
existing analyses that find incumbent firm market leadership routinely replaced in the face of disruptive
innovation by entrepreneurs, cooperative commercialization—which preserves incumbent market
leadership—may still be a long-term outcome.
We theoretically and empirically explore a two-stage commercialization strategy in which a start-
up entrant temporarily enters the product market in order to establish the value of its technology.
Ultimately, the entrant may switch to a strategy of cooperating with incumbents once uncertainty of the
disruptive technology is resolved and/or the incumbent’s costs of integrating the new technology declines.
This dynamic technology commercialization strategy (TCS) extends extant frameworks linking the
environmental, organizational, and competitive factors to an entrant’s initial choice of TCS (Teece, 1986;
Gans and Stern, 2003). Such work characterizes TCS as a one-time, static decision to cooperate with
incumbents via licensing or to compete against them in the product market.
Perhaps one reason commercialization strategy has not been explored dynamically is the
difficulty of obtaining longitudinal data regarding TCS adoption and evolution. We introduce a hand-
collected dataset tracking all entrants into the automatic speech recognition (ASR) industry from its
inception in 1952 through the end of 2010. ASR is an attractive industry for TCS analysis because its
commercialization environment leaves open a variety of possible commercialization strategies. The data
allow us to follow technology commercialization strategies on an annual basis, including when firms
change from their initial TCS. Furthermore, our long time horizon of observing industry entrants allows
us to study the relationship between innovation characteristics (e.g., disruptive technology status) and
their commercialization strategies.
Our analysis reveals that ASR entrants who introduce disruptive technologies are more likely to
adopt a two-stage commercialization strategy in which they initially compete with incumbents but later
cooperate with them. This result calls into question the notion that disruptive technologies necessarily
result in the demise of incumbents, such as in the disk-drive industry (Christensen, 1997). Although the
initially unattractive nature of disruptive technologies does entail first stage entrant/incumbent
competition, cooperation may ultimately ensue in commercialization environments where it is supported.
2 Related Literature
Tushman and Anderson (1986) classify innovation into two types according to organizational
effect. Competence-destroying innovations are those that require new organizational skills to successfully
commercialize, whereas competence-enhancing innovations build on existing organizational know-how.
Across a variety of industrial settings, researchers have found that competence-destroying innovations are

"
""
4
more likely to be initiated by new entrants, whereas industry incumbents tend to originate competence-
enhancing discontinuities (Tushman and Anderson, 1986; Christensen and Bower, 1996). This pattern
reflects the behavior of established firms, which are typically eager to invest and support innovations that
sustain and extend rates of improvement along the dimensions demanded by their mainstream consumers.
These incumbents have little financial incentive to develop or acquire innovations that are competence-
destroying given the organization’s structure of complementary assets and skills.
Entrants are more likely to originate competence-destroying innovations because they do not fear
product cannibalization and typically do not have vested positions in a pre-existing complementary asset
infrastructure. This ordinarily favors a competitive commercialization strategy. Using the predominant
static TCS framework (Teece, 1986; Gans and Stern, 2003), the lower the cost of product market entry,
including the costs of assembling the requisite downstream complementary assets for commercialization,
the more attractive is a competitive commercialization strategy. This is especially true if the
appropriability regime is weak so that the entrant’s exposure to disclosure risks when bargaining over
deal terms with industry incumbents is high. Moreover, the incumbent may have no motivation to
incorporate the entrant’s innovation if it represents a permanent threat to the incumbent’s existing
business.
In a seminal line of research, Christensen and coauthors describe a class of “disruptive
technologies” whose competence-enhancing/destroying attributes become clear only in the long run.
Disruptive technologies typically underperform existing technologies along performance dimensions of
interest to existing customers and/or appear useful primarily in niche markets too small to be of interest to
incumbents. For example, Christensen and Bower (1996) show that the lower capacity, slow access speed,
and high cost of 5.25-inch disk drives compared to existing 8-inch drives led to their rejection by
minicomputer OEMs. By contrast, “sustaining” technologies would improve capacity, access speed, etc.;
the 5.25 drive was “disruptive” to the path of continuous improvement in that it performed worse in those
respects. Of course, smaller drives later took over the market as their performance among traditional
metrics improved and their use cases became better understood.
Even in situations where cooperatively commercializing a disruptive innovation might be
preferable from the entrepreneur’s perspective, the incumbent may be hesitant to do so because utilizing it
harms existing profits. This means that an entrant may be better placed to test the efficacy and market
potential of such technologies by taking the products to market themselves. If such a test is successful, a
disruptive technology that appeared irrelevant initially may later be attractive to incumbents looking to
preserve their market position. Thus, for such technologies we may see entrepreneurs switch their
commercialization strategy. That is, competition may precede cooperative commercialization strategies
(e.g., licensing or acquisition), as was the case with Qualcomm.
"
""
5
Arora, Fosfuri, and Gambardella (2001: 430) allude to this possibility in a footnote:
“…[s]ometimes self-production is a necessary condition for successful licensing. For instance, self-
production could help assess the true value of the technology or could help identify potential bottlenecks
in technology transfer.” We build on this idea, noting that potentially disruptive innovations introduce
frictions for technology transfer. In such settings, product-market integration may indeed be a
precondition for licensing. Unable to secure cooperative commercialization partners early on, the
innovator competes against incumbents in the product market. The innovator later switches to its
preferred strategy of cooperating once incumbents have been convinced that the technology has value.
One of the main claims of Christensen (1997) is that disruptive innovation is often associated
with replacing incumbent firm market leadership despite (initial) technical underperformance in the
predominant performance dimension. However, an entrant strategy of initially competing followed by
later cooperating would suggest that in some cases of disruptive technology, incumbent market leadership
might still be preserved. Bower and Christensen (1995), in discussing managing disruptive technological
change, do consider an incumbent acquisition strategy (though not a technology in-licensing one). While
the authors acknowledge and give examples of how such acquisitions have helped preserve incumbent
market leadership, they point to both the innovator’s possible reluctance in pursuing a cooperative
strategy as well as the difficulty of successfully executing acquisitions as challenges of this strategy. The
end result is the predominant conclusion in the existing literature that disruptive innovation overturns
incumbent market leadership. We now explore how an innovator’s commercialization strategy of initial
cooperation followed by later cooperation might temper this view.
3 Model
In this section, we provide a formal model of disruptive technologies and commercialization
strategy choice. While formal models of disruptive technologies have been provided in the literature (e.g.,
Adner, 2002; Adner and Zemsky, 2005), these models have focused on the structure of consumer demand
that may give rise to entrant advantages. Those models have not considered the key choice between
cooperative and competitive commercialization that is the focus of our study here.
3.1 Model Set-Up
There are two periods, 1 and 2, where an entrant with a new technology can choose to
commercialize by either competing with an incumbent or cooperating (via licensing or acquisition) with
that incumbent. Significantly, the entrant can exercise this choice in each period and thus, may compete
or cooperate in both periods or choose one path and switch to another. In period 2, uncertainty regarding
the value of the new technology is resolved and with it the trajectory of costs associated with the

"
""
6
incumbent choosing to integrate the technology. There is a common discount factor of δ between the two
periods. In notation, suppose that an incumbent earns profits V(i) where i = 0 (with the status quo product)
and i = 1 (with a product that incorporates a new technology). There is uncertainty over the value of V(1).
With probability p, V(1) is v + V(0) and with probability 1-p, V(1) = V(0).
It is assumed that, to integrate the new technology prior to the resolution of uncertainty, the
incumbent must sink costs, CI. Having sunk such costs, the uncertainty of V(1) is resolved. Thus, if the
incumbent sinks integration costs, its expected profit is pv – CI + V(0) while if it does not, its expected
profit is V(0). In this model, CI is a measure of the difficulty an incumbent would have integrating a new
technology. As noted earlier, disruptive technologies are defined by worse performance on the
dimensions valued by mainstream customers even if they both perform better for niche consumers and
have a strong trajectory of improvement compared to existing technologies. Such technologies are
naturally harder for incumbents, with an existing set of customers, to integrate into their products. This is
also related to the limited capacity of innovations a single firm can likely commercialize at once
(Cassiman and Ueda, 2006). For example, the technical characteristics of existing products may make
integrating the new technology by picking the best of both worlds impossible. Thus, CI would represent
the degradation in product performance for existing consumers caused by integration. Even if the new
technology can be employed by the incumbent in a new product, CI may be high because launching new
products may lead to a loss in corporate focus and brand confusion. Thus, CI is a parameter that varies
and is related to the disruptiveness of the new technology. However, we assume that as more is learned
about the new technology, the costs of incumbent integration fall. Thus, in period 2, those costs can fall to
sCI (s < 1). This captures the notion that disruptive technologies can improve in their appeal to more
consumers over time.
New technologies are assumed to come from entrants. An entrant with a new technology can earn
revenue v (with certainty) and a share, a (< 1), of V(1)-V(0) if they independently enter the market and the
technology is not integrated with the incumbent. The entry costs the entrant, CE (assumed to be less than v
+ av but greater than v).1 Such entry, if it is sustained, leads to the incumbent’s status quo profit, V(0),
being reduced to bV(0) where b < 1. This only occurs if V(1) > V(0), otherwise, the entrant can earn at
most v. Thus, competitive entry involves two impacts on the industry. First, the entrant must sink entry
costs to build duplicative product market assets of the kind emphasized by Teece (1986). Second, entry
potentially results in a competitive effect and dissipates incumbent market power rents (Gans and Stern,
"""""""""""""""""""""""""""""""""""""""""""""""""""""""""""""1 Thus, entry can be justified if the incumbent does not integrate the new technology and not otherwise. This assumption simplifies the cases examined in what follows and relaxing it would not appreciably change the results below. Importantly, if entry costs are sunk, the entrant will continue in the industry and earn v. Note that, unlike CI, CE does not fall as more about the technology is learned. This assumption seems conservative as there are reasons to suppose that for new entrants, entry can grow more difficult over time as uncertainty is resolved (see Foster, 1986).

"
""
7
2000). By contrast, if an entrant engages in cooperative commercialization with an incumbent, the
incumbent can maintain its profits but still must sink costs, CI, in integration. This is a novel assumption
for the model presented here, and distinguishes our contribution from the past literature on
commercialization choices (Chatterji and Fabrizio, 2013).
This can be most clearly seen if we consider commercialization choice as a ‘once-off’ decision
that is taken initially prior to uncertainty being resolved. Under cooperative commercialization, the
entrant licenses the technology to the incumbent. As the incumbent integrates the technology, the entrant
can earn at most v by entering and so does not do so. Thus, the total surplus accruing to the incumbent
and entrant is:
(1+δ )( pv +V (0)− t)−CI
Incumbent's profit under Coop! "#### $####
+ (1+δ )t
where t is the license fee paid by the incumbent to the entrant. By contrast, the entrant engages in
competition, total surplus becomes:
(1+δ )(v + pav)−CE
Start-up Profit under Comp! "### $###+ (1+δ )( pbV (0) + (1− p)V (0))
Incumbent Profit under Comp! "##### $#####
(1+δ )V (0) if
(1+δ )(v + pav) ≥ CE
(1+δ )(v + pav) < CE
Thus, the total gains from cooperation relative to competition are
(1+δ ) p(1− a)v + p(1− b)V (0)− v( )−CI + CE (if entry is credible) and (1+δ ) pv −CI (otherwise). Thus,
a higher CI reduces the probability that cooperative commercialization occurs (Gans and Stern, 2003).2
3.2 Multiple Commercialization Choice Rounds
Here we want to model a situation where the initial commercialization choice might be re-
evaluated and reversed following the resolution of uncertainty. Thus, we assume there are two periods. In
period 1, the start-up chooses whether to compete or cooperate with the incumbent. At the end of that
period, uncertainty concerning V(1) is resolved. In period 2, the start-up, regardless of whether it chose to
license or not in period 1, chooses again whether to cooperate or compete from that point on.
Working backwards, consider the entrant’s decision in period 2. First, if there has been
competition in period 1 and the new technology is valuable, the total surplus from cooperation in period 2
is v + v +V (0)− sCI while the total surplus from competition is v + av + bV (0) (as entry costs have
already been incurred). Thus, cooperation will be chosen if (1− a)v + (1− b)V (0) > sCI (that is, if
"""""""""""""""""""""""""""""""""""""""""""""""""""""""""""""2 Throughout this model we focus on total surplus and how commercialization choice impacts that. As Gans and Stern (2000) and Gans (2012) demonstrate, this is what determines whether cooperative commercialization takes place or not. We could have used the Nash bargaining solution at each point commercialization strategy is chosen, but have chosen not to in order to economize on notation.
"
""
8
preservation of monopoly rents exceeds the costs of integrating the technology). Note that, if the new
technology is not valuable, the gains from licensing in period 2 are (1− b)V (0)− sCI .
Second, if there has been cooperation in period 1 and the new technology is valuable, the total
surplus from cooperation in period 2 is v +V (0) (as integration costs have already been sunk) while the
total surplus from competition is v + av + bV (0)−CE . Thus, cooperation will be chosen if
(1− a)v + (1− b)V (0) + CE ≥ v . However, as v < CE this implies that cooperation, if chosen initially, will
continue if the technology is valuable. If the new technology is not valuable, there are no further gains to
entry and hence, the entrant effectively exits at this point.3
Given this, we can now consider the period 1 commercialization choice. The total expected
surplus from cooperation initially is:
(1+δ )V (0) + (1+δ ) pv −CI (1)
and the total expected surplus from initial competition is:
(1+δ )v + p(av + bV (0)) + pδ (v +V (0)− sCI ) + (1− p)δV (0)−CE
(1+δ )v + p(av + bV (0)) + pδ (v +V (0)− sCI ) + (1− p)δbV (0)−CE
(1+δ )v + p(1+δ )(av + bV (0)) + (1− p)δbV (0)−CE
if
(1− b)V (0) > sCI
(1− a)v + (1− b)V (0) > sCI ≥ (1− b)V (0)
(1− a)v + (1− b)V (0) ≤ sCI
(2)
Given this, Figure 1 depicts the equilibrium outcomes in (CE, CI) space. Note that, if CE is high relative to
CI, then cooperation is chosen initially. In this model, that also implies that cooperation continues
following the resolution of uncertainty. By contrast, if CI is high relative to CE, then competition is chosen
initially. Here, however, two factors may cause a change in commercialization strategy. First, if
uncertainty is resolved in favor of a valuable technology, the gains from trade to cooperation rise and so a
switch to cooperation could occur. Second, even in the absence of a favorable state on technology value, a
switch could arise as the use of the technology in competition may improve the trajectory of performance
for the new technology and reduce the integration costs (i.e., s could be low). In this case, a switch occurs
because integration costs following competition are lower.
As noted earlier, disruptive technologies are characterized by (a) high costs of integration with
the incumbent’s technology initially and (b) a trajectory of rapid performance improvement on traditional """""""""""""""""""""""""""""""""""""""""""""""""""""""""""""3 Conceptually, the model thus far considers licensing as the mode of cooperative commercialization. The assumption here was that the incumbent would not be able to license a technology and then not use it. That it may not want to use it would be driven by the existence of CI but for the entrant, this would mean that licensing would not reveal the technology’s value and hence, would potentially harm future returns. That said, if an incumbent were to acquire the entrant, then it would be a more plausible outcome that the technology might be shelved. However, from the entrant’s perspective, it is reasonable to suppose that acquisition, should it occur, would not be reversible and would be observationally an exit from the perspective of empirical analysis. Here, because cooperation persists when chosen, the model’s conclusions apply equally to acquisitions and licenses as modes of cooperative commercialization and will be treated as such in the empirical tests that follow. For a perspective on where licensing and acquisition may differ in observational outcomes see Gans (2012).

"
""
9
performance metrics. The former characteristic was captured by CI and the second was captured in our
model by s. The model demonstrates that as CI gets higher and s gets lower (consistent with a technology
being more disruptive), the set of parameters that supports an equilibrium commercialization strategy
involving competing initially and then switching to cooperation becomes larger. Thus, we have the
following hypothesis:
H1: Disruptive technologies will be associated with a higher level of competition initially, followed by a switch to cooperation (either licensing, acquisition or both).
Intuitively, disruptive technologies are hard for incumbents to integrate especially during the phase when
their value is still being established. Instead, when CI is high relative to CE, entrants are more efficient in
conducting the necessary market experiments to establish the technology’s value and also set it on a path
to potentially higher performance on traditional metrics. If that latter path does not arise, competition will
continue in the long-term. But if the technology is valuable, this will represent a greater threat to
incumbent rents and if the improvement path is rapid, lower costs to ex-post integration of the technology
into existing products. Thus, following the resolution of uncertainty and the realization of performance
gains, there will be an incentive for the entrant to cooperate with the incumbent ex-post. It is this latter
change in commercialization incentives that we believe has been neglected in the prior theory of the
impact of disruptive technologies and that is, in fact, an important part of commercialization of those
technologies.
4 Data
We test the prediction of this model using a new, hand-collected dataset of the automatic speech
recognition (ASR) industry from its inception in 1952 through the end of 2010. ASR technology converts
spoken language into text by modeling the sound waves generated by the human vocal tract. It is a
science-based industry whose technology was incubated for many years in corporate and university
research labs before coming to market. The earliest recorded ASR research effort was in 1952, when
scientists at AT&T Bell Laboratories built a machine that could recognize the digits zero through nine
when spoken in isolation. Similar projects sprang up shortly thereafter at nearby RCA Laboratories and
Lincoln Laboratories in the U.S., as well as internationally at London’s University College, Kyoto
University, and NEC. The early 1960s brought the entry of Texas Instruments and the founding of IBM’s
T.J. Watson Research Center, which invested in ASR. The industry’s first company dedicated exclusively
to ASR was Threshold Technology, spun out of RCA Labs. Threshold’s early success is said to have
strongly influenced the Department of Defense Advanced Research Projects Agency (DARPA) decision
to initiate public funding of basic ASR research. Since then, ASR has been used for myriad applications
"
""
10
including radiology dictation, plush toys that respond to voice, remote access to personal computers, 411
directory assistance automation, personal telephone assistants, and podcast transcription.
ASR is an attractive industry for this study for at least two reasons. First, it represents a
commercialization environment where cooperating with incumbents does not strongly dominate
competing in the product market or vice versa. Technology is strongly excludable, with ASR firms having
filed more than 3,000 patents. While complementary assets are often needed to bring innovations to
market, including custom application development, many ASR entrants integrated into those assets
Qualcomm-style in order to compete in the product market. This stands in contrast to other industries,
such as automotive or biotechnology, where complementary assets such as clinical trials are so expensive
and difficult for a startup to undertake that new entrants can hardly hope to “go it alone” (Baum,
Calabrese, and Silverman, 2000). And there is little risk that the algorithms can be expropriated when
included as part of an end-user product.
Second, ASR is an industry where considerable uncertainty surrounds the value of new
innovations. At first glance this might seem surprising, as the performance of an algorithm ought to be
verifiable. Indeed, many ASR companies have published performance claims for many years. As early as
September 1981 Interstate Electronics Corporation claimed 85% accuracy for its speech recognition
technology. One month later, competitor Weitek claimed 90% accuracy and the month after that, IBM
claimed 91% accuracy. By February of the following year, Votan claimed 99% accuracy, matched that
summer by Interstate Electronics and soon after by Verbex, NEC America, Dragon Systems, Kurzweil,
Integrated Wave, General Instrument, and others. Such claims made it difficult for potential licensees to
discriminate among technology suppliers, as reflected by the National Bureau of Standards’ observation
regarding “the present untenable situation of nearly all vendors claiming 99% accuracy” (Creitz, 1982).
The National Research Council echoed these concerns, lamenting that “there are no established/uniform
procedures for the design, comparison, and evaluation of speech recognition” (Creitz, 1984).
Additionally, some ASR entrants employed disruptive technologies. Before describing these, it is
worth noting that numerous sustaining technologies have been used in the industry. Early use of Linear
Predictive Coding were widely replaced by Hidden Markov Models following Lawrence Rabiner’s 1983
discovery (Juang and Rabiner, 2004), which enabled more flexible searching and larger vocabulary sizes
than previously. Extensive corpora of speakers saying various words and phrases are captured and used to
train systems to improve accuracy. These and other “sustaining” innovations were generally aimed at
increasing performance among existing performance criteria such as accuracy and vocabulary size.
However, other ASR innovations could instead be regarded as potentially disruptive. Such innovations
may not perform as well on traditional metrics and thus may be less attractive to potential cooperation
partners who may regard their value as suspect. Three such innovations are listed below:

"
""
11
1) Software-only. ASR involves intensive audio signal processing, so early systems generally
required algorithms to run on specialized DSP chips or standalone processing units. For example,
Speech Systems Inc.’s 1988 MEDTRANS radiology dictation system tethered dedicated
hardware to a Sun Microsystems workstation, which provided the user interface. While the move
to software promised both cost reduction and convenience as dedicated hardware was eliminated,
these came at the expense of performance tradeoffs in vocabulary size and (likely) accuracy.
Consequently, many firms were reluctant to abandon hardware acceleration.
2) Word-spotting. Speech recognizers generally operate by attempting to decode all words spoken
by the user, as is necessary in a dictation program. For some applications, however, it is less
important to understand everything the user said and more important to capture a few key
commands. As an example, some automated telephone call routing systems are designed to pick
out the words “operator” and “collect call” while ignoring whatever else the user happened to say.
Word-spotting promised to be advantageous for a niche set of applications, but the so-called
“garbage models” required to filter out unwanted speech could be unreliable. Moreover, only a
small number of keywords could generally be handled by such systems.
3) Grammar-free recognition. Historically, speech recognition systems were configured to
recognize from a set of words or phrases called a “recognition grammar.” The internal phonetic
lattices generated by a statistical “Hidden Markov Model” search are pruned by comparing them
against the set of allowed word sequences within the grammar. In grammar-free recognition, the
results are not strictly filtered by a set of allowable phrases; the user may, in a sense, “say
anything.” Of course, the system may not recognize unusual or nonsensical utterances, but if the
acoustic evidence is strong enough, it may override the prior word-sequence probabilities in the
bigram/trigram models.
In the analysis section, we present evidence suggesting that these technologies indeed were disruptive in
that they underperformed existing technologies initially but gradually improved over time.
The data for our study comprise nearly sixty years since the inception of the ASR industry. The
original archives consist of approximately 15,000 pages of several monthly trade journals variously
spanning the years 1981 through 2010, as well as a historical account of the industry from its inception in
1952.4 While it is possible that some firms have been omitted from the newsletters or historical
documents, even obscure companies were covered in detail. These trade journals offer the ability to
characterize entrepreneurs’ backgrounds and choices “as it happened” from third-party accounts rather
than relying on retrospective reconstruction of events. Moreover, they offer detail regarding the strategy
formulation process that is unavailable from business registers or other traditional data sources. """""""""""""""""""""""""""""""""""""""""""""""""""""""""""""4 Few firms were active in the 1970s and earlier, and results are robust to omitting pre-1981 data.
"
""
12
The first author, along with research assistants, read and coded the monthly trade journals by
hand. We noted in each article the ASR firms mentioned, and coded them as “active” in that month. A
firm was counted as having entered the industry as of its first mention in the trade journals. A firm was
coded as having left the industry when a trade journal article noted that it either ceased operations in the
ASR industry or was acquired by another company. For firms that were never noted to have left the
industry, we checked current corporate websites to ensure that they were still operating in the ASR
industry as of December 2010. For the few that were not, we attempted to determine their date of exit
from public sources; when such information was not otherwise available, we backdated their exit date to
their final mention in the trade journals. Patterns of entry and exit are depicted in Figure 2.
Figure 2 about here
4.1 Technology Commercialization Strategies (TCS) Variables
Perhaps most unique to our study, we coded commercialization strategies undertaken by the firm.
The adoption of a particular TCS was coded as having taken place the month it was reported in the trade
journal. Firms that competed directly for end customers by offering products or services were classified as
having adopted a “Compete” strategy. For example, Dragon Systems sold software enabling consumers to
dictate onto their personal computers. Tellme Networks offered an advertising-supported 1-800 number
for retrieving sports scores, stock quotes, etc. on its voice platform. Firms were categorized as adopting a
Compete strategy if, using information from the trade journals, they sold end-user products, built custom
solutions, or provided an advertising-supported service. By contrast, ASR firms that licensed technology
or development tools were classified as having a “Cooperate” strategy. As examples, BBN licensed its
ASR technology and VoiceObjects supplied toolkits that companies used to build end-user applications.
If both compete and cooperate strategies were mentioned at entry, the firm was coded as having started
with them simultaneously as a “mixed mode” (Teece, 1986).
A shift of commercialization strategy from Compete to Cooperate or vice versa was coded as
such only if an initial TCS was noted in the newsletters, followed by a subsequent mention of a different
TCS. The variable switched TCS was set to 1 for a given firm-year observation if the firm had previously
changed from its initial TCS, and 0 otherwise. Sub-categorizations of this variable were also noted for
firms switching from Cooperate→Compete and vice versa. As an example of a switch from a Cooperate
to a Compete strategy, Nuance Communications initially embarked on a cooperative commercialization
strategy involving technology licensing and the sale of development toolkits. But a December 2002 trade
journal article described Nuance’s switch to a competitive TCS: “Nuance has in the past emphasized sales
through partners…contribut[ing] 82% of Q3 revenues. Nuance will develop and sell pre-packaged

"
""
13
applications directly, and has formed an applications group to develop the applications. Nuance will sell
directly to end-user customers” (Meisel 2002, emphasis ours).
As an example of switching from Compete→Cooperate, Vlingo Corporation began by integrating
its speech recognition technology into a downloadable application for smartphones, only later entering
into OEM licensing agreements with device manufacturers. Vlingo was among the early adopters of
grammar-free speech recognition for cellular phones, which was a bold move that met with skepticism
regarding its feasibility. Vlingo began demoing its grammar-free speech recognition for phones in early
2005, fully five years before the entrant Siri released its iPhone application. At the time, most ASR
technologies for mobile phones were embedded into the handset, offering limited functionality such as
dialing phone numbers by voice. Vlingo offered to dictate text messages and perform freeform internet
searches, taking advantage of recently introduced, but not yet widely available 3G data networks. Michael
Phillips, co-founder of Vlingo, recalled his firm’s reasons for adopting a dynamic commercialization
strategy: “Having the consumer product greatly strengthened our ability to get the OEM deals – prove the
technology works, and to be the safe choice for the OEMs because they know that consumers will like it.
Even if you are losing money on the direct to consumer [product] that is OK because you will make it up
on the OEM [licensing deals]. We cut back on the consumer effort – the pressure meant we needed to
divert the resources.” (Phillips, 2013).
In analyzing switches from one TCS to another, one must decide how to classify firms that started
with a Compete strategy and then were acquired. The literature on commercialization strategy generally
treats acquisitions as examples of a Cooperate strategy, as the firm ceases to compete against others either
in the product or licensing market (e.g., Gans, Hsu, and Stern, 2002). Moreover, the decision to align
oneself through acquisition is an irreversible strategic decision. Accordingly, our default analysis treats
companies that started with a Compete strategy and then were acquired (or adopted a licensing strategy)
as having switched to a Cooperate strategy. We also provide robustness tests for our main findings by not
considering acquisitions as instances of cooperation.
In models where acquisitions are treated as cooperation, we count only “attractive” acquisitions,
as opposed to the purchase of a company (or its assets) at a “fire sale” price resulting in little or no
financial gain for shareholders. Following Arora and Nandkumar (2011), we classify an acquisition as
attractive if it meets the following criteria. First, for venture capital-backed ventures, the acquisition price
must exceed the invested capital. Second, for non-VC-backed ventures (or VC-backed ventures where the
acquisition price was not available), either evidence from press releases and news stories that the founder
or CEO of the focal firm joined the acquirer or an upward sales and/or headcount growth trend must exist.
We implemented these criteria by retrieving acquisition values from SDC, Zephyr, and other public
sources, by reviewing press materials associated with the acquisition and by assessing headcount and

"
""
14
sales trends using data from Dun & Bradstreet (Walls, 2010). Using this method to determine whether
sales and headcount grew or shrank in the year prior to the acquisition, approximately one-quarter of
acquisitions were classified as unattractive.
4.2 Adopting Possibly-Disruptive Technologies Variable
Our theory proposes initial competition followed by eventual cooperation as a means of
mitigating uncertainty regarding the commercial value of a technology. As described above, we exploit
firms’ adoption of potentially-disruptive ASR technologies as a measure of increased uncertainty
regarding commercialization value. As described above, these are 1) software-only, 2) word-spotting, and
3) grammar-free (introduced in 1990, 1992, and 2001 respectively). We flag a firm as a “pioneer” if it
adopts any of these technologies within three years of its initial introduction into the market, (results are
robust to a two- or four-year window). For example, Logica Cambridge (UK) introduced word-spotting in
April 1992. Logica Cambridge and other firms adopting speaker adaptation by April 1995 are marked as
having adopted this potentially-disruptive technology. We reason that such technologies, which typically
deliver poorer performance along existing dimensions, will be perceived as having particularly uncertain
commercialization value when they are first introduced.
In firm-level analyses, we use a non-time-varying indicator of whether the firm ever adopted a
potentially disruptive technology. Longitudinal analyses at the firm-month level instead use a time-
varying variable, set to 1 only in the year the firm adopted the potentially disruptive technology. Results
also hold when coding the variable as 1 in the year of adoption, and “decaying” thereafter by setting the
value in subsequent years to 1/n where n is the number of years since adoption.
4.3 Control Variables
In addition to dates of operation, we collected data regarding organizational heritage as well as
strategic choices. Organizational data included whether the company was a de alio or de novo entrant, and
is motivated by the literature suggesting that organizational heritage implies different beginning
knowledge, even if firms are founded at the same time (e.g., Helfat and Lieberman, 2002). For de novo
startups, we recorded whether any of the founders had previously worked at another ASR firm (these
firms are coded as spinoff firms, following the convention in the literature). For most firms, the trade
journals contained information allowing us to code these organizational heritage variables; where such
information was not available, we consulted public sources including company websites to determine the
founders’ prior work experience. In a small number of cases where these sources proved uninformative,
we contacted founders to ask whether they had had prior experience in the ASR industry. We were able to
characterize the heritage of all but 35 de novo firms (results are similar whether we exclude these
unclassifiable de novo firms, assume that they were spinoffs, or assume that they were not). We also

"
""
15
noted whether the de novo companies were sponsored by their parent firms, either in part or as wholly-
owned subsidiaries (classified as de alio). We also recorded funding, leadership transitions, and patents.
(Note: all results are robust to the use of patent citations instead of patents alone.) Financing sources
included venture capital (cross-checked with VentureXpert), government, banks, other firms, or the public
markets (i.e., IPOs). To round out the organizational variables, CEO transitions were noted, and data on
granted patents were merged based on application date.
Interim performance variables are derived from Dun & Bradstreet, which were available only for
U.S. firms after 1989. ASR firm names were matched manually for relevant establishments, with a
success rate of 91.8%. D&B records annual sales as well as headcount, both of which we use in raw form.
5 Results
5.1 Summary Statistics and Trends
A total of 651 ASR firms are observed in the trade journals. We exclude 55 publicly traded firms
from our analysis, as these are less likely than private firms to be acquired. We also drop 17 (private)
professional services firms that did not enter the industry with an innovation. Descriptive statistics and
correlations for the remaining 579 ASR firms are in Table 1. Firm-level observations are in Panel A;
Panel B contains firm-year observations. (Although the trade journals were issued monthly, we collapsed
observations to the firm-year level for analysis; models using firm-month observations yield consistent
results.) Dun & Bradstreet data is available for 379 of the 579 firms, reducing the number of observations
in models utilizing D&B-based variables. Slightly more than half of ASR firms are de alio firms while
one tenth are intra-industry spinoffs. One quarter of firms have an ASR-related patent; a slightly higher
percentage raised venture capital. The CEO was replaced in 12% of firms.
Table 1 about here
Regarding technological commercialization strategies, 60% started by competing in the product
market vs. 38% starting with cooperation. (Two percent of firms were recorded as starting with a hybrid
strategy of simultaneously cooperating and competing.) This relatively even split between the two types
of commercialization strategy reinforces our claim that ASR firms are not subject to the sort of
environmental pressures that strongly direct the choice of commercialization strategy as in other
industries such as biotechnology. Panel A of Figure 3 plots the density of ASR firms by entry mode, with
overall ASR firm density for reference. While cooperation dominates early on, this trend reverses sharply
by the mid-1990s. Panel B refines this view, restricting the graph only to new entrants (given the small
number of entrants per year, observations are grouped into five-year intervals). As in the full density plot
of Panel A, Panel B shows that a competitive TCS dominates later on among new entrants. It would, thus,

"
""
16
be difficult to conclude that switching commercialization strategies from Compete→Cooperate can be
explained by an industry trend toward a cooperative TCS.
Figure 3 about here
Twenty percent of firms either pioneered or were early adopters of one of the disruptive ASR
technologies described above. The corresponding time-varying variable is nonzero for 3% of
observations. We note that no ASR firm was an early adopter of more than one of these potentially
disruptive technologies, which should not be surprising given that such innovations underperform on
traditional metrics such as accuracy and vocabulary size. However, several firms eventually adopted
multiple of these innovations. For example, Voice Control Systems was an early adopter of word-spotting
but did not adopt a software-only approach until several years after its introduction.
5.2 Disruptive vs. Sustaining Technologies: Initial Tradeoffs and Eventual Trajectories
Here we offer evidence that the technologies we listed as potentially disruptive did in fact
underperform sustaining technologies on the common dimensions of merit in the ASR industry,
vocabulary size (Christensen and Bower, 1996). As argued above, although recognition accuracy is a key
performance measure, even as of the early days of the industry most ASR firms had begun to claim 99%
accuracy, rendering this an uninformative measure. We instead explore another metric where there exists
considerable heterogeneity across firms: vocabulary size. Vocabulary size refers to the number of words
or phrases a particular ASR technology is capable of recognizing. For example, some early ASR
technologies were designed to distinguish between the vocabulary set of “yes” and “no”—the vocabulary
size is two. By contrast, a technology capable of recognizing U.S. city and state pairs (e.g., “Orlando,
Florida”) would have a vocabulary size of tens of thousands. Although not every firm published claims
regarding vocabulary-size metrics, we were able to locate vocabulary-size data at entry for 455 of the 579
firms (78.6%) in the trade journals. Considerable heterogeneity of vocabulary size exists, ranging from
two words (i.e., “yes” and “no”) to well over a million. Mean vocabulary size for all firms, as coded from
the trade journals, is 12,426 with a standard deviation of 26,288.
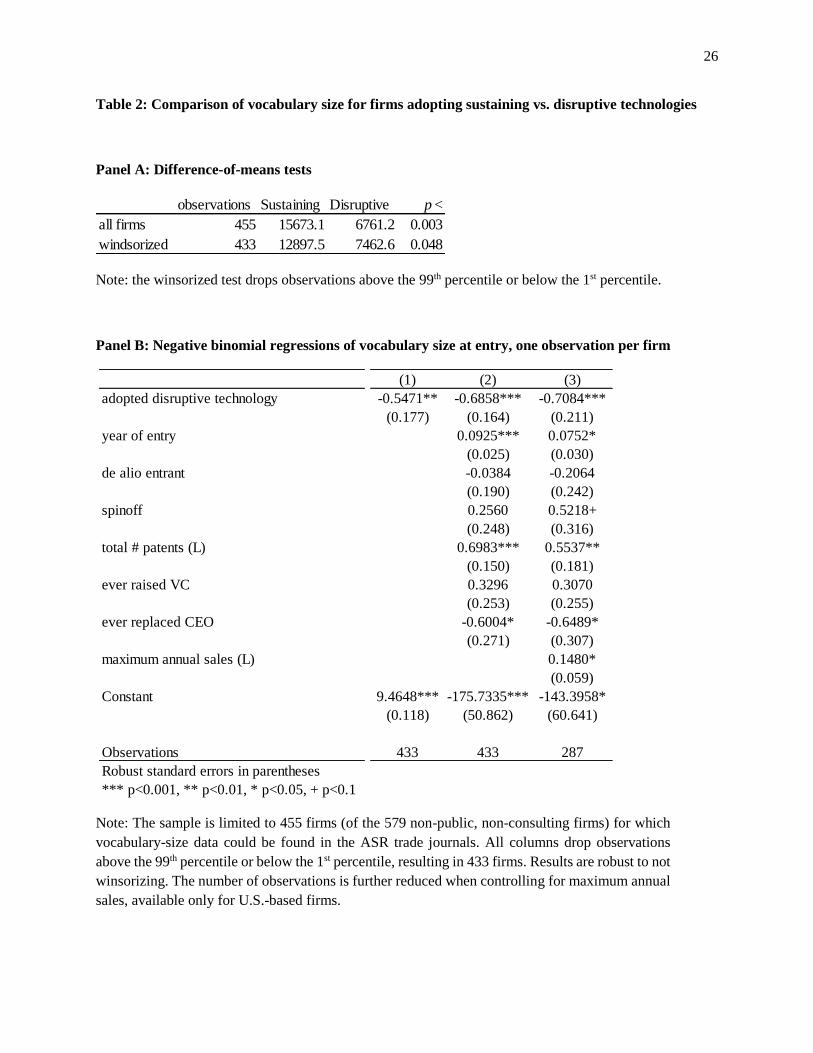
Vocabulary sizes at entry are indeed smaller for firms adopting potentially-disruptive ASR
technologies. Difference-of-means tests in Panel A of Table 2 show that firms adopting disruptive
technologies have vocabulary sizes approximately half as large as firms that utilize only sustaining
technologies. These differences are statistically significant whether examining all firms or winsorizing the
top and bottom 1% (the latter carried over to our multivariate analysis). We consider additional covariates
in Panel B of Table 2 again winsorizing although results do not depend on dropping any observations.
Column 1 reconfirms the connection between disruption and lower vocabulary sizes as shown in Panel A,
while Column 2 controls for various factors including year, organizational heritage, patenting, and

"
""
17
venture capital. The magnitude of the negative correlation between disruption and vocabulary size
strengthens both in economic and statistical significance when adding covariates. This correlation is also
recovered in Column 3, which controls for sales, even though doing so reduces the analysis set to those
firms for which we have Dun & Bradstreet data.
Table 2 about here
The initially identifiable characteristic of disruptive technologies is that they suffer along
traditional performance characteristics, as illustrated with the lower vocabulary size of ASR systems
incorporating word-spotting, software-only, or grammar-free technologies. At first, these tradeoffs make
incumbents reluctant to develop internally or in-license disruptive technologies, as uncertainty surrounds
their commercial value. What makes the technologies attractive licensing or acquisition candidates later is
the threat they pose once uncertainty has been resolved and the value of disruptive technologies has been
demonstrated in the marketplace. While we were able to retrieve vocabulary size at entry for nearly four
out of five ASR firms at the time of entry, longitudinal vocabulary-size data was not reliably available for
more than a handful of firms. As an alternative approach, we analyze the financial performance of
disruptors vs. firms that employed only sustaining technologies.
Figure 4 plots these dynamics. The y-axis represents annual sales per employee, calculated from
the Dun & Bradstreet data, and represents the closest possible calculation of organizational efficiency or
profitability using these data. The x-axis is the number of years since entry. It is visible in Figure 4 that
those using disruptive technologies start out with comparatively low sales per employee around the time
of entry. Eventually, however, these firms become roughly as profitable as those depending entirely on
sustaining technologies, and eventually surpass them. Thus it appears that disruptive ASR technologies,
though they initially trade off performance, indeed improve over time.
Figure 4 about here
5.3 Disruptive Technology Adoption and Commercialization Strategy
Table 3 shows the distribution of technology commercialization strategies for firms adopting
sustaining vs. disruptive technologies. 461 ASR firms relied solely on sustaining technologies, while 118
or approximately one-fifth of firms were early adopters of disruptive technology. Two patterns are visible.
First, early adopters of disruptive technologies are much less likely to cooperate with incumbents. Only
21.2% of disruptors fixed on a Cooperate strategy (and never switched) compared to 36% of those relying
on sustaining technologies, whereas the reverse pattern obtained for Compete strategies. As is visible in
the rightmost column of Table 3, these differences are statistically significant at conventional levels.
Second, firms that adopt disruptive technologies are more likely to switch from a
Compete→Cooperate TCS. 12.7% of disruptors undertake this dynamic commercialization strategy vs.

"
""
18
7.8% of non-disruptors, differences again significant at the 5% level. Note that the percentage of firms
adopting a Cooperate→Compete strategy is not meaningfully different between the two types of firms.
Table 3 about here
In Table 4, we revisit the analysis of Table 3 in a multivariate context using a multinomial logit
specification while still keeping the firm as the unit of analysis. The baseline outcome is adopting a
(permanent) Cooperate commercialization strategy. Each model has multiple columns, each
corresponding to another of the commercialization strategies. The coefficients in each column of a given
model are associated with the selection of that column’s commercialization strategy relative to the
baseline. For example, the first column in Model (1) examines the likelihood of adopting a (permanent)
Compete commercialization strategy relative to the baseline of Cooperate. The positive and statistically-
significant coefficient on adopting a disruptive technology is consistent with Table 3.
Model 2 of Table 4 refines the analysis by adding several firm-level covariates. Firms entering
later are considerably more likely to adopt a (permanent) Compete strategy, as shown by the positive and
significant coefficient on year of entry in the column for the Compete strategy. This trend is consistent
with the patterns in Figure 2, which show that Compete strategies become more dominant over time (both
in the full population, and among new entrants). Intra-industry spinoffs are considerably more likely to
shift TCS, whether from Cooperate→Compete or Compete→Cooperate. Changing from
Cooperate→Compete is strongly associated with having replaced the CEO, while Compete→Cooperate
switches are more common among VC-backed ventures.
Net of these covariates, the association between a (permanent) Compete strategy and adopting
disruptive technology in Model 2 is somewhat weaker, with statistical significance at the 10% level.
However, the strategy of switching from Compete→Cooperate is still strongly associated with firms that
adopted disruptive technologies. The odds ratio of temporarily integrating as compared to pursuing a
permanent Cooperation strategy, are about two and a half times higher (e0.7813=2.4) for firms adopting
disruptive technologies. This result is robust in Model 3 to accounting for the firm’s maximum annual
sales, which reduces the number of observations considerably but maintains the economic and statistical
significance of the coefficient on disruptive technology in the column for the Compete→Cooperate
commercialization strategy.
Table 4 about here
In Table 5, we shift the unit of analysis to firm-year observations. Our explanatory variable of
adopting disruptive technology is now set to 1 only in the year of adoption; similarly, other firm-level
covariates from Panel A of Table 2 are replaced with time-varying variables from Panel B of Table 2.
Given our longitudinal, right-censored data, we use a Cox hazard model where the failure event is defined
as a firm changing its commercialization strategy. Switching can occur either from Compete→Cooperate

"
""
19
or Cooperate→Compete, which we examine in separate sets of models. Models 1-3 of Table 5 examine
the subset of firms that started with a Compete commercialization strategy, while Models 4-6 restrict
analysis to firms that started with Cooperate.
Given that the sample in Models 1-3 is firms starting with Compete, the dependent variable is,
therefore, restricted to transitions from Compete→Cooperate. Model 1 shows a strong correlation
between adopting disruptive technology and switching from Compete→Cooperate without introducing
any control variables. Firms that started with a Compete commercialization strategy are about four times
as likely (e1.38=3.97) to shift from Compete→Cooperate when they adopt a disruptive ASR technology.
This result is also recovered when adding covariates in Model 2, which accounts for the higher propensity
of firms to switch from Compete→Cooperate when they are intra-industry spinoffs, once they have raised
venture capital, or once the CEO has been replaced. Model 3 introduces controls for sales performance,
which reduces the number of observations but strengthens the statistical significance of the result.
In the remaining models of Table 5, we rule out the possibility that disruptive technology is not
especially connected with switching from competition to cooperation but rather is associated with
dynamic commercialization strategies in either direction. Models 4-6 analyze the subset of ASR firms that
started with a Cooperate commercialization strategy, so the dependent variable is switching from
Cooperate→Compete. Model 4 evidences no connection between adopting disruptive technology and
shifting from Cooperate→Compete. Adding control variables in Models 5 and 6 shows that transitioning
from Cooperate→Compete does appear to be connected to patenting, replacing the CEO, and (depending
on the specification) raising venture capital. No correlation with adopting disruptive technology is found,
though. Thus we can conclude that firms adopting disruptive technologies are more likely to adopt a
dynamic strategy of competing initially and cooperating later.
Table 5 about here
5.4 Robustness
In Table 6, we assess the robustness of the longitudinal analysis of Table 5. Instead of building up
each analysis from the explanatory variable alone, each pair of models in Table 6 reports the analysis for
ASR firms that start with a Compete or Cooperate strategy, respectively. Models 1-4 revisit the choice of
a three-year window following the initial introduction of a disruptive technology in order to identify early
adopters of that disruptive technology. In Models 1 and 2, we identify as disruptors firms that adopted a
disruptive technology within two years of its original introduction to the market. As expected, the
coefficient on adopting disruptive technology is positive and statistically significant in Model 1 (firms
starting with a Compete TCS) but not in Model 2 (starting with a Cooperate TCS), indicative that
disruptors are more likely to switch from Compete to Cooperate. Likewise, in Models 3 and 4 we see that

"
""
20
results are robust to identifying adopters of a disruptive technology within four years of its original
introduction. A five-year window works as well; however, restricting analysis only to the original
pioneers of each of the three disruptive technologies does not yield reliable estimates because only three
firms are labeled as disruptive. We moreover note that the firm-level analyses of technology
commercialization strategy choice in Table 4, and the vocabulary-size analysis of Table 2, are both robust
to these alternate windows.
Table 6 about here
Models 5 and 6, instead of labeling only the firm-year disruption observation as 1 in the year of
adoption, account for the possibility that it may take some time for a disruptive technology to prove its
worth. In a sense, such technologies may be most disruptive when initially adopted and less so over time.
The disruptive-adoption variable is still set to 1 in the year of adoption; subsequent years are however set
to 1/n where n is the number of years since adoption (e.g., in the third year after adopting the disruptive
technology, this variable is set to 1/3). Magnitudes and statistical significance of the relevant coefficients
in Models 5 and 6 resemble those of prior models.
The final two models of Table 6 confirm that our results are not an artifact of acquisition patterns
alone. We argued earlier for considering a firm that started with a Compete strategy but that then accepted
an attractive acquisition offer as having switched to Cooperate, as acquisitions have often been treated as
cooperative strategies in prior literature. Given that acquisitions might alternatively be seen as outcomes
and sources of liquidity, in Models 7 and 8 we no longer consider entering into an acquisition as a move
from Compete to Cooperate. Here, the switch to a cooperative commercialization strategy includes only
those firms that begin to license out their technology while remaining an independent firm. If anything,
the magnitude of the correlation between adopting disruptive technologies and switching from Compete
to Cooperate is stronger in this model.
6 Discussion and Conclusions
Using a dataset of the population of entrants into the worldwide speech recognition industry from
1952 through 2010, we find evidence consistent with a theory of entrepreneurial strategy in which
commercializing disruptive technologies starts by competing with incumbents followed by a switch to
cooperating with them.5 Note that our results are not necessarily causal, as commercialization strategy is
an endogenous decision. Our goal has been to show the association between disruptive innovation and
"""""""""""""""""""""""""""""""""""""""""""""""""""""""""""""5 The dynamic strategy of initial competition followed by later cooperation differs from prior assessments of changing commercialization strategy as a generally beneficial trial and error process of experimentation by which naïve entrants learn about the industry and the best match with their capabilities (Bhide, 2000; Murray and Tripsas, 2004; Gavetti and Rivkin, 2007).

"
""
21
entrepreneurial use of a dynamic commercialization strategy where the disruptor competes initially and
later cooperates. The industry context we examine is advantageous not only because we are able to
observe objective third party characterizations of technology commercialization strategy over time, but
also because the speech recognition industry operates in a business environment in which no particular
commercialization strategy is dominant and where there is within-industry variation in the introduction of
disruptive innovations.
From that standpoint, the leading case example of disruptive innovations in the hard disk drive
industry overturning incumbent firm market leadership (Christensen, 1997) may reflect two distinct
forces.6 First, industry incumbents may be reluctant to develop and/or acquire the potentially disruptive
technology, as the Christensen line of research has emphasized. A second force, however, emerges from
the business environment within which hard disk drive innovators operate (Gans and Stern, 2003): an
environment in which appropriability conditions are relatively weak (mechanical innovations are
notoriously susceptible to backward engineering, for example) at the same time that the relative costs of
assembling the requisite organizational complementary assets to enter the product market are low (the
competitive supply of contract manufacturers may be available to hard disk drive innovators, so vertical
integration may not even be necessary). The combination of these business environment forces, both of
which favor a compete strategy, may conflate the “attacker’s advantage” nature of disruptive technologies
(Christensen and Rosenbloom, 1995).
At the other end of the spectrum, in industries such as drug development, there is rarely
replacement of incumbent firm market leadership despite waves of radical innovation in techniques of
drug discovery over the past 40 years by biotechnology firms. The business environment explanation for
this pattern would be that the appropriability regime for biochemical innovations is well-known to be
strong (so innovators have some protection against expropriation threats when negotiating deal terms with
industry incumbents) at the same time that the cost of acquiring the specialized downstream
complementary assets is very high (in domains such as navigating the regulatory environment, sales
channels, and even manufacturing). Certainly we cannot claim in a single-industry study to have mapped
the full set of commercialization-environment contingencies; rather, we see this study serving as a
counterexample to the generally-accepted notion that incumbents generally succumb in the face of
disruptive technologies. One critical implication of our study for practitioners is that in certain
commercialization environments, an incumbent facing disruption may in fact pursue a wait-and-see
strategy (eventually cooperating with the disruptor). An important next step would be to examine the
"""""""""""""""""""""""""""""""""""""""""""""""""""""""""""""6 Christensen (1997) also finds the same effect of disruptions in the mechanical excavator and steel mini-mill cases as he finds in hard disk drives. We believe these other industry settings also exhibit similar commercialization environment characteristics as what we discuss in this paragraph for disk drives.

"
""
22
market leadership consequences of disruptive innovations in other business environments, including those
where cooperative commercialization is strongly favored.
In mixed business environments as in speech recognition, in which the appropriability regime is
strong (favoring a cooperative strategy) at the same time that the relative cost of complementary asset
acquisition is modest (favoring a competitive strategy), the innovator’s preferred commercialization
strategy may not be as straightforward (Gans and Stern, 2003). Therefore, having studied the technology
commercialization strategies of disruptive innovators in such settings may allow us to minimize the role
of the business environment in independently shaping commercialization strategies. This discussion also
allows us to speculate about the generalizability of this strategy, which may be most important in mixed
commercialization environments in which the entrant with a potentially-disruptive innovation is torn
between a cooperative and competitive strategy.
Our work also makes two contributions beyond disruptive technologies. First, it may be that non-
disruptors who wish to cooperate with incumbents will find it advantageous to engage in an initial period
of competition when it is difficult to establish the value of their technology or when they lack reputation
or other status markers which can help to attract the attention of desirable commercialization partners.
While prior work has suggested that asymmetric-information problems can be handled contractually by
specifying a low up-front licensing fee (Gallini and Wright, 1990), the integration-cost parameter in our
model captures the fact that not all risks can be handled through pricing. Second, while the extant
literature on technology commercialization takes a static, one-time view of the strategic choice (Gans and
Stern, 2003), we believe this to be the first paper to empirically show conditions under which a dynamic
commercialization strategy can be efficient.

"
""
23
7 References
R. Adner (2002). “When Are Technologies Disruptive? A Demand-Based View of the Emergence of Competition,” Strategic Management Journal, 23: 667-688.
R. Adner and P. Zemsky (2005). “Disruptive Technologies and the Emergence of Competition.” RAND Journal of Economics, 36 (2): 229-254.
A. Arora, A. Fosfuri, and A. Gambardella (2001). “Markets for Technology and their Implications for Corporate Strategy.” Industrial and Corporate Change 10(2): 419-451.
A. Arora and A. Nandkumar (2011). “Cash-out or Flameout! Opportunity Cost and Entrepreneurial Strategy.” Management Science, 57(10): 1844-1860.
J. Bower and C. Christensen (1995). “Disruptive Technologies: Catching the Wave,” Harvard Business Review, January-February.
J. Baum, T. Calabrese, B. Silverman. (2000). “Don't Go it Alone: Alliance Network Composition and Startups' Performance in Canadian Biotechnology.” Strategic Management Journal, 21(3): 267-294.
A. Bhide (2000). The Origin and Evolution of New Businesses, Oxford University Press.
I. Brodsky (2008). The History of Wireless: How Creative Minds Produced Technology for the Masses, Telescope Books: St. Louis, MO.
B. Cassiman and M. Ueda (2006). “Optimal Project Rejection and New Firm Start-ups,” Management Science, 52(2): 262-275.
A. Chatterji and K. Fabrizio (2013). “Does the Market for Ideas Influence the Rate and Direction of Innovative Activity? Evidence from the Medical Device Industry” Duke Fuqua working paper.
C. Christensen (1997). The Innovator’s Dilemma, Harper Collins Publishers.
C. Christensen and J. Bower. (1996). “Customer Power, Strategic Investment, and the Failure of Leading Firms.” Strategic Management Journal 17(3): 197-218.
C. Christensen and R. Rosenbloom. (1995). “Explaining the Attacker’s Advantage: Technological Paradigms, Organizational Dynamics, and the Value Network.” Research Policy 24: 233-257.
W. Creitz. (1982). Monthly news briefs, Voice News, May 1982.
W. Creitz. (1984). Monthly news briefs, Voice News, September 1984.
R.N. Foster (1986). Innovation: The Attacker’s Advantage. Summit Books: New York, NY.
N. Gallini and B. Wright (1990). “Technology transfer under asymmetric information.” The RAND Journal of Economics 21(1): 147-160.
J.S. Gans (2012). “Negotiating for the Market,” Working Paper, University of Toronto.

"
""
24
J.S. Gans, D. Hsu, and S. Stern (2002). “When does start-up innovation spur the gale of creative destruction?” RAND Journal of Economics 33(4): 571-586.
J.S. Gans and S. Stern (2000). “Incumbency and R&D Incentives: Licensing the Gale of Creative Destruction.” Journal of Economics and Management Strategy 9: 485-511.
J.S. Gans and S. Stern (2003). “The product market and the market for ‘ideas’: commercialization strategies for technology entrepreneurs.” Research Policy 32: 333-350.
G. Gavetti and J. Rivkin (2007). “On the Origin of Strategy: Action and Cognition over Time.” Organization Science 18(3): 420-439.
C. Helfat and M. Lieberman (2002). “The birth of capabilities: market entry and the importance of pre-history” Industrial and Corporate Change 11(4): 725-760.
B. Juang and L. Rabiner, Eds. (2004). Automatic Speech Recognition – A Brief History of the Technology Development. Encyclopedia of Language and Linguistics, Elsevier.
W. Meisel (2002). “Nuance to shift strategy and depend less on partners.” Speech Recognition Update 114:23.
F. Murray and M. Tripsas (2004). "The Exploratory Processes of Entrepreneurial Firms: The Role of Purposeful Experimentation." Advances in Strategic Management 21: 45-75.
M. Phillips (2013). Personal communication with M. Marx, April 2013.
D. Teece (1986). “Profiting from Technological Innovation: Implications for Integration, Collaboration, Licensing, and Public Policy.” Research Policy 15: 285-305.
M. Tushman and P. Anderson (1986). “Technological Discontinuities and Organizational Environments.” Administrative Science Quarterly 31: 439-465.
A. Viterbi. (2012). Personal communication with M. Marx, December 2012.
Walls & Associates, 2010 National Establishment Time-Series (NETS) Database©, October 2011.

25
Table 1: Descriptive statistics and correlations
Panel A: Firm-level observations. Public and consulting firms are excluded.
Panel B: Firm-year observations for 579 privately-held, non-consulting firms.
Variable Obs Mean Std. Dev. Min Max 1) 2) 3) 4) 5) 6) 7) 8) 9) 10) 11)1) year of entry 579 1997.73 7.63 1970 2010 1.002) de alio 579 0.55 0.50 0 1 -0.17 1.003) spinoff 579 0.12 0.32 0 1 0.13 -0.44 1.004) total patents (L) 579 0.25 0.72 0 5.31 -0.29 -0.10 0.07 1.005) ever raised VC 579 0.28 0.45 0 1 -0.18 -0.10 0.10 0.18 1.006) ever replaced CEO 579 0.12 0.32 0 1 -0.18 -0.23 0.05 0.40 0.23 1.007) maximum annual sales (L) 379 14.80 2.01 9.02 21.7 -0.21 0.24 -0.09 0.29 0.15 0.10 1.008) initial TCS: compete 579 0.60 0.49 0 1 0.31 0.05 0.02 -0.18 -0.03 -0.17 0.00 1.009) initial TCS: compete+cooperate 579 0.02 0.14 0 1 0.09 -0.11 0.02 -0.03 0.00 0.06 -0.08 -0.24 1.0010) firm ever switched TCS 579 0.19 0.40 0 1 -0.22 -0.14 0.14 0.31 0.25 0.31 0.14 -0.20 0.04 1.0011) firm ever adopted disruptive technology 579 0.20 0.40 0 1 0.10 -0.05 0.02 0.00 0.04 0.04 -0.02 0.05 0.04 0.08 1.00
Variable Obs Mean Std. Dev. Min Max 1) 2) 3) 4) 5) 6) 7) 8) 9) 10) 11) 12)1) year of entry 3987 1994.80 8.97 1970 2010 1.002) de alio 3987 0.55 0.50 0 1 -0.23 1.003) spinoff 3987 0.13 0.34 0 1 0.11 -0.47 1.004) patents to date (L) 3987 0.37 0.86 0 5.31 -0.32 -0.03 -0.01 1.005) already raised VC 3987 0.38 0.48 0 1 -0.16 -0.09 0.05 0.05 1.006) previously replaced CEO 3987 0.09 0.29 0 1 -0.19 -0.17 0.07 0.27 0.16 1.007) # of firms w/compete TCS 3987 127.55 71.60 0 214 0.58 -0.14 0.10 0.01 -0.02 0.05 1.008) sales (L) 2592 14.62 1.92 7.65 21.7 -0.29 0.26 -0.12 0.30 0.03 0.10 -0.05 1.009) initial TCS: compete 3987 0.55 0.50 0 1 0.35 0.03 0.01 -0.25 -0.02 -0.13 0.22 -0.14 1.0010) initial TCS: compete+cooperate 3987 0.02 0.13 0 1 0.10 -0.09 -0.01 -0.06 -0.01 0.05 0.04 -0.08 -0.20 1.0011) already switched TCS 3987 0.11 0.32 0 1 -0.15 -0.09 0.11 0.32 0.07 0.28 0.09 0.13 -0.16 -0.01 1.0012) firm adopted disruptive technology in this year 3987 0.03 0.17 0 1 0.08 -0.02 0.00 -0.05 -0.05 -0.04 -0.02 -0.04 0.03 0.02 0.00 1.00
26
Table 2: Comparison of vocabulary size for firms adopting sustaining vs. disruptive technologies
Panel A: Difference-of-means tests
Note: the winsorized test drops observations above the 99th percentile or below the 1st percentile.
Panel B: Negative binomial regressions of vocabulary size at entry, one observation per firm
Note: The sample is limited to 455 firms (of the 579 non-public, non-consulting firms) for which vocabulary-size data could be found in the ASR trade journals. All columns drop observations above the 99th percentile or below the 1st percentile, resulting in 433 firms. Results are robust to not winsorizing. The number of observations is further reduced when controlling for maximum annual sales, available only for U.S.-based firms.
observations Sustaining Disruptive p <all firms 455 15673.1 6761.2 0.003windsorized 433 12897.5 7462.6 0.048
(1) (2) (3)adopted disruptive technology -0.5471** -0.6858*** -0.7084***
(0.177) (0.164) (0.211)year of entry 0.0925*** 0.0752*
(0.025) (0.030)de alio entrant -0.0384 -0.2064
(0.190) (0.242)spinoff 0.2560 0.5218+
(0.248) (0.316)total # patents (L) 0.6983*** 0.5537**
(0.150) (0.181)ever raised VC 0.3296 0.3070
(0.253) (0.255)ever replaced CEO -0.6004* -0.6489*
(0.271) (0.307)maximum annual sales (L) 0.1480*
(0.059)Constant 9.4648*** -175.7335*** -143.3958*
(0.118) (50.862) (60.641)
Observations 433 433 287Robust standard errors in parentheses*** p<0.001, ** p<0.01, * p<0.05, + p<0.1

27
Table 3: Distribution of commercialization strategies, by firm-level adoption of disruptive technology
Note: The sample is limited to 579 non-public, non-consulting firms. The first two classifications indicate that the firm adopted a Cooperate or Compete strategy initially and never switched. The third classification indicates that the firm adopted both a Cooperate and Compete strategy initially. The last two classifications indicate that the firm adopted either a Cooperate or Compete strategy and then at some point switched to the other strategy. The final column reports p-values of a t test of different means.
difference of meansCooperate 166 36.0% 25 21.2% 0.002Compete 227 49.2% 69 58.5% 0.038both at first 8 1.7% 4 3.4% 0.261Cooperate->Compete 24 5.2% 5 4.2% 0.668Compete->Cooperate 36 7.8% 15 12.7% 0.048
461 100.0% 118 100.0%
Firms adopting only sustaining technologies Firms adopting disruptive technologies

28
Table 4: Multinomial logistic regressions of technology commercialization strategy
Note: The sample is limited to 579 non-public, non-consulting firms. Coefficients for the “both at first” outcome from Table 3 are not shown in order to conserve space. Given that only 2% of firms adopted such a strategy, most coefficients for the “both at first” outcome are not statistically significant except in the model without covariates, in which the coefficient on ever adopting disruptive technology is positive and significant at the 10% level. In models with covariates, however, the disruptive coefficient for the “both at first” outcome loses significance. Results are little changed in an unreported model that omits the “both at first” outcome.
outcomes CompeteCooperate Compete
Compete-> Cooperate Compete
Cooperate-> Compete
Compete-> Cooperate Compete
Cooperate-> Compete
Compete-> Cooperate
ever adopted disruptive technology 0.6962** 0.2776 1.0116** 0.4626+ 0.1666 0.7813* 0.0700 0.3468 0.8682*(0.255) (0.535) (0.375) (0.267) (0.608) (0.395) (0.324) (0.654) (0.430)
year of entry 0.1135*** 0.0206 0.0404+ 0.1469*** 0.0016 0.0255(0.016) (0.027) (0.024) (0.024) (0.036) (0.031)
de alio entrant 0.4250+ 0.8015 -0.4666 0.5870+ 0.4841 -0.8280+(0.226) (0.558) (0.394) (0.315) (0.723) (0.490)
spinoff 0.0874 1.7685** 1.0176* 0.0634 1.4336+ 0.8508(0.379) (0.644) (0.466) (0.479) (0.799) (0.561)
total # patents (L) -0.1532 0.5110* 0.1903 -0.2421 0.5815* 0.0174(0.184) (0.203) (0.220) (0.239) (0.276) (0.271)
ever raised VC 0.3425 0.2657 1.0019** 0.2545 0.1745 0.5616(0.243) (0.482) (0.354) (0.299) (0.558) (0.410)
ever replaced CEO -0.4213 2.2963*** 0.3797 -0.4006 1.7417** 0.2527(0.398) (0.544) (0.488) (0.478) (0.647) (0.553)
maximum annual sales (L) 0.0649 0.1059 0.1708(0.070) (0.157) (0.115)
Constant 0.3190** -1.8871*** -1.5224*** -226.6185*** -44.8572 -82.5994+ -294.0497*** -8.0586 -54.6555(0.102) (0.215) (0.184) (31.274) (54.500) (47.422) (47.849) (72.073) (61.213)
ObservationsStandard errors in parentheses*** p<0.001, ** p<0.01, * p<0.05, + p<0.1
(3)(1) (2)
579 579 379

29
Table 5: Cox event-history models for correlates of changing commercialization strategies
Note: The sample is limited to 579 non-public, non-consulting firms. Models 1 through 3 are limited to firms starting with a Compete strategy, so failure reflects switching from a Compete strategy to Cooperate, where Cooperate includes entering into an acquisition. Models 4 through 6 instead examine firms that started with a Cooperate strategy, so failure reflects switching to a Compete strategy.
(1) (2) (3) (4) (5) (6)adopted disruptive technology 1.3807* 1.3712* 1.8623** 0.5502 0.5000 0.4648
(0.586) (0.568) (0.660) (0.977) (0.965) (1.030)year of entry 0.0021 -0.1883 0.1687* -0.0064
(0.083) (0.168) (0.081) (0.134)de alio entrant -0.3990 -0.6849 0.3119 0.1574
(0.380) (0.453) (0.335) (0.437)spinoff 0.8712* 0.5348 0.6818+ 0.5373
(0.426) (0.478) (0.358) (0.444)patents to date (L) 0.1136 0.1260 0.3562** 0.4297**
(0.186) (0.223) (0.137) (0.157)already raised VC 0.6995* 0.4557 0.9859** 0.6013+
(0.337) (0.364) (0.313) (0.308)CEO previously replaced 1.3000** 1.1095* 1.0467** 1.0169**
(0.420) (0.452) (0.342) (0.350)# firms w/compete TCS -0.0038 0.0108 -0.0133 0.0052
(0.009) (0.016) (0.009) (0.013)annual sales (L) -0.1082 0.2032+
(0.140) (0.120)
Observations 1,717 1,717 1,221 1,340 1,340 760Robust standard errors in parentheses*** p<0.001, ** p<0.01, * p<0.05, + p<0.1
initial TCS = Compete initial TCS = Cooperate

30
Table 6: Robustness tests for Cox event-history models
Note: The sample is limited to 579 non-public, non-consulting firms.
Cooperationg TCS includes acquisitionsDisruption adoption window
Disruption considered in
initial TCS Compete Cooperate Compete Cooperate Compete Cooperate Compete Cooperate(1) (2) (3) (4) (5) (6) (7) (8)
adopted disruptive technology 1.4058* 0.6811 1.7218** 0.3588 1.6906* 0.3072 2.6952** 1.4831(0.714) (1.033) (0.652) (1.009) (0.700) (1.023) (0.942) (1.208)
year of entry -0.1836 -0.0051 -0.1864 -0.0068 -0.1933 -0.0065 -0.3121 -0.0042(0.168) (0.135) (0.168) (0.134) (0.173) (0.134) (0.298) (0.172)
de alio entrant -0.6695 0.1618 -0.6996 0.1544 -0.6764 0.1594 -0.8382 -0.3772(0.448) (0.436) (0.458) (0.437) (0.442) (0.437) (0.829) (0.658)
spinoff 0.5214 0.5493 0.5344 0.5331 0.5623 0.5377 0.5447 1.1692*(0.478) (0.445) (0.476) (0.445) (0.484) (0.441) (0.827) (0.528)
patents to date (L) 0.1416 0.4285** 0.1189 0.4294** 0.1421 0.4321** 0.4971 0.0014(0.220) (0.157) (0.228) (0.157) (0.221) (0.157) (0.419) (0.016)
already raised VC 0.4473 0.5920+ 0.4412 0.6003+ 0.4810 0.6084* 0.1682 -0.0948(0.361) (0.307) (0.364) (0.308) (0.366) (0.310) (0.708) (0.365)
CEO previously replaced 1.0952* 1.0225** 1.1051* 1.0143** 1.1675* 1.0133** 1.1908 0.5721**(0.448) (0.351) (0.452) (0.350) (0.453) (0.351) (0.971) (0.192)
# firms w/compete TCS 0.0102 0.0050 0.0108 0.0053 0.0111 0.0052 0.0181 1.0138*(0.016) (0.013) (0.016) (0.013) (0.016) (0.013) (0.026) (0.464)
annual sales (L) -0.1010 0.2035+ -0.1071 0.2034+ -0.1106 0.2035+ -0.4250* 0.2303(0.139) (0.120) (0.140) (0.120) (0.141) (0.121) (0.199) (0.208)
Observations 1,221 760 1,221 760 1,221 760 1,274 808Robust standard errors in parentheses*** p<0.001, ** p<0.01, * p<0.05, + p<0.1
yes yes yes no
year of adoptionyear of adoption1/n where n is years
since adoption year of adoption
2 years 4 years 3 years 3 years

31
Figure 1: Equilibrium Commercialization Strategies
CE
CI (1 b)V (0)
s
(1 a)v + (1 b)V (0)
s
Cooperate
Compete then Cooperate
Compete
If valuable, Compete then
Cooperate;
Otherwise, Compete

32
Figure 2: ASR firm entry and exit since the inception of the industry in 1952. The connected blue line is the overall industry density (i.e. number of active firms).
-50050100
150
200
250
ceas
ed o
pera
tions
exite
d AS
Rac
quire
dne
w d
e no
vone
w d
e al
ioto
tal a
ctiv
e

33
Figure 3: Commercialization strategy density
Panel A: All active ASR firms, by year
Panel B: New ASR entrants, by five-year intervals
0
100
200
300
num
ber o
f act
ive
firm
s
1940 1960 1980 2000 2020year
any commercialization strategy Cooperate strategyCompete strategy
050
100
150
200
num
ber o
f new
ent
rant
s
1940 1960 1980 2000period
any commercialization strategy Cooperate strategyCompete strategy

34
Figure 4: Sales per employee since entry for firms adopting sustaining vs. disruptive technologies
Note: Sample is limited to non-public, non-consulting firms that spent more than two years in the industry (n=291). Short-lived firms are omitted to avoid overreliance on sample attrition. Each data point is the three-year rolling average of sales per employee for that group of ASR firms; non-rolling-average plots look similar but have more year-to-year fluctuations.
100
110
120
130
140
Ann
ual S
ales
(100
0s) p
er E
mpl
oyee
0 2 4 6 8 10Years Since Entry
Sustaining Disruptive

35
8 Appendix: Dataset Construction
In chronicling the history of speech recognition and its commercialization it was not possible to rely purely on public sources such as SEC filings. Instead, we turned to a series of trade journals covering the industry from early commercialization attempts. As these publications were sent only to subscribers, we are deeply indebted to two individuals for making their archives available. William Meisel, president of TMAA Associates and publisher of Speech Recognition Update, Telephone Strategy Update, and Speech Strategy News, graciously made the complete set of his electronic archives available for all three newsletters. Walt Tetschner, publisher of ASRNews, likewise made his electronic archives available and also allowed us to borrow his personal, non-electronic archives of VoiceNews (William Creitz, editor), Voice Processing Newsletter (ed. Karl Kozarsky), and Voice Technology News (ed. Mark Mikolas).
Meisel’s newsletters, along with ASRNews, focused specifically on ASR whereas the other newsletters reported on the voice industry more generally. Related voice technologies include text-to-speech generation (TTS), speaker verification (SV), and the digital recording and encoding technologies common to all of these. As such, these trade journals chronicle the development of several industries including interactive voice response systems (IVR, e.g. “for banking, press one…”), learning aids such as Speak ‘n Spell, and even voice mail. Given the core speech-coding technology shared between all of these, several firms participated in two or more areas. For example, InterVoice began by building IVR systems and later added speech recognition. By contrast, Centigram started out in 1977 developing both TTS and ASR algorithms but abandoned the latter in 1982, citing “poor market conditions.” Several ASR companies added SV to their offerings. While an examination of several voice technologies could be enabled by these archival sources, we have focused more narrowly on ASR alone.
We started with VoiceNews since it was the only trade journal that reached back to the beginning of the 1980s. Although VoiceNews was published through the late 1990s, it did not focus exclusively on ASR and, more detrimentally, was unavailable to us in 1986 and 1990, with only partial availability from 1987 through 1989. We thus folded in Voice Processing Newsletter as it became available in 1984, though it was not available in 1988 and 1992. As it was a fairly brief newsletter, we also summarized Voice Technology News in 1989 and 1990 in order to provide more detail until we could switch to the more specialized ASRNews in the summer of 1990 (Voice Technology News was summarized through the end of 1990 to provide some overlap). In 1993, Speech Recognition Update commenced publication. This as well as ASRNews continue through today and provide a nicely matched set as the editor of SRU is a former ASR company founder and perhaps a bit of a “cheerleader” for the industry whereas the editor of ASRNews is rather critical of the industry and leads off each issue with a column titled “The Emperor is Naked!”. The two combined provide a balanced view of events within the industry.
Trade journal availability for each year is summarized in Figure A1. Coverage is present for every year since 1981, and since 1984 multiple journals cover each year except for 1986 and 1992. In addition to the trade journals described above, information on the history of ASR technology development—as opposed to commercialization—is borrowed from “Automatic Speech Recognition – A Brief History of the Technology Development” by B. H. Jung of the Georgia Institute of Technology and Lawrence R. Rabiner of Rutgers University and the University of California at Santa Barbara.

36
The trade journals were coded as follows. For each (monthly) issue of each trade journal, key details from each story were summarized, including information beyond what is used in the analyses in the present paper. The data coded included the following fields:
x Name of firm x Firm founder(s) and previous employment x Product introductions / withdrawals x Intended market for products x Price increases/reductions x Claimed accuracy, vocabulary size, speaker (in)dependence x Hiring of new CEO x Stated commercialization strategy x Acquisitions, liquidations, IPOs, industry exits x Funding events, including venture capital, government, and other sources x Lawsuits x Financial reports x Patent awards x Licensing deals
The coding task above was distributed among the first author and multiple research assistants. Each RA was asked to code a year’s worth of newsletter data previously coded in order to calibrate accuracy. Coded fields were then sorted by firm and date in Excel, which was exported to Stata for analysis.
Figure A1: ASR trade journal availability per year. All available issues were coded.
1981
1982
1983
1984
1985
1986
1987
1988
1989
1990
1991
1992
1993
1994
1995
1996
1997
1998
1999
2000
2001
2002
2003
2004
2005
2006
2007
2008
2009
2010
VoiceNewsVoice Processing NewsletterVoice Technology NewsASRNewsSpeech Recognition Update