dynamic modeling of real-time control of combined sewer ... · of combined sewer systems with...
TRANSCRIPT

Dynamic Modeling of Real-Time Control of Combined Sewer Systems with
Radial Gates and Siphon Weirs
William James and Brett C. Young
New code developed for radial gates and siphon-weirs is suitable for handling unsteady flow conditions occurring in real sewer systems. RGEXTRA.l\1 is described in two other chapters in this book (James and Young, 200la, b) and includes all features ofEXTRAN, which simulates branched or looped systems, backwater effects, surcharge, flow reversal and flow transfers by orifices, weirs and pumps. RGEXTRAN makes provision for dynamic control of radial gates (or other gate types) based on flow conditions at remote locations in the sewer system. This allows the model to be used for optimizing a combined sewer system operation by fully utilizing all available storage and conveyance capacity in the existing facilities. The dynamic radial gate code may also be used for analyzing system optimization in a real-time mode. The program is applied to the combined sewer system in Vancouver, British Columbia. Verification tests demonstrated that the new program accurately represents the operation and hydraulics of the dynamic radial gates and siphon-weirs found in the system.
24.1 Introduction
The Greater Vancouver region is sit1.mted in the southwestern corner of British Columbia, Canada, and covers an area of over 280,000 ha. A large percentage of this area is urbanized, and the total population in 1990 was approximately 1,400,000. For the purposes of sanitary sewerage collection and stormwater
James, W. and B.C. Young. 2001. "Dynamic Modeling of Real-Time Control of Combined Sewer Systems with Radial Gates and Siphon Weirs." Journal of Water Management Modeling R207-24. doi: 10.14796/JWMM.R207-24. ©CHI 2001 www.chijournal.org ISSN: 2292-6062 (Formerly in Models and applications to Urban Water Systems. ISBN: 0-9683681-4-X)
395

396 Dynamic lvfodeling of RTC of Gates and Siphons
drainage, the region is divided into four major sewerage areas, each tributary to a primary sewage treatment facility. The Vancouver Sewage Area (VSA) is the second largest sewerage area in the region and is served principally by a combined sewer system. The residential population of this system area is 465,000 and the total area served by sewers is 13,200 ha.
The sewerage conveyance system in the VSA consists of five major interceptors: Harbour (East and West), 8th Avenue, English Bay, NOlth Arm, and Highbury. These interceptors collect and convey sewage to the Iona Island Sewage Treatment Plant (STP). The layout of these facilities is shown in Figure 24.1. Generally, the slopes of the interceptors are mild and backwater effects are significant in parts of the system. Many of the system outfans are also subject to varying backwater effects from tidal influences. However, certain reaches of the interceptor system have steep slopes, and supercritical flow occurs in these pipes. During storm flows, several areas of the interceptor system may be surcharged, particularly in the Harbour, North Arm, and Highbury Interceptors.
S;:~9A~S t ~TEOOE?ro::l
0:
D ~ -.-. ~
~ i1i:_
!lI!l AVE. iNTEflCEPTOR
~ D... ~ !
----6!I----@1iii1--"--b,... --"-
:Figure 24.1 General scematic, Vancouver Sewage Area.
During dry weather, aU sanitary sewage is transported to the lona STP, where it receives primary treatment and is discharged through a deep-sea outfall into the Strait of Georgia. The average dry weather flow (ADWF) to this plant is 4.25 m3/s (150 cfs), and the wet weather flow capacity ofthe plant is about 17.6 m 3/s (625 cis). During wet periods, stormwater runoff may overload the

24.2 Application of RGEXTRAN 397
combined sewer system, resulting in overflows to the receiving waters. These combined sewer overflows (CSOs) are discharged to the waters of Vancouver Harbour, False Creek, English Bay, and the North Arm of the Fraser River, as shown in Figure 24.1. CSOs to these water bodies have been identified as a significant source of pollution (Greater Vancouver Regional District, 1989).
Features of the VSA system include dynamic radial gates, which control the interception of flow into the major conveyance system, and siphon-weir diversions that relieve the system of excess combined sewerage flow during storm events. These structures are critical features of the system, and it is important that their operation and hydraulic characteristics be cOlTectly simulated in the model to ensure accurate results. Details of the individual structures are presented below.
24.2 Application of RGEXTRAN
New code caned RGEXTRAN was developed (James and Young, 2001a, b) and inserted into the EXTRAN module (Roesner et aI., 1989) ofSWMM (Huber et aI., 1988). The network used to model this system is shown schematically in Figure 24.2. The detailed network around the radial gate intakes is given in subsequent figures. At the time of this study (1990), development of submodels for the upper catchments of the VSA system, which are used as input to the interceptor model (shown as hydro graphs in Figures 24.1 and 24.2), were not available. As a result, it was not possible to calibrate the interceptor model to real storm events. However, numerous verification runs were done on this model using simplified input hydrographs. The hydro graphs used in these runs were based on available flow monitoring data, theoretical calculations, and previous modeling work (Vancouver Engineering Department, 1985). The shape of these hydro graphs has been vatied to represent different storm hydrographs. The use of these simplified hydrograph inputs was suitable for model verification purposes, and for testing of the new radial gate and siphonweir code. However, in order to assess the perfonnance of the complete model, it should be calibrated and validated for real stonn events.
24.2.1 Discussion on Model Results
Results from a typical model verification test are presented for selected points where radial gates and siphon-weirs are present in the VSA model. The locations of these points in the network are shown in Figure 24.3. U.S. customary units were used in this model, as these units were standard for all available drawings and data for the VSA system.

398
,.;wl
r - J"_ 'I
~8!'P' " ......... 11
, ... - .. , IfONASypl , ___ ... _t
Dynamic lYfodeling of RTC of Gates and Siphons
Sill AVENUE INTERCEPTOR
1. Alllnf!ow h~ or9...wood_, Input """_. as no RUNOFF lilOt!aio fortM upp&r catchments were a.'IIa~.
2. No pump.-. _9 _In IhIs "".m"", • .00 .. ""mod h)'drograplls _e """d for 11m pump flow.
Figure 24.2 Model schematic, VSA.
INTERCEPTOR b.
8th AVENUE INTERCEPTOR --NOTES:
X ."",,"",,,,,,,-,,,,,_,,,,,
INTERCEPTOR
Figure 24.3 Model schematic, radial gates.

24.2 Application of RGExTRAN
24.2.2 Operation of the Yukon Gate
399
The Yukon Gate is an in-line radial gate located within the 8th Avenue Interceptor, and is perhaps the most important feature of the VSA interceptor system with regard to CSOs. The gate is dynamically controlled by water levels in the downstream interceptor and the gate opens or closes according to a predetermined rate (i.e. a time-controlled gate in RGEXTRA1\1). The operation of this gate is designed to protect the recreational waters of English Bay and False Creek by allowing more capacity for combined sewer flow from areas ... vest of the gate. When the gate is fully closed, the flow in the 8th Avenue Interceptor upstream of the gate is reversed and all combined sewerage tributary to the gate overflows directly to Vancouver Harbour.
The gate is set to close automatically when the flow depth at node 8022 in Figure 24.2 reaches 4.0 ft (1.2 m). The gate then closes at the specified rate until fully closed. The gate reopens as the stonn hydro graph subsides, beginning when the flow depth at the node drops below 2.0 ft (0.6 m), and continues to open at the specified rate, until it reaches the maximum opening, or until it is triggered to close again.
Figure 24.4 shows the operation of the Yukon Gate as computed by RGEXTRAN. Examination of this figure shows that the computed results accurately represent the process described above.
24.2.3 Balaclava/8th Avenue Interceptor Radial Gate Intake
The structure of this radial gate intake is identical in layout and operation to the Cambie/8th Avenue Interceptor intake and the results presented in this section are applicable to both structures.
Under present (1993) operating conditions, the dynamic radial gates at these locations are not operating but are rather fixed at a constant opening. The vertical drop shaft downstream of the gate ensures that the gate discharge is in the free flow condition for normal operating conditions, and thus, the dmvnstream conditions have no effect on the gate discharge. This is accounted for in the model by setting DISCND to 2, as discussed by James and Young (2001a).
The computed results for this intake are given in Figure 24.5. These results were generated using assumed hydrographs which allow steady-state conditions to be realized in the model, so that the shape of the resulting flow hydrographs may easily be checked and verified. The performance of the model under unsteady-flow conditions (i.e. the lising and falling limbs of the hydrograph) may also be checked.

400
120
110
100
00
00
Ji 70 ~
3: 60 0 ...I u..
0
S
4.8
4.6
4.4
4.2
4 g 3.1l
:.:c 3.6
ti: 3.4 W 32 0
3 2.8
2.6
2.4
2.2
2
0
0
Dynamic Alodeling of RTC of Gates and Siphons
\ " , . , • • : '_ gale is closing at rale • '. spe<:ified by RTGCLS
r gate fully dosed (zero flow)
2 4 I.>
TIME (hours) - Upstream Flow • - - Downstream Flow
gate begins to close I DNYClS ~ 4.0 It
gate remruns dosed for remainder 01 simulation DNYOPN = 2.0 It
2 4 6
TIME (hours) - Depth at CRTJUN (8022)
8
Figure 24.4 Computed operation of Yukon gate.
Figme 24.5 shows the interception of flow, from the Balaclava catchment, into the 8th A venue Interceptor. It can be seen that continuity and stability are maintained, and the computed discharge of75 cfs (2,100 Lis) agrees well with theoretically estimated values ranging from 65 to 80 cfs (1800-2300 Lis) (Vancouver Engineering Department, 1985).

24.2 Application of RGEXTRAN
~
.l!l .2-S: 9 U.
450
401l
350
300
250
200
150
lOll
50
0
5601l
8101l
NETWORK DETAil
0 2 4 6
TIME (hours) - 0(111000) • - - 0(8OIlO2) .-- Q(58100) '-" Q{56OIlO)
8011 @
8
Figure 24.5 Computed hydrographs, Balaclava and 8th A venue.
24.2.4 Balacfava/English Bay Interceptor Radial Gate Intake
401
The BalaclavaiEnglish Bay Interceptor radial gate intake is essentially the same as the other intakes to the English Bay Interceptor (EEl). The grit chamber has been removed and, theintake conduitto the EBI is very steep. For these reasons, it is assumed that the flow in this intake conduit is supercritical at all times, and the variable DISCND in RGEXTRAN is set to 2, as described by James and Young (200Ia). In order to avoid the use of short pipe lengths in the model, this intake conduit (including the gate) is modeled as a "radial gate link".

402 D.vnamic }dodeling o{,RTC of Gates and Siphons
The dynamic operation ofthe gate is controlled by the depth in the float chamber adjacent to the gate. In order for the float chamber to fill sufficiently to close the gate, the downstream conditions in the EBI must cause a hydraulic jump to form in the intake conduit. The float chamber is filled, and the gate closed, as this hydraulic jump moves upstream and enters the chamber. The entrance to this chamber is immediately downstream of the gate itself. However, since the gradually varied routing model cannot simulate these complex flow conditions, assumptions have been made to represent the gate opening based on water levels in the downstream interceptor.
4002 (40002) 4100 (41000) 4111
NETWORK DETAIL
400
350
300
:rf 250
s: 200
0 ....J
'50 U.
100
50
0 o TIME (hours)
- 0{41(00) • - - 0(40002) ._. 0(54100) ._ .. 0(50000)
Figure 24.6 Computed hydrograph, BalaclavalEBI gate.

24.2 Application of RGEXTRAN 403
Computed results for the Balaclava/EBI radial gate intake are given in Figure 24.6. These results again show that the new gate code is working well, and stability and continuity are maintained. Due to the complex hydraulic conditions encountered at these gates, and the limited data available, it will be necessary to refine the gate parameters (and the assumed operating characteristics) during the calibration process.
24.2.5 Operation of the Siphon-Weirs on the Highbury interceptor
During high storm flows, the excess flow in the Highbury Interceptor is relieved by two high capacity, self-priming siphon-weirs located at the north end of the Interceptor. The location of these structures is given in Figure 24.1, and the cross-sectional details are similar to those discussed by James and Young (2001 b).
In order to avoid the use of very short pipes, which may cause numerical instabilities in the model, the siphon-weirs at this location were modeled as a battery of siphons located at a single node. The height of the siphon crest, and the depth at which the siphons prime and shut off, was different for each siphon.
Figure 24.7 shows the computed results for the siphon-weir link. The first graph shows the continuity balance at the diversion node (6600 in Figure 24.2), and the second graph gives the head difference across the siphon-weir. The effect of the individual siphons on the total link discharge is identified in the figure. The capacity of the first siphon identified in Figure 24.7 agrees well with the theoretically estimated value of 100 cfs. Figure 24.7 again shows that stability is maintained in these computations.
24.2.6 Confluence of the North Arm and Highbury Interceptors
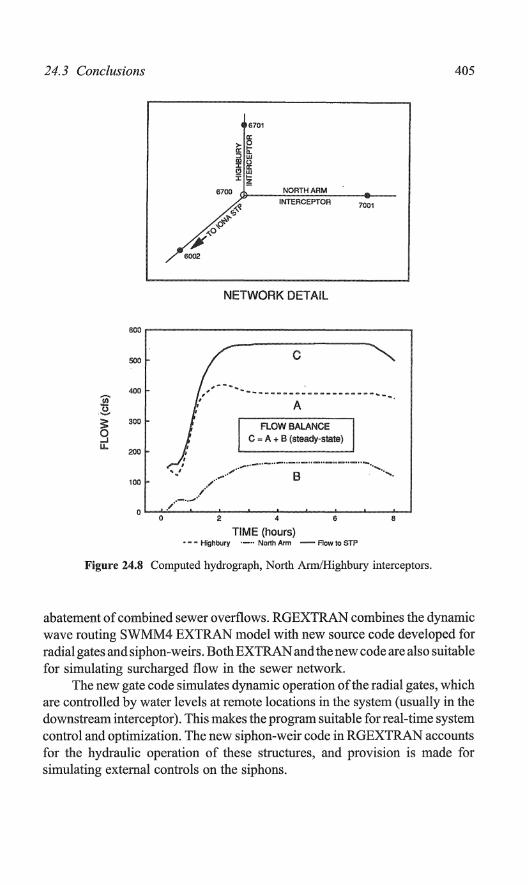
Figure 24.8 shows the model results at the confluence of the North Arm and Highbury Interceptors. This figure is included to give an indication of the performance of the overall model, and shows that the results are stable and continuity is preserved. As assumed hydro graphs were used for this run, the model results cannot be directly compared to observed data. However, the computed interceptor flows (A and B in Figure 24.8) are typical of measured flows at these sites.

404
!i ~ ..J 1.1.
g W
~ en
400
350
3W
250
200
150
100
50
0
100
100
107
100
100
11M
103
102
101
100
00
118
0
Dynamic J{odeling of RTC of Gates and Siphons
, ,
decrease in interceptor flow due to A
• \ ....... _ ... _ ...... "" .... - ......... __ ................ _- ... ,1' .... "....... .;~~ j ... " ' ....... _~._ •• _ .• _ •• _ •• _ ....... u_ .. _ .. -: , '-' \ ! \ ! A sillhon-welr - - - - _l... i overflow capacity of first \ i siphon-wsir \
I (m 100 cfs) '\ ; ~
4 6
TIME (hours)
B
- Upslr""", Flow • ~ ~ 0<lWl1s1ream Row '-" Siphon Overflow
o
: .. -........ ' ................ ... • • •
driving hssri across siphon-w,"ffi
_ ... _-_ ... -... _---_ ... , • ,
, •
/ " 2nd siphon SMls down -- ..
, .. _--'
2 4 6
TIME (hours) - Upstream Head • - ~ Oown$('_'" Head
, , , ~
6
.Figure 24.7 Computed hydrographs, Highbury siphon "veir.
24.3 Conclusions
A new program, RGEXTRAN, has been developed for simulating the hydraulics of complex combined sewer systems with dynamically controned radial gates (and other gate types), and self-priming siphon-weirs. The addition of these features makes the program suitable for modeling a larger variety of sewer systems which may have these features, or where they are to be considered for
24.3 Conclusions
000
000
400
.~ 3: 300
9 I.!...
200
100
6002
NETWORK DETAIL
c
----~----~-----~---- ~--A
flOW BALANCE C ~ A + B (steady-state)
024 e 8
TIME (hours) • - - Highbury ._ •• North Arm - Flow to SIP
Figure 24.8 Computed hydrograph, North ArmlHighbury interceptors.
405
abatement of combined sewer overflows. RGEXTRAN combines the dynamic wave routing SWMM4 EXTRAN model with new source code developed for radial gates and siphon-weirs. Both EXTRAN and the new code are also suitable for simulating surcharged flow in the sewer network.
The new gate code simulates dynamic operation of the radial gates, which are controlled by water levels at remote locations in the system (usually in the duwTIstream interceptor). This makes the program suitable for real-time system control and optimization. The new siphon-weir code in RGEXTRAN accounts for the hydraulic operation of these structures, and provision is made for simulating external controls on the siphons.

406 P,vnamic Afodeling of RTC of Gates and Siphons
The program has been applied to the VSA in British Columbia. Verification tests have shown that the new radial gate and siphon-weir code correctly simulates the hydraulics and operating characteristics of the structures found in the VSA. While verification was successful, the performance of the complete model cannot be fully assessed until calibration and validation data are available for real storm events.
Acknowledgments
We thank the engineering staff of the Greater Vancouver Regional District (GVRD), particularly Hew Me Connell. Graham Lang, Paul Kadota, Frans Jansen, Beth Currie and Russ Black. Financial support for this project was provided by the Greater Vancouver Regional District, Computational Hydraulics International, the Natural Science and Engineering Research Council of Canada, and the University of Guelph, through grants to Bill. RGEXTRAN was developed by Brett Young as part of the requirements for his MSc degree at the University of Guelph, tmder Bill's "advisement". Bill has after many patient years abstracted this chapter from Brett's excellent dissertation (Young, 1991 ).
References
Greater Vancouver Regional District. 1989. Greater Vancouver Liquid Waste Management Plan Stage l. p. 4-6,12-18.
Huber W.C. and R.E. Dickinson. 1988. Storm Water Management Model User's Manual, Version 4. US EPA: Athens, Georgia. p. 136-139.
James, W. and B.C. Young. 2001a. "An Approach to Modeling Real-Time Control of Dynamic and Static Radial and Sluice Gates within EXTRAN." Journal of Water Management Modeling R207-22. doi: 1 0.14796/JWMM.R207-22.
James, W. and B.C. Young. 200lb. "Modeling Siphon Weirs within EXTRAN." Journal I.{{ Water Management Modeling R207-23. doi: 10.14796/JWMM.R207-23.
Labadie, J.W., D. Morro\v., and Y.H. Chen. 1980. Optimal Control of Unsteady Combined Sewer Row. Journal of the Water Resources Planning and Management Division 106 (3). p. 205-223.
Roesner, L.A. J.A. Aldrich, andRE. Dickinson. 1989. Storm Water Management Model User's Manual Version 4: EXTRAN Addendmn. Environmental Protection Agency (EPA): Athens, Georgia.
Vancouver City Engineering Department. 1985. Combined Sewer Overflow Abatement Study -Technical Report. Vancouver, B.C. p. 45-59.