dynamic resource allocation using virtual
DESCRIPTION
Dynamic Resource Allocation Using Virtual resource in cloud computingTRANSCRIPT

Dynamic Resource Allocation Using VirtualMachines for Cloud Computing Environment
Zhen Xiao, Senior Member, IEEE, Weijia Song, and Qi Chen
Abstract—Cloud computing allows business customers to scale up and down their resource usage based on needs. Many of the
touted gains in the cloud model come from resource multiplexing through virtualization technology. In this paper, we present a system
that uses virtualization technology to allocate data center resources dynamically based on application demands and support green
computing by optimizing the number of servers in use. We introduce the concept of “skewness” to measure the unevenness in the
multidimensional resource utilization of a server. By minimizing skewness, we can combine different types of workloads nicely and
improve the overall utilization of server resources. We develop a set of heuristics that prevent overload in the system effectively while
saving energy used. Trace driven simulation and experiment results demonstrate that our algorithm achieves good performance.
Index Terms—Cloud computing, resource management, virtualization, green computing
Ç
1 INTRODUCTION
THE elasticity and the lack of upfront capital investmentoffered by cloud computing is appealing to many
businesses. There is a lot of discussion on the benefits andcosts of the cloud model and on how to move legacyapplications onto the cloud platform. Here we study adifferent problem: how can a cloud service provider bestmultiplex its virtual resources onto the physical hardware?This is important because much of the touted gains in thecloud model come from such multiplexing. Studies havefound that servers in many existing data centers are oftenseverely underutilized due to overprovisioning for the peakdemand [1], [2]. The cloud model is expected to make suchpractice unnecessary by offering automatic scale up anddown in response to load variation. Besides reducing thehardware cost, it also saves on electricity which contributesto a significant portion of the operational expenses in largedata centers.
Virtual machine monitors (VMMs) like Xen provide amechanism for mapping virtual machines (VMs) tophysical resources [3]. This mapping is largely hiddenfrom the cloud users. Users with the Amazon EC2 service[4], for example, do not know where their VM instancesrun. It is up to the cloud provider to make sure theunderlying physical machines (PMs) have sufficient re-sources to meet their needs. VM live migration technologymakes it possible to change the mapping between VMs andPMs while applications are running [5], [6]. However, apolicy issue remains as how to decide the mappingadaptively so that the resource demands of VMs are metwhile the number of PMs used is minimized. This is
challenging when the resource needs of VMs are hetero-geneous due to the diverse set of applications they run andvary with time as the workloads grow and shrink. Thecapacity of PMs can also be heterogenous because multiplegenerations of hardware coexist in a data center.
We aim to achieve two goals in our algorithm:
. Overload avoidance. The capacity of a PM should besufficient to satisfy the resource needs of all VMsrunning on it. Otherwise, the PM is overloaded andcan lead to degraded performance of its VMs.
. Green computing. The number of PMs used should beminimized as long as they can still satisfy the needsof all VMs. Idle PMs can be turned off to save energy.
There is an inherent tradeoff between the two goals in theface of changing resource needs of VMs. For overloadavoidance, we should keep the utilization of PMs low toreduce the possibility of overload in case the resource needsof VMs increase later. For green computing, we should keepthe utilization of PMs reasonably high to make efficient useof their energy.
In this paper, we present the design and implementationof an automated resource management system that achievesa good balance between the two goals. We make thefollowing contributions:
. We develop a resource allocation system that canavoid overload in the system effectively whileminimizing the number of servers used.
. We introduce the concept of “skewness” to measurethe uneven utilization of a server. By minimizingskewness, we can improve the overall utilization ofservers in the face of multidimensional resourceconstraints.
. We design a load prediction algorithm that cancapture the future resource usages of applicationsaccurately without looking inside the VMs. Thealgorithm can capture the rising trend of resourceusage patterns and help reduce the placement churnsignificantly.
IEEE TRANSACTIONS ON PARALLEL AND DISTRIBUTED SYSTEMS, VOL. 24, NO. 6, JUNE 2013 1107
. The authors are with the Department of Computer Science, PekingUniversity, No. 5, Yiheyuan Road, Haidian District, Beijing 100871, P.R.China. E-mail: {xiaozhen, songweijia}@pku.edu.cn, [email protected].
Manuscript received 26 Feb. 2012; revised 18 July 2012; accepted 17 Sept.2012; published online 21 Sept. 2012.Recommended for acceptance by V.B. Misic, R. Buyya, D. Milojicic, andY. Cui.For information on obtaining reprints of this article, please send e-mail to:[email protected], and reference IEEECS Log NumberTPDSSI-2012-02-0148.Digital Object Identifier no. 10.1109/TPDS.2012.283.
1045-9219/13/$31.00 � 2013 IEEE Published by the IEEE Computer Society

The rest of the paper is organized as follows. Section 2provides an overview of our system and Section 3 describesour algorithm to predict resource usage. The details of ouralgorithm are presented in Section 4. Sections 5 and6 present simulation and experiment results, respectively.Section 7 discusses related work. Section 8 concludes.
2 SYSTEM OVERVIEW
The architecture of the system is presented in Fig. 1. EachPM runs the Xen hypervisor (VMM) which supports aprivileged domain 0 and one or more domain U [3]. EachVM in domain U encapsulates one or more applicationssuch as Web server, remote desktop, DNS, Mail, Map/Reduce, etc. We assume all PMs share a backend storage.
The multiplexing of VMs to PMs is managed using theUsher framework [7]. The main logic of our system isimplemented as a set of plug-ins to Usher. Each node runsan Usher local node manager (LNM) on domain 0 whichcollects the usage statistics of resources for each VM on thatnode. The CPU and network usage can be calculated bymonitoring the scheduling events in Xen. The memoryusage within a VM, however, is not visible to thehypervisor. One approach is to infer memory shortage ofa VM by observing its swap activities [8]. Unfortunately, theguest OS is required to install a separate swap partition.Furthermore, it may be too late to adjust the memoryallocation by the time swapping occurs. Instead weimplemented a working set prober (WS Prober) on eachhypervisor to estimate the working set sizes of VMsrunning on it. We use the random page sampling techniqueas in the VMware ESX Server [9].
The statistics collected at each PM are forwarded to theUsher central controller (Usher CTRL) where our VMscheduler runs. The VM Scheduler is invoked periodicallyand receives from the LNM the resource demand history ofVMs, the capacity and the load history of PMs, and thecurrent layout of VMs on PMs.
The scheduler has several components. The predictorpredicts the future resource demands of VMs and thefuture load of PMs based on past statistics. We compute theload of a PM by aggregating the resource usage of its VMs.The details of the load prediction algorithm will bedescribed in the next section. The LNM at each node firstattempts to satisfy the new demands locally by adjustingthe resource allocation of VMs sharing the same VMM. Xen
can change the CPU allocation among the VMs by adjustingtheir weights in its CPU scheduler. The MM Alloter ondomain 0 of each node is responsible for adjusting the localmemory allocation.
The hot spot solver in our VM Scheduler detects if theresource utilization of any PM is above the hot threshold(i.e., a hot spot). If so, some VMs running on them will bemigrated away to reduce their load. The cold spot solverchecks if the average utilization of actively used PMs(APMs) is below the green computing threshold. If so, some ofthose PMs could potentially be turned off to save energy. Itidentifies the set of PMs whose utilization is below the coldthreshold (i.e., cold spots) and then attempts to migrate awayall their VMs. It then compiles a migration list of VMs andpasses it to the Usher CTRL for execution.
3 PREDICTING FUTURE RESOURCE NEEDS
We need to predict the future resource needs of VMs. Assaid earlier, our focus is on Internet applications. Onesolution is to look inside a VM for application level statistics,e.g., by parsing logs of pending requests. Doing so requiresmodification of the VM which may not always be possible.Instead, we make our prediction based on the past externalbehaviors of VMs. Our first attempt was to calculate anexponentially weighted moving average (EWMA) using aTCP-like scheme
EðtÞ ¼ � � Eðt� 1Þ þ ð1� �Þ �OðtÞ; 0 � � � 1;
where EðtÞ and OðtÞ are the estimated and the observedload at time t, respectively. � reflects a tradeoff betweenstability and responsiveness.
We use the EWMA formula to predict the CPU load onthe DNS server in our university. We measure the loadevery minute and predict the load in the next minute.Fig. 2a shows the results for � ¼ 0:7. Each dot in the figureis an observed value and the curve represents the predictedvalues. Visually, the curve cuts through the middle of thedots which indicates a fairly accurate prediction. This is alsoverified by the statistics in Table 1. The parameters in theparenthesis are the � values. W is the length of themeasurement window (explained later). The “median”error is calculated as a percentage of the observed value:jEðtÞ �OðtÞj=OðtÞ. The “higher” and “lower” error percen-tages are the percentages of predicted values that are higheror lower than the observed values, respectively. As we cansee, the prediction is fairly accurate with roughly equalpercentage of higher and lower values.
Although seemingly satisfactory, this formula does notcapture the rising trends of resource usage. For example,when we see a sequence of OðtÞ ¼ 10; 20; 30, and 40, it isreasonable to predict the next value to be 50. Unfortunately,when � is between 0 and 1, the predicted value is alwaysbetween the historic value and the observed one. To reflectthe “acceleration,” we take an innovative approach bysetting � to a negative value. When �1 � � < 0, the aboveformula can be transformed into the following:
EðtÞ ¼ �j�j � Eðt� 1Þ þ ð1þ j�jÞ �OðtÞ¼ OðtÞ þ j�j � ðOðtÞ � Eðt� 1ÞÞ;
1108 IEEE TRANSACTIONS ON PARALLEL AND DISTRIBUTED SYSTEMS, VOL. 24, NO. 6, JUNE 2013
Fig. 1. System architecture.

On the other hand, when the observed resource usage isgoing down, we want to be conservative in reducing ourestimation. Hence, we use two parameters, " � and # �, tocontrol how quickly EðtÞ adapts to changes when OðtÞ isincreasing or decreasing, respectively. We call this the FastUp and Slow Down (FUSD) algorithm. Fig. 2b shows theeffectiveness of the FUSD algorithm for " � ¼ �0:2,# � ¼ 0:7. (These values are selected based on fieldexperience with traces collected for several Internetapplications.) Now the predicted values are higher thanthe observed ones most of the time: 77 percent according toTable 1. The median error is increased to 9.4 percentbecause we trade accuracy for safety. It is still quiteacceptable nevertheless.
So far we take OðtÞ as the last observed value. Mostapplications have their SLOs specified in terms of a certainpercentiles of requests meeting a specific performance level.More generally, we keep a window of W recently observedvalues and take OðtÞ as a high percentile of them. Fig. 2cshows the result when W ¼ 8 and we take the 90% thpercentile of the peak resource demand. The figure showsthat the prediction gets substantially better.
We have also investigated other prediction algorithms.Linear autoregression (AR) models, for example, arebroadly adopted in load prediction by other works [10],[11], [12]. It models a predictive value as linear function ofits past observations. Model parameters are determined bytraining with historical values. AR predictors are capable ofincorporating the seasonal pattern of load change. Forinstance, the SPAR(4,2) [10] estimate the future logging rateof MSN clients from six past observations, two of which arethe latest observations and the other four at the same timein the last four weeks.
We compare SPAR(4,2) and FUSDð�0:2; 0:7Þ in Fig. 3.“lpct” refers to the percentage of low errors while “std”refers to standard deviation. Both algorithms are used topredict the CPU utilization of the aforementioned DNSserver in a 1-day duration. The predicting window is
8 minute. The standard deviation (std) of SPAR (4,2) isabout 16 percent smaller than that of FUSDð�0:2; 0:7Þ,which means SPAR (4,2) achieves sightly better percision.This is because it takes advantage of tiding pattern of theload. However, SPAR(4,2) neither avoids low predictionnor smooths the load. The requirement of a training phaseto determine parameters is inconvenient, especially whenthe load pattern changes. Therefore, we adopt the simplerEWMA variance. Thorough investigation on predictionalgorithms are left as future work.
As we will see later in the paper, the prediction algorithmplays an important role in improving the stability andperformance of our resource allocation decisions.
4 THE SKEWNESS ALGORITHM
We introduce the concept of skewness to quantify theunevenness in the utilization of multiple resources on aserver. Let n be the number of resources we consider and ribe the utilization of the ith resource. We define the resourceskewness of a server p as
skewnessðpÞ ¼ffiffiffiffiffiffiffiffiffiffiffiffiffiffiffiffiffiffiffiffiffiffiffiffiffiffiffiXni¼1
rir� 1
� �2s
;
where r is the average utilization of all resources forserver p. In practice, not all types of resources areperformance critical and hence we only need to considerbottleneck resources in the above calculation. By mini-mizing the skewness, we can combine different types ofworkloads nicely and improve the overall utilization ofserver resources. In the following, we describe the detailsof our algorithm. Analysis of the algorithm is presentedin Section 1 in the supplementary file, which can be
XIAO ET AL.: DYNAMIC RESOURCE ALLOCATION USING VIRTUAL MACHINES FOR CLOUD COMPUTING ENVIRONMENT 1109
Fig. 2. CPU load prediction for the DNS server at our university. W is the measurement window.
Fig. 3. Comparison of SPAR and FUSD.
TABLE 1Load Prediction Algorithms

found on the ComputerSociety Digital Library at http://doi.ieeecomputersociety.org/10.1109/TPDS.2012.283.
4.1 Hot and Cold Spots
Our algorithm executes periodically to evaluate theresource allocation status based on the predicted futureresource demands of VMs. We define a server as a hot spotif the utilization of any of its resources is above a hotthreshold. This indicates that the server is overloaded andhence some VMs running on it should be migrated away.We define the temperature of a hot spot p as the square sumof its resource utilization beyond the hot threshold:
temperatureðpÞ ¼Xr2Rðr� rtÞ2;
where R is the set of overloaded resources in server p and rtis the hot threshold for resource r. (Note that onlyoverloaded resources are considered in the calculation.)The temperature of a hot spot reflects its degree of overload.If a server is not a hot spot, its temperature is zero.
We define a server as a cold spot if the utilizations of all itsresources are below a cold threshold. This indicates that theserver is mostly idle and a potential candidate to turn off tosave energy. However, we do so only when the averageresource utilization of all actively used servers (i.e., APMs)in the system is below a green computing threshold. A serveris actively used if it has at least one VM running. Otherwise,it is inactive. Finally, we define the warm threshold to be alevel of resource utilization that is sufficiently high to justifyhaving the server running but not so high as to riskbecoming a hot spot in the face of temporary fluctuation ofapplication resource demands.
Different types of resources can have different thresh-olds. For example, we can define the hot thresholds for CPUand memory resources to be 90 and 80 percent, respectively.Thus a server is a hot spot if either its CPU usage is above90 percent or its memory usage is above 80 percent.
4.2 Hot Spot Mitigation
We sort the list of hot spots in the system in descendingtemperature (i.e., we handle the hottest one first). Our goalis to eliminate all hot spots if possible. Otherwise, keep theirtemperature as low as possible. For each server p, we firstdecide which of its VMs should be migrated away. We sortits list of VMs based on the resulting temperature ofthe server if that VM is migrated away. We aim to migrateaway the VM that can reduce the server’s temperature themost. In case of ties, we select the VM whose removal canreduce the skewness of the server the most. For each VM inthe list, we see if we can find a destination server toaccommodate it. The server must not become a hot spotafter accepting this VM. Among all such servers, we selectone whose skewness can be reduced the most by acceptingthis VM. Note that this reduction can be negative whichmeans we select the server whose skewness increases theleast. If a destination server is found, we record themigration of the VM to that server and update the predictedload of related servers. Otherwise, we move onto the nextVM in the list and try to find a destination server for it. Aslong as we can find a destination server for any of its VMs,we consider this run of the algorithm a success and then
move onto the next hot spot. Note that each run of thealgorithm migrates away at most one VM from theoverloaded server. This does not necessarily eliminate thehot spot, but at least reduces its temperature. If it remains ahot spot in the next decision run, the algorithm will repeatthis process. It is possible to design the algorithm so that itcan migrate away multiple VMs during each run. But thiscan add more load on the related servers during a periodwhen they are already overloaded. We decide to use thismore conservative approach and leave the system sometime to react before initiating additional migrations.
4.3 Green Computing
When the resource utilization of active servers is too low,some of them can be turned off to save energy. This ishandled in our green computing algorithm. The challengehere is to reduce the number of active servers during lowload without sacrificing performance either now or in thefuture. We need to avoid oscillation in the system.
Our green computing algorithm is invoked when theaverage utilizations of all resources on active servers arebelow the green computing threshold. We sort the list ofcold spots in the system based on the ascending order oftheir memory size. Since we need to migrate away all itsVMs before we can shut down an underutilized server, wedefine the memory size of a cold spot as the aggregatememory size of all VMs running on it. Recall that our modelassumes all VMs connect to a shared back-end storage.Hence, the cost of a VM live migration is determined mostlyby its memory footprint. Section 7 in the supplementary fileexplains why the memory is a good measure in depth. Wetry to eliminate the cold spot with the lowest cost first.
For a cold spot p, we check if we can migrate all its VMssomewhere else. For each VM on p, we try to find adestination server to accommodate it. The resource utiliza-tions of the server after accepting the VM must be below thewarm threshold. While we can save energy by consolidatingunderutilized servers, overdoing it may create hot spots inthe future. The warm threshold is designed to prevent that.If multiple servers satisfy the above criterion, we prefer onethat is not a current cold spot. This is because increasingload on a cold spot reduces the likelihood that it can beeliminated. However, we will accept a cold spot as thedestination server if necessary. All things being equal, weselect a destination server whose skewness can be reducedthe most by accepting this VM. If we can find destinationservers for all VMs on a cold spot, we record the sequenceof migrations and update the predicted load of relatedservers. Otherwise, we do not migrate any of its VMs. Thelist of cold spots is also updated because some of them mayno longer be cold due to the proposed VM migrations in theabove process.
The above consolidation adds extra load onto the relatedservers. This is not as serious a problem as in the hot spotmitigation case because green computing is initiated onlywhen the load in the system is low. Nevertheless, we wantto bound the extra load due to server consolidation. Werestrict the number of cold spots that can be eliminated ineach run of the algorithm to be no more than a certainpercentage of active servers in the system. This is called theconsolidation limit.
1110 IEEE TRANSACTIONS ON PARALLEL AND DISTRIBUTED SYSTEMS, VOL. 24, NO. 6, JUNE 2013
Note that we eliminate cold spots in the system onlywhen the average load of all active servers (APMs) is belowthe green computing threshold. Otherwise, we leave thosecold spots there as potential destination machines for futureoffloading. This is consistent with our philosophy thatgreen computing should be conducted conservatively.
4.4 Consolidated Movements
The movements generated in each step above are notexecuted until all steps have finished. The list of movementsare then consolidated so that each VM is moved at mostonce to its final destination. For example, hot spot mitigationmay dictate a VM to move from PM A to PM B, while greencomputing dictates it to move from PM B to PM C. In theactual execution, the VM is moved from A to C directly.
5 SIMULATIONS
We evaluate the performance of our algorithm using tracedriven simulation. Note that our simulation uses the samecode base for the algorithm as the real implementation inthe experiments. This ensures the fidelity of our simulationresults. Traces are per-minute server resource utilization,such as CPU rate, memory usage, and network trafficstatistics, collected using tools like “perfmon” (Windows),the “/proc” file system (Linux), “pmstat/vmstat/netstat”commands (Solaris), etc.. The raw traces are pre-processedinto “Usher” format so that the simulator can read them.We collected the traces from a variety of sources:
. Web InfoMall. The largest online Web archive inChina (i.e., the counterpart of Internet Archive in theUS) with more than three billion archived Web pages.
. RealCourse. The largest online distance learningsystem in China with servers distributed across 13major cities.
. AmazingStore. The largest P2P storage system inChina.
We also collected traces from servers and desktopcomputers in our university including one of our mailservers, the central DNS server, and desktops in ourdepartment. We postprocessed the traces based on dayscollected and use random sampling and linear combinationof the data sets to generate the workloads needed. Allsimulation in this section uses the real trace workload unlessotherwise specified.
The default parameters we use in the simulation areshown in Table 2. We used the FUSD load predictionalgorithm with " � ¼ �0:2, # � ¼ 0:7, and W ¼ 8. In adynamic system, those parameters represent good knobs totune the performance of the system adaptively. We choosethe default parameter values based on empirical experience
working with many Internet applications. In the future, weplan to explore using AI or control theoretic approach tofind near optimal values automatically.
5.1 Effect of Thresholds on APMs
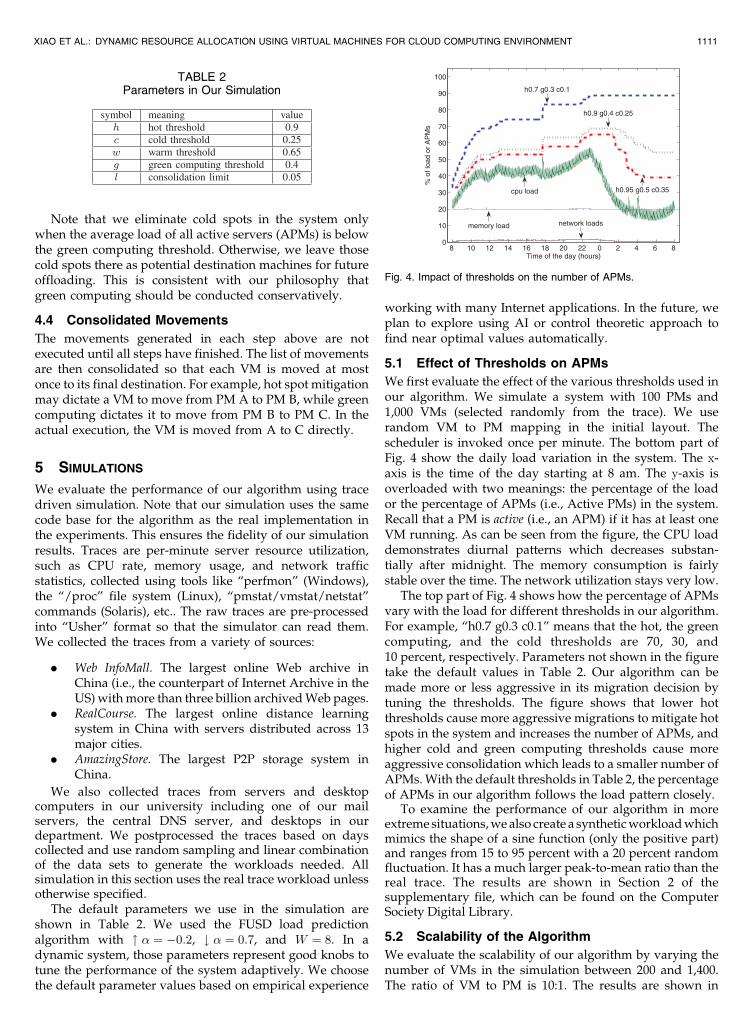
We first evaluate the effect of the various thresholds used inour algorithm. We simulate a system with 100 PMs and1,000 VMs (selected randomly from the trace). We userandom VM to PM mapping in the initial layout. Thescheduler is invoked once per minute. The bottom part ofFig. 4 show the daily load variation in the system. The x-axis is the time of the day starting at 8 am. The y-axis isoverloaded with two meanings: the percentage of the loador the percentage of APMs (i.e., Active PMs) in the system.Recall that a PM is active (i.e., an APM) if it has at least oneVM running. As can be seen from the figure, the CPU loaddemonstrates diurnal patterns which decreases substan-tially after midnight. The memory consumption is fairlystable over the time. The network utilization stays very low.
The top part of Fig. 4 shows how the percentage of APMsvary with the load for different thresholds in our algorithm.For example, “h0.7 g0.3 c0.1” means that the hot, the greencomputing, and the cold thresholds are 70, 30, and10 percent, respectively. Parameters not shown in the figuretake the default values in Table 2. Our algorithm can bemade more or less aggressive in its migration decision bytuning the thresholds. The figure shows that lower hotthresholds cause more aggressive migrations to mitigate hotspots in the system and increases the number of APMs, andhigher cold and green computing thresholds cause moreaggressive consolidation which leads to a smaller number ofAPMs. With the default thresholds in Table 2, the percentageof APMs in our algorithm follows the load pattern closely.
To examine the performance of our algorithm in moreextreme situations, we also create a synthetic workload whichmimics the shape of a sine function (only the positive part)and ranges from 15 to 95 percent with a 20 percent randomfluctuation. It has a much larger peak-to-mean ratio than thereal trace. The results are shown in Section 2 of thesupplementary file, which can be found on the ComputerSociety Digital Library.
5.2 Scalability of the Algorithm
We evaluate the scalability of our algorithm by varying thenumber of VMs in the simulation between 200 and 1,400.The ratio of VM to PM is 10:1. The results are shown in
XIAO ET AL.: DYNAMIC RESOURCE ALLOCATION USING VIRTUAL MACHINES FOR CLOUD COMPUTING ENVIRONMENT 1111
TABLE 2Parameters in Our Simulation
Fig. 4. Impact of thresholds on the number of APMs.

Fig. 5. Fig. 5a shows that the average decision time of our
algorithm increases with the system size. The speed of
increase is between linear and quadratic. We break down
the decision time into two parts: hot spot mitigation
(marked as “hot”) and green computing (marked as “cold”).
We find that hot spot mitigation contributes more to
the decision time. We also find that the decision time for
the synthetic workload is higher than that for the real trace
due to the large variation in the synthetic workload. With
140 PMs and 1,400 VMs, the decision time is about
1.3 seconds for the synthetic workload and 0.2 second for
the real trace.Fig. 5b shows the average number of migrations in the
whole system during each decision. The number ofmigrations is small and increases roughly linearly withthe system size. We find that hot spot contributes more tothe number of migrations. We also find that the number ofmigrations in the synthetic workload is higher than that inthe real trace. With 140 PMs and 1,400 VMs, on averageeach run of our algorithm incurs about three migrations inthe whole system for the synthetic workload and only 1.3migrations for the real trace. This is also verified by Fig. 5cwhich computes the average number of migrations per VMin each decision. The figure indicates that each VMexperiences a tiny, roughly constant number of migrationsduring a decision run, independent of the system size. Thisnumber is about 0.0022 for the synthetic workload and0.0009 for the real trace. This translates into roughly onemigration per 456 or 1,174 decision intervals, respectively.The stability of our algorithm is very good.
We also conduct simulations by varying the VM to PMratio. With a higher VM to PM ratio, the load is distributedmore evenly among the PMs. The results are presented inSection 4 of the supplementary file, which is available online.
5.3 Effect of Load Prediction
We compare the execution of our algorithm with andwithout load prediction in Fig. 6. When load prediction isdisabled, the algorithm simply uses the last observed loadin its decision making. Fig. 6a shows that load predictionsignificantly reduces the average number of hot spots in thesystem during a decision run. Notably, prediction preventsover 46 percent hot spots in the simulation with 1,400 VMs.This demonstrates its high effectiveness in preventingserver overload proactively. Without prediction, the algo-rithm tries to consolidate a PM as soon as its load dropsbelow the threshold. With prediction, the algorithmcorrectly foresees that the load of the PM will increaseabove the threshold shortly and hence takes no action.This leaves the PM in the “cold spot” state for a while.However, it also reduces placement churns by avoidingunnecessary migrations due to temporary load fluctuation.Consequently, the number of migrations in the system withload prediction is smaller than that without prediction asshown in Fig. 6c. We can adjust the conservativeness ofload prediction by tuning its parameters, but the currentconfiguration largely serves our purpose (i.e., error on theside of caution). The only downside of having more coldspots in the system is that it may increase the number ofAPMs. This is investigated in Fig. 6b which shows that theaverage numbers of APMs remain essentially the same with
1112 IEEE TRANSACTIONS ON PARALLEL AND DISTRIBUTED SYSTEMS, VOL. 24, NO. 6, JUNE 2013
Fig. 5. Scalability of the algorithm with system size.
Fig. 6. Effect of load prediction.

or without load prediction (the difference is less than1 percent). This is appealing because significant overloadprotection can be achieved without sacrificing resourcesefficiency. Fig. 6c compares the average number ofmigrations per VM in each decision with and without loadprediction. It shows that each VM experiences 17 percentfewer migrations with load prediction.
6 EXPERIMENTS
Our experiments are conducted using a group of 30 DellPowerEdge blade servers with Intel E5620 CPU and 24 GBof RAM. The servers run Xen-3.3 and Linux 2.6.18. Weperiodically read load statistics using the xenstat library(same as what xentop does). The servers are connectedover a Gigabit ethernet to a group of four NFS storageservers where our VM Scheduler runs. We use the samedefault parameters as in the simulation.
6.1 Algorithm Effectiveness
We evaluate the effectiveness of our algorithm in overloadmitigation and green computing. We start with a small scaleexperiment consisting of three PMs and five VMs so that wecan present the results for all servers in Fig. 7. Differentshades are used for each VM. All VMs are configured with128 MB of RAM. An Apache server runs on each VM. Weuse httperf to invoke CPU intensive PHP scripts on theApache server. This allows us to subject the VMs to differentdegrees of CPU load by adjusting the client request rates.The utilization of other resources are kept low.
We first increase the CPU load of the three VMs on PM1
to create an overload. Our algorithm resolves the overloadby migrating VM3 to PM3. It reaches a stable state underhigh load around 420 seconds. Around 890 seconds, wedecrease the CPU load of all VMs gradually. Because theFUSD prediction algorithm is conservative when the loaddecreases, it takes a while before green computing takeseffect. Around 1,700 seconds, VM3 is migrated from PM3 toPM2 so that PM3 can be put into the standby mode. Around2,200 seconds, the two VMs on PM1 are migrated to PM2 sothat PM1 can be released as well. As the load goes up anddown, our algorithm will repeat the above process: spreadover or consolidate the VMs as needed.
Next we extend the scale of the experiment to 30 servers.We use the TPC-W benchmark for this experiment. TPC-Wis an industry standard benchmark for e-commerce
applications which simulates the browsing and buyingbehaviors of customers [13]. We deploy 8 VMs on eachserver at the beginning. Each VM is configured with onevirtual CPU and two gigabyte memory. Self-ballooning isenabled to allow the hypervisor to reclaim unused memory.Each VM runs the server side of the TPC-W benchmarkcorresponding to various types of the workloads: browsing,shopping, hybrid workloads, etc. Our algorithm is invokedevery 10 minutes.
Fig. 8 shows how the number of APMs varies with theaverage number of requests to each VM over time. We keepthe load on each VM low at the beginning. As a result, greencomputing takes effect and consolidates the VMs onto asmaller number of servers.1 Note that each TPC-W server,even when idle, consumes several hundreds megabytes ofmemory. After two hours, we increase the load dramaticallyto emulate a “flash crowd” event. The algorithm wakes upthe stand-by servers to offload the hot spot servers. Thefigure shows that the number of APMs increases accord-ingly. After the request rates peak for about one hour, wereduce the load gradually to emulate that the flash crowd isover. This triggers green computing again to consolidate theunderutilized servers. Fig. 8 shows that over the course ofthe experiment, the number of APM rises much faster than itfalls. This is due to the effect of our FUSD load prediction.The figure also shows that the number of APMs remains at aslightly elevated level after the flash crowd. This is becausethe TPC-W servers maintain some data in cache and henceits memory usage never goes back to its original level.
To quantify the energy saving, we measured theelectric power consumption under various TPC-W work-loads with the built-in watt-meter in our blade systems.We find that an idle blade server consumes about130 Watts and a fully utilized server consumes about205 Watts. In the above experiment, a server on averagespends 48 percent of the time in standby mode due togreen computing. This translates into roughly 62 Wattspower-saving per server or 1,860 Watts for the group of30 servers used in the experiment.
6.2 Impact of Live Migration
One concern about the use of VM live migration is itsimpact on application performance. Previous studies have
XIAO ET AL.: DYNAMIC RESOURCE ALLOCATION USING VIRTUAL MACHINES FOR CLOUD COMPUTING ENVIRONMENT 1113
Fig. 7. Algorithm effectiveness.Fig. 8. #APMs varies with TPC-W load.
1. There is a spike on the number of APMs at the very beginning becauseit takes a while to deploy the 240 VMs onto 30 servers.

found this impact to be small [5]. We investigate this
impact in our own experiment. We extract the data on the
340 live migrations in our 30 server experiment above. We
find that 139 of them are for hot spot mitigation. We focus
on these migrations because that is when the potential
impact on application performance is the most. Among the
139 migrations, we randomly pick seven corresponding
TPC-W sessions undergoing live migration. All these
sessions run the “shopping mix” workload with 200 emu-
lated browsers. As a target for comparison, we rerun the
session with the same parameters but perform no migra-
tion and use the resulting performance as the baseline.
Fig. 9 shows the normalized Web interactions per second
(WIPS) for the 7 sessions. WIPS is the performance metric
used by TPC-W. The figure shows that most live migration
sessions exhibit no noticeable degradation in performance
compared to the baseline: the normalized WIPS is close to
1. The only exception is session 3 whose degraded
performance is caused by an extremely busy server in
the original experiment.Next we take a closer look at one of the sessions in Fig. 9
and show how its performance vary over time in Fig. 10.
The dots in the figure show the WIPS every second. The two
curves show the moving average over a 30 second window
as computed by TPC-W. We marked in the figure when live
migration starts and finishes. With self-ballooning enabled,
the amount of memory transferred during the migration is
about 600 MB. The figure verifies that live migration causes
no noticeable performance degradation. The duration of the
migration is under 10 seconds. Recall that our algorithm is
invoked every 10 minutes.
6.3 Resource Balance
Recall that the goal of the skewness algorithm is to mix
workloads with different resource requirements together so
that the overall utilization of server capacity is improved. In
this experiment, we see how our algorithm handles a mix of
CPU, memory, and network intensive workloads. We vary
the CPU load as before. We inject the network load by
sending the VMs a series of network packets. The memory
intensive applications are created by allocating memory on
demand. Again we start with a small scale experiment
consisting of two PMs and four VMs so that we can present
the results for all servers in Fig. 11. The two rows represent
the two PMs. The two columns represent the CPU and
network dimensions, respectively. The memory consump-
tion is kept low for this experiment.Initially, the two VMs on PM1 are CPU intensive while
the two VMs on PM2 are network intensive. We increase the
load of their bottleneck resources gradually. Around
500 seconds, VM4 is migrated from PM2 to PM1 due to
the network overload in PM2. Then around 600 seconds,
VM1 is migrated from PM1 to PM2 due to the CPU overload
in PM1. Now the system reaches a stable state with
a balanced resource utilization for both PMs—each with a
CPU intensive VM and a network intensive VM. Later we
decrease the load of all VMs gradually so that both PMs
become cold spots. We can see that the two VMs on PM1 are
consolidated to PM2 by green computing.
1114 IEEE TRANSACTIONS ON PARALLEL AND DISTRIBUTED SYSTEMS, VOL. 24, NO. 6, JUNE 2013
Fig. 9. Impact of live migration on TPC-W performance.
Fig. 10. TPC-W performance with and without live migration.
Fig. 11. Resource balance for mixed workloads.

Next we extend the scale of the experiment to a group of72 VMs running over 8 PMs. Half of the VMs are CPUintensive, while the other half are memory intensive.Initially, we keep the load of all VMs low and deploy allCPU intensive VMs on PM4 and PM5 while all memoryintensive VMs on PM6 and PM7. Then we increase the loadon all VMs gradually to make the underlying PMs hotspots. Fig. 12 shows how the algorithm spreads the VMs toother PMs over time. As we can see from the figure, thealgorithm balances the two types of VMs appropriately. Thefigure also shows that the load across the set of PMsbecomes well balanced as we increase the load.
7 RELATED WORK
7.1 Resource Allocation at the Application Level
Automatic scaling of Web applications was previouslystudied in [14] and [15] for data center environments. InMUSE [14], each server has replicas of all web applicationsrunning in the system. The dispatch algorithm in a frontendL7-switch makes sure requests are reasonably served whileminimizing the number of underutilized servers. Work [15]uses network flow algorithms to allocate the load of anapplication among its running instances. For connectionoriented Internet services like Windows Live Messenger,work [10] presents an integrated approach for loaddispatching and server provisioning. All works above donot use virtual machines and require the applications bestructured in a multitier architecture with load balancingprovided through an front-end dispatcher. In contrast, ourwork targets Amazon EC2-style environment where itplaces no restriction on what and how applications areconstructed inside the VMs. A VM is treated like ablackbox. Resource management is done only at thegranularity of whole VMs.
MapReduce [16] is another type of popular Cloud servicewhere data locality is the key to its performance. Quincy[17] adopts min-cost flow model in task scheduling tomaximize data locality while keeping fairness amongdifferent jobs. The “Delay Scheduling” algorithm [18] tradesexecution time for data locality. Work [19] assign dynamicpriorities to jobs and users to facilitate resource allocation.
7.2 Resource Allocation by Live VM Migration
VM live migration is a widely used technique for dynamicresource allocation in a virtualized environment [8], [12],
[20]. Our work also belongs to this category. Sandpipercombines multidimensional load information into a singleVolume metric [8]. It sorts the list of PMs based on theirvolumes and the VMs in each PM in their volume-to-sizeratio (VSR). This unfortunately abstracts away criticalinformation needed when making the migration decision.It then considers the PMs and the VMs in the presortedorder. We give a concrete example in Section 1 of thesupplementary file, which is available online, where theiralgorithm selects the wrong VM to migrate away duringoverload and fails to mitigate the hot spot. We alsocompare our algorithm and theirs in real experiment. Theresults are analyzed in Section 5 of the supplementary file,which is available online, to show how they behavedifferently. In addition, their work has no support forgreen computing and differs from ours in many otheraspects such as load prediction.
The HARMONY system applies virtualization technol-ogy across multiple resource layers [20]. It uses VM and datamigration to mitigate hot spots not just on the servers, butalso on network devices and the storage nodes as well. Itintroduces the Extended Vector Product (EVP) as an indicatorof imbalance in resource utilization. Their load balancingalgorithm is a variant of the Toyoda method [21] formultidimensional knapsack problem. Unlike our system,their system does not support green computing and loadprediction is left as future work. In Section 6 of thesupplementary file, which is available online, we analyzethe phenomenon that V ectorDot behaves differently com-pared with our work and point out the reason why ouralgorithm can utilize residual resources better.
Dynamic placement of virtual servers to minimize SLAviolations is studied in [12]. They model it as a bin packingproblem and use the well-known first-fit approximationalgorithm to calculate the VM to PM layout periodically.That algorithm, however, is designed mostly for offline use.It is likely to incur a large number of migrations whenapplied in online environment where the resource needs ofVMs change dynamically.
7.3 Green Computing
Many efforts have been made to curtail energy consumptionin data centers. Hardware-based approaches include novelthermal design for lower cooling power, or adopting power-proportional and low-power hardware. Work [22] usesdynamic voltage and frequency scaling (DVFS) to adjustCPU power according to its load. We do not use DVFS forgreen computing, as explained in Section 7 of the supple-mentary file. PowerNap [23] resorts to new hardwaretechnologies such as solid state disk (SSD) and Self-RefreshDRAM to implement rapid transition(less than 1ms) betweenfull operation and low power state, so that it can “take a nap”in short idle intervals. When a server goes to sleep,Somniloquy [24] notifies an embedded system residing on aspecial designed NIC to delegate the main operating system.It gives the illusion that the server is always active.
Our work belongs to the category of pure-software low-cost solutions [10], [12], [14], [25], [26], [27]. Similar toSomniloquy [24], SleepServer [26] initiates virtual machineson a dedicated server as delegate, instead of depending on aspecial NIC. LiteGreen [25] does not use a delegate. Instead itmigrates the desktop OS away so that the desktop can sleep. Itrequires that the desktop is virtualized with shared storage.
XIAO ET AL.: DYNAMIC RESOURCE ALLOCATION USING VIRTUAL MACHINES FOR CLOUD COMPUTING ENVIRONMENT 1115
Fig. 12. VM distribution over time.

Jettison [27] invents “partial VM migration,” a variance of liveVM migration, which only migrates away necessary workingset while leaving infrequently used data behind.
8 CONCLUSION
We have presented the design, implementation, and evalua-tion of a resource management system for cloud computingservices. Our system multiplexes virtual to physical re-sources adaptively based on the changing demand. We usethe skewness metric to combine VMs with different resourcecharacteristics appropriately so that the capacities of serversare well utilized. Our algorithm achieves both overloadavoidance and green computing for systems with multi-resource constraints.
ACKNOWLEDGMENTS
The authors would like to thank the anonymous reviewers fortheir invaluable feedback. This work was supported by theNational Natural Science Foundation of China (Grant No.61170056), the National High Technology Research andDevelopment Program (“863” Program) of China (Grant No.2013AA013203), National Basic Research Program of China(Grant No. 2009CB320505) and Digital Resource SecurityProtection Service Based on Trusted Identity Federation andCloud Computation SubProject of 2011 Information SecuritySpecial Project sponsored by National Development andReform Commission.
REFERENCES
[1] M. Armbrust et al., “Above the Clouds: A Berkeley View of CloudComputing,” technical report, Univ. of California, Berkeley, Feb.2009.
[2] L. Siegele, “Let It Rise: A Special Report on Corporate IT,” TheEconomist, vol. 389, pp. 3-16, Oct. 2008.
[3] P. Barham, B. Dragovic, K. Fraser, S. Hand, T. Harris, A. Ho, R.Neugebauer, I. Pratt, and A. Warfield, “Xen and the Art ofVirtualization,” Proc. ACM Symp. Operating Systems Principles(SOSP ’03), Oct. 2003.
[4] “Amazon elastic compute cloud (Amazon EC2),” http://aws.amazon.com/ec2/, 2012.
[5] C. Clark, K. Fraser, S. Hand, J.G. Hansen, E. Jul, C. Limpach, I.Pratt, and A. Warfield, “Live Migration of Virtual Machines,”Proc. Symp. Networked Systems Design and Implementation(NSDI ’05), May 2005.
[6] M. Nelson, B.-H. Lim, and G. Hutchins, “Fast TransparentMigration for Virtual Machines,” Proc. USENIX Ann. TechnicalConf., 2005.
[7] M. McNett, D. Gupta, A. Vahdat, and G.M. Voelker, “Usher: AnExtensible Framework for Managing Clusters of Virtual Ma-chines,” Proc. Large Installation System Administration Conf.(LISA ’07), Nov. 2007.
[8] T. Wood, P. Shenoy, A. Venkataramani, and M. Yousif, “Black-Boxand Gray-Box Strategies for Virtual Machine Migration,” Proc.Symp. Networked Systems Design and Implementation (NSDI ’07),Apr. 2007.
[9] C.A. Waldspurger, “Memory Resource Management in VMwareESX Server,” Proc. Symp. Operating Systems Design and Implementa-tion (OSDI ’02), Aug. 2002.
[10] G. Chen, H. Wenbo, J. Liu, S. Nath, L. Rigas, L. Xiao, and F. Zhao,“Energy-Aware Server Provisioning and Load Dispatching forConnection-Intensive Internet Services,” Proc. USENIX Symp.Networked Systems Design and Implementation (NSDI ’08), Apr. 2008.
[11] P. Padala, K.-Y. Hou, K.G. Shin, X. Zhu, M. Uysal, Z. Wang, S.Singhal, and A. Merchant, “Automated Control of MultipleVirtualized Resources,” Proc. ACM European conf. ComputerSystems (EuroSys ’09), 2009.
[12] N. Bobroff, A. Kochut, and K. Beaty, “Dynamic Placement ofVirtual Machines for Managing SLA Violations,” Proc. IFIP/IEEEInt’l Symp. Integrated Network Management (IM ’07), 2007.
[13] “TPC-W: Transaction Processing Performance Council,” http://www.tpc.org/tpcw/, 2012.
[14] J.S. Chase, D.C. Anderson, P.N. Thakar, A.M. Vahdat, and R.P.Doyle, “Managing Energy and Server Resources in HostingCenters,” Proc. ACM Symp. Operating System Principles (SOSP ’01),Oct. 2001.
[15] C. Tang, M. Steinder, M. Spreitzer, and G. Pacifici, “A ScalableApplication Placement Controller for Enterprise Data Centers,”Proc. Int’l World Wide Web Conf. (WWW ’07), May 2007.
[16] M. Zaharia, A. Konwinski, A.D. Joseph, R.H. Katz, and I. Stoica,“Improving MapReduce Performance in Heterogeneous Environ-ments,” Proc. Symp. Operating Systems Design and Implementation(OSDI ’08), 2008.
[17] M. Isard, V. Prabhakaran, J. Currey, U. Wieder, K. Talwar, and A.Goldberg, “Quincy: Fair Scheduling for Distributed ComputingClusters,” Proc. ACM Symp. Operating System Principles (SOSP ’09),Oct. 2009.
[18] M. Zaharia, D. Borthakur, J. Sen Sarma, K. Elmeleegy, S. Shenker,and I. Stoica, “Delay Scheduling: A Simple Technique forAchieving Locality and Fairness in Cluster Scheduling,” Proc.European Conf. Computer Systems (EuroSys ’10), 2010.
[19] T. Sandholm and K. Lai, “Mapreduce Optimization UsingRegulated Dynamic Prioritization,” Proc. Int’l Joint Conf. Measure-ment and Modeling of Computer Systems (SIGMETRICS ’09), 2009.
[20] A. Singh, M. Korupolu, and D. Mohapatra, “Server-StorageVirtualization: Integration and Load Balancing in Data Centers,”Proc. ACM/IEEE Conf. Supercomputing, 2008.
[21] Y. Toyoda, “A Simplified Algorithm for Obtaining ApproximateSolutions to Zero-One Programming Problems,” ManagementScience, vol. 21, pp. 1417-1427, Aug. 1975.
[22] R. Nathuji and K. Schwan, “Virtualpower: Coordinated PowerManagement in Virtualized Enterprise Systems,” Proc. ACMSIGOPS Symp. Operating Systems Principles (SOSP ’07), 2007.
[23] D. Meisner, B.T. Gold, and T.F. Wenisch, “Powernap: EliminatingServer Idle Power,” Proc. Int’l Conf. Architectural Support forProgramming Languages and Operating Systems (ASPLOS ’09), 2009.
[24] Y. Agarwal, S. Hodges, R. Chandra, J. Scott, P. Bahl, and R. Gupta,“Somniloquy: Augmenting Network Interfaces to Reduce PcEnergy Usage,” Proc. USENIX Symp. Networked Systems Designand Implementation (NSDI ’09), 2009.
[25] T. Das, P. Padala, V.N. Padmanabhan, R. Ramjee, and K.G. Shin,“Litegreen: Saving Energy in Networked Desktops Using Virtua-lization,” Proc. USENIX Ann. Technical Conf., 2010.
[26] Y. Agarwal, S. Savage, and R. Gupta, “Sleepserver: A Software-Only Approach for Reducing the Energy Consumption of PCSwithin Enterprise Environments,” Proc. USENIX Ann. TechnicalConf., 2010.
[27] N. Bila, E.d. Lara, K. Joshi, H.A. Lagar-Cavilla, M. Hiltunen, andM. Satyanarayanan, “Jettison: Efficient Idle Desktop Consolida-tion with Partial VM Migration,” Proc. ACM European Conf.Computer Systems (EuroSys ’12), 2012.
Zhen Xiao is a professor in the Department ofComputer Science at Peking University. Hereceived the PhD degree from Cornell Universityin January 2001. After that, he worked as a seniortechnical staff member at AT&T Labs, NewJersey and then as a research staff member atIBM T.J. Watson Research Center. His researchinterests include cloud computing, virtualization,and various distributed systems issues. He is asenior member of the IEEE and ACM.
1116 IEEE TRANSACTIONS ON PARALLEL AND DISTRIBUTED SYSTEMS, VOL. 24, NO. 6, JUNE 2013

Weijia Song received the bachelor’s andmaster’s degrees from Beijing Institute of Tech-nology. Currently, he is a doctoral student atPeking University. His current research focuseson resource scheduling problems in cloudsystems.
Qi Chen received the bachelor’s degree fromPeking University in 2010. Currently, she is adoctoral student at Peking University. Hercurrent research focuses on the cloud comput-ing and parallel computing.
. For more information on this or any other computing topic,please visit our Digital Library at www.computer.org/publications/dlib.
XIAO ET AL.: DYNAMIC RESOURCE ALLOCATION USING VIRTUAL MACHINES FOR CLOUD COMPUTING ENVIRONMENT 1117