dynamic triggering of microseismicity in a mine settingvanderba/papers/cava15.pdf · dynamic...
TRANSCRIPT
Geophysical Journal InternationalGeophys. J. Int. (2015) 202, 728–737 doi: 10.1093/gji/ggv159
GJI Seismology
Dynamic triggering of microseismicity in a mine setting
Fernando Castellanos and Mirko Van der BaanDepartment of Physics, University of Alberta, Edmonton, Alberta, Canada. E-mail: [email protected]
Accepted 2015 April 13. Received 2015 April 5; in original form 2014 November 14
S U M M A R YWe examine spatio-temporal patterns of microseismicity recorded during one month in anunderground mine by addressing three key questions: (1) where does the seismicity occur?(2) Why does it occur in these locations? and (3) what triggers it? To obtain accurate locations,we perform a multiplet analysis and use a modified version of the double-difference (DD)relocation method. This approach leads to highly accurate relative event locations and requiresgroups of multiplets only. Most of the 281 relocated events are close to the main shaft andtunnels; thus we postulate seismicity is facilitated by stresses associated with the potentialfor subsidence in addition to the hoop stresses acting on the two vertical shafts. Most eventsoccurred during certain hours of the day and there is a 68 per cent correlation with reported rockremoval; therefore, it is likely they were triggered by static and dynamic stress perturbationscaused by the transportation of debris along tunnels instead of our initial guess that blastingwas the principal causative mechanism. Given that seismicity is present around the main shaftbut absent close to the second one, we conclude that for seismicity to occur both a favourablestress state and additional external perturbing forces must exist, thus leading to dynamicevent triggering in an initially stable stress situation. This analysis provides more insight intoanthropogenic processes that might trigger seismicity, thereby facilitating identification ofhazardous and potential damage areas in mine settings.
Key words: Time-series analysis; Downhole methods; Earthquake dynamics; Early warning;Computational seismology.
1 I N T RO D U C T I O N
Over the last several years there has been significant public interestin possible increased earthquake hazard due to anthropogenic ac-tivities (Ellsworth 2013). Some recent examples include the 2009unusual sequence of seismicity caused by fluid injection duringhydraulic fracturing in the Horn River Basin of British Columbia,with the largest event at Mw = 3.6 (BCOGC 2012); and the 2011central Oklahoma earthquake sequence (including a Mw ∼ 4.1 anda Mw ∼ 5.1 event) located close to two wastewater-injection wellsthat occurred 18 yr after disposal operations began, even thoughthis has historically been considered a quiet seismic region (Hol-land 2013; Keranen et al. 2013). Others concerns include poten-tial seismic activity related to activities such as CO2 sequestration(Zoback & Gorelick 2012), hydraulic fracturing for geothermalenergy and surface reservoir impoundment (Mcclure 2012). In allthese cases there is often significant discussion if variations in earth-quake seismicity rates are due to anthropogenic activities or partof natural earthquake cycles (Ellsworth 2013; Llenos & Michael2013).
Mining-induced seismicity has unfortunately also generatedcatastrophic events in the past to infrastructure and workers. Forinstance, the rockburst that occurred in June 1984 at the Falcon-
bridge Mine, Canada, damaged the mine workings and killed fourminers (Wetmiller et al. 1993). The 1989 Volkershausen, Germany,magnitude 5.4 is a clear example of remarkable damage, where3200 pillars collapsed at depths between 800 and 900 m (Knoll1990). More recently, in 2007 part of the Crandall Canyon Mine,USA, collapsed and trapped workers underground and a rescue at-tempt through the reopening of a collapsed mine entry generateda violent burst of coal, injuring more rescue workers (Kubackiet al. 2014). As a result, health and safety concerns in mineshave risen in order to minimize the occurrence of such unde-sired events, for example rockburst, flooding and underground gasemissions.
Mining seismicity is usually complex as it is likely to be affectedby the mine geometry, depth, current stress state as well as exca-vation and exploitation processes. Thus, a key step is to analysethe relationship between anthropogenic activities and microseismiclocations. Microseismic events usually occur as clusters, so relativelocation methods have been extensively used in mining to track thedirection of tunnelling, fault structures or changes in rock masswith more accuracy than absolute methods (Abdul-Wahed et al.2006; Boltz et al. 2013; Kubacki et al. 2014). This has allowedenhanced assessment of potential damage zones and areas whereseismic activity and hazards are more likely to increase.
728 C© The Authors 2015. Published by Oxford University Press on behalf of The Royal Astronomical Society.
by guest on May 30, 2015
http://gji.oxfordjournals.org/D
ownloaded from
Microseismic dynamic triggering 729
In this work, we study one month of microseismicity recordedduring drilling and tunnelling in an underground mine. We addressthree key questions: Where is the seismicity located? Why does itoccur in these locations and not somewhere else? And what specif-ically triggers their occurrence? To achieve that, we perform multi-plet analysis based on a modified version of the double-differencetechnique (Poupinet et al. 1984; Got et al. 1994; Waldhauser &Ellsworth 2000; De Meersman et al. 2009; Boltz et al. 2013) toobtain highly accurate relative microseismic locations. Our initialassumption is that blasting is the main dynamic triggering mecha-nism, since the seismicity is located close to the main tunnels and themain access shaft. Counterintuitive, no immediate seismicity fol-low these detonations. In fact, most of the seismicity correlates withscheduled rock removal. These findings lead us to postulate that formicroseismic activity to occur two conditions should be met: (1) afavourable stress state in the neighbouring area (Evans et al. 2012)and (2) unless the in situ static stresses exceed some critical thresh-old, an additional dynamic triggering mechanism must be present(Freed 2005). We assume that a favourable stress state is createdboth by the hoop stresses around the vertical shafts (Zoback 2007)and the presence of horizontal tunnels which create a tendency forsubsidence of the overburden similar to a depleting hydrocarbonreservoir (Segall 1989).
2 T H E O RY
2.1 Multiplet locations
Multiplet analysis is performed using a modified version of thedouble-difference method, to get highly accurate relative multipletlocations (Poupinet et al. 1984; Got et al. 1994; Waldhauser &Ellsworth 2000; De Meersman et al. 2009). The main assump-tion in the DD method is that ray paths between two events arevery similar if their hypocentral separation is small compared tothe source–receiver distances; therefore, relative traveltime differ-ence at a common station will be due to the spatial offset betweenboth events. In other words, the effects of most velocity hetero-geneities cancel out, such that only knowledge of the velocities inthe source region is required. The double-difference residuals forpairs of events at each station are minimized, with the locationsand partial derivatives being updated after each iteration, solvingthe relative hypocentral parameters for each event (Waldhauser &Ellsworth 2000).
Unlike Waldhauser & Ellsworth (2000) who relocate correlatedand uncorrelated events simultaneously, our approach relocatesmultiplet groups independently (Castellanos & Van der Baan 2013).By grouping well-connected events, we ensure more stability in theinversion, although the number of useful events is reduced. Anotherdifference is that in Waldhauser & Ellsworth (2000), initial absolutelocations are first determined using catalogue data, next final relativerelocations are obtained as more weight is given to cross-correlationdata, whereas in our approach, initial absolute locations are first de-termined using a grid search algorithm; next relative locations aredetermined using cross-correlation data (only multiplets). The out-put locations are relative, so we keep fixed each multiplet groupcentroid before and after relocation assuming that initial locationsprovide a large-scale picture. Similar to Waldhauser & Ellsworth(2000), we use exponential functions based on cross-correlationvalues and interevent distances to emphasize observations fromdoublet pairs. This weighting scheme is key in the inversion as itcontrols which observations will impact more the final locations
(Poupinet et al. 1984; Got et al. 1994). Full details on the imple-mented weighting scheme can be found in Castellanos & Van derBaan (2013).
2.2 Stress perturbations around shafts and tunnels
A favourable, near-critical, stress state is a necessary condition forthe occurrence of triggered seismicity (Mcgarr & Simpson 1997;Freed 2005; Evans et al. 2012). If the virgin rockmass before cre-ation of the underground mine is mostly homogeneous then the localstress field is highly similar to the regional one since this limits spa-tial variations in differential stresses due to lithological layering andother heterogeneities (Roche et al. 2013; Roche & Van der Baan2015). Moreover, if no active faulting is present within the mine,engineering operations such as the opening of shafts and tunnelswill likely be the main cause for perturbing the in situ virgin stressstate.
For instance, the creation of a vertical shaft induces hoop andradial stresses in the horizontal plane, similar to those for a verticalborehole (Zoback 2007). Hoop stresses act parallel to the shaftwall in a circumferential manner, whereas the radial stresses actperpendicular to it. These are created to compensate for the removedmaterial yielding local stress concentrations and are described bythe Kirsch equations (Zoback 2007). In other words, we anticipateseismicity to be centred around any shafts due to these induced localstress concentrations.
Similarly, the opening of horizontal tunnels at the excavation lev-els also perturbs the local stress field due to hoop and radial stressesin the vertical plane, in addition to gravitational pull and push in theoverburden and underburden, respectively, causing potential subsi-dence (Young et al. 2004; Cai & Kaiser 2005). These effects aresimilar to those experienced by compacting hydrocarbon reservoirsdue to fluid extraction (Segall 1989; Scott 2005). By modelling thehydrocarbon reservoir as a poroelastic medium in an impermeableelastic half-space, Segall (1989) states that after fluid extraction, therock compacts vertically at the centre, that is subsidence; whereasmore shear failures and extension dominate at the lateral regions.As a result, we also expect seismicity in the overburden around themain tunnels due to these imposed stress changes.
2.3 Microseismic triggering
Current thoughts are that both static and dynamic stress pertur-bations can trigger seismicity by overcoming either the tensile orcompressive rock strengths and any additional shear friction alongfault surfaces (Kilb et al. 2000; Freed 2005). More specifically,the likelihood of shear and tensile failure is described by the Mohr–Coulomb and Griffith criteria, respectively (Davis et al. 2011; Rocheet al. 2013; Roche & Van der Baan 2015). In this context, static trig-gering occurs due to large-scale variations in the local and regionalstress changes over relatively long periods of time, for example,due to past slip on a fault, solid Earth tides or pull by the Sun andMoon and the excavation of tunnels and shafts, whereas dynamictriggering implies seismicity due to the passage of transient waveswhich leave no permanent imprint on the in situ stress field (Stein1999).
For instance, blast detonations are commonly used in miningexploitation and can produce energy outputs on the order of magni-tude 1 events or above (Adushkin 2013). Following a larger event,Omori’s law stipulates that aftershocks (i.e. events with generallysmaller magnitudes) are likely to occur with a frequency inversely
by guest on May 30, 2015
http://gji.oxfordjournals.org/D
ownloaded from
730 F. Castellanos and M. Van der Baan
proportional to the time since the main shock (Stein & Wyses-sion 2003). In other words, mine blasts may trigger other seis-mic events in the vicinity of the mine and pose risks (Pomeroyet al. 1976; Martin & Young 1993). Blasting operations are thus acommon dynamic triggering agent in the mining industry (Younget al. 1992; Read 2004; Cai & Kaiser 2005). These detonationsare usually followed by transportation of the debris hours or dayslater, so this transportation can also represent a mechanism forstress transfer to shaft and tunnel walls as well as surroundingrocks.
3 DATA B A C KG RO U N D A N DP RO C E S S I N G
A microseismic monitoring system was installed at an undergroundmine to continuously detect zones of potential hazards, instabili-ties and water flooding. Data recorded during January 2011 by 28three-component geophones distributed in seven vertical boreholesare used to investigate microseismic activity in the area. 24 821seismograms were recorded but the vast majority of them containpurely noise. We apply a standard pre-processing workflow to ob-tain absolute event locations. First, the data, recorded using 2 msas sample rate, is bandpass filtered using corner frequencies of 60–80–170–180 Hz. Also a notch filter is applied to remove high-peakamplitudes at 60 Hz and overtones, producing waveforms with anaverage signal-to-noise ratio of 3. 488 events are detected using aSTA/LTA method with a short and long time window of 30 and300 ms, respectively, and a fixed threshold of 3. P-wave arrivals arepicked using autoregressive modelling and the application of theAkaike Information Criterion (Sleeman & van Eck 1999), and thenrepicked manually if necessary. Most events have short moveouttimes between P and S waves; as a result, no S waves are picked. Weoriginally used a calibrated 1-D velocity model for P waves but thisproduced highly scattered event locations possibly due to the pres-ence of abrupt velocity changes imposed by the shafts and tunnels.So we simplify the model to a homogeneous P-wave velocity of3700 m s−1 to determine initial event locations using a grid searchalgorithm (Sambridge & Kennett 1986; Billings 1994), prior to themultiplet relocation.
During the post-processing stage, multiplet groups, that is groupsof events with nearly identical waveforms and source mecha-nisms are detected via cross-correlation based on the methodol-ogy of Arrowsmith & Eisner (2006). We set a minimum cross-correlation threshold of 0.8 and allow events within each separategroup to be linked in a chain-like fashion, so mutual similarity isnot required. This allowed gathering 281 events among 21 mul-tiplet groups, which represent 58 per cent of the total detectedseismicity.
The absolute locations of these multiplet groups determined viagrid search are the input to the multiplet analysis described in theprevious section. The same velocity model as in the grid searchis used in the multiplet relocation inversion, thus we rely on theassumption that results depend only weakly on the chosen velocitymodel and that a simpler model may give better final results thana highly complex model which aims at accounting for the presenceof tunnels and shafts.
4 R E S U LT S
The 21 multiplet groups detected during January 2011 are relocatedusing the multiplet methods. One of the assumptions of the method
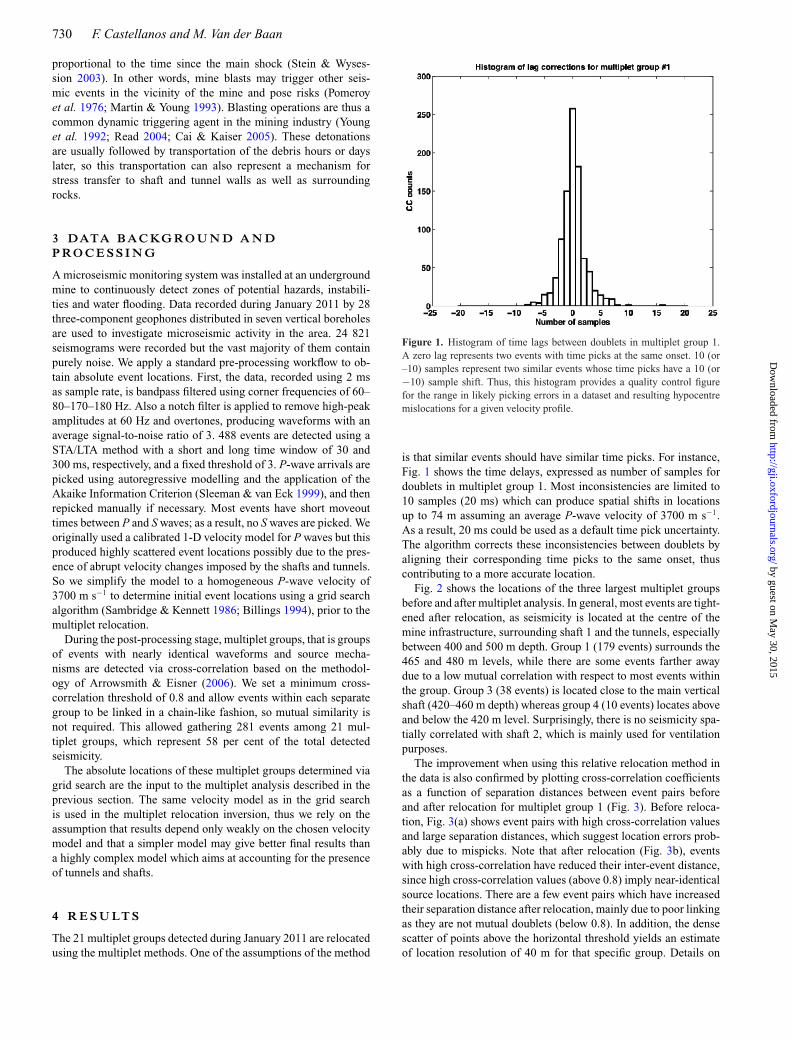
Figure 1. Histogram of time lags between doublets in multiplet group 1.A zero lag represents two events with time picks at the same onset. 10 (or–10) samples represent two similar events whose time picks have a 10 (or−10) sample shift. Thus, this histogram provides a quality control figurefor the range in likely picking errors in a dataset and resulting hypocentremislocations for a given velocity profile.
is that similar events should have similar time picks. For instance,Fig. 1 shows the time delays, expressed as number of samples fordoublets in multiplet group 1. Most inconsistencies are limited to10 samples (20 ms) which can produce spatial shifts in locationsup to 74 m assuming an average P-wave velocity of 3700 m s−1.As a result, 20 ms could be used as a default time pick uncertainty.The algorithm corrects these inconsistencies between doublets byaligning their corresponding time picks to the same onset, thuscontributing to a more accurate location.
Fig. 2 shows the locations of the three largest multiplet groupsbefore and after multiplet analysis. In general, most events are tight-ened after relocation, as seismicity is located at the centre of themine infrastructure, surrounding shaft 1 and the tunnels, especiallybetween 400 and 500 m depth. Group 1 (179 events) surrounds the465 and 480 m levels, while there are some events farther awaydue to a low mutual correlation with respect to most events withinthe group. Group 3 (38 events) is located close to the main verticalshaft (420–460 m depth) whereas group 4 (10 events) locates aboveand below the 420 m level. Surprisingly, there is no seismicity spa-tially correlated with shaft 2, which is mainly used for ventilationpurposes.
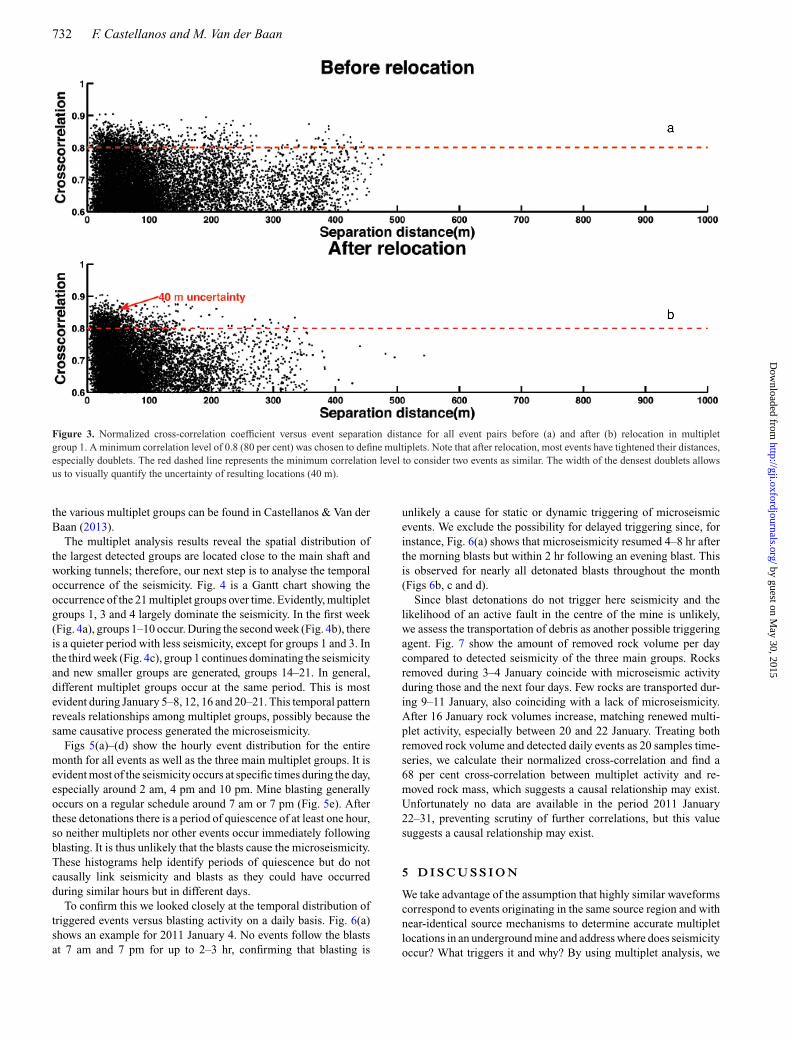
The improvement when using this relative relocation method inthe data is also confirmed by plotting cross-correlation coefficientsas a function of separation distances between event pairs beforeand after relocation for multiplet group 1 (Fig. 3). Before reloca-tion, Fig. 3(a) shows event pairs with high cross-correlation valuesand large separation distances, which suggest location errors prob-ably due to mispicks. Note that after relocation (Fig. 3b), eventswith high cross-correlation have reduced their inter-event distance,since high cross-correlation values (above 0.8) imply near-identicalsource locations. There are a few event pairs which have increasedtheir separation distance after relocation, mainly due to poor linkingas they are not mutual doublets (below 0.8). In addition, the densescatter of points above the horizontal threshold yields an estimateof location resolution of 40 m for that specific group. Details on
by guest on May 30, 2015
http://gji.oxfordjournals.org/D
ownloaded from

Microseismic dynamic triggering 731
Figure 2. Hypocentre locations before (a, c and e in left-hand panel) and after (b, d and f in right-hand panel) multiplet analysis for the three largest groups:Group 1 (black), 3 (red) and 4 (green). Compared to initial locations, these groups have been tightened after relocation. Receiver boreholes indicated bycoloured open diamonds (only geophones closer to the mine are shown). Tunnels and shafts shown in blue.
by guest on May 30, 2015
http://gji.oxfordjournals.org/D
ownloaded from
732 F. Castellanos and M. Van der Baan
Figure 3. Normalized cross-correlation coefficient versus event separation distance for all event pairs before (a) and after (b) relocation in multipletgroup 1. A minimum correlation level of 0.8 (80 per cent) was chosen to define multiplets. Note that after relocation, most events have tightened their distances,especially doublets. The red dashed line represents the minimum correlation level to consider two events as similar. The width of the densest doublets allowsus to visually quantify the uncertainty of resulting locations (40 m).
the various multiplet groups can be found in Castellanos & Van derBaan (2013).
The multiplet analysis results reveal the spatial distribution ofthe largest detected groups are located close to the main shaft andworking tunnels; therefore, our next step is to analyse the temporaloccurrence of the seismicity. Fig. 4 is a Gantt chart showing theoccurrence of the 21 multiplet groups over time. Evidently, multipletgroups 1, 3 and 4 largely dominate the seismicity. In the first week(Fig. 4a), groups 1–10 occur. During the second week (Fig. 4b), thereis a quieter period with less seismicity, except for groups 1 and 3. Inthe third week (Fig. 4c), group 1 continues dominating the seismicityand new smaller groups are generated, groups 14–21. In general,different multiplet groups occur at the same period. This is mostevident during January 5–8, 12, 16 and 20–21. This temporal patternreveals relationships among multiplet groups, possibly because thesame causative process generated the microseismicity.
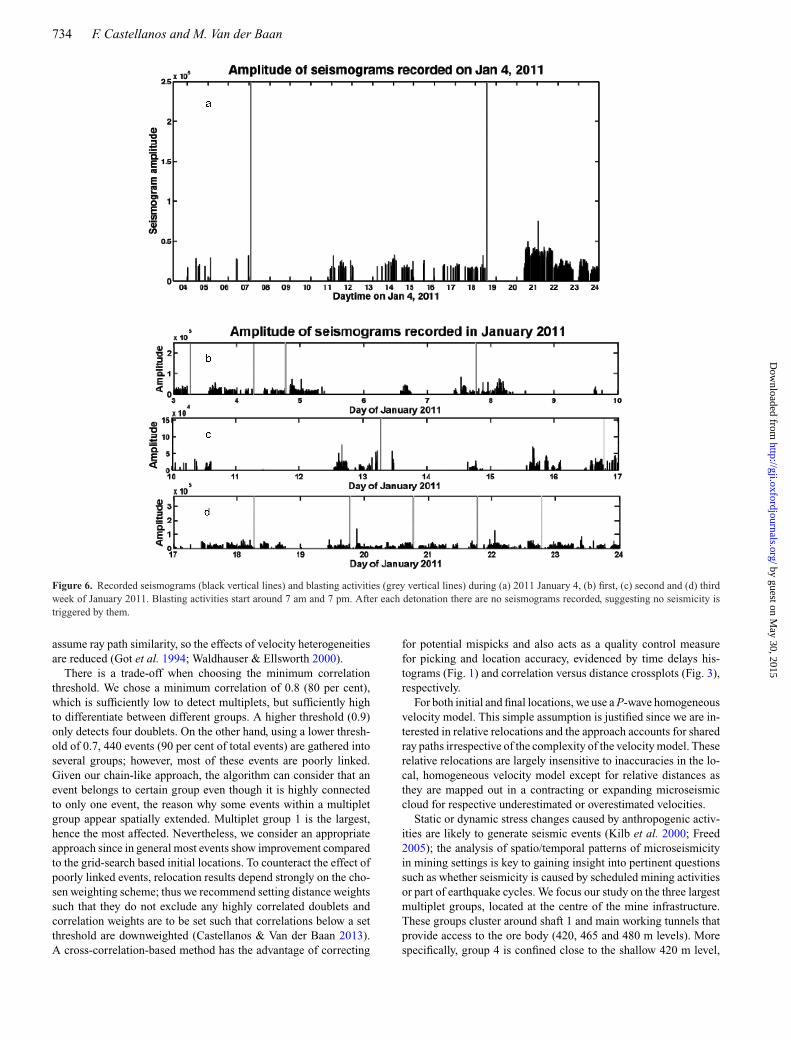
Figs 5(a)–(d) show the hourly event distribution for the entiremonth for all events as well as the three main multiplet groups. It isevident most of the seismicity occurs at specific times during the day,especially around 2 am, 4 pm and 10 pm. Mine blasting generallyoccurs on a regular schedule around 7 am or 7 pm (Fig. 5e). Afterthese detonations there is a period of quiescence of at least one hour,so neither multiplets nor other events occur immediately followingblasting. It is thus unlikely that the blasts cause the microseismicity.These histograms help identify periods of quiescence but do notcausally link seismicity and blasts as they could have occurredduring similar hours but in different days.
To confirm this we looked closely at the temporal distribution oftriggered events versus blasting activity on a daily basis. Fig. 6(a)shows an example for 2011 January 4. No events follow the blastsat 7 am and 7 pm for up to 2–3 hr, confirming that blasting is
unlikely a cause for static or dynamic triggering of microseismicevents. We exclude the possibility for delayed triggering since, forinstance, Fig. 6(a) shows that microseismicity resumed 4–8 hr afterthe morning blasts but within 2 hr following an evening blast. Thisis observed for nearly all detonated blasts throughout the month(Figs 6b, c and d).
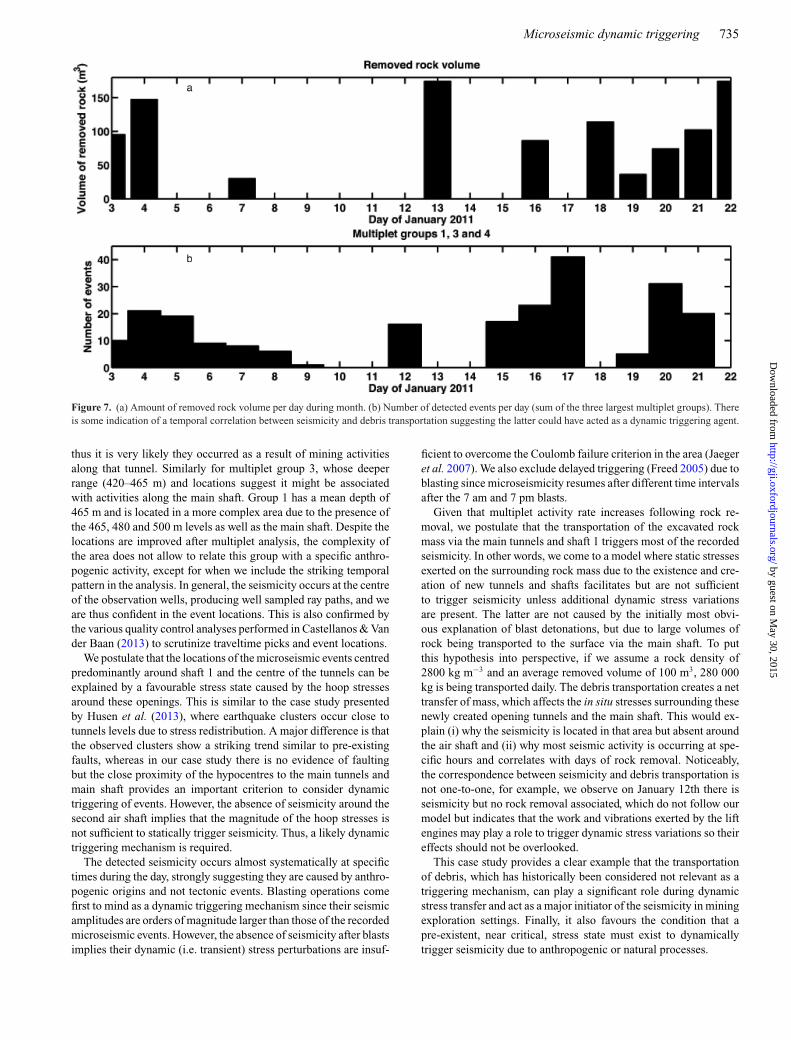
Since blast detonations do not trigger here seismicity and thelikelihood of an active fault in the centre of the mine is unlikely,we assess the transportation of debris as another possible triggeringagent. Fig. 7 show the amount of removed rock volume per daycompared to detected seismicity of the three main groups. Rocksremoved during 3–4 January coincide with microseismic activityduring those and the next four days. Few rocks are transported dur-ing 9–11 January, also coinciding with a lack of microseismicity.After 16 January rock volumes increase, matching renewed multi-plet activity, especially between 20 and 22 January. Treating bothremoved rock volume and detected daily events as 20 samples time-series, we calculate their normalized cross-correlation and find a68 per cent cross-correlation between multiplet activity and re-moved rock mass, which suggests a causal relationship may exist.Unfortunately no data are available in the period 2011 January22–31, preventing scrutiny of further correlations, but this valuesuggests a causal relationship may exist.
5 D I S C U S S I O N
We take advantage of the assumption that highly similar waveformscorrespond to events originating in the same source region and withnear-identical source mechanisms to determine accurate multipletlocations in an underground mine and address where does seismicityoccur? What triggers it and why? By using multiplet analysis, we
by guest on May 30, 2015
http://gji.oxfordjournals.org/D
ownloaded from

Microseismic dynamic triggering 733
Figure 4. Gantt chart showing temporal multiplets occurrence during January 2011: (a) 2011 January 3–9, (b) 2011 January 10–16 and (c) 2011 January17–23. Each multiplet group is shown with a different colour. Most events from the largest multiplet group (red) occur during the third week, compared to thesecond largest group (orange) which occurs during the first 2 weeks. During 2011 January 24–31 no data are recorded.
Figure 5. Histogram of hourly seismicity and blasting times during January 2011. (a) 488 microseismic recorded events, (b) multiplet group 1, (c) multipletgroup 3, (d) multiplet group 4 and (e) blasting activities. Two features are visible: (i) the seismicity seems to occur at specific hours of the day and (ii) blastingactivities are scheduled around 6–7 am and 6–7 pm and they do not seem to trigger immediate seismicity.
by guest on May 30, 2015
http://gji.oxfordjournals.org/D
ownloaded from
734 F. Castellanos and M. Van der Baan
Figure 6. Recorded seismograms (black vertical lines) and blasting activities (grey vertical lines) during (a) 2011 January 4, (b) first, (c) second and (d) thirdweek of January 2011. Blasting activities start around 7 am and 7 pm. After each detonation there are no seismograms recorded, suggesting no seismicity istriggered by them.
assume ray path similarity, so the effects of velocity heterogeneitiesare reduced (Got et al. 1994; Waldhauser & Ellsworth 2000).
There is a trade-off when choosing the minimum correlationthreshold. We chose a minimum correlation of 0.8 (80 per cent),which is sufficiently low to detect multiplets, but sufficiently highto differentiate between different groups. A higher threshold (0.9)only detects four doublets. On the other hand, using a lower thresh-old of 0.7, 440 events (90 per cent of total events) are gathered intoseveral groups; however, most of these events are poorly linked.Given our chain-like approach, the algorithm can consider that anevent belongs to certain group even though it is highly connectedto only one event, the reason why some events within a multipletgroup appear spatially extended. Multiplet group 1 is the largest,hence the most affected. Nevertheless, we consider an appropriateapproach since in general most events show improvement comparedto the grid-search based initial locations. To counteract the effect ofpoorly linked events, relocation results depend strongly on the cho-sen weighting scheme; thus we recommend setting distance weightssuch that they do not exclude any highly correlated doublets andcorrelation weights are to be set such that correlations below a setthreshold are downweighted (Castellanos & Van der Baan 2013).A cross-correlation-based method has the advantage of correcting
for potential mispicks and also acts as a quality control measurefor picking and location accuracy, evidenced by time delays his-tograms (Fig. 1) and correlation versus distance crossplots (Fig. 3),respectively.
For both initial and final locations, we use a P-wave homogeneousvelocity model. This simple assumption is justified since we are in-terested in relative relocations and the approach accounts for sharedray paths irrespective of the complexity of the velocity model. Theserelative relocations are largely insensitive to inaccuracies in the lo-cal, homogeneous velocity model except for relative distances asthey are mapped out in a contracting or expanding microseismiccloud for respective underestimated or overestimated velocities.
Static or dynamic stress changes caused by anthropogenic activ-ities are likely to generate seismic events (Kilb et al. 2000; Freed2005); the analysis of spatio/temporal patterns of microseismicityin mining settings is key to gaining insight into pertinent questionssuch as whether seismicity is caused by scheduled mining activitiesor part of earthquake cycles. We focus our study on the three largestmultiplet groups, located at the centre of the mine infrastructure.These groups cluster around shaft 1 and main working tunnels thatprovide access to the ore body (420, 465 and 480 m levels). Morespecifically, group 4 is confined close to the shallow 420 m level,
by guest on May 30, 2015
http://gji.oxfordjournals.org/D
ownloaded from
Microseismic dynamic triggering 735
Figure 7. (a) Amount of removed rock volume per day during month. (b) Number of detected events per day (sum of the three largest multiplet groups). Thereis some indication of a temporal correlation between seismicity and debris transportation suggesting the latter could have acted as a dynamic triggering agent.
thus it is very likely they occurred as a result of mining activitiesalong that tunnel. Similarly for multiplet group 3, whose deeperrange (420–465 m) and locations suggest it might be associatedwith activities along the main shaft. Group 1 has a mean depth of465 m and is located in a more complex area due to the presence ofthe 465, 480 and 500 m levels as well as the main shaft. Despite thelocations are improved after multiplet analysis, the complexity ofthe area does not allow to relate this group with a specific anthro-pogenic activity, except for when we include the striking temporalpattern in the analysis. In general, the seismicity occurs at the centreof the observation wells, producing well sampled ray paths, and weare thus confident in the event locations. This is also confirmed bythe various quality control analyses performed in Castellanos & Vander Baan (2013) to scrutinize traveltime picks and event locations.
We postulate that the locations of the microseismic events centredpredominantly around shaft 1 and the centre of the tunnels can beexplained by a favourable stress state caused by the hoop stressesaround these openings. This is similar to the case study presentedby Husen et al. (2013), where earthquake clusters occur close totunnels levels due to stress redistribution. A major difference is thatthe observed clusters show a striking trend similar to pre-existingfaults, whereas in our case study there is no evidence of faultingbut the close proximity of the hypocentres to the main tunnels andmain shaft provides an important criterion to consider dynamictriggering of events. However, the absence of seismicity around thesecond air shaft implies that the magnitude of the hoop stresses isnot sufficient to statically trigger seismicity. Thus, a likely dynamictriggering mechanism is required.
The detected seismicity occurs almost systematically at specifictimes during the day, strongly suggesting they are caused by anthro-pogenic origins and not tectonic events. Blasting operations comefirst to mind as a dynamic triggering mechanism since their seismicamplitudes are orders of magnitude larger than those of the recordedmicroseismic events. However, the absence of seismicity after blastsimplies their dynamic (i.e. transient) stress perturbations are insuf-
ficient to overcome the Coulomb failure criterion in the area (Jaegeret al. 2007). We also exclude delayed triggering (Freed 2005) due toblasting since microseismicity resumes after different time intervalsafter the 7 am and 7 pm blasts.
Given that multiplet activity rate increases following rock re-moval, we postulate that the transportation of the excavated rockmass via the main tunnels and shaft 1 triggers most of the recordedseismicity. In other words, we come to a model where static stressesexerted on the surrounding rock mass due to the existence and cre-ation of new tunnels and shafts facilitates but are not sufficientto trigger seismicity unless additional dynamic stress variationsare present. The latter are not caused by the initially most obvi-ous explanation of blast detonations, but due to large volumes ofrock being transported to the surface via the main shaft. To putthis hypothesis into perspective, if we assume a rock density of2800 kg m−3 and an average removed volume of 100 m3, 280 000kg is being transported daily. The debris transportation creates a nettransfer of mass, which affects the in situ stresses surrounding thesenewly created opening tunnels and the main shaft. This would ex-plain (i) why the seismicity is located in that area but absent aroundthe air shaft and (ii) why most seismic activity is occurring at spe-cific hours and correlates with days of rock removal. Noticeably,the correspondence between seismicity and debris transportation isnot one-to-one, for example, we observe on January 12th there isseismicity but no rock removal associated, which do not follow ourmodel but indicates that the work and vibrations exerted by the liftengines may play a role to trigger dynamic stress variations so theireffects should not be overlooked.
This case study provides a clear example that the transportationof debris, which has historically been considered not relevant as atriggering mechanism, can play a significant role during dynamicstress transfer and act as a major initiator of the seismicity in miningexploration settings. Finally, it also favours the condition that apre-existent, near critical, stress state must exist to dynamicallytrigger seismicity due to anthropogenic or natural processes.
by guest on May 30, 2015
http://gji.oxfordjournals.org/D
ownloaded from

736 F. Castellanos and M. Van der Baan
6 C O N C LU S I O N S
Multiplet event relocations determined using a slightly modifiedversion of the double-difference method indicate that seismicityoccurs spatially in the centre of a tunnel network, close to the mainshaft. No seismicity is detected near a second air shaft despitethat area is well covered by receivers in surrounding observationwells. Contrary to initial notions, their time of occurrence correlatewith scheduled rock removal (68 per cent) and not with blastingoperations.
This confirms that two conditions must be met to explain thespatial and temporal occurrence of microseismicity: (i) a favourablestress state must exist, here caused by the hoop stresses exerted bythe tunnels and both shafts. In this case, evidenced by the seismicitylocated above/below the main tunnels and around the main shaft and(ii) a dynamic triggering mechanism must be present to induce localfailure. Such a failure mechanism may be counterintuitive. In thiscase, transient stress changes due to blasting are not sufficient, butlocal rock removal, possibly coupled with the vibrations from liftengines are. This model may explain why the seismicity is locatedonly around the main shaft. These results point to the necessity ofmore investigations with respect to uncommon causes of seismicityfor enhanced forecasting of possible damage and collapse zones asa result of routine mining activities.
A C K N OW L E D G E M E N T S
We want to thank the Microseismic Industry Consortium for fundingand an anonymous company for permission to use and show the data,and two anonymous reviewers for their comments and suggestions.
R E F E R E N C E S
Abdul-Wahed, M.K., AlHeib, M. & Senfaute, G., 2006. Mining-inducedseismicity: seismic measurement using multiplet approach and numericalmodeling, Int. J. Coal Geol., 66, 137–147.
Adushkin, V.V., 2013. Blasting-induced seismicity in the European part ofRussia, Phys. Solid Earth, 49, 258–277.
Arrowsmith, S.J. & Eisner, L., 2006. A technique for identifying microseis-mic multiplets and application to the Valhall Field, North Sea, Geophysics,71, V31–V40.
BC Oil and Gas Commission (BCOGC), 2012. Investigation of ob-served seismicity in the Horn River Basin: British Columbia Oiland Gas Commission, Open Report. Available at: http://www.bcogc.ca/document.aspx?documentID=1270, last accessed 30 September 2014.
Billings, S.D., 1994. Simulated annealing for earthquake location, Geophys.J. Int., 118, 680–692.
Boltz, M., Pankow, K. & McCarter, M., 2013. Fine details of mining-inducedseismicity at the trail mountain coal mine using modified hypocentralrelocation techniques, Bull. seism. Soc. Am., 104, 193–203.
Cai, M. & Kaiser, P., 2005. Assessment of excavation damaged zone using amicromechanics model, Tunnell. Undergr. Space Technol., 20, 301–310.
Castellanos, F. & Van der Baan, M., 2013. Microseismic event locationsusing the double-difference algorithm, CSEG Recorder, 38, 26–37.
Davis, G., Reynolds, S. & Kluth, C., 2011. Structural Geology of Rocks andRegions, 3rd edn, pp. 193–248, John Wiley & Sons.
De Meersman, K., Kendall, J. & Van der Baan, M., 2009. The 1998 Valhallmicroseismic data set: an integrated study of relocated sources, seismicmultiplets, and S-wave splitting, Geophysics, 74, B183–B195.
Ellsworth, W., 2013. Injection-induced earthquakes, Science, 341,doi:10.1126/science.1225942.
Evans, K.C., Zappone, A., Kraft, T., Deichmann, N. & Moia, F., 2012. Asurvey of the induced seismic responses to fluid injection in geothermaland CO2 reservoirs in Europe, Geothermics, 41, 30–54.
Freed, A.M., 2005. Earthquake triggering by static, dynamic, and postseis-mic stress transfer, Ann. Rev. Earth planet. Sci., 33, 335–367.
Got, J.-L., Frechet, J. & Klein, F.W., 1994. Deep fault plane geometry inferredfrom multiplet relative relocation beneath the south flank of Kilauea,J. geophys. Res., 99, 15 375–15 386.
Holland, A., 2013. Earthquakes triggered by hydraulic fracturing in South-Central Oklahoma, Bull. seism. Soc. Am., 103, 1784–1792.
Husen, S., Kissling, E. & von Deschwanden, A., 2013. Induced seis-micity during the construction of the Gotthard Base Tunnel, Switzer-land: hypocenter locations and source mechanisms, J. Seismol., 103,63–81.
Jaeger, J.C., Cook, N.G. & Zimmerman, R.W., 2007. Fundamentals of RockMechanics, 4th edn, pp. 1–468, Blackwell Publishing.
Keranen, K.M., Savage, H.M., Abers, G.A. & Cochran, E.S., 2013. Poten-tially induced earthquakes in Oklahoma, USA: links between wastewaterinjection and the 2011 Mw5.7 earthquake sequence, Geology, 41, 699–702.
Kilb, D., Gomberg, J. & Bodin, P., 2000. Triggering of earthquake after-shocks by dynamic stresses, Nature, 408, 570–574.
Knoll, P., 1990. The fluid-induced tectonic rockburst of March 13, 1989 inthe “Werra” potash mining district of the GDR (first results), GerlandsBeitraege Zur Geophysik, 99, 239–245.
Kubacki, T., Koper, K. & Pankow, K., 2014. Triggering of earthquake af-tershocks by dynamic stresses, J. geophys. Res.: Solid Earth, 119, 4876–4889.
Llenos, A.L. & Michael, A., 2013. Modeling earthquake rate changes inOklahoma and Arkansas: possible signatures of induced seismicity, Bull.seism. Soc. Am., 103, 2850–2861.
Martin, D.C. & Young, R.P., 1993. The effect of excavation-induced seis-micity on the strength of Lac du Bonnet granite, in Paper Presented atthe 3rd International Symposium on Rockbursts and Seismicity in Mines,Kingston, Canada.
Mcclure, M., 2012. Modeling and characterization of hydraulic stimulationand induced seismicity in geothermal and shale gas reservoirs, PhD thesis,Dept. of Energy Resources Engineering, Stanford University, Stanford,California, USA.
Mcgarr, A. & Simpson, D., 1997. A broad look at induced and triggeredseismicity, in Paper Presented at the 4th International Symposium onRockbursts and Seismicity in Mines, Krakow, Poland.
Pomeroy, P., Simpson, D.W. & Sbar, M., 1976. Earthquakes triggered bysurface quarrying: the Wappinger Falls, New York sequence of June,1974, Bull. seism. Soc. Am., 66, 685–700.
Poupinet, G., Ellsworth, W.L. & Frechet, J., 1984. Monitoring velocity vari-ations in the crust using earthquake doublets: an application to the Calav-eras Fault, California, J. geophys. Res., 89, 5719–5731.
Read, R., 2004. 20 years of excavation response studies at AECL’s Under-ground Research Laboratory, Int. J. Rock Mech. Mining Sci., 41, 1251–1275.
Roche, V. & Van der Baan, M., 2015. The role of lithological layering andpore pressure on fluid-induced microseismicity, J. geophys. Res.: SolidEarth, 120(2), 923–943.
Roche, V., Homberg, C. & Rocher, M., 2013. Fault nucleation, restriction,and aspect ratio in layered sections: quantification of the strength andstiffness roles using numerical modeling, J. geophys. Res.: Solid Earth,118(8), 4446–4460.
Sambridge, M. & Kennett, B.L.N., 1986. A novel method of hypocenterlocation, Geophys. J. R. astr. Soc., 87, 679–697.
Scott, T., 2005. The effects of stress paths on acoustic velocities and 4Dseismic imaging, Leading Edge, 26, 602–608.
Segall, P., 1989. Earthquakes triggered by fluid extraction, Geology, 17,942–946.
Sleeman, R. & van Eck, T., 1999. Robust automatic P-phase picking: an on-line implementation in the analysis of broadband seismogram recordings,Phys. Earth planet. Inter., 113, 265–275.
Stein, R., 1999. The role of stress transfer in earthquake occurrence, Nature,402, 605–609.
Stein, S. & Wysession, M., 2003. Introduction to Seismology, Earthquakesand Earth Structure, pp. 1–498, Blackwell Publishing.
by guest on May 30, 2015
http://gji.oxfordjournals.org/D
ownloaded from

Microseismic dynamic triggering 737
Waldhauser, F. & Ellsworth, W., 2000. A double-difference earthquake lo-cation algorithm: method and application to the Northern Hayward Fault,California, Bull. seism. Soc. Am., 90, 1353–1368.
Wetmiller, R.J., Galley, C.J. & Plouffe, M., 1993. Post-closure seismicity ata hard-rock mine, in Paper Presented at the 3rd International Symposiumon Rockbursts and Seismicity in Mines, Kingston, Canada.
Young, P., Maxwell, S.C., Urbancic, T. & Feignier, B., 1992. Mining-induced microseismicity: monitoring and applications of imag-ing and source mechanism techniques, Pure appl. Geophys., 139,697–719.
Young, P., Collins, D.S., Reyes-Montes, J.M. & Baker, C., 2004. Quantifica-tion and interpretation of seismicity, Int. J. Rock Mech. Mining Sci., 41,1317–1327.
Zoback, M., 2007. Reservoir Geomechanics, pp. 169–181, Cambridge Univ.Press.
Zoback, M. & Gorelick, S., 2012. Earthquake triggering and large-scalegeologic storage of carbon dioxide, in Paper Presented at the Na-tional Academy of Sciences of the United States of America, Krakow,Poland, Vol. 109, pp. 10 164–10 168. Available at: http://www.pnas.org/content/109/26/10164.short, last accessed 2 May 2015.
by guest on May 30, 2015
http://gji.oxfordjournals.org/D
ownloaded from