dynamics and definition of poverty in the colombian...
TRANSCRIPT

Dynamics and Definition of Poverty in the Colombian Andes: Participative vs. Objective approaches
Alexandra Peralta, a, James A. García C. b, Nancy Johnson, c * ∗*
a and c from the Challenge Program for Water and Food CPWF - International
Center of Tropical Agriculture CIAT.
b from International Center of Tropical Agriculture CIAT.
Abstract
The objective of this study is to examine the consistency of results of a
participatory poverty assessment methodology applied in two Colombian
watersheds with those from more objective approaches. The results suggest
that there is a set of elements that are considered basic to both types of poverty
assessment; however at the same time there are others that depend on
household and community preferences. Moreover, the results indicate that the
concept of poverty is context-specific: a household that is considered poor in
one community may not be considered poor in another. The results of the
participatory methodology are useful to identify who the poor are, why they are
poor, and provide a better understanding of the nature and dynamics of poverty.
However, it may not be appropriate to generalize on the basis of the results of
such methodologies since they may differ in both nature and magnitude from
the results off objective poverty measurements.
∗ Alexandra Peralta, “Challenge Program for Water and Food” CPWF Theme 2 “Water and People in Catchments” Assistant Coordinator – Internacional Center for Tropical Agriculture CIAT. Cali, Colombia. Email: [email protected] James A. García, International Center for Tropical Agriculture CIAT, Reserch Assosiate, Spatial and Economic Analysis for Policy and Decision Support Project. Email: [email protected] Nancy Johnson, “Challenge Program for Water and Food” CPWF Theme 2 “Water and People in Catchments” Coordinator – Internacional Center for Tropical Agriculture CIAT Researcher. Cali, Colombia. Email: [email protected] Mailing address: AA. 67-13 Cali, Colombia. The results presented in this article are part of the project “Sustaining inclusive collective action that links across economic and ecological scales in upper watersheds (SCALES)” funded by the CPWF. **Thanks to Marcela Quintero, Sara Granados and Jorge E Rubiano and to the evaluators of this article, for their contributions to this article. Additionally, we thank the project team: Adriana Moreno, Sara Granados, Luis Felipe Botero, Harvey Rodriquez and Jorge A. Rubiano.
1
Keywords: Poverty, Rural Analysis, Participatory Methods, Colombia.
Introduction
Although reduce poverty is one of the major challenges of the MDGs, we still
don’t have the necessary clarity about what it actually is. Standard definitions
exist – US1 or US$2 per day, unsatisfied basic needs (NBI), life conditions
index (ICV) etc, however it is widely recognized that poverty is complex and
includes material and non-material dimensions. Participatory methods have
been developed to allow local perceptions to be included in definitions of
poverty. These methods, usually applied at the local scale, provide a level of
details that goes beyond the objective quantitative measures to show the
dynamics of poverty. Therefore, they can be very useful in the design of
interventions to reduce the problems of exclusion and poverty.
However, because they are based on local perceptions, the results of
participatory assessments from different places are not necessarily comparable,
and therefore it may not be appropriate to use information from such
assessments to design regional interventions. Similarly, the generalization of
conclusions based on the local results is not necessarily appropriate.
This document validates the internal and external consistency of the data on
poverty obtained using a participatory method based on local community
perceptions for two watersheds in the Colombian Andes. The principal research
questions are:
Are the definitions and results obtained consistent with objective measures of
poverty?
Are the results consistent with the condition of the study communities?
The results seek to contribute to a better understanding not only of what poverty
is, but also of how to use and interpret different types of poverty data. Of
2

particular interest is to identify the conditions under which different types of
information do or do not give consistent results.
The article is organized as follows: Section 2 summarized some of the issues in
different types of poverty measurements, and presents the methods used in
Colombia. Section 3 describes the study watersheds, and section 4 presents
the findings of the poverty analysis and examines the community level data on
which these findings were constructed, specifically the community level
definitions of poverty and poverty lines. Section 5 summarizes and concludes.
2. Empirical aspects and measurements of poverty in Colombia. 2.1 Objective and subjective approaches of poverty, used methods, advantages and disadvantages.
Poverty is a multidimensional phenomena; the variety of existing concepts is an
illustration of this. Poverty dog be conceived ace objective or subjective; ace the
necessity of good feeding, or the preferences for certain type of foods
independently of their nutritious valued; absolute or relative, the lack of income
or of capacities; chronic or temporary, ace consequence of structural or juncture
problems in an economy. Finally, poverty could be related to inequality,
vulnerability and exclusion in a society. These different concepts that refer to
poverty determine the way it is measured, as well as the policies and programs
to alleviate it (Lok-Dessallien, 1995).
Objective approaches of poverty, define it from the perspective of a group of
normative criteria that determine what is required to overcome poverty.
Generally, the measurements of poverty with this approach privilege the
measurements of quantitative character, simpler to use and to compare. The
subjective approaches of poverty consider individual preferences and people’s
valuation of goods and services. Subjective measurements use mainly
qualitative data that describe the intrinsic characteristics of what is being
measured, although it is required to translate them into quantitative data to be
able to aggregate them (Lok-Dessallien, 1995).
3
Subjective and objective measurements of poverty can be monetary and non
monetary, in turn, the latter can be absolutely or relatively measured (See
graphic 1). Next a description is made of the characteristics, advantages and
disadvantages of the commonly used methodologies for the study of poverty.
For this purpose the methodologies of measurement of poverty developed by
the Mission for the Design of a Strategy for the Reduction of Poverty and
Inequality, were revised, MDERPD (2006).
Graph 1. Diverse Measurements of Poverty
Source: MERPD, 2006
Indicators of subsistence used in the international context as U$1 a day for
indigence and U$2 a day for poverty in purchasing power parity (PPP) for
Colombia "although somehow illustrative for effects of international
comparisons, they are not conceptually bound to the idea of poverty as a lack of
basic necessities, this is because the values of the poverty line do not represent
a specific basket of goods and services that a society considers indispensable
to live a worthy life, according to its culture, geographical conditions and
socioeconomic level. Also, clearly, one or two dollars PPP is not enough to
cover the necessities that a country of medium income as Colombia could
consider as basic" (MDERPD, 2006, p. 21).1
The measurement of absolute poverty used is the Poverty Line, which is
calculated based on the value of a representative basket of goods: foods,
clothing, transport, etc., for a population of reference that corresponds to the
poorest 25%. The value of the basket determines how many people are below
the poverty line, according with the basket of minimum requirements. The
values of the indicator change as the methodology or the used sources of
information are modified (MDERPD, 2006).
1 1 In 2004 U$1 a day PPA was equivalent to $24.137 colombian pesos a month, while U$2 a day PPA to $48.274 colombian pesos a month (MDERPD, 2006, p.20), the minimum legal monthly salary per for that year in Colombia was XXX.
4
The most used non-monetary objective indicators are the Human Development
Index (HDI), the Unsatisfied Basic Necessities Index (NBI), the Conditions of
Life Index (ICV) and the SISBEN that won't be approached because of its
similarity with the ICV.
The HDI is not precisely an indicator of poverty; it includes the life expectancy
index when being born, a compound education index and the per capita income
index. The concept of human development is wider and more complex than
what this index is able to measure, because it only incorporates three variables
out of the multiplicity of elements of human development. For example,
participation in the Human Development Report 2004 can be highlighted as an
important part of the development, however this variable is not included in the
HDI (MDERPD, 2006).
"The Indicator of Unsatisfied Basic Necessities NBI is sometimes qualified as an
alternative measurement of poverty; it considers as poor those households or
people that have at least one unsatisfied necessity out of the five defined
(poverty for NBI) and as in misery those households or people that have at least
two unsatisfied necessities (misery for NBI)" (MDERPD, 2006, p. 15). The
criteria are: inadequate housing, housing without services, overcrowding in a
household, nonattendance of school and high economic dependence. The NBI
is able allows to determine what type of lack, of those included in its
components, is the one that the households located in a certain place suffer the
most. However, it hides the magnitude of the number of people in situation of
poverty and misery, since the analysis unit that it uses is the household, without
considering the number of people that compose it. Additionally, important
necessities of the society are not included, nutrition, for example, which is not
included in the NBI (MDERPD, 2006).
Finally, the ICV, developed by the Social Mission of the National Department of
Planning (DNP) "tries to give a more integrated and more informative reach to
the satisfaction of basic needs and quality of life than the NBI." (MDERPD,
2006, p. 17) It incorporates indicators of physical goods, present and potential
human capital, and composition of the household: each variable included in
5

these indicators has an assigned weight. The ICV is an indicator that is not
used to determine which homes are poor and which are not, but allows to make
comparisons in a given moment and place; however, the weights that it assigns
to the variables contradict what the society could consider as desirable; for
example, for gathering of garbage it assigns a score of 2,59 to a person who
throws it to a river and 1,59 to a person who burns or buries it (MDERPD,
2006).
The subjective measurements of poverty that are used in Colombia are
obtained from the answers to the questions of The Survey of Quality of Life
(ECV) about the poverty perception of the households. The following is a
sample of such questions 1. Do you consider yourself poor?, 2. Presently, how
the life conditions of your household are?, 3. What do you consider should be
the monthly minimum income that your household requires to satisfy its
necessities appropriately? 4. What would be an income that you could qualify
as excellent? Bad? These questions are not very clear about what is being
referred to when speaking of poor in 1, of life conditions in 2 or of minimum
income required by the household in 3. For that reason the results are not the
most appropriate to determine strategies for programs of poverty relief. For
example, in accordance with the calculations of the MERPD based on the
question 1, ECV 2003, 36% of the households in the quintile 5 in urban areas
are considered poor (MDERPD, 2006).
Participatory methodologies exist to generate profiles of poverty based on the
local perceptions of the communities; this has been employed in Colombia and
in other developing countries. For the World Development Report 2000/2001,
experiences of qualitative participatory studies on poverty carried out in 50
countries were gathered, and a comparative study of 23 countries was made,
with the objective of including the perceptions of the poor in politic proposals for
poverty reduction. As a result of this investigation the World Bank published a
methodological guide to elaborate participatory profiles of well-being that are
elaborated in work groups, with representative members of the communities.
6

For Colombia, we have the development of regional profiles of poverty
elaborated by Ranvborg (1999) to determine the levels of well being of the
households of a certain community. The different levels of well-being are built in
workshops where representative members are summoned; in this way the
average levels of well-being are found to classify the households of the
community2.
In this study the methodology of Krishna was applied (2002). This methodology
builds qualitative poverty lines, by means of the participatory definition of stages
of progress with the communities. The objective is to determine in what stage
were the households 25 years ago and at the moment. With this, it is possible to
tell how poverty dynamics have been and to explore what the causes of the
presented changes are. It has been applied in India, Kenya, Uganda, Peru and
United States (Krishna, 2004a, Krishna et to the, 2004b, Krishna et to the,
2004c, Krishna et to the, 2005ª, Krishna et to the, 2005b and Krishna et to the,
2006).
This methodology arises with the purpose of understanding the poverty
dynamics at a disaggregated level, in the communities and the households. In
some developing countries, although the economic growth was stagnated
during the last decades, there were dynamics that led the poor to improve or to
worsen their situation. The knowledge of how some people escaped from
poverty can be useful to help those who have not achieved it. (Krishna, 2004a,
Krishna et al, 2004b). 3
The commonly used objective measurements of poverty apply a series of
normative criteria to determine what the best for people is. The studies carried
out based on this information, generally use countries as measurement unit,
and require the readiness of data gathered in different periods of time, as well
as to have information in different moments that has to be comparable and
complete. If the information doesn't fulfill these requirements the studies will
throw questionable results or they simply would not be carried out. Additionally,
2 For more detailed information go to: http://www1.worldbank.org/prem/poverty/voices/index.htm3 For more detailed information go to: http://www.pubpol.duke.edu/krishna/index.html
7

this type of studies lack elements that allow understanding of people
perceptions about poverty and the strategies that are developed to confront it,
they are expensive and require time to have series of traverse data to use. For
all the exposed reasons, Krishna outlines this methodology as an alternative
(Krishna, 2004a, Krishna et to the, 2004b).
2.2 Stages of Progress Methodology and Poverty Line.
The stages of progress methodology were applied in 23 communities (veredas)
of the municipalities of the Fúquene Lake Wastershed (CLF) in Cundinamarca
and in the Coello River Watershed (CRC) in Tolima, between March and July of
2005. The places were selected in conversations with the mayors of the
municipalities and based on the information of the indicators of the municipal
Outlines of Territorial Classification (EOT). Poor settlements with water births,
near páramo and in hillside areas were chosen. In the workshops 886
households participated in the CLF and 175 in the CRC; due to the problems of
public order in CRC was not possible to have a bigger participation in the
exercises. This is not a representative sample from the statistical point of view,
but it is representative of the rural settlements in the area.
Previous to the workshops, a conceptual agreement was carried out on what
would be understood for community and household. Community is considered a
compound group between 25 and 60 household in a settlement, with similar
geographical and environmental conditions as well as similar access to
markets, where the household know each other and have remained at least
during the last 25 years in the community. Home, is considered the group of
people that share food "of the same pot or kitchen."
Additionally, it was carried out an initial visit from the team of investigators to the
veredas (from now referred as communities), as well as discussions with the
local officials and other key informants as presidents of meetings of communal
action and community leaders. A description of the characteristics of the
communities was made, which included history, socioeconomic characteristics,
infrastructure and migratory movements of households. In the cases where
8

more than 25% of population was immigrant, the work in that community was
not carried out. Next the steps that were taken in this study are described
(Team of the project Escalas CPWF, 2005a).
I. To Summon a representative group: A representative group was summoned
in each community, including members of different households, members of the
poorest households and those that were not land owners or who were not
entitled to exploit it. It was invited people that were 50 years old or older and
had been living for more than 25 years in the community, and youths born in the
community; also, some representatives of the local authorities were invited. It
was important for the study to have gender representativeness in the groups,
trying to have an equal distribution between men and women.
II. To explain the objectives: The members of the investigation team and the
involved institutions were introduced to the communities; they explained the
objectives and the process of information gathering. It was cleared up that it
was a merely scientific exercise, with the purpose of avoiding false expectations
among the participants. It was also explained with clarity how long it would take
the workshop, with the purpose of getting the people to stay until the end of the
process.
III. To define collectively stages of progress and to determine the poverty
lines: a common understanding was achieved of the concepts of poverty inside
each community and of what it meant to be considered as poor. To establish an
atmosphere without prejudices, alternative words were used to qualify poverty.
The following questions were asked in each community: What does an
extremely poor household when some money comes? What are their first
expenses? And if a little more money comes, In what do they spend it? And
later, What would be the third expense?, The fourth?, and so forth. This way,
people defined the stages without referring to the money, for example, asking,
"if that poor family was a little better or if a stable work was obtained, How
would it be? What material or non-material things would it have that the poorest
don’t? The stages were described as specifically as possible for the participants
9

of the workshops, for example education should be elementary school or high
school; for the housing it was specified the size and the material.
Based on this information the poverty lines were described in each community.
In each case it was asked, "in what stage would a houehold stop being
considered poor? ". This line was identified by means of progressive questions,
"if a home has food but doesn’t have clothes, does it continue being poor? "
until establishing a consent among the participants.
IV. To identify events that happened 25 years ago, and to determine the
current situation and the situation 25 years ago: Clarity was made among the
community about what is meant by 25 years, by means of significant events in
the history that all can easily identified. Three events were referred: the
earthquake of Popayán in 1983; Armero's tragedy 1985; the taking of the
palace of Justice 1985. This horizon of time is chosen, since it allows seeing the
changes happened in a generation. In each community the participants of the
workshop evaluated the listing of households of their community and
determined the stage where they were 25 years ago. Also, the stage of
progress in which the households are at the moment was established.
V. To group households in four categories and to choose a random sample of
households in each category. Using the results of the previous step, each home
was located in one of five groups:
Category A. Households that have remained poor (that have been below
the poverty line in every period) during the last 25 years.
Category B. Households that have escaped from poverty (they have
been below the poverty line the last 25 years and at the moment they are
above it).
Category C. Households that have fallen into poverty (they have been
above the poverty line the last 25 years and at the moment they are
below it).
Category D. Households that have remained non poor (that have been
above the poverty line in every period).
10

Category E. Households who were not 10 or 25 years ago in the
community (category E)
The following steps to the classification consisted on investigating in the
workshops the causes for some homes to escape or to fall into poverty.
Likewise visits to those homes were carried out to deepen about the causes.
Because this information won't be used for this article, we won't go into detail
about these two final steps.
3. Description of the Studied Sites.
The methodology stages of progress was applied in 13 communities of 6
municipalities of Cundinamarca department that are part of the Fuquene Lake
Watershed (CLF) and in 10 communities of 5 municipalities of the Tolima
department, in the Coello River Watershed (CRC) (See chart 1).
Chart 1. Departments, Municipalities and Communities where the Stages of
Progress Methodology was applied.
Fuquene Lake Watershed.
Fúquene Lake watershed is located in the Colombian Andes, in the Valley of
Ubaté and Chiquinquirá, at 2.543 meters above sea level (See map 1). Its
influence area includes 17 municipalities of the departments of Cundinamarca
and Boyacá. The population of the municipalities of the watershed in 2005 was
of 232.416 people, 59% inhabitants of the rural area of the basin (DANE
population projections). The Conditions of Life index - ICV - for 2003 (Sarmiento
et al, 2006) varies among levels that go from low to high for these
municipalities. The percentage of households with NBI for 2002 varies between
6,73% and 46,63%, which evidences the heterogeneity under the life conditions
that are characteristic of the Andean basins. Additionally, the land distribution of
in the rural area of the watershed is inequitable; the gini index average of rural
property for 2002 is 0,59.
11

There are legality problems of property in the studied communities. Also, in
accordance with the information found in the outlines of territorial classification
(EOT) of the municipalities, the communities have unemployment rates that end
up reaching percentages higher than 70%. Due to the lack of employment in the
area, migration is presented to the near important urban centers. The
population's educational levels are low (Team Project Scales - CPWF, 2005b).
Map 1. Localization of the Fúquene Lake Watershed.
Source: Ramírez and Cisneros, 2006.
The main economic activities of the region are cattle rising, agriculture and
mining. As for the agricultural activity, the most important crops are the potato,
the wheat, the pea and the corn.
The cattle’s rising is the most important economic activity, mainly for the
production of milk; this area produces a high proportion of the offer of milk at
national level. The agricultural activity has a quite strong environmental impact
because the areas of cultivation are being extended towards areas of steep
slope, increasing soil loss, causing the burnt of the páramo and the
deforestation of the Andean forests. Finally, the mining exploitation consists on
the extraction of coal, stone and sand as construction material; this also
generates negative environmental impacts related to the water and air
contamination (Team Project Escalas, 2005b, Ramírez and Cisneros, 2006).
In the communties, there are also farmers that practice the agriculture very little
and are devoted to the work outside their properties due to the high production
costs and to the advanced process of soil deterioration. Other farmers have
livestock for milk production, either for self-consumption or for sale to
companies that gather milk. Also, there are sheep livestock and vegetables are
cultivated in family vegetable gardens as support to the alimentary security of
the household. In some areas the acacia plantations and eucalyptus were
promoted by the Regional Autonomous Corporation (CAR), with the purpose of
stopping the erosion mainly in the hillside areas (Team Project Scales - CPWF,
2005b).
12

The rent of the land is common in the high areas, and is used for potato's
production. As for the access to the education and the medical service, in
occasions it is necessary to move to other settlements or near urban centers.
The access and quality of the public services is faulty, especially the aqueduct
service, although it is not always problematic (Team Project Scales -CPWF,
2005b).
This is a very important watershed because of its biophysical and
socioeconomic characteristics that make it representative of the basins of the
Andes, the environmental problems, the disparities between the offer and the
demand of water, the topography of the land, and the inequalities in the
distribution of the resources and the social conflicts. The results of the analyses
of this basin can be compared to others that are obtained in similar Andean
basins.
Coello River Watershed
The Coello River Watershed is located in the north center region of the Tolima
department, in the oriental slope of the Central mountain range; it includes an
important portion of Tolima (see map 2). The total number of inhabitants of the
area in 2005 (projections DANE), was of 622.395 people, 16% inhabitants of
the rural area (including Ibagué). Most of the municipalities of the CRC have
high population percentages in the urban areas (above 56%). The indexes of
life conditions range between medium high, medium and medium low levels; the
levels of health covering range between medium low and medium; and the
average years of education range between medium low and high, this last level
is found in Ibagué (the department’s capital), while in the other municipalities,
there are coverage problems and of access to the educational centers, as much
at level of elementary school as of high school (Sarmiento et al, 2006).
Map 2. Localization of the Coello River Watershed.
Source: Project Scales - CPWF.
13
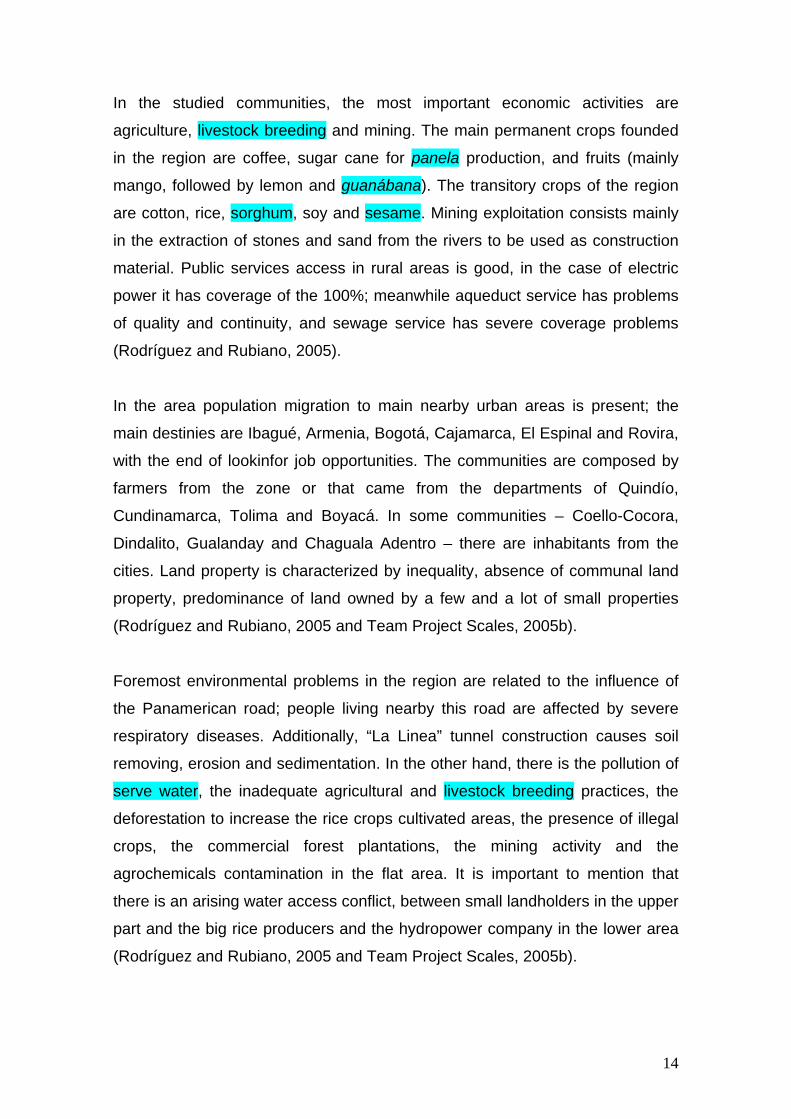
In the studied communities, the most important economic activities are
agriculture, livestock breeding and mining. The main permanent crops founded
in the region are coffee, sugar cane for panela production, and fruits (mainly
mango, followed by lemon and guanábana). The transitory crops of the region
are cotton, rice, sorghum, soy and sesame. Mining exploitation consists mainly
in the extraction of stones and sand from the rivers to be used as construction
material. Public services access in rural areas is good, in the case of electric
power it has coverage of the 100%; meanwhile aqueduct service has problems
of quality and continuity, and sewage service has severe coverage problems
(Rodríguez and Rubiano, 2005).
In the area population migration to main nearby urban areas is present; the
main destinies are Ibagué, Armenia, Bogotá, Cajamarca, El Espinal and Rovira,
with the end of lookinfor job opportunities. The communities are composed by
farmers from the zone or that came from the departments of Quindío,
Cundinamarca, Tolima and Boyacá. In some communities – Coello-Cocora,
Dindalito, Gualanday and Chaguala Adentro – there are inhabitants from the
cities. Land property is characterized by inequality, absence of communal land
property, predominance of land owned by a few and a lot of small properties
(Rodríguez and Rubiano, 2005 and Team Project Scales, 2005b).
Foremost environmental problems in the region are related to the influence of
the Panamerican road; people living nearby this road are affected by severe
respiratory diseases. Additionally, “La Linea” tunnel construction causes soil
removing, erosion and sedimentation. In the other hand, there is the pollution of
serve water, the inadequate agricultural and livestock breeding practices, the
deforestation to increase the rice crops cultivated areas, the presence of illegal
crops, the commercial forest plantations, the mining activity and the
agrochemicals contamination in the flat area. It is important to mention that
there is an arising water access conflict, between small landholders in the upper
part and the big rice producers and the hydropower company in the lower area
(Rodríguez and Rubiano, 2005 and Team Project Scales, 2005b).
14

4. Results 4.1 Results of the application of the methodology of Progress Stages
The results of applying the methodology of stages of progress in the studied
communities show the perception of the households regarding their situation in
2005 and how this evolved during the last 25 years (see chart 2). The sum of
the columns A and C indicates what the percentage of poor households at the
moment is, while the sum of B and D indicates the percentage of non-poor. At
the present time 45% of the households in CLF is poor, where the most critical
cases are found in Ladera Grande, Centro y Guata and Chapala, where the
poor households represent 83%, 90% and 83% respectively. While in CRC only
13% is poor, compared to 84% of non-poor. The situation of the 10 communities
of this watershed shows that between 55% and 100% of the households are
non-poor.
Chart 2. Methodology. Basins of the Lagoon of Fúquene and of the River
Coello. 2005.
Source: Project Escalas CPWF.
The results of the categories A and B show how the evolution of the situation of
poverty of the households in the last 25 years has been. In CLF, 42% of the
population continue being poor and 30% was poor before and is not poor now;
in this case we saw extreme and intermediate cases in the studied
communities. For Ladera Grande, Centro and Guata, and Chapala stagnation
has occurred, presenting between 66% and 90% of households that have
always been poor. In contrast, Peñas de Cajón and Apartadero have 61% and
70% of households that stopped to be poor. In CRC only 11% of the
households continue being poor and 59% have been able to overcome this
situation, which implies an important advance. More than 50% of the
households of 9 of the 13 communities improved their situation, standing out the
communities Potrerillo, El Rosal and La Ocera with more than 70%.
15
The variability that we find in the results obtained for the communities, regarding
the existent levels of poverty, contrasts with the ICV for the municipalities in
question. For the CLF, where there were cases of higher poverty, the levels of
ICV that prevailed were medium, while for the CRC, with a smaller poverty
incidence per community and where a bigger progress has existed, there were
municipalities that presented a medium high ICV4. Some particular cases call
the attention, like the one of Chapala in the CLF, where most of the population
is considered poor, while the NBI, 6,73 for Cucunubá (municipality where the
community of Chapala is located) in 2002 indicates the opposite. However,
these comparisons are not conclusive, because the information is not
disaggregated for urban and rural areas.
It is important to keep in mind that these results depend on the defined poverty
line for each community. They can differ, which marks distinctions when
comparing the data again. It is possible that the household that is considered
poor in a community, in accordance with their poverty line, could be above it in
another community. It is then when we proceed to analyze the poverty lines of
the communities, the elements they include, the number of stages that should
be overcome and the level of difficulty that implies to stop being poor under
these approaches.
Before continuing, it is important to mention the utility of this type of information,
obtained by means of participatory methodologies, compared to the indicators
calculated by the state official organisms, since they allow to have information
of the current and precedent conditions of life of the studied areas in an
opportune way. In the case of the rural areas a bigger difficulty is presented to
obtain the information for each municipality, because the sampling processes
used by the organisms in charge of the information gathering take time and are
expensive; in addition, it is calculated from samples that are not representative
when disaggregating the information to obtain indicators at urban and rural
level, for departments and municipalities.
4 The ICV for Cundinamarca is 76,6, while for Tolima is 73,4 in 2003.
16
4.2 Definition and variability of the stages.
For each of the communities the stages of progress were defined in a
participatory way and the poverty lines were set with the methodology explained
previously. It was found that for the different communities of the municipalities
where the methodology was applied, between 7 and 24 stages in total were
defined, where in turn, it is considered that it would be necessary to overcome
from 3 up to 10 stages for a household to overcome poverty. Also, if we observe
the stages of progress of communities in the same municipality, it is found that
differences exist in some stages and in the poverty line. This is evident for the
municipalities of Sutatausa, Guacheta, Fúquene, Cajamarca, Ibagué and
Coello, where the methodology was applied in more than one community (See
Chart 3).
Chart 3. Number of Total Stages that define the Poverty Line per Community
Source: Project Scales, CPWF
In principle, one can affirm that differences exist in the definition of poverty line
among the communities. The information of the number of stages fixed by the
communities, has to be analyzed from the point of view of the elements that are
mentioned with more frequency and that are considered as the most important,
based on the order in which the definitions of the progress stages appear.
With the purpose of analyzing the information, it was made a general
classification of the different elements mentioned in 14 comparable categories.
With the information this way classified, it was calculated, for each one of the
categories, the total frequency of mention and the distribution of these mentions
in the different levels or stages. Assuming that the relative importance falls as
the level of the stage where a category is mentioned rises, weights or falling
scores were assigned through the distribution, with the purpose of calculating,
for each category, a value of total score expressed as the addition of the
product frequency per score. The obtained total score, divided by the maximum
possible score for a category, if it is always mentioned in all the communities of
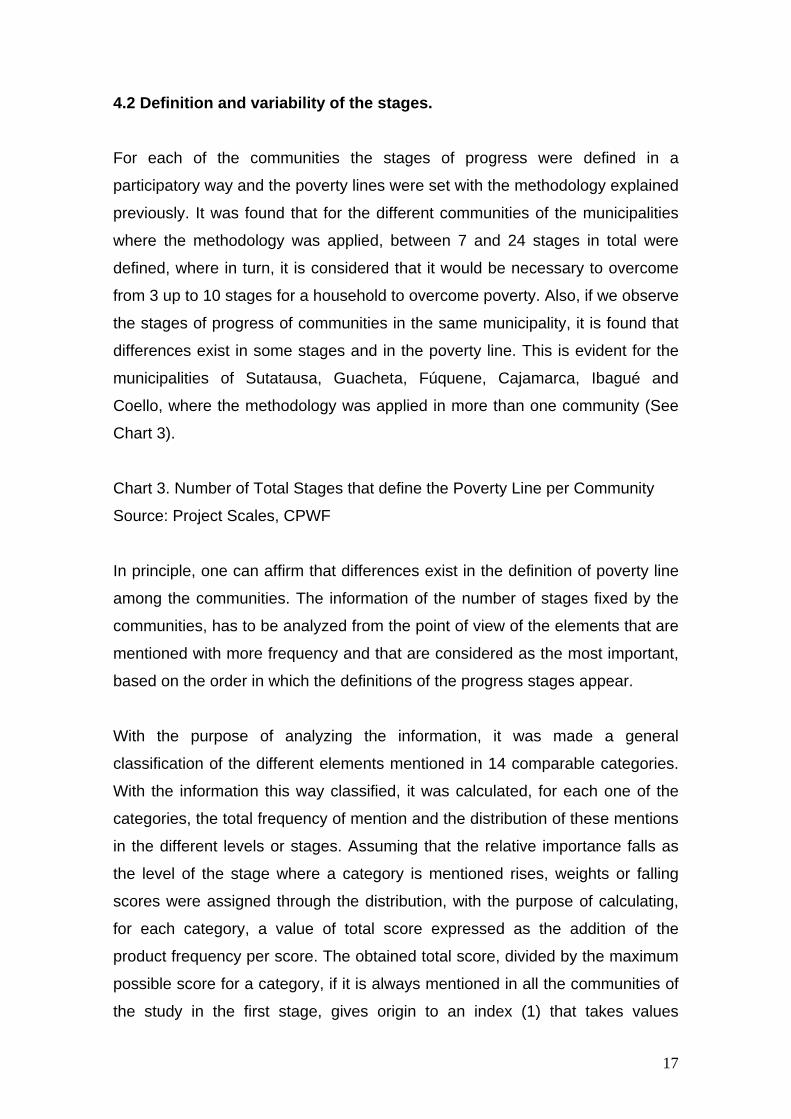
the study in the first stage, gives origin to an index (1) that takes values
17
between 0 and 1. This way it was possible to order the categories by frequency
and grade of importance (See chart 4).
(1)
Max
jji WN
WfI
**∑= (1)
Where:
fj = Number of mentions of a category in the level "j."
Wj = Weight or assigned score at the level "j."
N = Number of settlements considered in the study.
WMax = Value of weight or assigned score at the level 1.
Chart 4. Categories of Poverty Line, in order of importance and frequency of
times that it was mentioned.
Source: Own calculations based on the information of the Project Scales
CPWF.
The index measures the weight or relative grade of importance of each
category, according to the position that was given in the stages that are
required to overcome poverty. With the information of the index, one can
deduce how difficult it can be to stop being poor in a specific community,
according to the accumulated sum of the relative weights of the considered
stages, for each community. In the graph 2 is shown how those "more
demanding" communities, in terms of the number and relative weight of the
stages included in the poverty line, are those that in turn determined a bigger
number of stages to overcome.
By means of this information, the dynamics of the poverty can be analyzed, for
the communities where there were a high percentage of households that
continued being poor after 25 years. In the CLF, the households of Chapala,
and of Centro y Guata, should overcome 10 and 8 stages respectively. In
Chapala the initial stages imply access to the secondary education, lot/land and
housing with walls, roof and bathroom; in Centro y Guata it consists on
18

improving crops by means of reservoir construction; in La Puntica the poverty
line is above 8 stages, where the seventh consists on entertainment by means
of the realization of trips. The stages to be overcome are many and imply to
have the capacity to make investments for the acquisition and improvement of
the land or the housing, access to the secondary education or for entertainment.
In the settlements where a high percentage of the households stopped being
poor, we meet with Peñas de Cajón, Apartadero, Potrerillo and La Ocera, where
there should be overcome between 3 and 5 stages including Food, Education,
Clothing, Health, Small Animals, Housing (improvements), Land (lot/land in
company) and Crops (in company). So much the number of stages as their
complexity to be reached are smaller than the ones of the communities in the
previous paragraph. That is to say, if the households that are considered as
poor like Centro y Guata and Chapala moved to some of the settlements
mentioned here, they would stop to be considered as poor when being
confronted under a "less demanding" measurement pattern.
In Chapala, the inclusion of high school education in the poverty line can be
explained by the fact that in this area adult population prevails. In accordance
with the interviews carried out in these communities, the young population's
migration has been common and in cases like Chapala few homes have kids
younger than 12 years old. In this settlement, in La Puntica and in Centro y
Guata, the agriculture is not practiced as a productive activity, but for self-
consumption, the population is devoted in its majority to the mining of coal
(Chapala) or has emigrated (mainly the youths) to be devoted to this activity.
The mining could have influenced the perceptions of the inhabitants of the
communities, so that they consider the entertainment and the possession of
appliances (like in Chapala) inside the poverty line.
In Peñas de Cajon and Chapala, most of their inhabitants are devoted to the
mining of coal. Although the salaries of the mining are good (up to $1.500.000
current of 2005), it is not clear why in this case the poverty line includes fewer
elements. On the contrary, in Apartadero, Potrerillo and La Ocera, most of the
families are devoted to the agricultural and cattle activity, where elements like
19

land and crops appear in contrast to the elements included by the inhabitants of
the communities where mining activity prevails.
The definition of the poverty lines is obtained based on local perceptions, which
depend on social, economic and cultural factors that seem quite relative. With
the objective of understanding the variability in the definitions of the poverty line
in the communities, the methodology of analysis of multiple correspondence
was used, which determined the most (or least) common categories in the
definitions of poverty line in the communities: Services, Food, Education, and
Housing the most common; and Savings/Investment and Other the least
common ones. These last categories were eliminated due to their low power to
discriminate. Then, the analysis was made with the rest of categories to
generate the first two main components (or dimensions) that were used in an
analysis of conglomerates that allowed conforming "clusters" or groups of near
settlements according to the elements that conform the line poverty defined in
each case.
The result of the analysis can be observed in the Graph 3. where four groups
are distinguished. The poverty lines in each of them have the common trait of
including one or more variables that have not been considered by the others:
The group 1 includes land and appliances; the group 2 small animals and
clothing; the 3 vehicles and recreation and the 4 crops. A pattern doesn't exist
for department, watershed or municipality. In the comminities of the group 1 in
contrast with the group 3, the small properties prevail, which can explain the
inclusion of the element land as important, while in the 3, the cattle raising for
the production of milk and the big properties are the characteristics of the
region.
Graph 3. Cluster of communities based on the elements of the Poverty Line of
each community.
Source: Project Scales CPWF
The poverty lines in all the communities include in their definitions basic
elements (food, education, housing, public services). Once the poverty line is
20
overcome, they tend to improve in access, quality and quantity. But there are
others that make the definitions of the poverty line to be different among the
communities, which for some is considered as a primordial element, for other it
is not it, which is evident in the conformation of the 4 groups.
Although there aren’t enough elements to determine the reason for the inclusion
of the identified elements in each group, it is probable for the productive
activities that are the most important sources of income, the land holding and
some institutional factors, to influence the perceptions of people. For the
settlements of the group 2, the main source of its inhabitants' income is the
work outside of the own property, most work for a daily salary in construction
activities, tourism or in the flowers crops. For the self-consumption at home
level, the cattle activity prevails more than the agriculture. In the case of the
group 4, in the communities the agriculture is the most important source of
income, which could explain the presence of crops as an element of the poverty
line.
So much in the communities of the group 2 as in those of the group 4, we met
with participation in cooperative activities and with active participation of women
in programs of rural families of the Colombian Institute of Family Well-being,
ICBF, but this doesn't explain the reason of the inclusion of elements as small
animals, clothing and crops. In the group 1, the land holding features small
properties, while in the group 3, there are big properties in hands of few, which
could explain why the group 1 includes land, but not why it doesn't appear in the
group 3.
If we compare the chart 5, with the results obtained with the studies in other
countries ((Krishna, 2004a, Krishna et al, 2004b, Krishna et al, 2004c, Krishna
et al, 2005ª, Krishna et al, 2005b) the elements included in the poverty line don't
differ significantly among different populations, and the elaborated poverty lines
are constituted from 4 up to 7 stages. If we observe some elements that are
part of the poverty line of for the Colombian communities, we can see that in
other countries they are not included under the line, or the communities do
simply not consider them. For example, appliances, health, recreation and
21
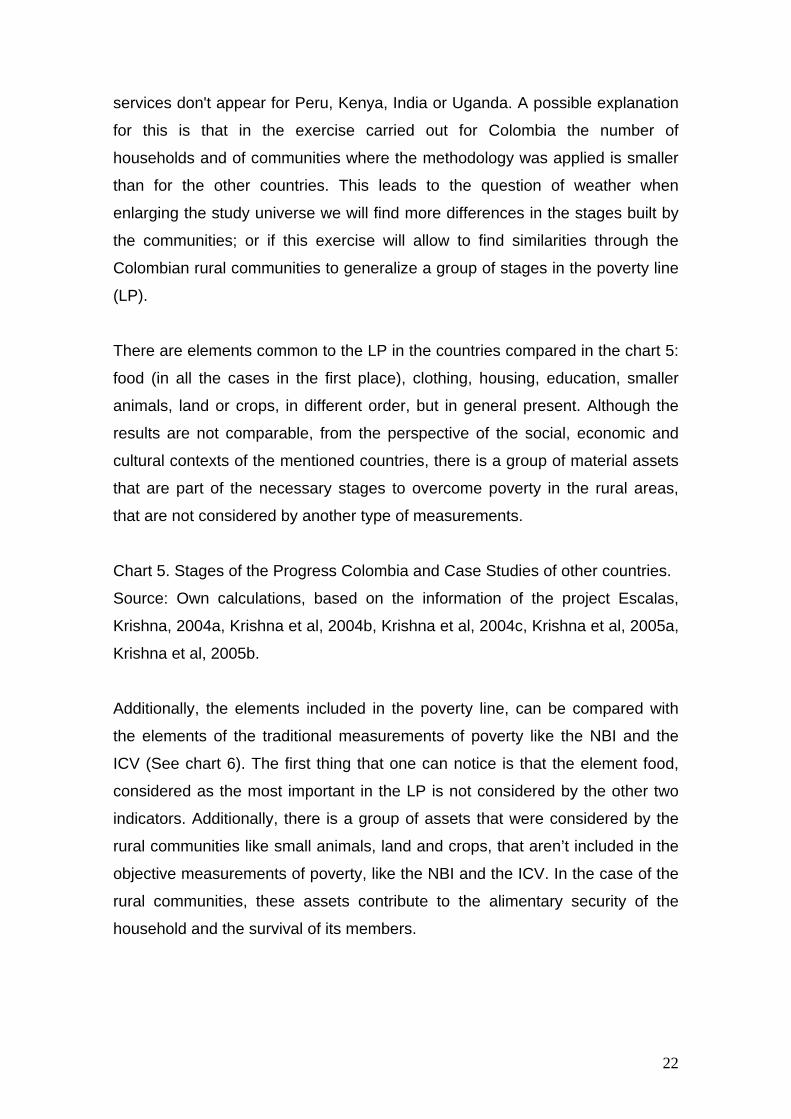
services don't appear for Peru, Kenya, India or Uganda. A possible explanation
for this is that in the exercise carried out for Colombia the number of
households and of communities where the methodology was applied is smaller
than for the other countries. This leads to the question of weather when
enlarging the study universe we will find more differences in the stages built by
the communities; or if this exercise will allow to find similarities through the
Colombian rural communities to generalize a group of stages in the poverty line
(LP).
There are elements common to the LP in the countries compared in the chart 5:
food (in all the cases in the first place), clothing, housing, education, smaller
animals, land or crops, in different order, but in general present. Although the
results are not comparable, from the perspective of the social, economic and
cultural contexts of the mentioned countries, there is a group of material assets
that are part of the necessary stages to overcome poverty in the rural areas,
that are not considered by another type of measurements.
Chart 5. Stages of the Progress Colombia and Case Studies of other countries.
Source: Own calculations, based on the information of the project Escalas,
Krishna, 2004a, Krishna et al, 2004b, Krishna et al, 2004c, Krishna et al, 2005a,
Krishna et al, 2005b.
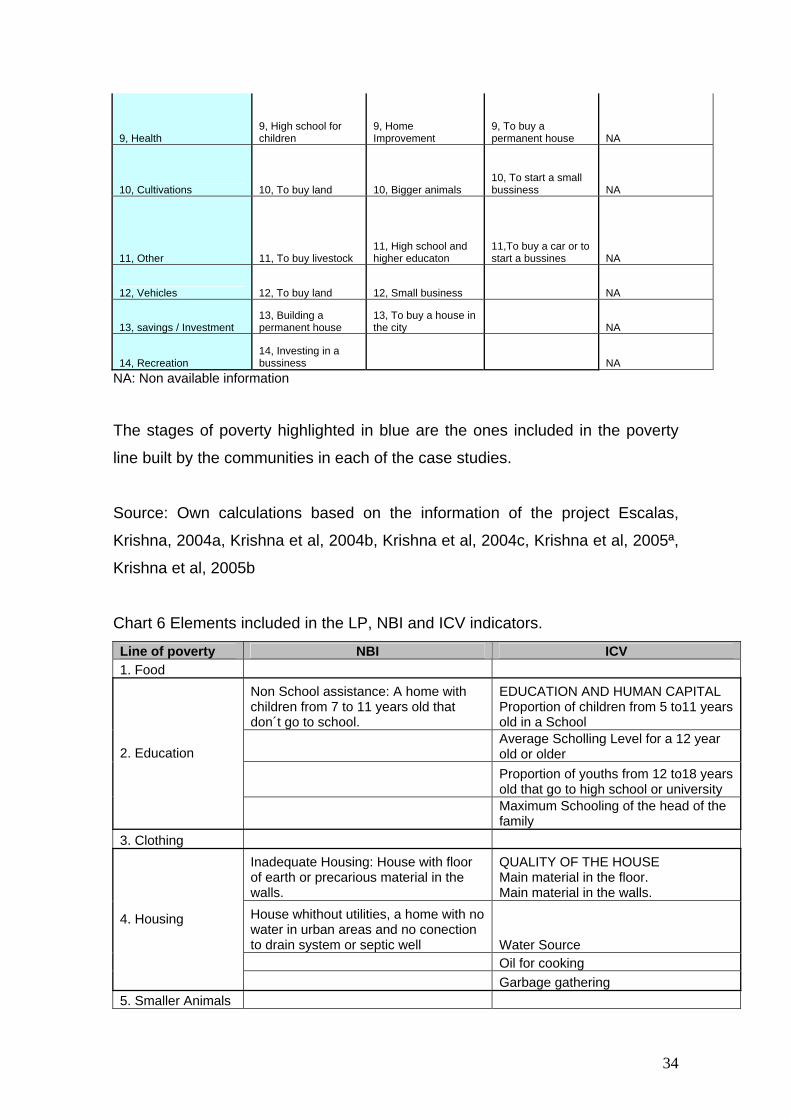
Additionally, the elements included in the poverty line, can be compared with
the elements of the traditional measurements of poverty like the NBI and the
ICV (See chart 6). The first thing that one can notice is that the element food,
considered as the most important in the LP is not considered by the other two
indicators. Additionally, there is a group of assets that were considered by the
rural communities like small animals, land and crops, that aren’t included in the
objective measurements of poverty, like the NBI and the ICV. In the case of the
rural communities, these assets contribute to the alimentary security of the
household and the survival of its members.
22

If in the indicators of poverty for the rural areas, the holding of this type of
assets was included; perhaps, those households that possess them would be
better than those that don't have them.
On the other hand, the access to education, is an element of supreme
importance, so much for the LP as for the NBI and the ICV; in these two last it is
very specific what is considered as basic in terms of access to the education; in
the NBI it is the attendance of the children in school age between 7 and 11
years old; and in the ICV it goes further on, considering so much the levels of
the children's school attendance in school age, as the years of education of the
household’s head and of the other members of the family, that is to say, it
measures the average human capital accumulated in the household.
In the LP determined by the communities, the elementary or high education for
the children is of great importance, as well as the capacity of the household to
buy the supplies that are required to attend the school. This seems to make
sense, because generally in the households, the parents consider that their
children require first to be fed and to have the school supplies, and then to
attend the school. They consider the access to technical training for the parents
when this has been related with the fact of overcoming poverty.
Chart 6. Elements that are part of the indicators LP, NBI and ICV.
Source: Own calculations, DNP, UNDP, 2006.
The household’s size and the dependence rate are not elements of the LP,
while in the NBI and in the ICV, the rate of economic dependence, the
accumulation, the size and the composition of the household are considered.
For the LP, only in the case of the community El Rosal in Cajamarca, the
second stage of the LP is the investment in family planning, although this is not
the only community where the women participate in programs of the ICBF. In
the other cases it is not mentioned the size of the household as a factor that has
an impact in poverty, although the maintenance of more people requires more
effort of the household.
23

Finally, most of the elements of the NBI and the ICV are related with the
material attributes of quality of the housing, or with the accumulation of human
capital in the household. They don't consider the feeding or the holding of
another type of material assets that contribute to the rural poor livelihoods and
are indirectly related to the feeding; which can mark the difference between
being or not being poor.
5. Conclusions.
The existent methodologies for the poverty measurement have to face the
challenge of trying to express, in a synthetic way, a complex and
multidimensional phenomenon. The objective methodologies require the
determination of standards to carry out comparisons among the information that
is obtained in different periods of time, and they privilege the use of data of
quantitative type to fulfill this objective. The standards determined by this type of
measurements are of absolute character, and in occasions they are out of
context. The standardized elements lose explanatory power for the sake of the
simplicity and comparability, excluding some elements that are considered as
important by the society, generating contradictions or ambiguities in the
definitions of poverty.
The subjective and participative methodologies allow the understanding of the
situation of the poverty in a certain social, economic and cultural context that
can be quite relative, particularly in conditions of heterogeneity and inequality,
like in the studied watersheds. But is precisely because of these features that
the capacity to make comparisons among communities is lost, so much in the
temporary as in the spatial environment, due to the peculiarities of the place
where they are applied. Therefore, the objective and participatory
methodologies are complementary, and this can lead to carry out better
standards that include those elements that are important for people, and in this
way to allow the outlining of more effective policies and programs for poverty
relief.
24
On the other hand, the subjective methods facilitate opportune information of
the life conditions in an area or region, when it is not possible to have it in an
up-to-date and periodic way. The obtaining of the information given by the
official organisms takes time and implies costs, particularly for the rural areas.
The results of the poverty lines defined from a methodology like the stages of
progress, include elements considered as basic from the point of view of the
objective measurements of poverty (food, housing, health, services, education),
therefore, there aren’t in principle inconsistencies from this point of view.
However, the elements considered as basic by the objective measurements
were not the only ones considered among those that are necessary in the
community for a household to be non-poor. The additional elements perceived
as important depend on the preferences of the households and mark the
differences of the stages among the communities.
The situation of poverty from the perspective of the studied communities
depends on the context where the individuals form their conception of this, not
only from the point of view of what is understood as poor, but also considering
how complicated it can be to overcome poverty. For this reason we meet with a
lot of variability regarding the location of the poverty line. There has to be extra
care with the existence of elements related with the individual preferences and
with their order, because the obtained results cannot allow to carry out
comparisons of the situation of poverty among the settlements. This is because
the poverty lines differ as much in their composition as in the ordinal character
of their elements.
The results evidence that we know little about the elements that can make the
definitions of the poverty lines to differ, because a pattern among the stages
and the characteristics of the communities was not found. There were
considered elements that could be related with the possession of material
assets, but in fact, they were not enough. Therefore, to deepen in the social and
cultural characteristics of the communities it is necessary to understand, for
example, why elements like the recreation and the possession of a television
are part, of what a group of individuals, can consider as a stage to overcome
poverty.
25
The comparison of the stages obtained with CRC and CLF with the stages set
by the communities of other developing countries, suggests that there is more
work to do: to carry out the exercise stages of progress with a bigger number of
households and of poor communities in Colombia to determine if some
regularity exists in the opposing stages, and what characteristics of the
communities can influence the poverty lines that they build. Additionally, the
question arises of whether we could think of carrying out some generalization of
what the material assets are, and what kind of human capital is required in the
communities of the rural areas to overcome poverty, to focus the government's
poverty alleviation programs in this direction.
Due to the characteristics of the results, it can be concluded that the
methodology of stages of progress offers important information on the
necessary elements to help a household to overcome poverty. In the case of
the rural areas the holding of goods as small animals, land and crops that
contribute to the alimentary security would improve the situation of many
people. Equally, the possibility to send the children to the school and to get all
that is required to increase the levels of school attendance could be profiled as
high-priority in the programs of poverty relief in the area.
Participative methodologies like the stages of progress, can be very useful to
identify how the dynamics of progress in an area have been, since by means of
the definition of the poverty lines the evolution of the situation of the households
in time can be described. If what is looked for with these results is to define the
poverty, there are complications related to the specificity of the context where
what it means to be poor.
It is advisable that when the methodology of stages of progress is used with the
objective of prioritizing the poorest population in a given area, to use no only the
categories but also the type of stages that the communities have not overcome.
This will really give an idea of the differences, - in terms of lacks -, among the
communities. For example, it is not the same thing that a household is below
the poverty line because it doesn't have the economic capacity for recreational
26
trips, than a household that was located also below the poverty line, because it
doesn't have housing.
References
Boltvinik, J.(1997) Poverty Measurement Methods: An Overview. Available at
http://www.undp.org/poverty/publications/pov_red/.
Team Project Escalas CPWF (2005a). Metodología Etapas del Progreso Para
el Análisis de la Dinámica de la Pobreza, adaptado de Kuan, J. Stages of
Progress Method for Poverty Dynamics Analysis. Mimeo.
Team Project Scales CPWF (2005b). Documentos de los Talleres realizados en
las veredas de las cuencas de la Laguna de Fúquene y del Río Coello. Mimeo.
Team Project Scales CPWF (2005c). Resumen de características de las
veredas de las cuencas de la Laguna de Fúquene y del Río Coello. Mimeo.
Krishna, A (2004a). “Escaping Poverty and Becoming Poor: Who Gains, Who
Loses, and Why?”. World Development Vol. 32, No. 1, 121–136.
Krishna, A, Kristjanson, P, Radeny, M and Nindo W (2004b). “Escaping Poverty
and Becoming Poor in 20 Kenyan Villages”. Journal of Human Development.
Vol. 5, No. 2, 211-226.
Krishna, A, Lumonya, D, Markiewicz, M, Kafuko, A, Wegoye, and y Mugumya, F
(2004c). Escaping Poverty and Becoming Poor in 36 Villages of Central and
Western Uganda. Working Paper. Available at
http://www.pubpol.duke.edu/krishna/documents/.
Krishna, A, Kapila, M, Porwal, M and Singh, V (2005a). “Why Growth Is Not
Enough: Household Poverty Dynamics in Northeast Gujarat, India”. Journal of
Development Studies. Vol. 41, 1163-1192.
27
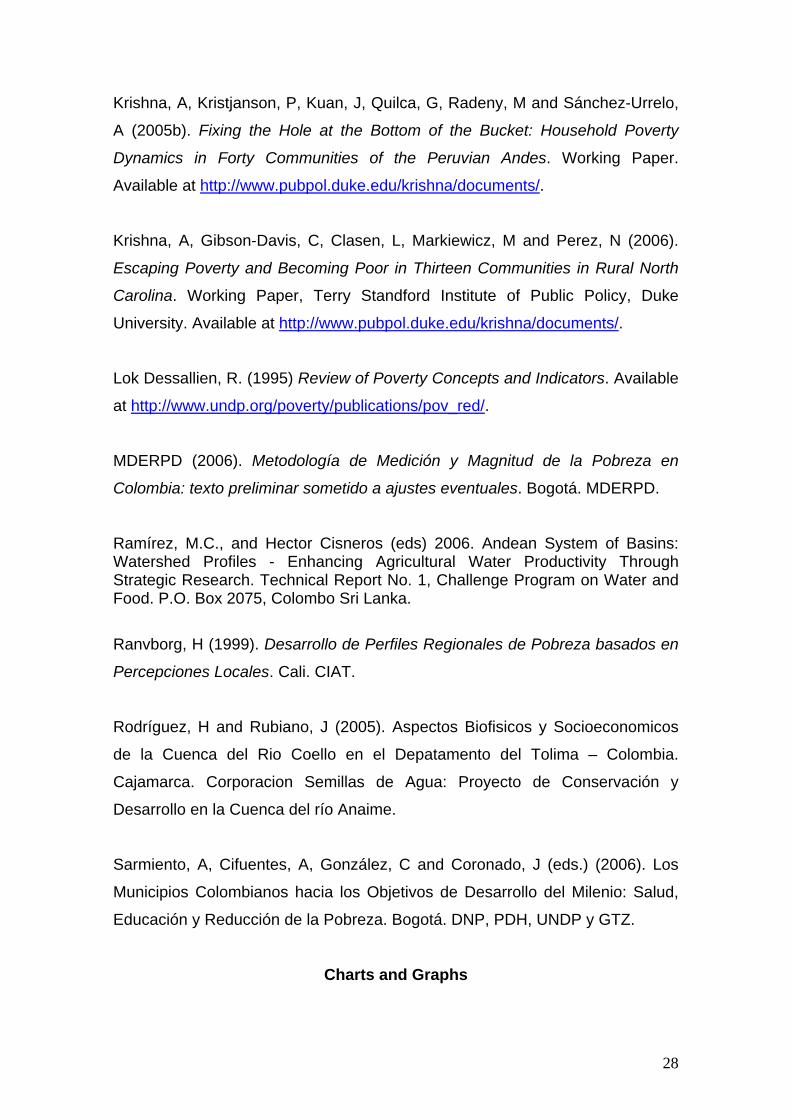
Krishna, A, Kristjanson, P, Kuan, J, Quilca, G, Radeny, M and Sánchez-Urrelo,
A (2005b). Fixing the Hole at the Bottom of the Bucket: Household Poverty
Dynamics in Forty Communities of the Peruvian Andes. Working Paper.
Available at http://www.pubpol.duke.edu/krishna/documents/.
Krishna, A, Gibson-Davis, C, Clasen, L, Markiewicz, M and Perez, N (2006).
Escaping Poverty and Becoming Poor in Thirteen Communities in Rural North
Carolina. Working Paper, Terry Standford Institute of Public Policy, Duke
University. Available at http://www.pubpol.duke.edu/krishna/documents/.
Lok Dessallien, R. (1995) Review of Poverty Concepts and Indicators. Available
at http://www.undp.org/poverty/publications/pov_red/.
MDERPD (2006). Metodología de Medición y Magnitud de la Pobreza en
Colombia: texto preliminar sometido a ajustes eventuales. Bogotá. MDERPD.
Ramírez, M.C., and Hector Cisneros (eds) 2006. Andean System of Basins: Watershed Profiles - Enhancing Agricultural Water Productivity Through Strategic Research. Technical Report No. 1, Challenge Program on Water and Food. P.O. Box 2075, Colombo Sri Lanka.
Ranvborg, H (1999). Desarrollo de Perfiles Regionales de Pobreza basados en
Percepciones Locales. Cali. CIAT.
Rodríguez, H and Rubiano, J (2005). Aspectos Biofisicos y Socioeconomicos
de la Cuenca del Rio Coello en el Depatamento del Tolima – Colombia.
Cajamarca. Corporacion Semillas de Agua: Proyecto de Conservación y
Desarrollo en la Cuenca del río Anaime.
Sarmiento, A, Cifuentes, A, González, C and Coronado, J (eds.) (2006). Los
Municipios Colombianos hacia los Objetivos de Desarrollo del Milenio: Salud,
Educación y Reducción de la Pobreza. Bogotá. DNP, PDH, UNDP y GTZ.
Charts and Graphs
28

Graph 1. Different measurements of poverty
MEDIDASUBJETIVA
MEDIDAS POBREZ
MEDIDAMONETARI
MEDIDAOBJETIVA
MEDIDARELATIVA
MEDIDAMONETARI
MEDIDAABSOLUTA
Sourcee: MERPD, 2006
Measurements of poverty, subjectve and objective measurement, monetary measurement,
relative and absolute measurement.
Chart 1. Departments, Municipalities and Communities where the methodology
Stages or Progress was applied
Department Municipality Settlement 1 Ladera Grande 1 Tausa 2 Rasgata Bajo 3 Chipaquin 4 Palacio 2 Sutatausa 5 Peñas de Cajon 6 Gacha 7 La Isla 3 Guacheta 8 La Puntica 9 Centro y Guata
10 Chinzaque 4 Fuquene 11 Nemoga
5 Cucunuba 12 Chapala
Cundinamarca
6 Carmen de Carupa 13 Apartadero 1 La Leona-APACRAQ 2 El Rosal 3 La Alsalcia
1 Cajamarca
4 Minidistrito La Leona 5 Coello COOCRA 2 Ibague 6 San Cristobal-Honduras
3 Espinal 7 Dindalito 8 Potrerillo 4 Coello-COCORA 9 Chaguala Adentro
Tolima
5 Rovira 10 La Ocera Source: Progress Stages Project Scales CPWF
29

Map 1. Localization of Fúquene Lake Watershed.
Source: Ramírez y Cisneros, 2006
Map 2. Localization Coello River Watershed.
Source: Project Scales CPWF 2005
Chart 2. Results of the methodology. Fúquene Lake and Coello River
Watersheds. 2005
30

Vereda CatA CatB CatC CatD CatE A+C B+DICV
2003Ladera Grande 66% 8% 17% 4% 6% 83% 11%Rasgata Bajo 24% 22% 2% 5% 46% 27% 27%Chipaquin 34% 41% 13% 13% 0% 47% 53%Palacio 37% 47% 0% 2% 14% 37% 49%Peñas de Cajón 17% 61% 0% 0% 22% 17% 61%Gacha 38% 26% 6% 28% 1% 44% 54%La Isla 40% 30% 3% 25% 1% 43% 55%La Puntita 39% 32% 0% 4% 24% 39% 37%Centro y Guata 90% 1% 0% 1% 7% 90% 2%Chinzaque 23% 46% 3% 28% 0% 26% 74%Nemogá 13% 29% 4% 46% 8% 17% 75%
Cucunubá Chápala 83% 13% 0% 0% 5% 83% 13%Medio Bajo
Carmen de Carupa Apartadero 30% 70% 0% 0% 0% 30% 70%Medio Bajo
Total 42% 30% 3% 14% 10% 45% 44%La Leona - Apacra 0% 31% 0% 69% 0% 0% 100%El Rosal 0% 77% 8% 15% 0% 8% 92%La Alsalcia 21% 57% 0% 21% 0% 21% 79%Minidistrito La Leona 45% 55% 0% 0% 0% 45% 55%Cocora 6% 22% 0% 44% 28% 6% 67%San Cristóbal - Honduras 5% 47% 5% 42% 0% 11% 89%
Espinal Dindalito 15% 46% 8% 31% 0% 23% 77%MedioAlto
Potrerillo 0% 100% 0% 0% 0% 0% 100%Chaguala 29% 57% 7% 7% 0% 36% 64%
Rovira La Ocera 6% 75% 0% 19% 0% 6% 94%MedioBajo
Total 11% 59% 3% 24% 3% 14% 83%Gran Total 37% 35% 3% 16% 9% 40% 50%
Medio
Medio
Medio
Medio
Tolim
a
Cajamarca
Ibagué
Coello
MunicipioC
undi
nam
arca
Tausa
Sutatausa
Guachetá
Fúquene
Medio
MedioAlto
MedioBajo
Source: Project Scales CPWF, DNP-UNDP 2006
Note: The ICV is aggregated by municipalities for rural and urban zones.
Chart 3. Number of total stages that define the Poverty Line per Community
Depto Total Etapas Línea pobreza
1 Ladera Grande 12 62 Rasgata Bajo 12 63 Chipaquin 8 54 Palacio 10 45 Peñas de Cajon 8 36 Gacha 12 67 La Isla 15 88 La Puntica 12 89 Centro y Guata 13 8
10 Chinzaque 7 211 Nemoga 8 2
5 Cucunuba 12 Chapala 14 106 Carmen de Carupa 13 Apartadero 16 4
14 La Leona-APACRAQ 15 515 El Rosal 18 816 La Alsalcia 22 617 Minidistrito La Leona 13 818 Coello COOCRA 21 519 San Cristobal-Honduras 24 4
9 Espinal 20 Dindalito 15 521 Potrerillo 16 422 Chaguala Adentro 21 8
11 Rovira 23 La Ocera 22 5
Munic Vereda
Cundinamarca
1 Tausa
2 Sutatausa
3 Guacheta
4 Fuquene
Tolima
7 Cajamarca
8 Ibague
10 Coello
Source: Progress Stages Project Scales CPWF 2005
31
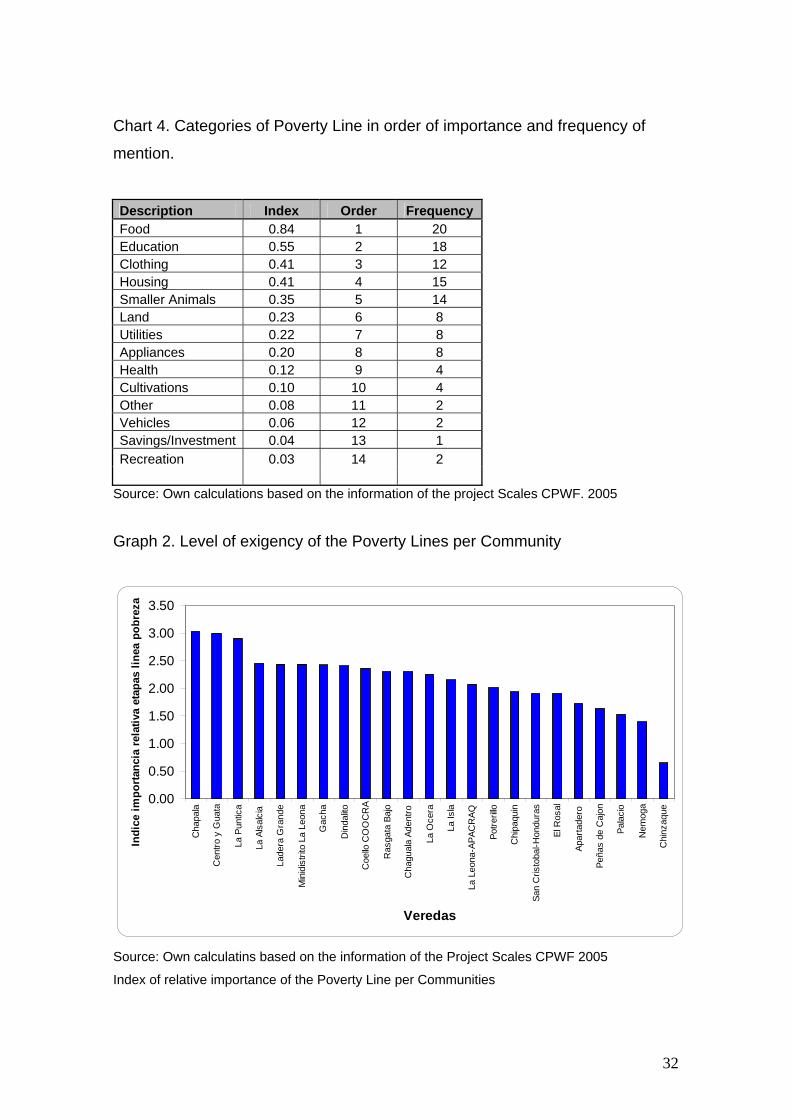
Chart 4. Categories of Poverty Line in order of importance and frequency of
mention.
Description Index Order Frequency Food 0.84 1 20 Education 0.55 2 18 Clothing 0.41 3 12 Housing 0.41 4 15 Smaller Animals 0.35 5 14 Land 0.23 6 8 Utilities 0.22 7 8 Appliances 0.20 8 8 Health 0.12 9 4 Cultivations 0.10 10 4 Other 0.08 11 2 Vehicles 0.06 12 2 Savings/Investment 0.04 13 1 Recreation 0.03 14 2
Source: Own calculations based on the information of the project Scales CPWF. 2005
Graph 2. Level of exigency of the Poverty Lines per Community
0.00
0.50
1.00
1.50
2.00
2.50
3.00
3.50
Cha
pala
Cen
tro y
Gua
ta
La P
untic
a
La A
lsal
cia
Lade
ra G
rand
e
Min
idis
trito
La
Leon
a
Gac
ha
Din
dalito
Coe
llo C
OO
CR
A
Ras
gata
Baj
o
Cha
gual
a Ad
entro
La O
cera
La Is
la
La L
eona
-APA
CR
AQ
Potre
rillo
Chi
paqu
in
San
Cris
toba
l-Hon
dura
s
El R
osal
Apar
tade
ro
Peña
s de
Caj
on
Pala
cio
Nem
oga
Chi
nzaq
ue
Veredas
Indi
ce im
porta
ncia
rela
tiva
etap
as li
nea
pobr
eza
Source: Own calculatins based on the information of the Project Scales CPWF 2005
Index of relative importance of the Poverty Line per Communities
32

Graph 3. Cluster analysis of the elements of the Poverty Line per Community
Grupos de Veredas
Dimension 1
210-1-2-3
Dim
ensi
on 2
3
2
1
0
-1
-2
Grupo
4
3
2
1
Chaguala Adentro
Gacha
La Puntica
Centro y Guata
Apartadero
Chinzaque
San Cristobal-Honduras
La Ocera
La AlsalciaChapalaRasgata Bajo
Coello
La Isla
ChipaquinPalacio
El RosalPotrerillo
Peñas deCajón
Nemogá
MinidistritoLa Leona
Ladera GrandeLa Leona
Dindalito
Source: Own calculations based on the information of the project Scales CPWF 2005
Chart 5. Stages of progress for Colombia and other Countries.
Coello-Fuquene Kenya Perú Uganda India 1, Food 1, Food 1,Food 1, Food 1, Food
2, Education 2, Clothing 2, Clothing 2, Clothing 2, School for children
3, Clothing 3, Home improvement (roof)
3,Basic home improvement 3, School for children 3, Clothing
4, Housing 4, Elementary school for children 4, Smaller animals
4, Repairing existing House (roof) 4, To pay debts
5, Smaller Animals 5, To buy hen 5, Elementary School for children
5, To buy small animals NA
6, Land 6, To buy sheep 6, To buy land 6, To buy small land NA
7, Utilities 7, To buy local livestock
7, Smaller livestock (sheep, ALPACA, llama)
7, To buy a bicycle for transportation NA
8, Appliances
8, Home improvement (furniture) 8, To buy bigger land 8, To buy more land NA
33
9, Health 9, High school for children
9, Home Improvement
9, To buy a permanent house NA
10, Cultivations 10, To buy land 10, Bigger animals 10, To start a small bussiness NA
11, Other 11, To buy livestock 11, High school and higher educaton
11,To buy a car or to start a bussines NA
12, Vehicles 12, To buy land 12, Small business NA
13, savings / Investment 13, Building a permanent house
13, To buy a house in the city NA
14, Recreation 14, Investing in a bussiness NA
NA: Non available information
The stages of poverty highlighted in blue are the ones included in the poverty
line built by the communities in each of the case studies.
Source: Own calculations based on the information of the project Escalas,
Krishna, 2004a, Krishna et al, 2004b, Krishna et al, 2004c, Krishna et al, 2005ª,
Krishna et al, 2005b
Chart 6 Elements included in the LP, NBI and ICV indicators.
Line of poverty NBI ICV 1. Food
Non School assistance: A home with children from 7 to 11 years old that don´t go to school.
EDUCATION AND HUMAN CAPITAL Proportion of children from 5 to11 years old in a School
Average Scholling Level for a 12 year old or older
Proportion of youths from 12 to18 years old that go to high school or university
2. Education
Maximum Schooling of the head of the family
3. Clothing Inadequate Housing: House with floor of earth or precarious material in the walls.
QUALITY OF THE HOUSE Main material in the floor. Main material in the walls.
House whithout utilities, a home with no water in urban areas and no conection to drain system or septic well Water Source Oil for cooking
4. Housing
Garbage gathering 5. Smaller Animals
34

6. Land 7. Utilities 8. Appliances 9. Health 10. Cultivations
Critical overcrowding: Number of people per room higher than 3.
SIZE AND COMPOSITON OF THE HOME Overcrowding in the house
High economic dependency: A home with more than 3 dependent members, where the head of the family has a maximum of 3 years of basic education. Proportion of 6 year olds or younger
11. Other
12. Vehícles 13. Savings/Investment 14. Recreation
Source: own calculations, MERPD, PNUD, 2006.
35