dynamics and timeseries: theoryand applicationshomepage.sns.it/marmi//lezioni/lecture_6.pdfdiastole,...
TRANSCRIPT

Dynamics and time series: theory and applications
Stefano Marmi
Scuola Normale Superiore
Lecture 6, Feb 17, 2009

• Lecture 1: An introduction to dynamical systems and to time series. Periodic and
quasiperiodic motions. (Tue Jan 13, 2 pm - 4 pm Aula Bianchi)
• Lecture 2: Ergodicity. Uniform distribution of orbits. Return times. Kac inequality
Mixing (Thu Jan 15, 2 pm - 4 pm Aula Dini)
• Lecture 3: Kolmogorov-Sinai entropy. Randomness and deterministic chaos. (Tue Jan
27, 2 pm - 4 pm Aula Bianchi)
• Lecture 4: Time series analysis and embedology. (Thu Jan 29, 2 pm - 4 pm Dini)
• Lecture 5: Fractals and multifractals. (Thu Feb 12, 2 pm - 4 pm Dini)
• Lecture 6: The rhythms of life. (Tue Feb 17, 2 pm - 4
pm Bianchi)
• Lecture 7: Financial time series. (Thu Feb 19, 2 pm - 4 pm Dini)
• Lecture 8: The efficient markets hypothesis. (Tue Mar 3, 2 pm - 4 pm Bianchi)
• Lecture 9: A random walk down Wall Street. (Thu Mar 19, 2 pm - 4 pm Dini)
• Lecture 10: A non-random walk down Wall Street. (Tue Mar 24, 2 pm – 4 pm
Bianchi)

• Seminar I: Waiting times, recurrence times ergodicity and quasiperiodicdynamics (D.H. Kim, Suwon, Korea; Thu Jan 22, 2 pm - 4 pm Aula Dini)
• Seminar II: Symbolization of dynamics. Recurrence rates and entropy (S. Galatolo, Università di Pisa; Tue Feb 10, 2 pm - 4 pm Aula Bianchi)
• Seminar III: Heart Rate Variability: a statistical physics point of view (A. Facchini, Università di Siena; Tue Feb 24, 2 pm - 4 pm Aula Bianchi )
• Seminar IV: Study of a population model: the Yoccoz-Birkeland model (D. Papini, Università di Siena; Thu Feb 26, 2 pm - 4 pm Aula Dini)
• Seminar V: Scaling laws in economics (G. Bottazzi, Scuola Superiore Sant'Anna Pisa; Tue Mar 17, 2 pm - 4 pm Aula Bianchi)
• Seminar VI: Complexity, sequence distance and heart rate variability (M. Degli Esposti, Università di Bologna; Thu Mar 26, 2 pm - 4 pm Aula Dini )
• Seminar VII: Forecasting (M. Lippi, Università di Roma; late april, TBA)

Today’s bibliography:
L. Glass and M.C. Mackey: “From Clocks to Chaos.
The Rhythms of Life” Princeton University Press
(1988)
Fractal dynamics in physiology: Alterations with disease and
aging
Goldberger AL, Amaral LAN, Hausdorff JM, Ivanov PC,
Peng CK, Stanley HE
PNAS USA 2002;99:2466-2472.

• Physiological rhythms are central to life. Some are maintained
throughout life without interruptions.
• Rhythms interact with one another and with exernal
environment
• Variations of rhythms outside normal limits, or appearance of
new ones, is associated with disease

Homeostasis
• homeostasis: is the property of a system, either open or closed,
that regulates its internal environment so as to maintain a
stable, constant condition
• Human body: relative constancy of
• Claude Bernard (1813–78), French physiologist: showed the
role of the pancreas in digestion, the method of regulation of
body temperature, and the function of nerves supplying the
internal organs.
• W.B. Cannon (1871-1945) : Showed that physiological
variables like blood sugar, blood gases, electrolytes,
osmolarity, blood pressure, pH are relatively constant.
• Homeostasis can be associated to stable steady states

Arterial and mean arterial pressure responses to a quick mild
hemorrage in a dog anesthetized with sodium pentobarbital
(Figure 1.1, Glass Mackey From Clocks to Chaos, p.4)

Physiological variables when measured with sufficient accuracy will never be absolutely constant or exactly periodic
There are always fluctuations. Sometimes they are due to the environment, as shown here with blood insulin and glucose levels
B=breakfast, L=lunch, SK=snack, D=dinner, E=exercise
(Figure 1.3, Glass Mackey From Clocks to Chaos, p.5)

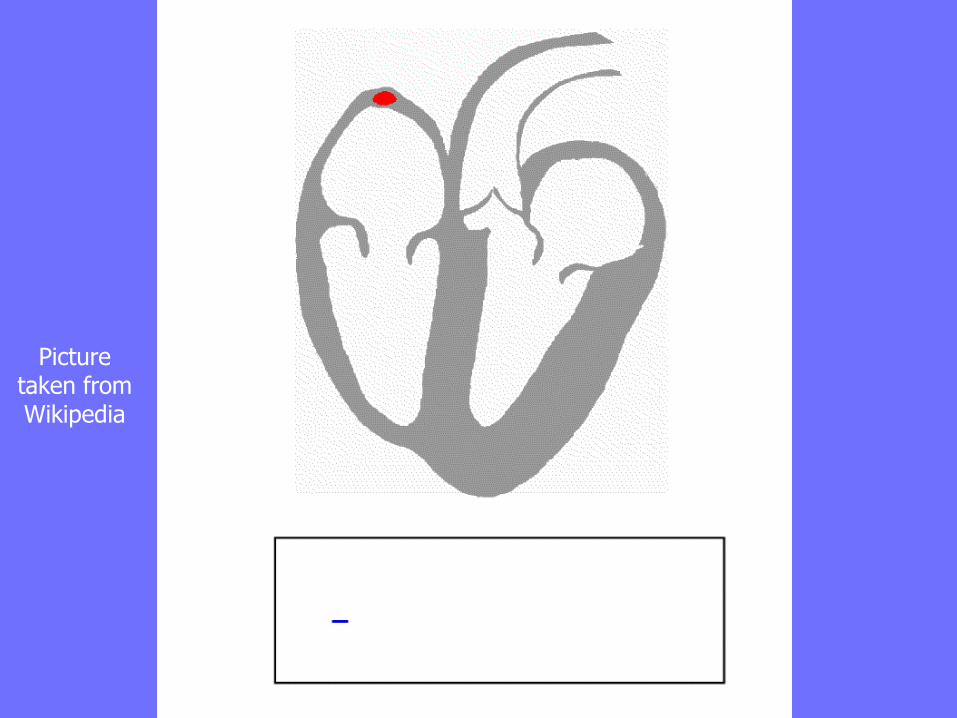
The human heart
http://www.nhlbi.nih.gov/health/dci/Diseases/hhw/hhw_anatomy.html

The hearbeatThe frequency of the cardiac cycle is the heart rate. Every single
'beat' of the heart involves three major stages: atrial systole,
ventricular systole and complete cardiac diastole. The
term diastole is synonymous with relaxation of a muscle. During
diastole, the atria and ventricles of your heart relax and begin to
fill with blood. At the end of diastole, your heart’s atria contract
(an event called atrial systole) and pump blood into the ventricles.
The atria then begin to relax. Next, your heart’s ventricles contract
(an event called ventricular systole) and pump blood out of your
heart.
Throughout the cardiac cycle, the blood pressure increases and
decreases. The cardiac cycle is coordinated by a series of
electrical impulses that are produced by specialized heart cells
found within the sinoatrial node and the atrioventricular node.

Your heart uses the four valves to ensure your blood flows only in one direction.
Blood without oxygen from the two vena cavae fill your heart’s right atrium.
The atrium contracts (atrial systole). The tricuspid valve located between the right
atrium and ventricle opens for a short time and then shuts. This allows blood to
enter into the right ventricle without flowing back into the right atrium.
When your heart’s right ventricle fills with blood, it contracts (ventricular systole).
The pulmonary valve located between your right ventricle and pulmonary artery
opens and closes quickly. This allows blood to enter into your pulmonary artery
without flowing back into the right ventricle. Blood travels through the pulmonary
arteries to your lungs to pick up oxygen.
Oxygen-rich blood returns from the lungs to your heart’s left atrium through the
pulmonary veins. As your heartís left atrium fills with blood, it contracts. This
event also is called atrial systole. The mitral valve located between the left atrium
and left ventricle opens and closes quickly. This allows blood to pass from the left
atrium into the left ventricle without flowing back into the left atrium.
As the left ventricle fills with blood, it contracts. This event also is called
ventricular systole. The aortic valve located between the left ventricle and aorta
opens and closes quickly. This allows blood to flow into the aorta. The aorta is the
main artery that carries blood from your heart to the rest of your body. The aortic
valve closes quickly to prevent blood from flowing back into the left ventricle,
which is already filling up with new blood.http://www.nhlbi.nih.gov/health/dci/Diseases/hhw/hhw_pumping.html

Electrocardiogram
Pictures taken from Wikipedia

The heart cycle and ECG
Picture taken from Wikipedia
Picture taken fromWikipedia

Your Heart’s Electrical System.swf
http://www.nhlbi.nih.gov/health/dci/Diseases/hhw/hhw_electrical.html
Heart Contraction and Blood Flow.swf
http://www.nhlbi.nih.gov/health/dci/Diseases/hhw/hhw_pumping.html

Heart rate vs embryonic age
At 21 days
after conception,
the human heart
begins beating at 70
to 80 beats per
minute and
accelerates linearly
for the first month
of beating
From:WIKIPEDIA

Heart rate from childhood to senescence
http://reylab.bidmc.harvard.edu/pubs/1999/circulation-1999-100-393.pdf

Stable periodic behaviour: limitcycles and ECG
G. Israel:Balthasar van der Pol e il primo modello matematico del battito cardiaco. http://giorgio.israel.googlepages.com/Art76.pdf
http://www.scholarpedia.org/article/Van_der_Pol_oscillator
,
Lienard transformation

Time series analysis ofphysiological signals
Physiological signals are characterized by extreme variability both inhealthy and pathological conditions. Complexity, erratic behaviour,chaoticity are typical terms used in the description of manyphysiological time series.
Quantifying these properties and turning the variability analysis fromqualitative to quantitative are important goals of the analysis of time-series and could have relevant clinical impact.

From ECG to heart rate variability time series
• Example of ECG signal
• The time interval between
two consecutive R-wave
peaks (R-R interval) varies in
time
• The time series given by the
sequence of the durations of
the R-R intervals is called
heart rate variability (HRV)
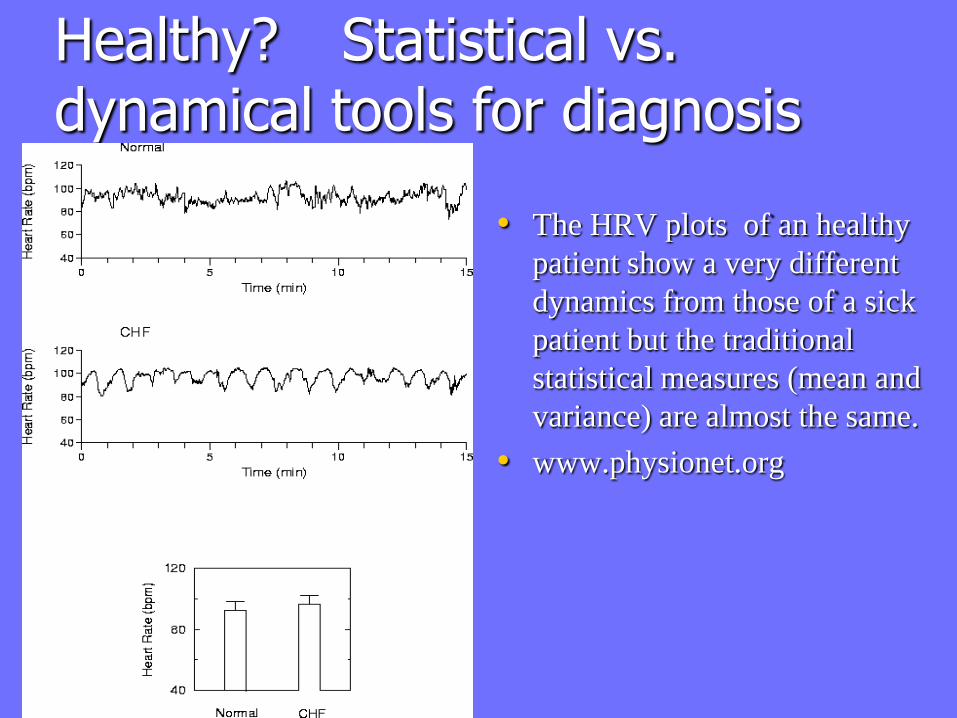
Healthy? Statistical vs. dynamical tools for diagnosis
• The HRV plots of an healthy
patient show a very different
dynamics from those of a sick
patient but the traditional
statistical measures (mean and
variance) are almost the same.
• www.physionet.org
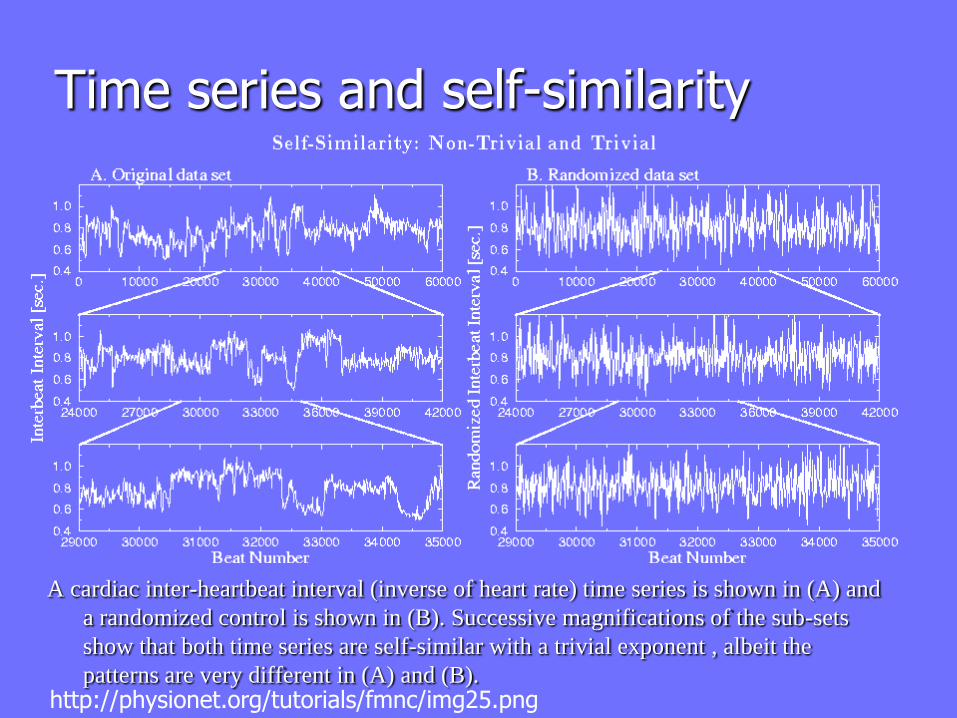
Time series and self-similarity
http://physionet.org/tutorials/fmnc/img25.png
A cardiac inter-heartbeat interval (inverse of heart rate) time series is shown in (A) and
a randomized control is shown in (B). Successive magnifications of the sub-sets
show that both time series are self-similar with a trivial exponent , albeit the
patterns are very different in (A) and (B).
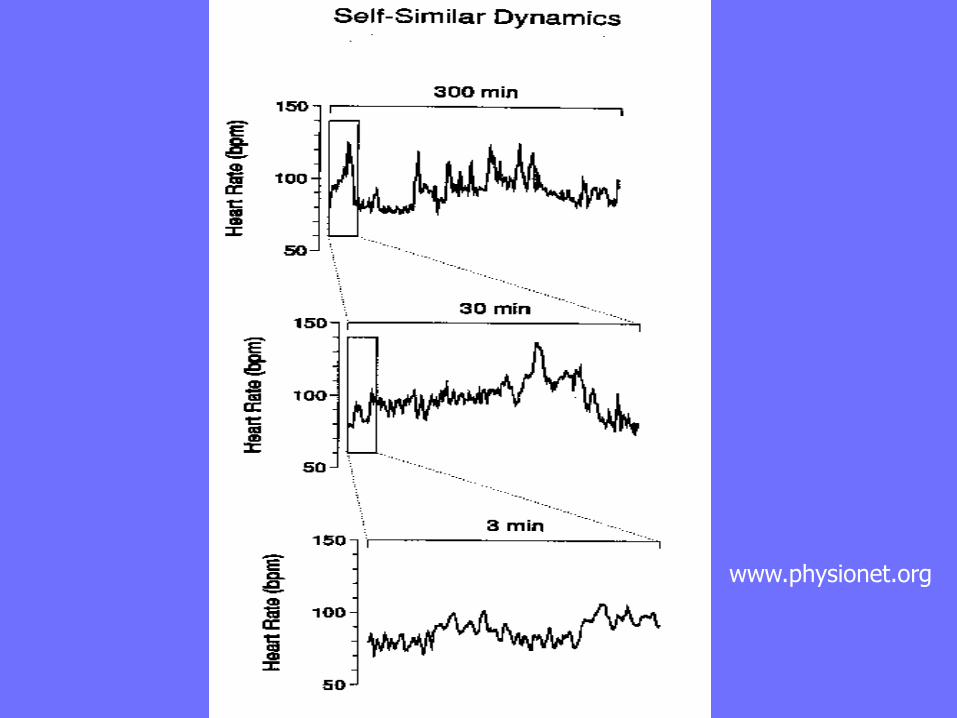
www.physionet.org

Healthy ?
www.physionet.org

Healthy or pathological?
(Adapted from Goldberger AL. Non-linear dynamics for clinicians: chaos theory, fractals, and complexity at the bedside. Lancet 1996;347:1312-1314.)
Here is what can happen as the heart goes out of its normal healthy state. At the bottom left :
heart failure. The signal is approximately periodic with small amplitude fluctuations. At the
bottom right: atrial fibrillation. The heart rate is very erratic with quick accelerations and
decelerations, with no particular pattern.

Scientific American, February 1990http://reylab.bidmc.harvard.edu/pubs/1990/sa-1990-262-42.pdf

Healthy or not?

The breakdown of long-range power law correlations may lead to any of three
dynamical states: (i) a random walk (``brown noise'') as observed in low frequency
heart rate fluctuations in certain cases of severe heart failure; (ii) highly periodic
oscillations, as also observed in Cheyne-Stokes pathophysiology in heart failure, as well
as with sleep apnea (Fig. 1c), and (iii) completely uncorrelated behavior (white noise),
perhaps exemplified by the short-term heart rate dynamics during atrial fibrillation.
www.physionet.org

Correlation between diseaseseverity and fractal scalingexponent
www.physionet.org

Distribution ofR-R intervals
www.physionet.org

Stochastic or chaotic?
• An important goal of time-series analysisis to determine, given a times series (e.g. HRV) if the underlying dynamics (the heart) is:
– Intrinsically random
– Generated by a deterministic nonlinearchaotic system which generates a randomoutput
– A mix of the two (stochastic perturbations ofdeterministic dynamics)

Nonlinear dynamics and chaos in cardiology?
The normal heart rhythm in humans is set by a small group of cells called the
sinoatrial node. Although over short time intervals, the normal heart rate often
appears to be regular, when the heart rate is measured over extended periods of
• time, it shows significant fluctuations. There are a number of factors that affect
these fluctuations: changes of activity or mental state, presence of drugs,
presence of artificial pace- makers, occurrence of cardiac arrhythmias that
might mask the sinoatrial rhythm or make it difficult to measure.

Following the widespread recognition of the possibility of deterministic chaos in the
early 1980s, considerable attention has been focused on the possibility that heart rate
variability might reflect deterministic chaos in the physiological control system
regulating the heart rate. A large number of papers related to the analysis of heart
rate variability have been published in Chaos and elsewhere. However, there is still
considerable debate about how to characterize fluctuations in the heart rate and the
significance of those fluctuations. There has not been a forum in which these
disagreements can be aired. Accordingly, Chaos invites submissions that address
one or more of the following questions:
• Is the normal heart rate chaotic?
• If the normal heart rate is not chaotic, is there some more appropriate term to
characterize the fluctuations e.g., scaling, fractal, multifractal?
• How does the analysis of heart rate variability elucidate the
underlying mechanisms controlling the heart rate?
• Do any analyses of heart rate variability provide clinical information that can
be useful in medical assessment e.g., in helping to assess the risk of sudden
cardiac death. If so, please indicate what additional clinical studies would be useful
for measures of heart rate variability to be more broadly accepted by the medical
community.

EEG: electroencephalography
We use EEG to measure the constant flux of electrical activity generated by
cells in the head
Brain “waves” occur in the EEG record due to changes across time in voltages
between two different regions of the brain, as recorded from different
regions several centimeters apart on the scalp
The two fundamental aspects of brain activity, as measured in the EEG are the
frequency and amplitude of the waves
Frequency typically varies from less than 1 to more than 25 Hz
Amplitude usually varies between 10 and 200 microvolts when measured
from the scalp
Generally, the higher the frequency, the lower the amplitude


Alpha: from 8 Hz to
12 Hz. Closing the
eyes, relaxation;
"posterior dominant
rhythm" Beta: from
12 Hz to about 30 Hz.
Active, busy, anxious
thinking,
concentration; most
evident frontally.
Gamma: 26–100 Hz,
cognitive or motor
function of neuron
networks. Delta: up
to 3 Hz. Adults
in slow wave sleep
and also seen
normally in babies.
Theta: 4 Hz to 7 Hz.
Young children.
Meditatative and
creative states
Source:wikipedia

• Human EEG associated with different
stages of sleep and wakefulness. (a)
Relaxed wakefulness (eyes shut) shows
rhythmic 8–12-Hz alpha waves. (b) Stage 1
non-REM sleep shows mixed frequencies,
especially 3–7-Hz theta waves. (c) Stage 2
non-REM sleep shows 12–14-Hz sleep
spindles (bursts of activity) .(d) Delta sleep
shows large-amplitude (>75 μV) 0.5–2-Hz
delta waves. (e) REM sleep shows low-
amplitude, mixed frequencies with
sawtooth waves.
• From: McGraw-Hill Encyclopedia of
Science and Technology. Copyright © 2005 by The McGraw-Hill Companies, Inc.

Soft excitation: supercriticalHopf bifurcation
• A mathematically natural way of turning on/off oscillations is
via parameter-dependent dynamics
dr/dt = r(c-r2)
dφ/dt = 2π
figure 5.3 Glass Mackey From
Clocks to Chaos, p. 85
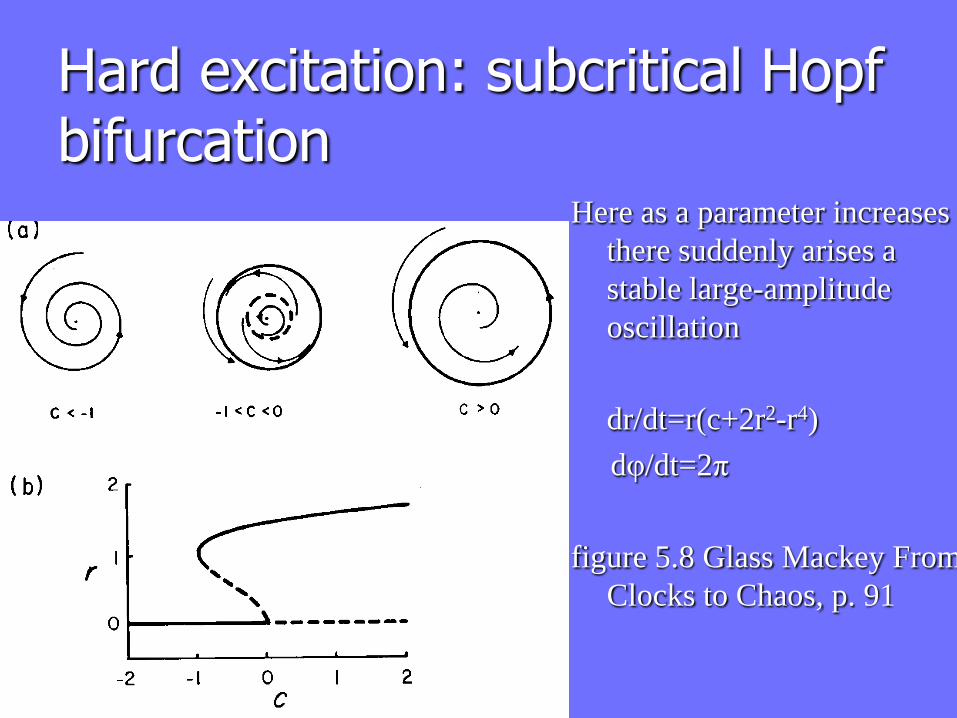
Hard excitation: subcritical Hopfbifurcation
Here as a parameter increases
there suddenly arises a
stable large-amplitude
oscillation
dr/dt=r(c+2r2-r4)
dφ/dt=2π
figure 5.8 Glass Mackey From
Clocks to Chaos, p. 91

Visual hystheresis
Hysteresis in
perception: start from
the left upper corner,
follow the first row and
then proceed the same
way along the lower
row. You will notice a
jump from the
perception of a man's
face to that of a woman.
Do the same
observations in the
reverse direction: the
transition from woman
to men's face occurs at a
later point than before.
http://www.scholarpedia.org/article/Self-organization_of_brain_function

Dynamical diseases?
Glass-Mackey : irregular physiological rhythms might be associated
with deterministic chaos. Many diseases characterized by abnormal
rhythmicity could be associated with qualitative changes in
dynamics in mathematical models of physiological systems…the
terms “dynamical disease” is appropriate to describe medical
disorders characterized by abnormal dynamics associated with
abnormalities in the control systems generating and regulating the
physiological rhythms. The irregular chaotic rhythms might
correspond either to disease or to normal physiological fluctuation.
Mathematics may help in classification of diseases and development
of new therapies.
L. Glass: Dynamical disease – The impact of nonlinear dynamics and chaos on cardiology and
medicine. In Chaos and Complexity, Proceedings of the Vth Rencontre de Blois (1995)

Dynamical diseases?
Three routes to (dynamical) disease
The signature of a dynamical disease is a marked change in the
dynamics of some variable:
(constant→periodic) variables that are constant or undergoing
small amplitude random fluctuations can develop large
amplitude oscillations that may be more or less regular
(periodic to new period) new periodicities can arise in an already
periodic process
(periodic to constant or to chaotic) periodic processes can
disappear and be replaced by relatively constant dynamics or
by aperiodic (chaotic) dynamics

H.A. Reimann (1963) Periodicdiseases
From www.cnd.mcgill.ca/courses_mackey/lecture_3.ppt

Temperature oscillations in Hodgkin’s disease
From www.cnd.mcgill.ca/courses_mackey/lecture_3.ppt

Periodic hematological diseases

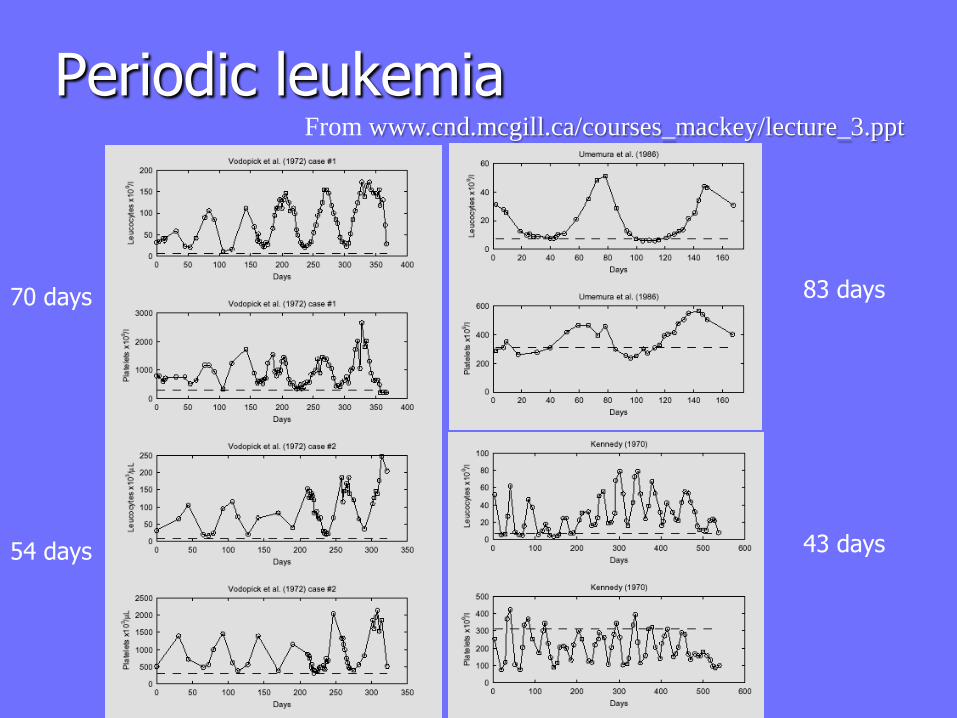
Periodic leukemiaFrom www.cnd.mcgill.ca/courses_mackey/lecture_3.ppt
70 days
54 days
83 days
43 days

Delay-differential equations
Delay-differential equations (DDEs) often arise in biological
systems where time lags naturally occur.
In particular, in hematology several processes are controlled
through feedback loops and these feedbacks are generally
operative only after a certain time, thus introducing a delay in
the system feedback.
DDE with constant delays
dx/dt=f(x(t),x(t-τ1), x(t-τ2),…, x(t-τn))
To obtain a solution for t > 0, one needs to specify a history
function on [−τ, 0], where τ=max(τ1 , τ2 ,…, τn ). Therefore
DDEs are often viewed as infinite-dimensional systems.

Is epilepsy a dynamical disease?


Addictions as dynamical diseases?
Several authors have suggested that chaos theory, the study of nonlinear dynamics
and the application of the knowledge gained to natural and social phenomena, might
yield insight into substance-related disorders. In this article, we examine the
dynamics of substance abuse by fitting a nonlinear model to a time series of the
amount of alcohol, which an adult male with a diagnosis of substance abuse
consumed on a daily basis. The nonlinear model shows a statistically superior fit
when compared to a linear model. We then use the model to explore a question that is
pertinent to the treatment of substance abuse, whether controlled drinking or
abstinence is a preferred strategy for maintaining sobriety.
