dynamics of h3k4me3 chromatin marks take the lead over ... · chromatin marks on genome expression....
TRANSCRIPT
Research Article
Dynamics of H3K4me3 Chromatin Marks Take the Lead over
H3K27me3 for Gene Regulation during Flower Morphogenesis in Arabidopsis thaliana
Julia Engelhorn1,2,3,4, Robert Blanvillain1 2,3,4, Christian Kröner5, Hugues Parrinello6, Marine
Rohmer6, David Pose7,8, Felix Ott7, Markus Schmid7,9 and Cristel C. Carles1 2,3,4,* 1 Université Grenoble Alpes, Laboratoire de Physiologie Cellulaire et Végétale (LPCV), 38054 Grenoble, France. 2 CNRS, LPCV, UMR 5168, 38054 Grenoble, France. 3 CEA, Direction des Sciences du Vivant, BIG, LPCV, 38054 Grenoble, France. 4 INRA, LPCV, 38054 Grenoble, France. 5 Optical Engineering Group, School of Engineering, University of Warwick, Coventry, CV4 7AL, UK 6 MGX-Montpellier GenomiX; c/o Institut de Génomique Fonctionnelle, 141 rue de la Cardonille, 34094 Montpellier Cedex 5, France 7 Department of Molecular Biology, Max Planck Institute for Developmental Biology, 72074 Tübingen, Germany. 8 Instituto de Hortofruticultura Subtropical y Mediterránea, Universidad de Málaga–Consejo Superior de Investigaciones Científicas, Departamento de Biología Molecular y Bioquímica, Facultad de Ciencias, Universidad de Málaga, 29071 Málaga, Spain. 9 Umeå Plant Science Centre, Department of Plant Physiology, Umeå University, S-901 87 Umeå, Sweden.
[email protected]; [email protected]; [email protected]; [email protected]; [email protected]; [email protected]; [email protected]; [email protected]
* Correspondence: [email protected]; Tel.: +33-438-784-195; +33-635-595-734
Abstract: Plant life-long organogenesis involves sequential, time and tissue specific expression of developmental genes. This requires activities of Polycomb Group (PcG) and trithorax Group complexes, respectively responsible for repressive Histone 3 trimethylation at lysine 27 (H3K27me3) and activation-related H3K4me3. However, the genome-wide dynamics in histone modifications that occur during developmental processes have remained elusive. Here, we report the distributions of H3K27me3 and H3K4me3 along with transcriptional changes, in a developmental series including Arabidopsis leaf and three stages of flower development. We found that chromatin mark levels are highly dynamic over the time series on nearly half of all Arabidopsis genes. Moreover, during early flower morphogenesis, changes in H3K4me3 prime over changes in H3K27me3 and quantitatively correlate with transcription changes, while H3K27me3 changes occur after prolonged expression changes. Notably, early activation of PcG target genes is dominated by increases in H3K4me3 while H3K27me3 remains present at the locus. Our results reveal H3K4me3 as greater predictor over H3K27me3 for transcription dynamics, unveil unexpected chromatin mechanisms at gene activation and underline the relevance of tissue-specific temporal epigenomics.
Keywords: Chromatin and transcription dynamics; reproductive development; differentiation; ChIP-seq; RNA-seq.
1. Introduction
Morphogenesis in plants relies on continuous and iterative production of new organs with specific functions. In annual plants like Arabidopsis thaliana, upon transition to the reproductive
Preprints (www.preprints.org) | NOT PEER-REVIEWED | Posted: 8 May 2017 doi:10.20944/preprints201705.0070.v1
© 2017 by the author(s). Distributed under a Creative Commons CC BY license.
Peer-reviewed version available at Epigenomes 2017, 1, 8; doi:10.3390/epigenomes1020008

2 of 32
phase, flower primordia are produced at the flanks of the inflorescence meristem. In these primordia, stem cell activity is re-established and the newly formed flower meristems produce founder cells for the different floral organs [Alvarez-Buylla, 2010 #2395]. These cell-fate specifications coincide with changes in the expression pattern of developmental regulators [Kaufmann, 2010 #2406]. The LEAFY (LFY), APETALA 1 (AP1) and CAULIFLOWER (CAL) transcription factors (TF) specify floral meristem identity via activation of downstream regulators, among which the MADS domain TF encoding genes. Spatially restricted expression of these genes then induces the differentiation of stem cells into specific cell types for formation of the different floral organs, as described in the ABC(D)E model [Chahtane, 2017 #2407]. Several reports on epigenetic mutants indicate that this regulation occurs through changes in the chromatin state of the corresponding loci, such as post-translational modifications of histones [Engelhorn, 2014 #169]. Histone 3 trimethylation at lysine 27 (H3K27me3) is a repressive modification targeting developmental regulators in all higher eukaryotes and is catalysed by Polycomb Group (PcG) proteins [Pirrotta, 1998 #2410;Schuettengruber, 2007 #518;Morey, 2010 #395]. Genome-wide studies of H3K27me3 distribution in whole seedlings revealed that this mark targets more than one fourth of all Arabidopsis genes [Zhang, 2007 #2333;Oh, 2008 #2408;Roudier, 2011 #2385], comprising tissue- or stage-specific regulators of the vegetative to reproductive transition, floral meristem identity genes and all above-mentioned floral homeotic genes. Activation of PcG-repressed genes is conducted by the conserved trithorax Group (trxG) proteins, involved in three main activation processes: (i) removal of repressive H3K27me3 marks, (ii) deposition of activation-associated H3K4me3 marks and (iii) chromatin remodelling to allow access of the transcriptional machinery [Schuettengruber, 2011 #519;Engelhorn, 2014 #169;Kingston, 2014 #303].
Thus, PcG and trxG antagonistic factors ensure correct spatial and temporal expression of developmental regulators, such as those involved in flowering-time and flower development [Alvarez-Venegas, 2010 #2412;Kohler, 2010 #2450;Muller, 2011 #401;de la Paz Sanchez, 2015 #143;Pu, 2015 #458]. As a consequence, H3K27me3 and H3K4me3 chromatin marks should be highly dynamic throughout developmental stages and cell-types in plants. However, most genome-wide studies were so far performed for one developmental stage and often in a mixture of tissues during vegetative development, yielding only a static view of chromatin states. Some comparative studies used endosperm-specific nuclei [Weinhofer, 2010 #2501], meristem-enriched tissue [Lafos, 2011 #2504], roots [Roudier, 2011 #2385], or mature versus senescing leaves [Brusslan, 2012 #2507;Brusslan, 2015 #2506]. All showed differential H3K27me3 marking between tissues, at thousands of genes. Additionally, several hundreds of genes differ in H3K27me3 intensity between undifferentiated and differentiated tissue, without loosing the mark completely [Lafos, 2011 #2504;He, 2012 #632]. Several genome-wide analyses revealed an anti-correlation between changes in gene expression and changes in H3K27me3, and oppositely, a positive correlation for the H3K4me3 mark [Lafos, 2011 #2504;Brusslan, 2012 #2507]. Studies at single gene level provided evidence that correlative changes in these histone marks are rather a cause than a consequence of the transcriptional state [Adrian, 2010 #2508;Buzas, 2011 #2509].
Nevertheless, many questions remain open such as (i) the dynamics of histone mark between consecutive developmental stages; (ii) the correlation extent between changes in H3K27me3, H3K4me3 and gene expression; (iii) and the chronology of changes in H3K27me3, H3K4me3 and transcription. To obtain answers to these questions, we used the Arabidopsis “cauliflower” inducible system, which allows collecting meristem tissue from synchronized floral stages, in sufficient amounts for genome-wide analyses of chromatin and expression [Wellmer, 2006 #2210;Kaufmann, 2010 #2396;Smaczniak, 2012 #1999;Pajoro, 2014 #1736]. We resolved the dynamics of the H3K4me3 and H3K27me3 marks and their correlation with transcriptional changes in vegetative, inflorescence meristem, early developing flower and developed inflorescence tissues. This allowed establishing a comprehensive view of antagonistic histone modification dynamics during flower development in relation with gene activation or repression. We found that both chromatin marks are highly dynamic over development, with thousands of genes changing in their marking. H3K4me3 dynamics correlate quantitatively with expression changes, while pronounced H3K27me3 changes mostly occur after
Preprints (www.preprints.org) | NOT PEER-REVIEWED | Posted: 8 May 2017 doi:10.20944/preprints201705.0070.v1
Peer-reviewed version available at Epigenomes 2017, 1, 8; doi:10.3390/epigenomes1020008

3 of 32
transcriptional changes, with the exception of genes that are activated and required very early during flower morphogenesis, like SEPALLATA1-3 (SEP1-3), LFY and an organ boundary specifying gene (CUP-SHAPED COTYLEDON 1 (CUC1)). However, also for these genes, early changes in H3K27me3 are mild and less pronounced than H3K4me3 changes. Thus we find that within the first two days of flower initiation, gene activation is dominated by deposition of H3K4me3, while strong reduction of H3K27me3 occurs at later stages. Together, our integrative analysis of histone marks and transcriptome provides a novel view on the mechanisms of gene regulation at the chromatin level.
2. Results
2.1. RNA-seq reveals specific changes in gene expression during the developmental time series
To assess the correlation between changes in expression patterns and dynamics of histone marks during early flower development, we employed the ap1cal 35S::AP1-GR floral induction system introduced in Wellmer et al. (2006) [Wellmer, 2006 #2210] (Fig. 1A; Supplementary Fig. 1). This system allows harvesting synchronized flower buds along a developmental time course and insures (i) tissue homogeneity along the developmental time course as well as (ii) sampling in sufficient amounts for ChIP [Kaufmann, 2010 #1342;Smaczniak, 2012 #1999;Pajoro, 2014 #1736].
The early time points we chose cover early flower development during which flower buds emerge from the inflorescence meristem and further initiate the flower patterning program. During this period, cells undergo fate transitions, being first re-allocated a flower stem cell fate, followed by differentiation into founder cells for specific floral organs. A suitable time point to study the early events of flower formation is one at which (i) changes in expression are already detectable for important regulators of flower development and (ii) floral organ identity genes did not reach their full expression level, to enable observation of transition states from repression to activation. In our experimental setup, two days after induction (t2) stands as the appropriate time point for investigating activation of floral organ identity genes and at which FM identity is still present (Fig. 1B, [Smaczniak, 2012 #1999]). Moreover we previously showed using ChIP-PCR, that reduction of repressive H3K27me3 marks at the SEP3 locus is detectable at t2 [Smaczniak, 2012 #1999] and thus decided to perform ChIP-seq for H3K27me3 and H3K4me3 and RNA-seq on a tissue series consisting of wild-type leaf (L) and inflorescence (I), and ap1cal 35S::AP1-GR t0 and t2 samples.
Clustering analysis of expression data for selected floral regulators (flowering time, flower development) showed the presence of five major patterns of expression during the series (Fig. 1C-E). The assignment of the genes to the clusters revealed that the observed expression patterns are in accordance with known functions of floral regulator genes. It also confirms the t2 time-point as an intermediate stage during the activation of floral organ and meristem identity genes (Supplementary Text 1).
Genome-wide analysis of differentially expressed genes (DEG) showed that most genes changed from L to I, emphasizing the different nature of the two tissues. 251 genes are up-regulated from t0 to t2, among them many developmental regulators like SEP2, SEP3, FLOWERING LOCUS T (FT), UNUSUAL FLORAL ORGANS (UFO), AP3, AG, PI, AGAMOUS-LIKE 15 (AGL15), LFY and CUC1, while 448 are down-regulated (Table 1, Supplementary Table 1). K-means clustering and Gene Ontology (GO) analysis revealed that the gene expression is highly dynamic throughout the series and correlates with expected functionality of the tissues on a genome-wide scale (Supplementary Text 2. and 3.). Thus RNA-seq analysis demonstrates transcriptome dynamics throughout the tested tissue series and validates the suitability of the selected tissue types and time-points to study the influence of chromatin marks on genome expression.
2.2. Meristem and differentiated tissues share similar over-all distribution of H3K27me3 and H3K4me3 marks
We performed quantitative ChIP-seq analysis for repression-associated H3K27me3 and activation-associated H3K4me3 marks in the same tissue samples as employed for the transcriptome
Preprints (www.preprints.org) | NOT PEER-REVIEWED | Posted: 8 May 2017 doi:10.20944/preprints201705.0070.v1
Peer-reviewed version available at Epigenomes 2017, 1, 8; doi:10.3390/epigenomes1020008

4 of 32
analysis (L, I, t0 and t2) (Supplementary Text 4.). The average expression values of H3K27me3 target genes are lower compared to all Arabidopsis genes, while H3K4me3 target genes display a higher average expression. This is true for all analysed tissue types and in accordance with H3K27me3 and H3K4me3 being associated with repressed and active expression states, respectively (Supplementary Table 3).
Mark abundance distributions over loci for both marks match with previous descriptions [Zhang, 2007 #2333;Oh, 2008 #2408;Zhang, 2009 #2335;Roudier, 2011 #2385]: H3K27me3 is spread over the whole transcribed region, into the promoter and the 3' UTR, while H3K4me3 is more concentrated to the TSS, covering the proximal promoter and the 5' region of the gene (Fig. 2A, Supplementary Fig. 7). These overall distributions are observed for all tissues including the meristematic stages t0 and t2, indicating that plant inflorescence meristems share similar H3K27me3 and H3K4me3 marking with differentiated cells.
When sorted by H3K4me3 abundance and assessed for transcription in the four tissues (Fig.2A), three main groups of genes emerge: First, highly expressed H3K4me3-marked genes with a strong correlation between expression levels and both intensity and spread of the H3K4me3 signal. Second, lowly expressed genes that carry low H3K4me3 levels and high H3K27me3 levels. Many genes in this group display higher expression in the differentiated L and I samples than in the meristematic tissue. This is in line with the previous observation that expression patterns of H3K27me3 target genes are more tissue specific than other genes [Zhang, 2007 #2503]. Third, genes with low marking in both marks. Interestingly, this is the group of genes with the lowest expression, probably representing genes carrying other repressive marks like DNA methylation or H3K9me2.
2.3. H3K27me3 and H3K4me3 levels are highly dynamic over the time series, in accordance with tissue functionality
Determination of differentially marked genes (DMGs) for the L-t0, L-I, t0-t2, t0-I and t2-I comparisons revealed that quantitative changes in H3K27me3 and H3K4me3 marks affect thousands of genes (Fig. 2C, Supplementary Table 4). In the case of very different tissue types (L-t0 or L-I), changes affect more than 60 % (H3K27me3) or 45 % (H3K4me3) of the corresponding target genes, respectively. Noticeably, the vast majority of genes showing an elevation of any of the two marks from L to t0 shows a reduction of the same mark from t0 or t2 to I, and vice versa (Supplementary Table 4), indicating that these changes are meristem specific.
For several hundred genes we detected changes in both antagonistic marks in opposite directions (H3K27me3 elevated and H3K4me3 reduced or vice-versa), while only few genes (none for the t0-t2 comparison) are changed in the same direction for both marks (Supplementary Table 4).
The examples of histone mark distribution over the SEP1 and SEP2 loci for t0, t2 and I (Fig. 2B) indicate that the changes, especially affecting H3K27me3, are subtle but span a wide range of the marked region.
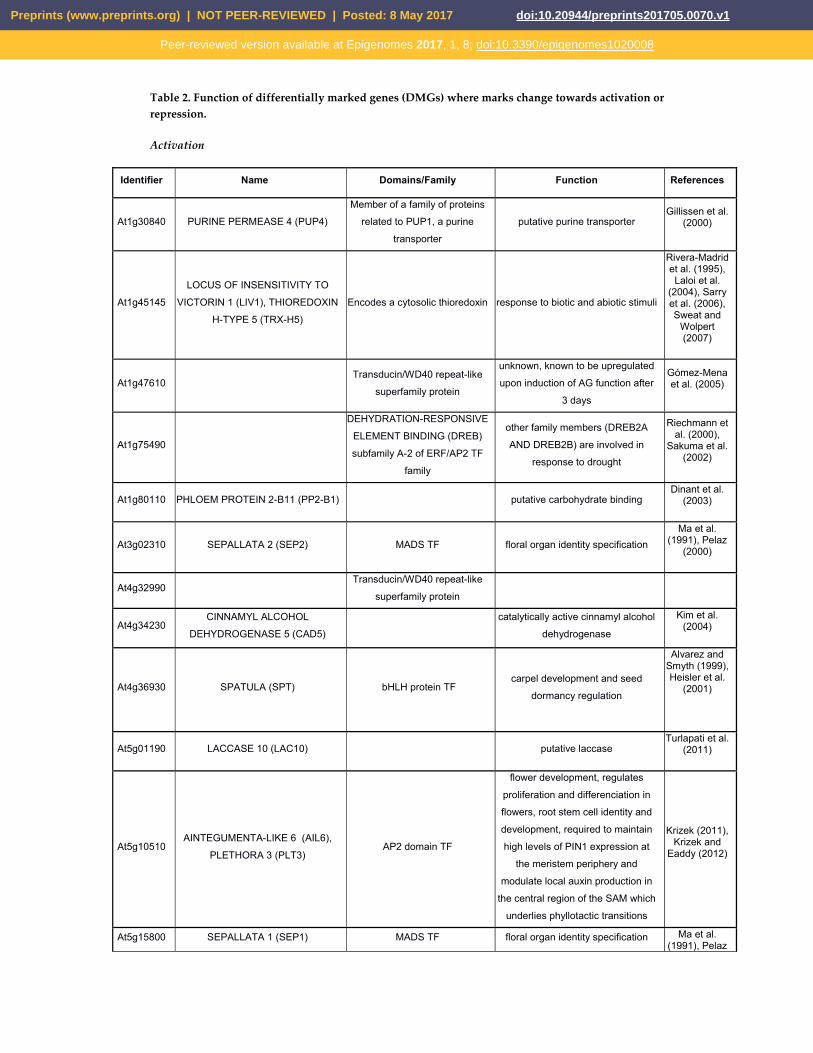
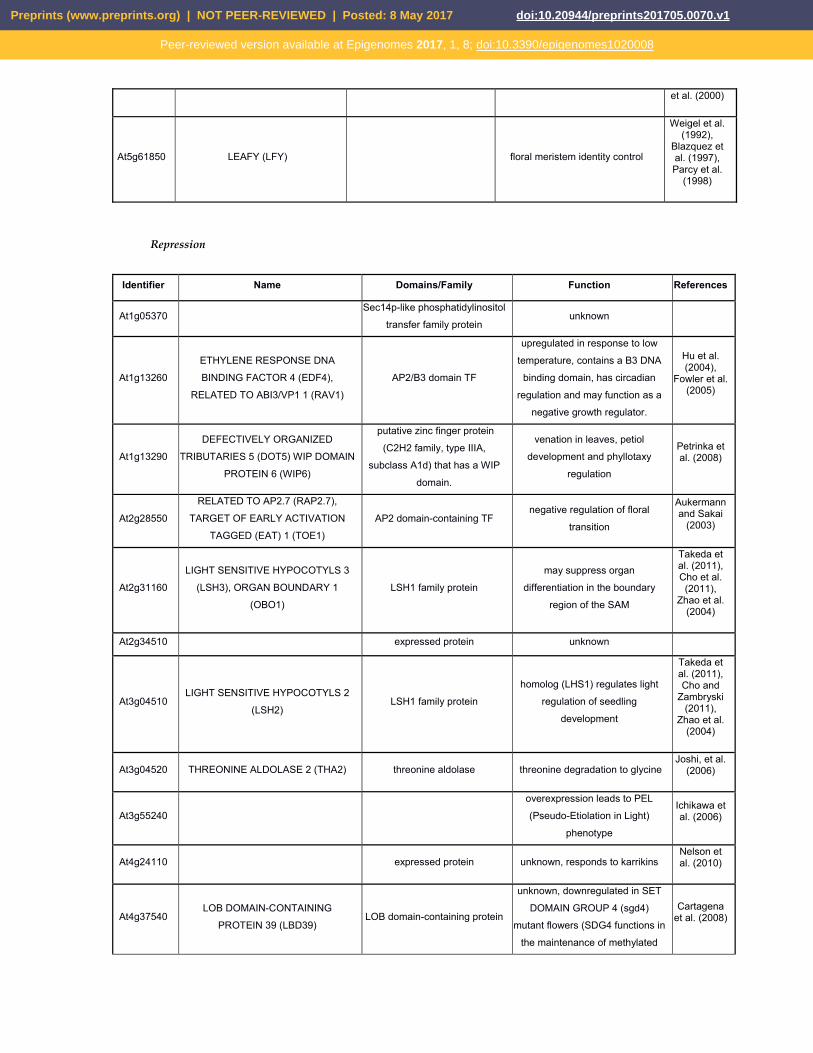
Our quantitative analysis allowed to specifically identify genes with marks changing in the two first days of flower initiation, from t0 to t2 (early flower morphogenesis). Among these, 13 DMGs change in both marks towards activation (H3K27me3 reduced, H3K4me3 elevated) and 15 towards repression (H3K27me3 elevated, H3K4me3 reduced). These changes relate to coordinated activation or repression of key genes for flower development (Supplementary text 5).
A GO analysis further revealed that the functions of the H3K27me3 and H3K4me3 DMGs in the series correlate with the functionality of the tissues at the analysed time-points (Supplementary Text 6).
2.4. DMGs largely overlap with DEGs and histone mark changes are stronger among DEGs
Preprints (www.preprints.org) | NOT PEER-REVIEWED | Posted: 8 May 2017 doi:10.20944/preprints201705.0070.v1
Peer-reviewed version available at Epigenomes 2017, 1, 8; doi:10.3390/epigenomes1020008

5 of 32
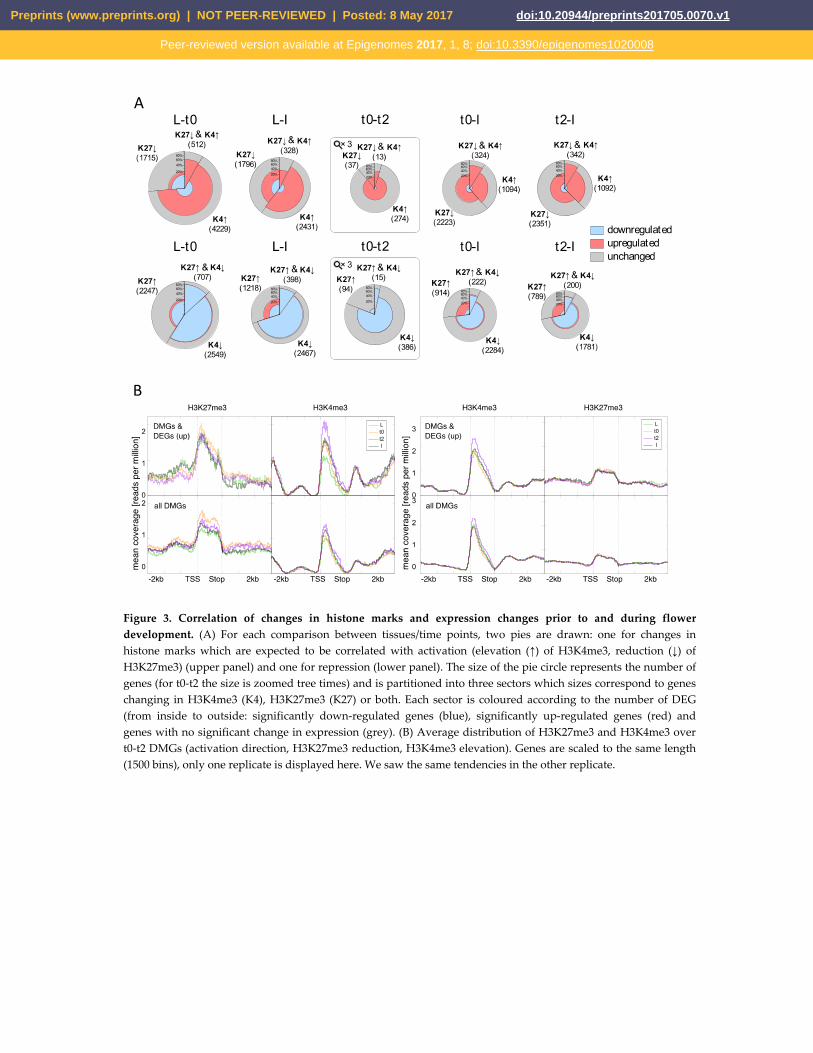
To evaluate if changes in repressive or active histone marks correlate with changes in expression of the corresponding loci, we determined the fractions of differentially up- and down-regulated genes that display changes in histone mark abundance (Fig. 3A).
For most comparisons, including all for H3K4me3, expression changes occur more frequently in the expected direction (up-regulation for elevated H3K4me3 and reduced H3K27me3 and vice-versa). This is especially true when comparing t0 to t2. In all cases, the number of DEG in the expected direction is significantly higher among DMGs than for all targets (based on a hypergeometric distribution with probability cut-off of 0.01). With the exception of the L to I comparison, DMGs in both marks display a higher percentage of DEGs compared to DMGs in one mark. These findings are significant for all cases in the expected direction with the exception of t0-t2 in the activation direction (based on a hyper-geometric distribution with probability cut-off of 0.01), indicating that combined changes in both marks are more prone to coincide with changes in transcriptional activity.
Since transcription is initiated by the assembly of the pre-initiation complex (PIC) near the transcription start site (TSS) of a gene, histone marks might primarily change at this region to allow activation or repression of transcription. We thus analysed the marks average distribution along the locus for genes displaying changes during induction of flower development (DMG from t0 to t2 or I) (Figs. 3B and S7). The t0-t2 and t0-I differences are clearly visible among the DMGs and occur rather uniformly over the covered regions than locally, except for a stronger change at the peak close to the TSS for H3K4me3 in the t0-t2 activation comparison. Changes in H3K4me3 are stronger when DEG subsets are considered, while for H3K27me3 this is only true for the t0-I activated genes and the t0-t2 repressed genes.
Notably, DMGs in one mark (regardless if H3K27me3 or H3K4me3) show a higher abundance of the other mark compared to all target genes, and especially DMGs changing in expression. This indicates that these DMGs genes are in a transition state. For H3K27me3 DMGs genes, a change in H3K4me3 abundance is visible in the opposite direction for all comparisons, and this change is stronger for genes changing in expression. This is in accordance with our observation that genes changing in both marks more frequently display changes in expression than genes changing in one mark.
Taken together, our analysis of DMGs and DEGs established a relation between H3K27me3/H3K4me3 dynamics and changes in transcriptional states during flower development. Furthermore, it shows that during early stages of flower morphogenesis, H3K4me3 dynamics affects more genes and is in general more strongly correlated with transcriptional changes than H3K27me3 dynamics.
2.5. Expression changes during early flower morphogenesis quantitatively correlate with changes in H3K4me3 while changes in H3K27me3 mostly occur after prolonged expression changes
Next, we aimed to test for a quantitative correlation between histone mark changes and expression changes. For this, we mainly focused our analysis on the genes changing during early flower morphogenesis (t0 to t2) as these constitute the most homogenous tissue samples, and because genes changing in this time frame are highly dynamic and comprise many important developmental regulators. A clear correlation was observed between H3K4me3 changes and expression changes: mark changes are of higher intensity, of wider spread, and greater towards the TSS for genes with stronger expression changes (Fig. 4A).
As H3K4me3 changes are on average slightly stronger at the TSS, we further considered all DEGs that change early but remain DEGs in the same direction for the t0 to I comparison, thus allowing to follow activation at early and later stages. For those genes, we analysed the average distribution of changes from t0 to t2 and I and t2 to I over the locus (Supplementary Fig. 8). A clear shift from the TSS towards further downstream region is visible from early to late changes for up-regulated genes, indicating that H3K4me3 changes occur mainly at the TSS during early activation but then spread more into the locus. For down-regulation, the opposite effect is observed but less pronounced.
Preprints (www.preprints.org) | NOT PEER-REVIEWED | Posted: 8 May 2017 doi:10.20944/preprints201705.0070.v1
Peer-reviewed version available at Epigenomes 2017, 1, 8; doi:10.3390/epigenomes1020008

6 of 32
For H3K27me3, no correlation between expression changes and mark changes is observed for all DEGs from t0 to t2. This could be due to only some of the DEGs being H3K27me3 targets, while H3K4me3 marks target a broader range of genes. Therefore, we considered only those among the early DEGs that are H3K27me3 targets. We again could observe only a slight preference for changes in the expected direction and no correlation with the intensity in expression change (Fig. 4B). Only when considering H3K27me3 target genes that had been up- or down-regulated for a longer time (i.e. DEGs which expression changed early but remained in the same direction for the t0 to I comparison), we could observe a clear prevalence of changes in the expected direction (Fig. 4C). Especially for activated genes of this category, the H3K27me3 signal changes over the whole locus including the promoter region for most genes and the change is more pronounced for genes with higher expression changes. This indicates that changes in H3K27me3 rather occur after prolonged changes in expression and is in accordance with a low number of H3K27me3 DMGs during early flower morphogenesis. However, there are some changes in H3K27me3 already observed for the t0 to t2 comparison (e.g. the MADS developmental regulators SEP1-3). We hypothesised that these genes might be very early activated/repressed genes. Indeed, we found that most DEGs with high average H3K27me3 change in the expected direction displayed already an increase/decrease in expression during the first day of flower development as determined by Wellmer et al. (2006) [Wellmer, 2006 #2210] (Supplementary Fig. 9).
Taken together, during flower morphogenesis, we observe that H3K4me3 dynamics are strongly predictive of expression changes, while H3K27me3 changes are rather predicted by already on-going transcriptional changes (Supplementary text 7).
2.6. Early activation of PcG target genes is dominated by H3K4me3 changes
Many regulators of flower development are known to be H3K27me3 targets and regulated by antagonising trxG and PcG factors [Zhang, 2007 #2503;Gan, 2013 #198]. Therefore, we were interested to see whether changes in genes that will eventually significantly loose H3K27me3 and gain H3K4me3 are also dominated by H3K4me3 dynamics during early flower morphogenesis. We analysed DMGs that are targets of H3K27me3 at t0 in more details (Fig. 4D). Of these 8273 H3K27me3 target genes, 2776 become differentially methylated in one of the marks or both during flower morphogenesis i.e. from t0 to t2 and/or from t0 to I. The majority of them show only reduction in H3K27me3 (2221 genes), while 210 show only elevation in H3K4me3. The 345 genes that show a change in both marks are suitable to address the question of which mark is changed first. We thus further considered the sub-population of these 345 genes, which show changes in marks during early activation, i.e. from t0 to t2 (48 genes). Among these, the proportions of changes in marks are inverted compared to all genes changing during flower morphogenesis: 6 genes change only in H3K27me3, 13 change in both marks (corresponding to the 13 genes discussed above and mentioned in Table 2) and the majority (29 genes) changes only in H3K4me3. This again indicates that during initiation of flower development (t0-t2) genes carrying H3K27me3 can display an increase in H3K4me3 without significantly changing in their H3K27me3 level within the observed tissue. Such effects have been shown also for stress-induced transcription at single gene level [Liu, 2014 #2510]. On the other hand, only few genes display a reduction in H3K27me3 without significant changes in H3K4me3.
2.7. Relative dynamics of histone marks, MADS TF binding and chromatin opening during early stages of gene activation
Since flower morphogenesis is mainly regulated by activation of ABC(D)E genes, and especially MADS domain TFs, we were interested in the correlation between MADS binding to chromatin [Pajoro, 2014 #1736] and histone mark changes (this study). We thus analysed the fractions of t0-t2 DMGs, which are targets of the MADS TFs SEP3 and AP1 in the floral induction system as determined by Pajoro et al. (2014) [Pajoro, 2014 #1736] at two, four and eight days after induction (Fig. 5,
Preprints (www.preprints.org) | NOT PEER-REVIEWED | Posted: 8 May 2017 doi:10.20944/preprints201705.0070.v1
Peer-reviewed version available at Epigenomes 2017, 1, 8; doi:10.3390/epigenomes1020008

7 of 32
Supplementary Fig. 11A). At t2, slightly more than 20 % of genes with reduced H3K27me3 or elevated H3K4me3 are targeted by the MADS TFs, while almost 40 % of the genes changing in both marks are. At t4, the percentage of genes being MADS targets raises to around 60 % for those changing in a single mark and to more than 90 % for those changing in both marks (12 of 13 genes are MADS targets at t4). Towards t8 only minute changes occur in this distribution. These percentages of DMGs bound by the MADS TFs are higher than that observed for all H3K27me3 or H3K4me3 target genes: only 6.7 % of H3K27me3 (8.9 % for H3K4me3) target genes are MADS targets at t2, increasing to 23.4 % (33 % H3K4me) at t4 and 26.9 % (35.7 % H3K4me3) at t8.
As MADS TFs were proposed to assist in opening chromatin, we analysed if the genes changing in histone marks from t0 to t2 would also change in their chromatin conformation as determined in Pajoro et al. (2014) [Pajoro, 2014 #1736] by assessing DNase I hypersensitivity (DHS, Fig. 5, Supplementary Fig. 11B). Interestingly, about 40% or 60% of those DMGs are already located in DNase I hypersensitive (accessible) regions at t0. This is quite unchanged in t2 and the percentage of genes in open regions only increases slightly towards t4 and more towards t8. MADS binding seems to mainly affect other, still closed genes at t2, while a larger overlap between MADS binding and DHS is observed at t4 and even more at t8 (Fig. 5).
This dataset comparison indicates that the majority of genes changing in H3K27me3 and H3K4me3 histone marks during early steps of flower morphogenesis are targets of the floral organ identity regulators SEP3 and AP1, and that binding of these MADS TFs occurs at the same time as histone mark changes or slightly later. Furthermore, it would appear as if opening of previously closed chromatin occurs rather after histone mark changes and MADS binding.
Preprints (www.preprints.org) | NOT PEER-REVIEWED | Posted: 8 May 2017 doi:10.20944/preprints201705.0070.v1
Peer-reviewed version available at Epigenomes 2017, 1, 8; doi:10.3390/epigenomes1020008

8 of 32
2.8. Figures and Tables
Figure 1. Experimental setup and assessment of the floral induction system. (A) Tissue types and time-points employed in the study. dai: days after induction. DEX: dexamethasone. (B) RT-PCR analysis of expression of the MADS floral genes AG, SEP3, AP3, as well as the flower marker gene LFY and the inflorescence and flower marker gene ULTRAPETALA1 (ULT1), at t0, 6 hours (t=6h) and 2days (t2) after DEX induction. EF1α is used as internal control. Wild-type (WT) leaf tissue serves as control state in which floral organ identity genes are not expressed (L). Cauliflower-like inflorescences of ap1cal mutant plants (ac) serve as control on the inherent leakage of the induction system. Dissected WT inflorescences contain flowers up to stage 12 (I). The expression analysis showed no or only very low expression of AP3, AG, and SEP3 homeotic genes prior to dexamethasone application, validating the experimental conditions. Strong up-regulation of MADS floral genes occurs at t2 and not at 6h after induction. Red arrows point at the samples analysed by RNA-seq and ChIP-seq in this study. (C) Hierarchical clustering analysis for expression patterns of selected floral organ regulators, determined by RNA-seq. Relative expression values are expressed as z-scores to reveal similarities in expression patterns. Z-scores are represented by a heat map from blue (low expression in comparison to the other tissues) to red (high expression in comparison to the other tissues). Five major groups are visible. (D) Result of K-means clustering analysis with k=5 to generate an overview of expression profiles in the five clusters marked in C. The grey lines represent the single genes in the cluster. Averages of z-scores in each cluster are depicted in red. (E) Detailed view of each cluster showing normalised absolute expression values in a heat map from yellow (no expression) to red (highest expression). The black dot indicates the highest expression value reached by a gene in the sample series. The highest displayed expression value corresponds to the highest observed value in the set (SOC1, L sample, with the exception of AP1, which is expressed from the 35S::AP1-GR transgene).
ap1cal 35S::AP1-GR floral induction system
RNA extraction for gene expression (RNA-seq)
Chromatin Immuno-precipitation for histone marks (ChiP-seq)
Final induction product ap1cal
L ac t0 t2 I
Leaf
t0 t=2dai +Dex
A" B"
AG
EF1α″
AP3
SEP3
LFY
ULT1
t2 t=6h t0
WT
L I
ap1cal AP1-GR
ac
C" D"
E"
Preprints (www.preprints.org) | NOT PEER-REVIEWED | Posted: 8 May 2017 doi:10.20944/preprints201705.0070.v1
Peer-reviewed version available at Epigenomes 2017, 1, 8; doi:10.3390/epigenomes1020008

9 of 32
Figure 2. Genome-wide H3K27me3 and H3K4me3 distribution over loci and quantitative changes in H3K27me3 or/ and H3K4me3 marks in the tissue series. (A) Heat maps showing expression values and H3K4me3 and H3K27me3 abundance for all Arabidopsis genes in all four tissues of the developmental series. Genes are ordered by the average H3K4me3 signal over the gene (transcription start site (TSS) to transcription stop). (B) Genome browser view of H3K27me3 and H3K4me3 distribution on the SEP1 and SEP2 loci in ap1cal 35S::AP1-GR at t0, t2 and in fully expanded inflorescences. Pictures are generated from one replicate. (C) Numbers of significantly differentially marked genes (DMG) for H3K27me3 and H3K4me3.
A"
B"
C"
Preprints (www.preprints.org) | NOT PEER-REVIEWED | Posted: 8 May 2017 doi:10.20944/preprints201705.0070.v1
Peer-reviewed version available at Epigenomes 2017, 1, 8; doi:10.3390/epigenomes1020008
10 of 32
Figure 3. Correlation of changes in histone marks and expression changes prior to and during flower development. (A) For each comparison between tissues/time points, two pies are drawn: one for changes in histone marks which are expected to be correlated with activation (elevation (↑) of H3K4me3, reduction (↓) of H3K27me3) (upper panel) and one for repression (lower panel). The size of the pie circle represents the number of genes (for t0-t2 the size is zoomed tree times) and is partitioned into three sectors which sizes correspond to genes changing in H3K4me3 (K4), H3K27me3 (K27) or both. Each sector is coloured according to the number of DEG (from inside to outside: significantly down-regulated genes (blue), significantly up-regulated genes (red) and genes with no significant change in expression (grey). (B) Average distribution of H3K27me3 and H3K4me3 over t0-t2 DMGs (activation direction, H3K27me3 reduction, H3K4me3 elevation). Genes are scaled to the same length (1500 bins), only one replicate is displayed here. We saw the same tendencies in the other replicate.
Preprints (www.preprints.org) | NOT PEER-REVIEWED | Posted: 8 May 2017 doi:10.20944/preprints201705.0070.v1
Peer-reviewed version available at Epigenomes 2017, 1, 8; doi:10.3390/epigenomes1020008

11 of 32
Figure 4. Quantitative correlation of histone mark and transcriptional dynamics and H3K4me3 dynamics domination during early flower morphogenesis. (A-C) Heat maps displaying the average change in histone mark abundance (in reads per million) calculated as the difference between the earlier and the later compared time point in 200bp windows/ 10% bins over the gene (i.e. t2 minus t0 or I minus t0). Each line in the heat map represents a DEG, genes are sorted by their difference in expression value (t2 minus t0 or I minus t0) starting with the strongest up- or down regulated gene, respectively. (D) Flow chart of histone marks and expression changes during activation of H3K27me3 targets in the process of flower morphogenesis. Only genes marked with repressive H3K27me3 marks at t0 are considered. The upper Venn-diagram shows all genes changing during flower morphogenesis (that is genes that change either from t0 to t2, t0 to I or both) with fraction of those genes changes in expression (dark red numbers in ()), in H3K27me3 (blue fraction), in H3K4me3 (red fraction) or both (orange). The lower Venn-diagram shows all genes that change in both marks (345 genes) which already show activation related changes in marks and expression from t0 to t2.
B"
A" C"
D"
changing during flower morphogenesis
Preprints (www.preprints.org) | NOT PEER-REVIEWED | Posted: 8 May 2017 doi:10.20944/preprints201705.0070.v1
Peer-reviewed version available at Epigenomes 2017, 1, 8; doi:10.3390/epigenomes1020008

12 of 32
Figure 5. Correlation of genome-wide changes in histone marks from t0 to t2, binding of MADS TFs and Dnase hypersensitivity during early flower development. Fractions of DMGs for H3K27me3, H3K4me3 and both marks from t0 to t2 (K27 down: H3K27me3 reduced t0-t2, K4 up: H3K4me3 elevated t0-t2, both: H3K27me3 reduced and H3K4me3 elevated t0-t2) that are bound by MADS TFs (AP1 and/or SEP3) and/or overlap with DNase I hypersensitive sites (DHS) during early flower development. TF binding at three time points after dex-induction was considered: t2, t4 and t8, while DHS was additionally considered at t0 (Pajoro et al., 2014).
Figure 6. Model for gene activation during flower morphogenesis, showing changes in H3K4me3 and H3K27me3 chromatin marks, pioneer transcription factor binding (PTFB) and DNA accessibility (DHS). The dotted vertical grey lines mark the TSS (left) and the Stop (right) positions.
Table 1. Numbers of differentially expressed genes (DEGs). Numbers of DEGs found in the different comparisons between tissues/ time points and their overlap with each other. The grey diagonal displays the number of DEGs in one comparison, the white fields indicate the overlap with respective other comparisons.
H3K27me3(
H3K4me3(
t2#t0# I#
expression(
1meline(
PTFB( DHS(
Preprints (www.preprints.org) | NOT PEER-REVIEWED | Posted: 8 May 2017 doi:10.20944/preprints201705.0070.v1
Peer-reviewed version available at Epigenomes 2017, 1, 8; doi:10.3390/epigenomes1020008

13 of 32
Activation
L<I L<t0 L<t2 t0<I t2<I t0<t2
L<I 4910
L<t0 2835 4215
L<t2 2832 3865 4246
t0<I 1496 154 181 3915
t2<I 1581 188 144 3252 4530
t0<t2 96 61 118 131 59 251
Repression
L>I L>t0 L>t2 t0>I t2>I t0>t2
L>I 4629
L>t0 3913 5683
L>t2 3966 5170 5964
t0>I 186 65 98 1252
t2>I 145 54 40 930 1365
t0>t2 194 199 281 105 33 448
Preprints (www.preprints.org) | NOT PEER-REVIEWED | Posted: 8 May 2017 doi:10.20944/preprints201705.0070.v1
Peer-reviewed version available at Epigenomes 2017, 1, 8; doi:10.3390/epigenomes1020008
14 of 32
Table 2. Function of differentially marked genes (DMGs) where marks change towards activation or repression.
Activation
Identifier Name Domains/Family Function References
At1g30840 PURINE PERMEASE 4 (PUP4) Member of a family of proteins
related to PUP1, a purine
transporter putative purine transporter
Gillissen et al. (2000)
At1g45145 LOCUS OF INSENSITIVITY TO
VICTORIN 1 (LIV1), THIOREDOXIN
H-TYPE 5 (TRX-H5) Encodes a cytosolic thioredoxin response to biotic and abiotic stimuli
Rivera-Madrid et al. (1995), Laloi et al.
(2004), Sarry et al. (2006), Sweat and
Wolpert (2007)
At1g47610 Transducin/WD40 repeat-like
superfamily protein
unknown, known to be upregulated
upon induction of AG function after
3 days
Gómez-Mena et al. (2005)
At1g75490
DEHYDRATION-RESPONSIVE
ELEMENT BINDING (DREB)
subfamily A-2 of ERF/AP2 TF
family
other family members (DREB2A
AND DREB2B) are involved in
response to drought
Riechmann et al. (2000),
Sakuma et al. (2002)
At1g80110 PHLOEM PROTEIN 2-B11 (PP2-B1) putative carbohydrate binding Dinant et al.
(2003)
At3g02310 SEPALLATA 2 (SEP2) MADS TF floral organ identity specification Ma et al.
(1991), Pelaz (2000)
At4g32990 Transducin/WD40 repeat-like
superfamily protein
At4g34230 CINNAMYL ALCOHOL
DEHYDROGENASE 5 (CAD5)
catalytically active cinnamyl alcohol
dehydrogenase Kim et al.
(2004)
At4g36930 SPATULA (SPT) bHLH protein TF carpel development and seed
dormancy regulation
Alvarez and Smyth (1999), Heisler et al.
(2001)
At5g01190 LACCASE 10 (LAC10) putative laccase Turlapati et al.
(2011)
At5g10510 AINTEGUMENTA-LIKE 6 (AIL6),
PLETHORA 3 (PLT3) AP2 domain TF
flower development, regulates
proliferation and differenciation in
flowers, root stem cell identity and
development, required to maintain
high levels of PIN1 expression at
the meristem periphery and
modulate local auxin production in
the central region of the SAM which
underlies phyllotactic transitions
Krizek (2011), Krizek and
Eaddy (2012)
At5g15800 SEPALLATA 1 (SEP1) MADS TF floral organ identity specification Ma et al. (1991), Pelaz
Preprints (www.preprints.org) | NOT PEER-REVIEWED | Posted: 8 May 2017 doi:10.20944/preprints201705.0070.v1
Peer-reviewed version available at Epigenomes 2017, 1, 8; doi:10.3390/epigenomes1020008
15 of 32
et al. (2000)
At5g61850 LEAFY (LFY) floral meristem identity control
Weigel et al. (1992),
Blazquez et al. (1997), Parcy et al.
(1998)
Repression
Identifier Name Domains/Family Function References
At1g05370 Sec14p-like phosphatidylinositol
transfer family protein unknown
At1g13260 ETHYLENE RESPONSE DNA
BINDING FACTOR 4 (EDF4),
RELATED TO ABI3/VP1 1 (RAV1) AP2/B3 domain TF
upregulated in response to low
temperature, contains a B3 DNA
binding domain, has circadian
regulation and may function as a
negative growth regulator.
Hu et al. (2004),
Fowler et al. (2005)
At1g13290 DEFECTIVELY ORGANIZED
TRIBUTARIES 5 (DOT5) WIP DOMAIN
PROTEIN 6 (WIP6)
putative zinc finger protein
(C2H2 family, type IIIA,
subclass A1d) that has a WIP
domain.
venation in leaves, petiol
development and phyllotaxy
regulation
Petrinka et al. (2008)
At2g28550 RELATED TO AP2.7 (RAP2.7),
TARGET OF EARLY ACTIVATION
TAGGED (EAT) 1 (TOE1) AP2 domain-containing TF
negative regulation of floral
transition
Aukermann and Sakai
(2003)
At2g31160 LIGHT SENSITIVE HYPOCOTYLS 3
(LSH3), ORGAN BOUNDARY 1
(OBO1) LSH1 family protein
may suppress organ
differentiation in the boundary
region of the SAM
Takeda et al. (2011), Cho et al. (2011),
Zhao et al. (2004)
At2g34510 expressed protein unknown
At3g04510 LIGHT SENSITIVE HYPOCOTYLS 2
(LSH2) LSH1 family protein
homolog (LHS1) regulates light
regulation of seedling
development
Takeda et al. (2011), Cho and
Zambryski (2011),
Zhao et al. (2004)
At3g04520 THREONINE ALDOLASE 2 (THA2) threonine aldolase threonine degradation to glycine Joshi, et al.
(2006)
At3g55240 overexpression leads to PEL
(Pseudo-Etiolation in Light)
phenotype
Ichikawa et al. (2006)
At4g24110 expressed protein unknown, responds to karrikins Nelson et al. (2010)
At4g37540 LOB DOMAIN-CONTAINING
PROTEIN 39 (LBD39) LOB domain-containing protein
unknown, downregulated in SET
DOMAIN GROUP 4 (sgd4)
mutant flowers (SDG4 functions in
the maintenance of methylated
Cartagena et al. (2008)
Preprints (www.preprints.org) | NOT PEER-REVIEWED | Posted: 8 May 2017 doi:10.20944/preprints201705.0070.v1
Peer-reviewed version available at Epigenomes 2017, 1, 8; doi:10.3390/epigenomes1020008

16 of 32
histone H3 K4 and K36 levels)
At5g06380 expressed protein unknown
At5g28490 LIGHT-DEPENDENT SHORT
HYPOCOTYLS 1 (LSH1), ORGAN
BOUNDARY 2 (OBO2) LSH1 family protein
light regulation of seedling
development in a phytochrome-
dependent manner
Takeda et al. (2011), Cho and
Zambryski (2011),
Zhao et al. (2004)
At5g44190 GBF'S PRO-RICH REGION-
INTERACTING FACTOR 2 (GPRI2),
GOLDEN2-LIKE 2 (GLK2) GOLDEN2-like TF
regulation of chloroplast
development in a cell-
autonomous manner, regulation
of the expression of the
photosynthetic apparatus,
negative regulation of floral
transition
Waters et al. (2008)
At5g49360 BETA-XYLOSIDASE 1 (BXL1) glycosyl hydrolase family 3
protein
Encodes a bifunctional {beta}-D-
xylosidase/{alpha}-L-
arabinofuranosidase required for
pectic arabinan modification.
Located in the extracellular
matrix. Gene is expressed
specifically in tissues undergoing
secondary wall thickening and
involved in seed germination.
Arsovski et al. (2009)
3. Discussion
3.1. Chromatin marks are highly dynamic and tissue fate-associated during flower morphogenesis
Several mutants in PcG and trxG components display defects in initiation of flowering and in floral architecture [Chahtane, 2017 #2407]. Moreover, almost all floral organ identity genes and many flowering time regulators are targeted by H3K27me3, and detailed studies at single gene level (e.g. FT and FLOWERING LOCUS C) have shown that activation of these genes is accompanied by histone mark dynamics. These facts led to the assumption that PcG-associated H3K27me3 and trxG-associated H3K4me3 dynamics operate at the onset of flowering and flower development, affecting a wide range of target genes. However, the extent of the chromatin marks remodelling remained unknown. Through the floral induction system we were able to generate a genome-wide map of dynamics in histone mark abundance and of transcriptional activity, during early steps of flower development. Our study demonstrates that histone mark dynamics between vegetative and reproductive structure, and during flower initiation and morphogenesis truly exists and affects a total of 14826 genes (changed at least in one mark in one comparison, Tab S4) in Arabidopsis thaliana.
Several thousands of genes changed in histone marks from leaf towards inflorescence meristems and then changed in the opposite direction from inflorescence meristems towards fully expanded inflorescences. This indicates that histone marks antagonistically change in the different tissue types according to the underlying meristematic activities. These reverted patterns of histone mark changes throughout the time series thus likely reflect the chromatin features of differentiated versus meristem-like tissues and highlight the continuous and iterative mode of plant development.
Preprints (www.preprints.org) | NOT PEER-REVIEWED | Posted: 8 May 2017 doi:10.20944/preprints201705.0070.v1
Peer-reviewed version available at Epigenomes 2017, 1, 8; doi:10.3390/epigenomes1020008

17 of 32
3.2. Integrative analysis of chromatin and transcription datasets brings new insights on the mechanistic of gene activation, revealing unexpected order of events
Combination of the transcriptomics and chromatin dynamics datasets revealed that changes in histone marks are widely correlated with changes in expression in the anticipated direction. Especially, changes in both marks are more prone to coincide with expression changes.
The temporal resolution brought by our dataset revealed that activation of a locus does rather not follow the canonically assumed order of events, with repressive marks being removed and active marks being added during transcriptional activation. Some studies had challenged this view in the past, at single gene level in plants. They report that transcription can take place while repressive marks are still present, and reduction in these marks was proposed to rather be a consequence of expression of the target gene [Schubert, 2006 #1931;Adrian, 2010 #2508;Buzas, 2011 #2509]. Our genome-wide study shows that H3K4me3 is both quantitatively and temporally closely correlated with transcription changes, while changes in H3K27me3 most likely require prior transcriptional changes to occur (Fig. 6). This is resonant with the recent report in mouse that re-establishment of H3K4me3 occurs more rapidly than that of H3K27me3 during activation of the zygote genome [Liu, 2016 #1524]. In mammalian cells, deposition of H3K27me3 by PcG proteins is hindered by the presence of H3K4me3 [Schmitges, 2011 #1922]. If this would be the case in plants as well, deposition or removal of H3K4me3 would hinder or allow PcG proteins to access the respective histone and thus lead to decrease or increase in H3K27me3. In the case of removal of H3K27me3, that would require cell division to occur and thus could explain the temporal delay in H3K27me3 removal after gene activation. Moreover, we found that during flower formation, transcriptional activation events of PcG target genes are predominantly accompanied by changes in H3K4me3 while H3K27me3 marks remain at the loci, and only decline later during flower morphogenesis. This indicates that initiation of floral morphogenesis involves more activation than de-repression at the chromatin. The fact that decrease in H3K27me3 may be a consequence of gene transcription, could explain our observation of histone mark abundance changes over the complete gene body (even for a short t0-t2 transition) and the fact that genes changing in expression show a stronger change in histone mark abundance. On the other hand, early H3K4me3 changes are stronger at the TSS where the pre-initiation complex (PIC) is assembled during initiation of transcription.
Interestingly, genes changing in one histone mark display higher abundance of the respective other mark, even preceding the changes in one mark. This could indicate that these genes are kept in an intermediate state to allow fast regulation during development and raises the question whether active and repressive marks co-exist at a locus in a same cell on the same chromosome, at the time of flower bud initiation. Such so-called bivalent loci were described in the specific case of animal embryonic stem cells [Bernstein, 2006 #741] and more recently reported in plant studies using Arabidopsis seedlings [Luo, 2013 #2513;Sequeira-Mendes, 2014 #1955]. Thus far, we could not isolate bivalent states in inflorescence meristems and early developing flowers from the ap1cal 35S::AP1-GR tissue, by re-ChIP experiments. Whether they do not or very sporadically exist in a restricted amount of cells of the flower meristem, deserves to be further questioned in studies using technologies specifically designed for this purpose.
Finally, integrative analysis of histone marks, transcriptomics, profiling of MADS-domain proteins and chromatin accessibility, indicates that the majority of genes changing in H3K27me3 and H3K4me3 at early steps of flower morphogenesis are targets of the floral organ identity regulators SEP3 and AP1 and display local chromatin conformation change. Moreover, binding of the MADS-domain proteins occurs at the same time as histone mark changes or slightly later. This observation brings H3K4me3 and H3K27me3 dynamics at the forefront of molecular switches for gene expression, together with TFs that have been proposed to act as pioneer factors during flower development [Pajoro, 2014 #1736].
Preprints (www.preprints.org) | NOT PEER-REVIEWED | Posted: 8 May 2017 doi:10.20944/preprints201705.0070.v1
Peer-reviewed version available at Epigenomes 2017, 1, 8; doi:10.3390/epigenomes1020008

18 of 32
4. Materials and Methods
4.1. Plant material and growth conditions
All employed lines were in Landsberg erecta (Ler) ecotype background. AP1 and CAL double mutants (ap1-1 cal-1) [Bowman, 1993 #2515] and 35S::AP1:GR ap1-1 cal-1 [Wellmer, 2006 #2210] were described previously.
After 2-3 days of stratification at 4°C, plants were germinated on Murashige and Skoog medium supplemented with 0.3 % sucrose in growth cabinets (Percival) in a controlled environment in long days (LD) of 16 hours light at 18°C and 8 hours darkness at 16°C. At about ten days after germination, plants were transferred to a 1:1 mixture of soil/vermiculite.
4.2. Dexamethasone treatment and harvesting of plant material
The ap1cal 35S::AP1-GR system employs double mutants of the floral meristem identity genes AP1 and CAL. In ap1cal plants, inflorescence-meristem-like tissue over-proliferates while flower organogenesis does not proceed. A 35S::AP1-GR construct, for induction of flower development upon dexamethasone treatment, allows harvesting uniform tissue for synchronized floral stages, in sufficient amounts for ChIP [Kaufmann, 2010 #1342;Smaczniak, 2012 #1999;Pajoro, 2014 #1736]. To induce AP1 translocation to the nucleus, primary inflorescences of ap1cal 35S::AP1:GR plants were treated with induction solution (10 µM Dexamethasone, 0.015 % Silvet) by pipetting the solution directly onto the cauliflower structures. This process war repeated once after 30 min.
For harvesting of ap1cal and ap1cal 35S::AP1:GR samples, only the cauliflower structures of the main inflorescence were harvested. Leaf and pedicel tissue contamination was minimized by dissection. Samples were collected from untreated ap1cal (ac) and ap1cal 35S::AP1:GR (t0) tissue and ap1cal 35S::AP1:GR tissue 2 days after induction (t2). For inflorescence samples (I), whole main inflorescences of wild type plants were harvested. Flowers older than stage 12 were removed. For leaf (L) samples, rosette leaves of the same wild type plants were harvested. About 15 plants were harvested for one ChIP sample resulting in around 0.2-0.3 g of material for cauliflower and inflorescence tissues and 1-1.3 g for leaf tissue. For RNA samples, a fraction of 0.05-0.06 g for cauliflower and inflorescence tissues and 0.25 g for leaf tissue was taken from the sampling event. Replicates for biological sampling were grown independently (at different times) and harvested from the same groups of plants for ChIP-seq (two replicates) and RNA-seq (three replicates).
4.3. Scanning Electron Microscopy
For scanning electron microscopy [Bowman, 1989 #2516], untreated inflorescence-like meristems of ~4 week old ap1cal or ap1cal 35S:AP1-GR plants were harvested, as were 5 d-post dexamethasone-treated ap1cal 35S:AP1-GR inflorescence-like meristems, and fixed using 1% glutaraldehyde in 0.025 M sodium phosphate buffer. Samples were then washed three times with 0.025 M sodium phosphate and further dehydrated in gradually concentrated alcohol solutions. The material was then critical point dried in liquid carbon dioxide, mounted on stubs and coated with platinum. Imaging was performed using a Hitachi 5500 scanning electron microscope.
4.4. Chromatin immunoprecipitation
Formaldehyde cross-linking and extraction of nuclei was performed as described in [Carles, 2009 #838] with the following modifications: infiltration time was prolonged (6 min and 24 min), filtration of the extract after grinding was performed through 75 µm and 50 µm nylon meshes and sonication
Preprints (www.preprints.org) | NOT PEER-REVIEWED | Posted: 8 May 2017 doi:10.20944/preprints201705.0070.v1
Peer-reviewed version available at Epigenomes 2017, 1, 8; doi:10.3390/epigenomes1020008
19 of 32
was done for 13x 30 sec on, 1 min off, position H (this longer sonication was only performed for biological replicate 2).
Immunoprecipitation reactions were set up as described in [Carles, 2009 #838] except that 15 µg of cauliflower and 10 µg of wild type chromatin was used and the chromatin was incubated with 5 µl of the antibody alone for 5 hours prior to addition of Protein A Agarose beads without salmon sperm DNA (Millipore).
Antibodies used were anti-H3K27me3 (07-449, Millipore) and anti-H3K4me3 (17-614, Millipore). Specificity of each lot used was check via dot-Blot using peptides containing mono-, di and tri-methylated versions of the respective residue (Abcam, ab1780-1782, ab1340, ab1768 and ab1742) according to a protocol provided on abcam's web page (www.abcam.com/ps/pdf/protocols/Dot blot protocol.pdf).
Washing of the ChIP reaction was performed using binding/wash buffer as described in [Carles, 2009 #838] but for four times 10 min at 4°C and once 10 min at room temperature (RT).
Elution and reverse cross-linking was performed as described in [Kaufmann, 2010 #2405] except that the elution was done by vortex mixing for 1 min at RT and input samples (1/3 of the chromatin used for one ChIP sample) were brought to the same volume by adding elution buffer and Tris pH9 in the same ratio as to the ChIP samples.
Reverse cross-linked samples were purified using the MinElute Reaction Cleanup Kit (Quiagen) and DNA was eluted in 30 µl Elution buffer.
For biological replicate 2, three technical replicates of ChIP on the same nuclear extract were performed and pooled on one MinElute column.
4.5. RNA preparation, reverse transcription and gene expression analysis by semi-qPCR
Total RNA was isolated with the RNeasy Plant Mini Kit (Qiagen) and 8 µg of RNA were DNase treated with DNA-freeTM Kit (Ambion). For semi-quantitative PCR (semi-qPCR), 2,2 µg of DNase treated RNA were used for reverse transcription with SuperScript® III RNase H– reverse transcriptase (Life Technologies) and an oligo dT primer (18mer), according to the manufacturer’s instructions. From 20 µl of the reverse transcription (RT) product, 1 µl was used for each PCR reaction. The annealing temperature was 54°C for all primer pairs and 25 cycles of PCR were performed for all genes. Primers for semi-qPCR were previously described [Carles, 2009 #838]. Elongation factor 1α (EF1α) was used as an internal control.
4.6. Library preparation and NGS
Libraries from ChIP samples of replicate 1 were prepared and sequenced on a GAIIx (Illumina) sequencer as described previously [Yant, 2010 #2517;Immink, 2012 #1263].
For biological replicate 2, ChIP-seq library preparation was performed using the Truseq ChIP sample preparation kit (Illumina, ref. IP-202-1012) according to the manufacturer's instructions except that PCR amplification was performed prior to size selection. Briefly, sonicated chromatin was repaired prior to 3' ends adenylation. Illumina's indexed adapters were ligated to the adenylated double-stranded DNA fragments. A 18-cycles PCR was performed on the ligated DNA using Illumina's PCR primers. The libraries were then size-selected between 300 bp and 700 bp on a 2% agarose gel. Each library was validated using high sensitivity chip (Agilent, ref. 5067-4626) on an Agilent Bioanalyzer and quantified using the Kapa library quantification kit (Clinisciences, ref. KK4824). Equimolar amounts of 4 libraries were pooled, diluted to 10 nM, denatured, and diluted again to 7 pM. 100 µl of the diluted pool were hybridized on one lane of an Illumina's Flow Cell. Clustering and 50 cycles sequencing were performed according to Illumina's instructions on a Hiseq2000. Libraries were multiplexed by three (H3K4me3 samples) or four and sequenced on a HiSeq2000 (Illumina) sequencer, yielding 50 bp single-end reads.
Preprints (www.preprints.org) | NOT PEER-REVIEWED | Posted: 8 May 2017 doi:10.20944/preprints201705.0070.v1
Peer-reviewed version available at Epigenomes 2017, 1, 8; doi:10.3390/epigenomes1020008

20 of 32
For RNA-seq, library preparation was performed using the Truseq stranded mRNA sample preparation kit (Illumina, ref.RS-122-2101 ) according to the manufacturer instructions. Briefly, polyadenylated RNAs were purified using oligo-d(T) magnetic beads, fragmented, and reverse transcribed using random hexamers, Super Script II (Life Technologies, ref. 18064-014) and Actinomycin D. During the second strand generation step, dUTP substituted dTTP. This prevented the second strand to be used as a matrix during the final PCR amplification. Double-stranded cDNAs were adenylated at their 3' termini before ligation was performed using Illumia's indexed adapters. Ligated cDNAs were amplified following 15 PCR cycles and PCR products were purified using AMPure XP Beads (Beckman Coulter Genomics, ref.A63881). Libraries were validated using a DNA1000 chip (Agilent, ref. 5067-1504) on a Agilent Bioanalyzer and quantified using the KAPA Library quantification kit (Clinisciences, ref. KK4824). Equimolar amounts of 4 libraries were pooled, diluted to 10 nM, denatured, and diluted again to 7 pM. 100 µl of the diluted pool were hybridized on one lane of an Illumina's Flow Cell. Clustering and 50 cycles sequencing were performed according to Illumina's instructions on a Hiseq2000.
For signal processing, �image analysis and basecalling were performed using the HiSeq Control Software and Real-Time Analysis component. Demultiplexing was performed using Illumina's sequencing analysis software (CASAVA 1.8.2). The quality of the data was assessed using FastQC from the Babraham Institute and the Illumina software SAV (Sequence Analysis Viewer).
4.7. ChIP-seq analysis
Reads were mapped to the Columbia reference genome (Tair10) using BWA [Li, 2009 #2519], files were converted into bam format using samtools [Li, 2009 #2519;Li, 2009 #2520] and duplicated reads were removed using Picard-tools (picard.sourceforge.net). Pearson product-moment correlation coefficient (PCC) was calculated for sums of reads per million in 200 bp windows of the genome using a customized c++ script to assess similarity between samples. Simply defining genes as targets or non targets of a chromatin marks is not an adequate approach to study chromatin dynamics between tissues/time points because changes might occur only in a subset of cells and thus a reduction or elevation of a mark would be seen but not a total gain or loss of the respective mark. This would lead to detection of false negative genes in respect of changes. On the other hand, targets are defined by a threshold and thus genes which are very close to the threshold in both conditions, one above and one under it, might lead to the detection of false positives. Thus, we determined differentially enriched regions between two samples using the SICER-df function of SICER V1.1 [Zang, 2009 #2317] with window size 200 bp, gap size 400 bp and effective genome size 90 %. This function first determines significantly enriched regions in each sample (ChIP) compared to the respective control. As control, input samples of I were used for the wt samples and input samples of t2 were used for all cauliflower tissues. For all comparisons of samples (ChIP) and control (input), a FDR of 0.0001 was employed. Afterwards, the program determines all regions that are positive in one or both of the tested conditions (the two ChIPs to be compared) and then determines differentially enriched regions among those union islands. Due to the lower number of reads in the first biological replicate, a more lenient FDR was used for the detection of the small quantitative changes between the samples (0.05). For replicate 2, FDR 0.0001 was used. For the H3K4me3 samples, a strong variation in the background levels was observed between samples. To eliminate biases in the normalisation process caused by this fact, SICER-df was applied to files containing only genes on union islands filtered by filter_raw_tags_by_islands.py from SICER as recommended in [Zang, 2009 #2317]. Genes were considered as significantly enriched (target genes) or significantly differentially enriched when overlapping with the respective regions with their gene body. Only genes found in both replicates were considered for further analysis.
4.8. RNA-seq analysis
Preprints (www.preprints.org) | NOT PEER-REVIEWED | Posted: 8 May 2017 doi:10.20944/preprints201705.0070.v1
Peer-reviewed version available at Epigenomes 2017, 1, 8; doi:10.3390/epigenomes1020008

21 of 32
Mapping of reads to tair10 genome and determination of differentially expressed genes was performed using TopHat and Cufflinks with default parameters as described in [Trapnell, 2012 #2118]. Three biological replicates were analysed together.
4.9. Further bioinformatics analyses
● Clustering Heat map visualisation and clustering was performed with the software Genesis 1.7.6 [Sturn,
2002 #2521]. Normalised expression values in each tissue/ time point (denoted as Fragments Per Kilobase Of Exon Per Million Fragments Mapped (FPKM)) were submitted to the analysis. To visualise patterns of expression dynamics over the time series rather than absolute values, z-scores were employed and calculated from FPKM values of a gene in a given sample as z=(FPKM-µ)/σ, where µ denotes the mean FPKM value for the gene over the whole tissue/time series and σ denotes the standard deviation of this mean. Hierarchical average linkage and k-means clustering were performed as described [Engelhorn, 2010 #2522]. For the subset of floral regulators (Fig. 1), 5 main branches are visible in the hierarchical clustering tree. Therefore, k-means clustering was performed with k=5. For all DEGs, different numbers of clusters were tested and k=8 yielded the highest diversity of patterns. Distance for all clustering analyses was Euclidean.
● Gene Ontology analysis For a general overview of over-represented functions (GO slim) in gene sets, the Classification
Super Viewer from the BAR website (bar.utoronto.ca) was employed [Provart, 2003 #2523]. For detailed functional analysis over-represented GO terms were determined with the FatiGO tool [Al-Shahrour, 2007 #2524] of Babelomics 4 webservice (babelomics.bioinfo.cipf.es) [Medina, 2010 #2525].
● Visualisation of data in a genome browse For visualisation, bam files were converted to bigwig files and normalised by the number of
reads in the respective library using awk, bedtools [Quinlan, 2010 #2526] and bedGraphToBigWig [Kent, 2010 #2527]. Bigwig files were visualised in a locally running version of the Generic Genome Browser (GBrowse 2.54) [Stein, 2013 #2528].
● Calculation of average histone mark abundance patterns and heat maps over a locus For upstream and downstream regions of a locus, normalised histone mark abundance
(expressed in reads per million) was calculated with base resolution and then averaged either in 200bp bins for heat maps or over all loci of interest with base pair resolution for average patterns. Transcribed regions were partitioned in 1500 bins (10 bins for heat maps) to account for variation in gene length and average normalised histone mark abundance was calculated for each bin.
4.10. AVAILABILITY OF SUPPORTING DATA
ChIP-seq and RNA-seq data were deposited at the NCBI Gene Expression Omnibus (GEO) under the SuperSeries GSE71583. Normalised H3K27me3 and H3K4m3 profiles expressed as reads per million can be viewed at https://gbrowse.cea.fr (for the moment protected by user:flowdev pw: Ai6aqu8r).
5. Conclusions
Epigenomic analyses with temporal and tissue-specific resolution has not been reported yet in planta, since most studies were performed at one developmental stage and often in a mixture of tissues, thus providing static and average views of chromatin landscapes. This lack was due to the challenging harvest of tissue- or stage-specific chromatin in sufficient amounts for comparison between samples. To overcome these limitations, we employed the inducible « cauliflower » system that allows production of flower meristems in large amounts and their synchronous development over time.
Preprints (www.preprints.org) | NOT PEER-REVIEWED | Posted: 8 May 2017 doi:10.20944/preprints201705.0070.v1
Peer-reviewed version available at Epigenomes 2017, 1, 8; doi:10.3390/epigenomes1020008

22 of 32
Combination of the floral induction system with quantitative ChIP-seq analysis enabled us to detect changes in histone mark abundance with temporal resolution within the inflorescence, during early flower development. We found that quantitative changes in H3K27me3 and H3K4me3 marks take place within the first two days of flower initiation, affecting several hundreds of genes. During this period, we discovered that H3K4me3 is a stronger predictor of transcriptional changes than H3K27me3, for both activation and repression. Even for PcG target genes, early gene activation is dominated by increases in H3K4me3, and H3K27me3 remains present while H3K4me3 is elevated. Although it was observed that many floral organ identity genes are up-regulated in the constitutive absence of H3K27me3 depositing enzymes, in the natural context H3K27me3 decline rather occurs after prolonged transcription. This indicates that presence of repressive H3K27me3 marks may not prevent early activation of genes, provided that active H3K4me3 marks are deposited. In conclusion, we could establish the temporal resolution of chromatin events during the first steps of flower morphogenesis, and identified prevailing changes in H3K4me3 over H3K27me3.
Supplementary Materials: The following are available online.
Acknowledgments: We thank Jean-Luc Putaux and Christine Lancelon for access to critical point dryer equipment and Pierre-Henri Jouneau for assistance with scanning-electron microscopy imaging. We thank Béatrice Berthet for help with dissection of ap1cal tissue and Armelle Donglois for her investment in re-ChIP experiments. We are grateful to Laura Gregoire for critical discussion and input on data visualisation and to Leor Eshed Williams for critical reading of the manuscript. This work was funded by the French National Agency Young Researcher grant for the ChromFlow project (ANR JCJC, project SVSE2-1206 01 to CCC, http://www.agence-nationale-recherche.fr/projet-anr/?solr=run&tx_lwmsuivibilan_pi2[Engelhorn, #169]=ANR-10-JCJC-1206), the Centre National de la Recherche Scientifique for a CNRS-Higher Education Chair (position 0428–64 to CCC), the University of Grenoble Alpes for an UGA-UJF Initiative Chair (to CCC), a research fellowship of the French embassy in Germany (to JE) and a Marie Curie Intra European Fellowship within the European Union’s Seventh Framework Programme (FP7/2007-2013) under REA grant agreement n◦ 327377 (http://cordis.europa.eu/project/rcn/108315_en.html) (to JE). The funders had no role in study design, data collection and analysis, decision to publish, or preparation of the manuscript.
Author Contributions: CCC conceived and coordinated the study. JE, RB and CCC planned and performed all experiments except for sequencing library preparation, which was done by DP and HP. FO and MR performed base-calling and demultiplexing of sequencing reads. JE and RB analysed the ChIP-seq data, JE and CK analysed the RNA-seq data and were responsible for all other bioinformatics analyses. JE and CCC wrote the manuscript with the help of RB. All authors carefully read, edited and approved the final version of the manuscript.
Conflicts of Interest: The authors declare no conflict of interest. The founding sponsors had no role in the design of the study; in the collection, analyses, or interpretation of data; in the writing of the manuscript, and in the decision to publish the results.
Preprints (www.preprints.org) | NOT PEER-REVIEWED | Posted: 8 May 2017 doi:10.20944/preprints201705.0070.v1
Peer-reviewed version available at Epigenomes 2017, 1, 8; doi:10.3390/epigenomes1020008

23 of 32
Appendix A
1. Description of expression clusters among floral regulator genes Cluster 1 corresponds to regulators of floral transition and inflorescence meristem identity. Their expression is highest in leaves, remains at almost the same level in t0 inflorescence meristem like tissue and then gradually decreases toward I. Cluster 2 correspond to genes regulating inflorescence meristem identity and specifying boundaries. Their expression is low in leaves, high at t0 and then gradually decreases. Cluster 3 comprises genes involved in floral transition, inflorescence meristem and boundaries, which also regulate floral organ development. Expression of these genes gradually rises from L to t2 and decreases in I. Clusters 4 and 5 carry late and early floral organ and meristem identity genes, respectively. Their expression rises from L to I with a main elevation of expression from t0 to t2 (Cluster 5) or from t2 to I (Cluster 4). For most of the floral regulator genes, changes in expression from t0 to t2 are similar to those observed by Wellmer et al. (2006) [Wellmer, 2006 #2210] in a micro-array experiment (Supplemental Figure 2). 2. K-means clustering of DEGs K-means clustering of all DEGs (14459) with k=8 (Supplemental Figure 3) revealed that the most abundant pattern observed (cluster VII, more than one third of the DEGs) contains genes with a higher expression in leaves than in all other tissues, where their expression is uniformly lower. Three patterns include genes that are lower expressed in leaves than in all other tissues. This is to be expected as leaf tissue fundamentally differs from the three other tissue types (no floral organs, no meristematic tissue, fully differentiated). However, we also find a large number of genes that display elevated expression in inflorescence tissue compared to all other tissues (cluster VI, around one fifth of the DEGs), thus likely to be genes involved in later steps of flower development. The third most abundant group contains genes that are up-regulated in the t0 and t2 tissues and lower in both L and I, where L is lower than I (cluster V). 3. GO analysis of DEGs To functionally characterize the DEGs, we performed a Gene Ontology (GO) analysis, starting with a broad GO slim analysis (Supplemental Figure 4 and S5) followed by a detailed, full GO analysis of categories overrepresented in the DEGs lists (Supplemental Table 2). This analysis revealed that the changes in expression pattern correlate with expected functionality of the tissues on a genome-wide scale. Genes activated during the series (from L to I) display over-representation for “developmental processes” in all comparisons except t0 to I. An over-representation for the “TFs” molecular function and the “transcription” biological process in t0 to t2 DEGs indicates that the 2-day induction of flower development affected gene regulatory mechanisms in a broad fashion. Terms related to floral organ development were expectedly enriched when considering genes upregulated from L to t0 or L to I. Importantly, those related to floral whorl, carpel or gynoecium development, already appeared during early induction of flower development (t0 to t2) further confirming the suitability of the chosen time points, while genes up-regulated later (t0 to I) are enriched for terms mainly referring to processes for later stages of development (e.g. pollen development). Plastid-localised proteins were over-represented in leaves and repressed elsewhere or present in “green” inflorescences compared to the white meristem structures present in t0 and t2, (Supplemental Figure 5). Many plastid-localised proteins encoded by genes down-regulated from L to other tissues refer to terms concerning light perception, photosynthesis, sugar metabolism and transport, reflecting a true difference in the photosynthetic capacity and yield. Similarly, terms referring to the response to stimuli are over-represented when comparing down-regulated DEGs in L vs t0 or vs I, but also t0 vs I, indicating that biotic and abiotic responses mainly occur in fully expanded tissues rather than in meristematic tissues.
Preprints (www.preprints.org) | NOT PEER-REVIEWED | Posted: 8 May 2017 doi:10.20944/preprints201705.0070.v1
Peer-reviewed version available at Epigenomes 2017, 1, 8; doi:10.3390/epigenomes1020008
24 of 32
4. Quality control for ChIP-seq experiments We observed a high correlation between our two biological replicates, both at the read level (Pearson correlation coefficient > 0.75 for all time points, >0.9 for t0 and t2) and at the target gene level (overlap >77 % for all time points comprising the most distant L and I, >90% for most) (Supplemental Table 3). The core lists of H3K27me3-targets and H3K4me3-targets (6130 genes and 15088 genes respectively, Supplemental Figure 6) displayed overlaps for of >66 % with published ChIP-chip datasets and >88% with ChIP-seq datasets [Farrona, 2011 #1047;Roudier, 2011 #2385;Luo, 2013 #2511] (Supplemental Table 3), confirming the robustness of our dataset. 5. DMGs during early flower morphogenesis Among the 13 genes that change in both marks towards activation, three are key regulators of flower development (SEP1, SEP2 and LFY), one is involved in flower organogenesis (SPATULA, SPT) and one participates in SAM development (AINTEGUMENTA-LIKE 6 (AIL6)) (Table 2) [Ma, 1991 #2530;Weigel, #2202;Blazquez, 1997 #2531;Parcy, 1998 #2533;Alvarez, 1999 #2534;Pelaz, 2000 #2535;Heisler, 2001 #2536;Krizek, 2011 #2538;Krizek, 2012 #2537]. The 15 genes that change in both marks towards repression (Table 2), encode two negative regulators of floral transition, one putative negative growth regulator, three members of the LIGHT SENSITIVE HYPOCOTYLS (LSH) family (members involved in organ boundary specification and light regulation of seedling development), a leaf development regulator and a promoter of pseudo-etiolation in light [Aukerman, 2003 #690;Hu, 2004 #2539;Zhao, 2004 #2540;Fowler, 2005 #2541;Ichikawa, 2006 #2542;Cartagena, 2008 #844;Petricka, 2008 #2544;Waters, 2008 #2545][Nelson, 2010 #2546]. 6. GO analysis of DMGs To functionally characterize all DMGs, we determined GO terms that are significantly enriched among DMGs compared to all genes carrying the respective mark (Supplemental Table 5 and 6). The over-represented functions among H3K4me3-elevated genes vary strongly between the different comparisons: L-t0 and L-I are enriched in development-related functions including flower and meristem development, but also in DNA metabolism and cell cycle as expected for a comparison between a differentiated tissue and a meristematic (t0) or a meristem-containing tissue (I). In the two comparisons from t0 or t2 to I (more advanced in flower development), we found enriched terms related to response to light and other stimuli, photosynthesis and sugar metabolism, while during early flower morphogenesis (t0 to t2 comparison), DMGs changing towards activation are especially enriched in transcription and floral development (carpel and gynoecium development) specific terms. This result is in line with the fact that many flower regulators are TFs. Genes showing reduced H3K4me3 for L to t0 or L to I, are enriched in terms related to response to stimulus and depleted in terms related to development, DNA metabolism and transport. Genes with reduced H3K4me3 for t0 to I or t2 to I are enriched in terms related to development, including flower and floral organ development, suggesting that several genes involved in early flower development significantly loose activation marks at later stages. H3K27me3-changing targets mainly represent all types of H3K27me3-related functions (e.g. developmental processes, Supplemental Table 5), for H3K27me3 reduction, only the t0-to-t2 DMGs are strongly enriched in several specific terms for floral organ development. Genes displaying elevated H3K27me3 in L to t0 or L to I comparisons are enriched in metabolic processes, L-to-t0 genes are depleted in multicellular-organismal-development, while t2 to I is flower development. 7. Analysis of DMGs that are not DEGs The observed delay in H3K27me3 changes for DEGs suggests that transcriptional changes might be rather a cause than a consequence of H3K27me3 dynamics. This raises the question why several genes show significant changes in H3K27me3 during early flower morphogenesis but not in transcription (Fig. 3A). It might be that changes in those genes were just below the threshold for differential expression. We therefore considered the absolute expression values and early expression changes for
Preprints (www.preprints.org) | NOT PEER-REVIEWED | Posted: 8 May 2017 doi:10.20944/preprints201705.0070.v1
Peer-reviewed version available at Epigenomes 2017, 1, 8; doi:10.3390/epigenomes1020008
25 of 32
H3K27me3 DMGs (Supplemental Figure S10). We found that expression changes in the expected direction are indeed limited to a small proportion of the H3K27me3 DMGs. Interestingly, the majority of genes that do not change in expression are expressed at very low levels or not at all during the complete series. We hypothesise that these genes might gain or loose H3K27me3 maybe through the action of other repressive chromatin features such as DNA methylation or H3K9me3 marking. For H3K4me3, at least half of the DMGs show at least some change in the expected direction. However, also few changes in the opposite direction are observed, maybe due to interplay with repressive TFs.
Appendix B
SUPPLEMENTARY FIGURE LEGENDS
Supplementary Figure 1. Validation of the ap1cal AP1-GR induction system for the analysis of early events of gene activation, in situ. To verify the morphological effect of AP1 induction and assess its blockage by the GR system, we compared inflorescence tissue of ap1cal plants and ap1cal 35S::AP1-GR plants pre- and post-induction. (A) - (D) Floral induction in ap1cal double mutants by AP1-GR activation. Top viewed inflorescences of (A) ap1cal, (B-C) ap1cal 35S::AP1-GR and (D) Ler wild type (WT). Pictures were taken 12 days after single treatment with (A, C, D) 1 µM of dex solution or (B) mock. Activation of the AP1-GR protein in the ap1cal led to the production of WT looking flowers. (E) - (H) Scanning electron micrographs of inflorescence-like meristems of (E) an ap1-1 cal-1 double mutant, (F) an untreated ap1cal 35S::AP1-GR plant and (G) an ap1cal 35S::AP1-GR plant five days after a single treatment with 1 µM of dex solution. Scale bars: 100 nm. While ap1cal and non-induced ap1cal 35S::AP1-GR plants show over-proliferated inflorescence meristems with no difference in floral organ formation, ap1cal 35S::AP1-GR plants had formed full flower buds with clearly visible sepals five days after induction.
Supplementary Figure 2. Comparison of expression changes from t0 to t2 in this study and in Wellmer et al. (2006). Fold changes (FC) in expression are depicted by a heat map reaching from genes expressed 5 times lower in t2 than t0 (blue) to genes expressed 10 times higher in t2 than t0 (red).
Supplementary Figure 3. Major expression patterns present among differentially expressed genes (DEG). K-means clustering with k=8 was performed for all DEGs yielding an overview of expression profiles in the 8 clusters. Relative expression values are expressed as z-scores to reveal similarities in expression patterns. Averages of z-scores in each cluster are depicted in red. The grey lines represent the single genes in the cluster.
Supplementary Figure 4. Functional characterisation of up-regulated DEGs. Figs were generated with the Classification Super Viewer from the BAR website (http://bar.utoronto.ca) using default parameters. The expected background is calculated by bootstrapping 100 sets of the same size from the whole genome. The expected size is set to 1 (red line).
Supplementary Figure 5. Functional characterisation of down-regulated DEGs. Figs were generated with the Classification Super Viewer from the BAR website (http://bar.utoronto.ca) using default parameters. The expected background is calculated by bootstrapping 100 sets of the same size from the whole genome. The expected size is set to 1 (red line).
Supplementary Figure 6. Overlap between target genes in the four considered time points/tissues for H3K27me3 (K27) and H3K4me3 (K4).
Supplementary Figure 7. Average distribution of H3K27me3 and H3K4me3 over DMGs and all target genes. Genes are scaled to the same length (1500 bins), only the second replicate is displayed here. We saw the same tendencies in the first replicate.
Supplementary Figure 8. H3K4me3 signal shift between early and later expression changes. Average differences in H3K4me3 signal (in reads per million) for genes that are differentially expressed in both the t0 to t2 and t0 to I comparison are calculated in 200bp windows/10% bins over genes from -200bp to 200bp downstream
Preprints (www.preprints.org) | NOT PEER-REVIEWED | Posted: 8 May 2017 doi:10.20944/preprints201705.0070.v1
Peer-reviewed version available at Epigenomes 2017, 1, 8; doi:10.3390/epigenomes1020008

26 of 32
for each gene. For each bin, the percentage of the change on the whole change over the gene is displayed for t2 minus t0, I minus t2 and I minus t0) for both up-regulated (A) and down-regulated genes (B).
Supplementary Figure 9. Expression changes of early DEGs during flower morphogenesis at t1. Heat maps showing the difference in expression from t0 to t1 as measured in a microarray experiment (Wellmer et al., 2006). Each line represents a DEG (from t0 to t2 comparison in our study). Genes are sorted by their average H3K27me3 change (T2-t0) as shown in the first column of the heat map with marks changing in the expected direction at the top. Note that only genes present on the microarray are shown and thus not all DEGs are considered.
Supplementary Figure 10. Expression of early DMGs during the time series. Heat maps showing expression values (FPKM) for significantly changing genes for H3K27me3 and H3K4me3. Each line represents a gene sorted by the expression changes during early flower morphogenesis (t2 minus t0, indicated as a column of the heatmap for orientation), with the highest negative expression change (down-regulation) at the top.
Supplementary Figure 11. Correlation of genome-wide changes in histone marks from t0 to t2 and binding of MADS TFs or DNase hypersensitivity during early flower development. (A) Fraction of DMGs for H3K27me3, H3K4me3 and both marks from t0 to t2 (K27 down: H3K27me3 reduced t0-t2, K4 up: H3K4me3 elevated t0-t2, both: H3K27me3 reduced and H3K4me3 elevated t0-t2) that are bound by AP1 and/or SEP3 during early flower development. TF binding at three time points after dex-induction was considered: t2, t4 and t8 (Pajoro et al., 2014). Numbers above each bar indicate the total number of DMGs for each respective comparison. (B) Fractions of same DMGs as in (A) that overlap with DNase I hypersensitive sites (DHS) during the same three time points as in (A) and at t0 (Pajoro et al., 2014). Numbers on each bar indicate the total number of DMGs in the respective comparison.
SUPPLEMENTARY TABLE LEGENDS
Supplementary Table 1. List of genes that are differentially expressed in at least one condition. For each comparison of conditions, a number code indicates if genes are not changed from condition 1 to condition 2 (0), up-regulated in condition 2 compared to condition 1 (1) or down-regulated (-1). Genes are considered as differentially expressed when determined as significantly differentially expressed by Cufflinks (p<0.05).
Supplementary Table 2. Functional enrichment analysis for DEGs. Significantly enriched GO terms among DEGs were determined for the three most relevant comparisons (L-I, t0-t2, t0-I) compared to the whole genome. False discovery rate (FDR) corrected p-values (adj_pvalue) are output of the FatiGO web tool, terms are considered significantly enriched for FDR corrected p-values lower than 0.05.
Supplementary Table 3. Pearson correlation coefficient analysis, ChIP-seq read numbers, average expression values for H3K27me3 and H3K4me3 target genes and significantly enriched genes for H3K27me3 and H3K4me3. Sheet 1: Read numbers for ChIP-seq samples and Pearson correlation coefficients for comparisons between replicates and between samples and inputs and average expression values of target genes (FPKM values). Read numbers given are reads that map to the TAIR10 genome annotation after removal of duplicated reads. Sheet 2: Target genes of H3K27me3 and H3K4me3: genes were considered as target genes when overlapping with a significantly enriched region determined by SICER. Only genes that were detected in both replicates were considered as target genes of the respective mark for further analysis. A comparison of all conditions and with previously published target gene lists (Roudier et al., 2011 ; Farrona et al., 2011 ; Luo et al., 2012) is shown. Sheet 3-10: Target gene lists for the different conditions.
Supplementary Table 4. Differentially marked genes for H3K27me3 and H3K4me3 in the tissue/time series. Sheet 1: Gene numbers of comparisons for all combinations of DMGs. Changes with elevated H3K4me3 (K4) and reduced H3K27me3 (K27) are highlighted in green, changes with reduced K4 and elevated K27 are highlighted in red. The grey diagonal indicates comparisons between the same time points/tissues. Numbers in parenthesis indicate the number of genes in the respective lists. For comparisons in the same direction and for the same mark, these numbers can be read out from the grey diagonal. Sheet 2: List of changes in all comparisons for all DMGs: 1 denotes elevation of the respective mark, -1 reduction, 0 denotes no change.
Preprints (www.preprints.org) | NOT PEER-REVIEWED | Posted: 8 May 2017 doi:10.20944/preprints201705.0070.v1
Peer-reviewed version available at Epigenomes 2017, 1, 8; doi:10.3390/epigenomes1020008

27 of 32
Supplementary Table 5. Functional enrichment analysis for H3K4me3 and H3K27me3 targets. Significantly enriched GO terms were determined for the four samples L, t0, t2 and I compared to the whole genome. FDR corrected p-values (adj_pvalue) are output of the FatiGO web tool, terms are considered significantly enriched for FDR corrected p-values lower than 0.05 (highlighted in green). Blank fields indicate that the term is not enriched in the respective sample.
Supplementary Table 6. Functional enrichment analysis for H3K4me3 and H3K27me3 DMGs. Significantly enriched or depleted GO terms among DMGs were determined for the L-t0, L-I, t0-t2, t0-I and t2-I comparisons for changes in both directions for both marks (separately and common DMGs). All targets of the respective mark were employed as background distribution. FDR corrected p-values (adj_pvalue) are output of the FatiGO web tool, terms are considered significantly enriched (highlighted in green) or depleted (highlighted in red) compared to all targets of the mark for FDR corrected p-values lower than 0.05. Blank fields indicate that the term is not enriched in the respective sample. If a comparison is not listed for one direction, no significant terms were found for this specific set of DMGs.
LIST OF ABBREVIATIONS
PcG Polycomb Group
trxG trithorax Group
SAM shoot apical meristem
IM inflorescence meristem
LFY LEAFY
AP1-3 APETALA 1-3
CAL CAULIFLOWER
PI PISTILLATA
AG AGAMOUS
SEP1-4 SEPALLATA 1-4
PRCs Polycomb repressive complexes
FT FLOWERING LOCUS T
FLC FLOWERING LOCUS C
TBP TATA-box binding protein
RNA PolII RNA polymerase II
FACS fluorescence-activated cell sorting
ULT1 ULTRAPETALA 1
SVP SHORT VEGETATIVE PHASE
SOC1 SUPPRESSOR OF OVEREXPRESSION OF CONSTANS 1
UFO UNUSUAL FLORAL ORGANS
AGL15 AGAMOUS-Like 15
CUP-SHAPED COTYLEDON 1 CUC1
DEGs differentially expressed genes
GO Gene Ontology
ChIP chromatin-immunoprecipitation
Preprints (www.preprints.org) | NOT PEER-REVIEWED | Posted: 8 May 2017 doi:10.20944/preprints201705.0070.v1
Peer-reviewed version available at Epigenomes 2017, 1, 8; doi:10.3390/epigenomes1020008

28 of 32
-seq high-throughput sequencing
AIL6 AINTEGUMENTA-LIKE 6
SPT SPATULA
LSH LIGHT SENSITIVE HYPOCOTYLS
DMGs differentially marked genes
TSS transcription start site
LAC10 LACCASE 10
PUP4 PURINE PERMEASE 4
LBD39 LOB DOMAIN-CONTAINING PROTEIN 39
SDG4 SET-DOMAIN-GROUP4
BXL1 BETA-XYLOSIDASE 1
TF transcription factor
SHP2 SHATTERPROOF 2
DHS DNase I hypersensitive
EF1α Elongation factor 1α
References
1. Alvarez-Buylla ER, Benitez M, Corvera-Poire A, Chaos Cador A, de Folter S, Gamboa de Buen A, et al. Flower development. Arabidopsis Book. 2010;8:e0127. doi: 10.1199/tab.0127. PubMed PMID: 22303253; PubMed Central PMCID: PMCPMC3244948. 2. Kaufmann K, Pajoro A, Angenent GC. Regulation of transcription in plants: mechanisms controlling developmental switches. Nature reviews Genetics. 2010;11(12):830-42. doi: 10.1038/nrg2885. PubMed PMID: 21063441. 3. Chahtane I, Denay, G., Engelhorn, J., Monniaux, M., Moyroud, E., Moreau, F., Carles, C., Tichtinsky, G., Zubieta, C., Parcy, F. (2014). . Flower development: an integrated view. In: From Molecules to Living Organisms: An Interplay Between Biology and Physics, Oxford University Press. 2017; in press (Pebay-Peyroula, E., Nury, H., Parcy, F., Ruigrok, R.W.H., Ziegler, C., Cugliandolo, L.F. (Ed.)). 4. Engelhorn J, Blanvillain R, Carles CC. Gene activation and cell fate control in plants: a chromatin perspective. Cellular and molecular life sciences : CMLS. 2014;71(16):3119-37. doi: 10.1007/s00018-014-1609-0. PubMed PMID: 24714879. 5. Pirrotta V. Polycombing the genome: PcG, trxG, and chromatin silencing. Cell. 1998;93(3):333-6. PubMed PMID: 9590168. 6. Schuettengruber B, Chourrout D, Vervoort M, Leblanc B, Cavalli G. Genome regulation by polycomb and trithorax proteins. Cell. 2007;128(4):735-45. doi: 10.1016/j.cell.2007.02.009. PubMed PMID: 17320510. 7. Morey L, Helin K. Polycomb group protein-mediated repression of transcription. Trends in biochemical sciences. 2010;35(6):323-32. doi: 10.1016/j.tibs.2010.02.009. PubMed PMID: 20346678. 8. Zhang X, Clarenz O, Cokus S, Bernatavichute YV, Pellegrini M, Goodrich J, et al. Whole-genome analysis of histone H3 lysine 27 trimethylation in Arabidopsis. PLoS biology. 2007;5(5):e129. doi: 10.1371/journal.pbio.0050129. PubMed PMID: 17439305; PubMed Central PMCID: PMC1852588. 9. Oh S, Park S, van Nocker S. Genic and global functions for Paf1C in chromatin modification and gene expression in Arabidopsis. PLoS genetics. 2008;4(8):e1000077. doi: 10.1371/journal.pgen.1000077. PubMed PMID: 18725930; PubMed Central PMCID: PMCPMC2515192. 10. Roudier F, Ahmed I, Berard C, Sarazin A, Mary-Huard T, Cortijo S, et al. Integrative epigenomic mapping defines four main chromatin states in Arabidopsis. The EMBO journal. 2011;30(10):1928-38. doi: 10.1038/emboj.2011.103. PubMed PMID: 21487388; PubMed Central PMCID: PMCPMC3098477.
Preprints (www.preprints.org) | NOT PEER-REVIEWED | Posted: 8 May 2017 doi:10.20944/preprints201705.0070.v1
Peer-reviewed version available at Epigenomes 2017, 1, 8; doi:10.3390/epigenomes1020008
29 of 32
11. Schuettengruber B, Martinez AM, Iovino N, Cavalli G. Trithorax group proteins: switching genes on and keeping them active. Nature reviews Molecular cell biology. 2011;12(12):799-814. doi: 10.1038/nrm3230. PubMed PMID: 22108599. 12. Kingston RE, Tamkun JW. Transcriptional regulation by trithorax-group proteins. Cold Spring Harbor perspectives in biology. 2014;6(10):a019349. doi: 10.1101/cshperspect.a019349. PubMed PMID: 25274705; PubMed Central PMCID: PMC4176006. 13. Alvarez-Venegas R. Regulation by polycomb and trithorax group proteins in Arabidopsis. Arabidopsis Book. 2010;8:e0128. doi: 10.1199/tab.0128. PubMed PMID: 22303254; PubMed Central PMCID: PMCPMC3244960. 14. Kohler C, Hennig L. Regulation of cell identity by plant Polycomb and trithorax group proteins. Current opinion in genetics & development. 2010;20(5):541-7. doi: 10.1016/j.gde.2010.04.015. PubMed PMID: 20684877. 15. Muller R, Goodrich J. Sweet memories: epigenetic control in flowering. F1000 biology reports. 2011;3:13. doi: 10.3410/B3-13. PubMed PMID: 21876724; PubMed Central PMCID: PMC3155212. 16. de la Paz Sanchez M, Aceves-Garcia P, Petrone E, Steckenborn S, Vega-Leon R, Alvarez-Buylla ER, et al. The impact of Polycomb group (PcG) and Trithorax group (TrxG) epigenetic factors in plant plasticity. The New phytologist. 2015;208(3):684-94. doi: 10.1111/nph.13486. PubMed PMID: 26037337. 17. Pu L, Sung ZR. PcG and trxG in plants - friends or foes. Trends in genetics : TIG. 2015;31(5):252-62. doi: 10.1016/j.tig.2015.03.004. PubMed PMID: 25858128. 18. Weinhofer I, Hehenberger E, Roszak P, Hennig L, Kohler C. H3K27me3 profiling of the endosperm implies exclusion of polycomb group protein targeting by DNA methylation. PLoS genetics. 2010;6(10). doi: 10.1371/journal.pgen.1001152. PubMed PMID: 20949070; PubMed Central PMCID: PMCPMC2951372. 19. Lafos M, Kroll P, Hohenstatt ML, Thorpe FL, Clarenz O, Schubert D. Dynamic regulation of H3K27 trimethylation during Arabidopsis differentiation. PLoS genetics. 2011;7(4):e1002040. doi: 10.1371/journal.pgen.1002040. PubMed PMID: 21490956; PubMed Central PMCID: PMCPMC3072373. 20. Brusslan JA, Rus Alvarez-Canterbury AM, Nair NU, Rice JC, Hitchler MJ, Pellegrini M. Genome-wide evaluation of histone methylation changes associated with leaf senescence in Arabidopsis. PloS one. 2012;7(3):e33151. doi: 10.1371/journal.pone.0033151. PubMed PMID: 22427974; PubMed Central PMCID: PMCPMC3299739. 21. Brusslan JA, Bonora G, Rus-Canterbury AM, Tariq F, Jaroszewicz A, Pellegrini M. A Genome-Wide Chronological Study of Gene Expression and Two Histone Modifications, H3K4me3 and H3K9ac, during Developmental Leaf Senescence. Plant physiology. 2015;168(4):1246-61. doi: 10.1104/pp.114.252999. PubMed PMID: 25802367; PubMed Central PMCID: PMCPMC4528724. 22. He C, Chen X, Huang H, Xu L. Reprogramming of H3K27me3 is critical for acquisition of pluripotency from cultured Arabidopsis tissues. PLoS genetics. 2012;8(8):e1002911. doi: 10.1371/journal.pgen.1002911. PubMed PMID: 22927830; PubMed Central PMCID: PMC3426549. 23. Adrian J, Farrona S, Reimer JJ, Albani MC, Coupland G, Turck F. cis-Regulatory elements and chromatin state coordinately control temporal and spatial expression of FLOWERING LOCUS T in Arabidopsis. The Plant cell. 2010;22(5):1425-40. doi: 10.1105/tpc.110.074682. PubMed PMID: 20472817; PubMed Central PMCID: PMCPMC2899882. 24. Buzas DM, Robertson M, Finnegan EJ, Helliwell CA. Transcription-dependence of histone H3 lysine 27 trimethylation at the Arabidopsis polycomb target gene FLC. The Plant journal : for cell and molecular biology. 2011;65(6):872-81. doi: 10.1111/j.1365-313X.2010.04471.x. PubMed PMID: 21276103. 25. Wellmer F, Alves-Ferreira M, Dubois A, Riechmann JL, Meyerowitz EM. Genome-wide analysis of gene expression during early Arabidopsis flower development. PLoS genetics. 2006;2(7):e117. doi: 10.1371/journal.pgen.0020117.eor. PubMed PMID: 16789830; PubMed Central PMCID: PMC1523247. 26. Kaufmann K, Wellmer F, Muino JM, Ferrier T, Wuest SE, Kumar V, et al. Orchestration of floral initiation by APETALA1. Science. 2010;328(5974):85-9. doi: 10.1126/science.1185244. PubMed PMID: 20360106. 27. Smaczniak C, Immink RG, Muino JM, Blanvillain R, Busscher M, Busscher-Lange J, et al. Characterization of MADS-domain transcription factor complexes in Arabidopsis flower development. Proceedings of the National Academy of Sciences of the United States of America. 2012;109(5):1560-5. doi: 10.1073/pnas.1112871109. PubMed PMID: 22238427; PubMed Central PMCID: PMCPMC3277181. 28. Pajoro A, Madrigal P, Muino JM, Matus JT, Jin J, Mecchia MA, et al. Dynamics of chromatin accessibility and gene regulation by MADS-domain transcription factors in flower development. Genome biology.
Preprints (www.preprints.org) | NOT PEER-REVIEWED | Posted: 8 May 2017 doi:10.20944/preprints201705.0070.v1
Peer-reviewed version available at Epigenomes 2017, 1, 8; doi:10.3390/epigenomes1020008
30 of 32
2014;15(3):R41. doi: 10.1186/gb-2014-15-3-r41. PubMed PMID: 24581456; PubMed Central PMCID: PMC4054849. 29. Zhang X, Bernatavichute YV, Cokus S, Pellegrini M, Jacobsen SE. Genome-wide analysis of mono-, di- and trimethylation of histone H3 lysine 4 in Arabidopsis thaliana. Genome biology. 2009;10(6):R62. doi: 10.1186/gb-2009-10-6-r62. PubMed PMID: 19508735; PubMed Central PMCID: PMC2718496. 30. Gan ES, Huang J, Ito T. Functional roles of histone modification, chromatin remodeling and microRNAs in Arabidopsis flower development. International review of cell and molecular biology. 2013;305:115-61. doi: 10.1016/B978-0-12-407695-2.00003-2. PubMed PMID: 23890381. 31. Liu N, Fromm M, Avramova Z. H3K27me3 and H3K4me3 chromatin environment at super-induced dehydration stress memory genes of Arabidopsis thaliana. Molecular plant. 2014;7(3):502-13. doi: 10.1093/mp/ssu001. PubMed PMID: 24482435. 32. Schubert D, Primavesi L, Bishopp A, Roberts G, Doonan J, Jenuwein T, et al. Silencing by plant Polycomb-group genes requires dispersed trimethylation of histone H3 at lysine 27. The EMBO journal. 2006;25(19):4638-49. doi: 10.1038/sj.emboj.7601311. PubMed PMID: 16957776; PubMed Central PMCID: PMC1590001. 33. Liu J, Deng S, Wang H, Ye J, Wu HW, Sun HX, et al. CURLY LEAF Regulates Gene Sets Coordinating Seed Size and Lipid Biosynthesis. Plant physiology. 2016;171(1):424-36. doi: 10.1104/pp.15.01335. PubMed PMID: 26945048; PubMed Central PMCID: PMC4854673. 34. Schmitges FW, Prusty AB, Faty M, Stutzer A, Lingaraju GM, Aiwazian J, et al. Histone methylation by PRC2 is inhibited by active chromatin marks. Molecular cell. 2011;42(3):330-41. doi: 10.1016/j.molcel.2011.03.025. PubMed PMID: 21549310. 35. Bernstein BE, Mikkelsen TS, Xie X, Kamal M, Huebert DJ, Cuff J, et al. A bivalent chromatin structure marks key developmental genes in embryonic stem cells. Cell. 2006;125(2):315-26. doi: 10.1016/j.cell.2006.02.041. PubMed PMID: 16630819. 36. Luo C, Sidote DJ, Zhang Y, Kerstetter RA, Michael TP, Lam E. Integrative analysis of chromatin states in Arabidopsis identified potential regulatory mechanisms for natural antisense transcript production. The Plant journal : for cell and molecular biology. 2013;73(1):77-90. doi: 10.1111/tpj.12017. PubMed PMID: 22962860. 37. Sequeira-Mendes J, Araguez I, Peiro R, Mendez-Giraldez R, Zhang X, Jacobsen SE, et al. The Functional Topography of the Arabidopsis Genome Is Organized in a Reduced Number of Linear Motifs of Chromatin States. The Plant cell. 2014;26(6):2351-66. doi: 10.1105/tpc.114.124578. PubMed PMID: 24934173; PubMed Central PMCID: PMC4114938. 38. Bowman JL, Alvarez, J., Weigel, D., Meyerowitz, E. M., Smyth, D. R. . Control of flower development in Arabidopsis thaliana by APETALA 1 and interacting genes. DEVELOPMENT-CAMBRIDGE. 1993;119:721-. 39. Bowman JL, Smyth DR, Meyerowitz EM. Genes directing flower development in Arabidopsis. The Plant cell. 1989;1(1):37-52. doi: 10.1105/tpc.1.1.37. PubMed PMID: 2535466; PubMed Central PMCID: PMCPMC159735. 40. Carles CC, Fletcher JC. The SAND domain protein ULTRAPETALA1 acts as a trithorax group factor to regulate cell fate in plants. Genes & development. 2009;23(23):2723-8. doi: 10.1101/gad.1812609. PubMed PMID: 19952107; PubMed Central PMCID: PMC2788324. 41. Kaufmann K, Muino JM, Osteras M, Farinelli L, Krajewski P, Angenent GC. Chromatin immunoprecipitation (ChIP) of plant transcription factors followed by sequencing (ChIP-SEQ) or hybridization to whole genome arrays (ChIP-CHIP). Nature protocols. 2010;5(3):457-72. doi: 10.1038/nprot.2009.244. PubMed PMID: 20203663. 42. Yant L, Mathieu J, Dinh TT, Ott F, Lanz C, Wollmann H, et al. Orchestration of the floral transition and floral development in Arabidopsis by the bifunctional transcription factor APETALA2. The Plant cell. 2010;22(7):2156-70. doi: 10.1105/tpc.110.075606. PubMed PMID: 20675573; PubMed Central PMCID: PMCPMC2929098. 43. Immink RG, Pose D, Ferrario S, Ott F, Kaufmann K, Valentim FL, et al. Characterization of SOC1's central role in flowering by the identification of its upstream and downstream regulators. Plant physiology. 2012;160(1):433-49. doi: 10.1104/pp.112.202614. PubMed PMID: 22791302; PubMed Central PMCID: PMC3440217.
Preprints (www.preprints.org) | NOT PEER-REVIEWED | Posted: 8 May 2017 doi:10.20944/preprints201705.0070.v1
Peer-reviewed version available at Epigenomes 2017, 1, 8; doi:10.3390/epigenomes1020008
31 of 32
44. Li H, Durbin R. Fast and accurate short read alignment with Burrows-Wheeler transform. Bioinformatics. 2009;25(14):1754-60. doi: 10.1093/bioinformatics/btp324. PubMed PMID: 19451168; PubMed Central PMCID: PMCPMC2705234. 45. Li H, Handsaker B, Wysoker A, Fennell T, Ruan J, Homer N, et al. The Sequence Alignment/Map format and SAMtools. Bioinformatics. 2009;25(16):2078-9. doi: 10.1093/bioinformatics/btp352. PubMed PMID: 19505943; PubMed Central PMCID: PMCPMC2723002. 46. Zang C, Schones DE, Zeng C, Cui K, Zhao K, Peng W. A clustering approach for identification of enriched domains from histone modification ChIP-Seq data. Bioinformatics. 2009;25(15):1952-8. doi: 10.1093/bioinformatics/btp340. PubMed PMID: 19505939; PubMed Central PMCID: PMC2732366. 47. Trapnell C, Roberts A, Goff L, Pertea G, Kim D, Kelley DR, et al. Differential gene and transcript expression analysis of RNA-seq experiments with TopHat and Cufflinks. Nature protocols. 2012;7(3):562-78. doi: 10.1038/nprot.2012.016. PubMed PMID: 22383036; PubMed Central PMCID: PMC3334321. 48. Sturn A, Quackenbush J, Trajanoski Z. Genesis: cluster analysis of microarray data. Bioinformatics. 2002;18(1):207-8. PubMed PMID: 11836235. 49. Engelhorn J, Turck F. Metaanalysis of ChIP-chip data. Methods in molecular biology. 2010;631:185-207. doi: 10.1007/978-1-60761-646-7_14. PubMed PMID: 20204876. 50. Provart N, Zhu, T. A browser-based functional classification SuperViewer for Arabidopsis genomics. Currents in Computational Molecular Biology. 2003;2003:271-2. 51. Al-Shahrour F, Minguez P, Tarraga J, Medina I, Alloza E, Montaner D, et al. FatiGO +: a functional profiling tool for genomic data. Integration of functional annotation, regulatory motifs and interaction data with microarray experiments. Nucleic acids research. 2007;35(Web Server issue):W91-6. doi: 10.1093/nar/gkm260. PubMed PMID: 17478504; PubMed Central PMCID: PMCPMC1933151. 52. Medina I, Carbonell J, Pulido L, Madeira SC, Goetz S, Conesa A, et al. Babelomics: an integrative platform for the analysis of transcriptomics, proteomics and genomic data with advanced functional profiling. Nucleic acids research. 2010;38(Web Server issue):W210-3. doi: 10.1093/nar/gkq388. PubMed PMID: 20478823; PubMed Central PMCID: PMCPMC2896184. 53. Quinlan AR, Hall IM. BEDTools: a flexible suite of utilities for comparing genomic features. Bioinformatics. 2010;26(6):841-2. doi: 10.1093/bioinformatics/btq033. PubMed PMID: 20110278; PubMed Central PMCID: PMCPMC2832824. 54. Kent WJ, Zweig AS, Barber G, Hinrichs AS, Karolchik D. BigWig and BigBed: enabling browsing of large distributed datasets. Bioinformatics. 2010;26(17):2204-7. doi: 10.1093/bioinformatics/btq351. PubMed PMID: 20639541; PubMed Central PMCID: PMCPMC2922891. 55. Stein LD. Using GBrowse 2.0 to visualize and share next-generation sequence data. Brief Bioinform. 2013;14(2):162-71. doi: 10.1093/bib/bbt001. PubMed PMID: 23376193; PubMed Central PMCID: PMCPMC3603216. 56. Farrona S, Thorpe FL, Engelhorn J, Adrian J, Dong X, Sarid-Krebs L, et al. Tissue-specific expression of FLOWERING LOCUS T in Arabidopsis is maintained independently of polycomb group protein repression. The Plant cell. 2011;23(9):3204-14. doi: 10.1105/tpc.111.087809. PubMed PMID: 21917549; PubMed Central PMCID: PMC3203448. 57. Ma H, Yanofsky MF, Meyerowitz EM. AGL1-AGL6, an Arabidopsis gene family with similarity to floral homeotic and transcription factor genes. Genes & development. 1991;5(3):484-95. PubMed PMID: 1672119. 58. Weigel D, Alvarez J, Smyth DR, Yanofsky MF, Meyerowitz EM. LFY controls floral meristem identity in Arabidopsis. Cell. 69:843-59. 59. Blazquez MA, Soowal LN, Lee I, Weigel D. LEAFY expression and flower initiation in Arabidopsis. Development. 1997;124(19):3835-44. PubMed PMID: 9367439. 60. Parcy F, Nilsson O, Busch MA, Lee I, Weigel D. A genetic framework for floral patterning. Nature. 1998;395(6702):561-6. doi: 10.1038/26903. PubMed PMID: 9783581. 61. Alvarez J, Smyth DR. CRABS CLAW and SPATULA, two Arabidopsis genes that control carpel development in parallel with AGAMOUS. Development. 1999;126(11):2377-86. PubMed PMID: 10225997. 62. Pelaz S, Ditta GS, Baumann E, Wisman E, Yanofsky MF. B and C floral organ identity functions require SEPALLATA MADS-box genes. Nature. 2000;405(6783):200-3. doi: 10.1038/35012103. PubMed PMID: 10821278.
Preprints (www.preprints.org) | NOT PEER-REVIEWED | Posted: 8 May 2017 doi:10.20944/preprints201705.0070.v1
Peer-reviewed version available at Epigenomes 2017, 1, 8; doi:10.3390/epigenomes1020008

32 of 32
63. Heisler MG, Atkinson A, Bylstra YH, Walsh R, Smyth DR. SPATULA, a gene that controls development of carpel margin tissues in Arabidopsis, encodes a bHLH protein. Development. 2001;128(7):1089-98. PubMed PMID: 11245574. 64. Krizek BA. Aintegumenta and Aintegumenta-Like6 regulate auxin-mediated flower development in Arabidopsis. BMC Res Notes. 2011;4:176. doi: 10.1186/1756-0500-4-176. PubMed PMID: 21645408; PubMed Central PMCID: PMCPMC3127960. 65. Krizek BA, Eaddy M. AINTEGUMENTA-LIKE6 regulates cellular differentiation in flowers. Plant molecular biology. 2012;78(3):199-209. doi: 10.1007/s11103-011-9844-3. PubMed PMID: 22076630. 66. Aukerman MJ, Sakai H. Regulation of flowering time and floral organ identity by a MicroRNA and its APETALA2-like target genes. The Plant cell. 2003;15(11):2730-41. doi: 10.1105/tpc.016238. PubMed PMID: 14555699; PubMed Central PMCID: PMC280575. 67. Hu YX, Wang YX, Liu XF, Li JY. Arabidopsis RAV1 is down-regulated by brassinosteroid and may act as a negative regulator during plant development. Cell research. 2004;14(1):8-15. doi: 10.1038/sj.cr.7290197. PubMed PMID: 15040885. 68. Zhao L, Nakazawa M, Takase T, Manabe K, Kobayashi M, Seki M, et al. Overexpression of LSH1, a member of an uncharacterised gene family, causes enhanced light regulation of seedling development. The Plant journal : for cell and molecular biology. 2004;37(5):694-706. PubMed PMID: 14871309. 69. Fowler SG, Cook D, Thomashow MF. Low temperature induction of Arabidopsis CBF1, 2, and 3 is gated by the circadian clock. Plant physiology. 2005;137(3):961-8. doi: 10.1104/pp.104.058354. PubMed PMID: 15728337; PubMed Central PMCID: PMCPMC1065397. 70. Ichikawa T, Nakazawa M, Kawashima M, Iizumi H, Kuroda H, Kondou Y, et al. The FOX hunting system: an alternative gain-of-function gene hunting technique. The Plant journal : for cell and molecular biology. 2006;48(6):974-85. doi: 10.1111/j.1365-313X.2006.02924.x. PubMed PMID: 17227551. 71. Cartagena JA, Matsunaga S, Seki M, Kurihara D, Yokoyama M, Shinozaki K, et al. The Arabidopsis SDG4 contributes to the regulation of pollen tube growth by methylation of histone H3 lysines 4 and 36 in mature pollen. Developmental biology. 2008;315(2):355-68. doi: 10.1016/j.ydbio.2007.12.016. PubMed PMID: 18252252. 72. Petricka JJ, Clay NK, Nelson TM. Vein patterning screens and the defectively organized tributaries mutants in Arabidopsis thaliana. The Plant journal : for cell and molecular biology. 2008;56(2):251-63. doi: 10.1111/j.1365-313X.2008.03595.x. PubMed PMID: 18643975. 73. Waters MT, Moylan EC, Langdale JA. GLK transcription factors regulate chloroplast development in a cell-autonomous manner. The Plant journal : for cell and molecular biology. 2008;56(3):432-44. doi: 10.1111/j.1365-313X.2008.03616.x. PubMed PMID: 18643989. 74. Nelson DC, Flematti GR, Riseborough JA, Ghisalberti EL, Dixon KW, Smith SM. Karrikins enhance light responses during germination and seedling development in Arabidopsis thaliana. Proceedings of the National Academy of Sciences of the United States of America. 2010;107(15):7095-100. doi: 10.1073/pnas.0911635107. PubMed PMID: 20351290; PubMed Central PMCID: PMCPMC2872431.
Preprints (www.preprints.org) | NOT PEER-REVIEWED | Posted: 8 May 2017 doi:10.20944/preprints201705.0070.v1
Peer-reviewed version available at Epigenomes 2017, 1, 8; doi:10.3390/epigenomes1020008