dynertia3 quick start (chassis- eddy current) - dtec current chassis dyno quick start... · 4...
TRANSCRIPT
www.dtec.net.au 1
DYNertia3 Quick Start (Chassis- Eddy Current)
‘Quick Start’ Guide for
Chassis Dyno- Eddy Current (closed loop)
(see www.DTEC.net.au for ‘Quick Start’ guides on other dyno types)
‘Quick Start’ Guide: Version BC/EC 8.1 (≥ V3.3.0)
DISCLAIMER: This software and hardware is provided "as is" without warranty of any kind, either express or implied, including, without limitation, any warranty of merchantability and fitness for a
particular purpose. In no event shall the creators of this software be liable for any direct, special, incidental or consequential damages arising out of the use or inability to use the software. The creators and distributors of this software shall not be liable for any loss, damages or costs, arising out of, but not limited to, lost profits or revenue, loss of use of the software, loss of data or equipment, the costs
of recovering software, data or equipment or claims by third parties, damage to equipment, or other similar costs.
For continuous product improvement and due to ongoing development, we reserve the right to alter specifications without notice.
WARNING: This hardware and software is protected by law and international treaties. Unauthorized reproduction or distribution of Dynertia, or any portion of it, may result in severe civil and criminal penalties and will be prosecuted to the maximum extent possible under law.
Dynertia software is copyright- Ross Mclean 2017 Dynertia hardware & firmware is copyright- Darren Todd 2017
www.dtec.net.au 2
DYNertia3 Quick Start (Chassis- Eddy Current)
STOP !!!
Important notice
To be read in conjunction with the main manual!
The following ‘Quick Start’ guide contains only basic information
for your Brake dyno (‘closed loop’ Eddy current type)
This is a brief overview of some main operations, it builds the base that will allow understanding of the features explained in the main
DYNertia3 manual.
Tip- There are sample test Runs installed along with DYNertia3 software so you can learn to use many of the features without needing to perform actual ‘Runs’.

www.dtec.net.au 3
DYNertia3 Quick Start (Chassis- Eddy Current)
Table of Contents
Concept............................................................................................................................................................................. 4 Types of testing used with brake (retarder/absorber) style dyno’s ....................................................................... 4
Hardware Mounting & Basic Wiring for Initial Setup ................................................................................................... 5 Mounting the speed sensor ....................................................................................................................................... 5 Mounting electrical components ............................................................................................................................... 5 Wiring eddy controller (basic, for initially testing) .................................................................................................. 6 Eddy current controller wiring harness connections .............................................................................................. 7 Wiring of the load cell (including pressure sensor style) ....................................................................................... 8 Example of typical wiring (additional devices shown) ............................................................................................ 9
‘Linking’ Hardware to PC .............................................................................................................................................. 10
Two Main DYNertia3 Windows (DYNO / GRAPH) ....................................................................................................... 11
Basic Hardware Settings............................................................................................................................................... 12
Basic Software settings (default) ................................................................................................................................. 13
Quick Test of Dyno Speed Sensor ............................................................................................................................... 13
Load Cell Setup & Calibration ...................................................................................................................................... 14 Sensor Calibration .................................................................................................................................................... 14
Load Control System Commissioning ........................................................................................................................ 16
Displaying Engine RPM (One Method) ........................................................................................................................ 19
Performing a Brake ‘Steady State’ Manual Test ......................................................................................................... 20 Steady state tuning by monitoring live torque and power .................................................................................... 20 Observing the engine data ....................................................................................................................................... 21
Performing a Brake ‘Ramp’ Test Run .......................................................................................................................... 22 Setting the ramp characteristics ............................................................................................................................. 22
Viewing/Loading of Runs (‘Graph’ Window) ............................................................................................................... 23 Loading test Runs into the Graph Window to view and analyze ......................................................................... 23 Finding Folders to view or to save tests into ......................................................................................................... 24 Creating/Deleting new Folders to save tests into .................................................................................................. 24
Basic Analysis of Saved Data ...................................................................................................................................... 25
Windows for Further Analysis of Saved Data ............................................................................................................. 26
Shortcut Keys ................................................................................................................................................................ 27
www.dtec.net.au 4
DYNertia3 Quick Start (Chassis- Eddy Current)
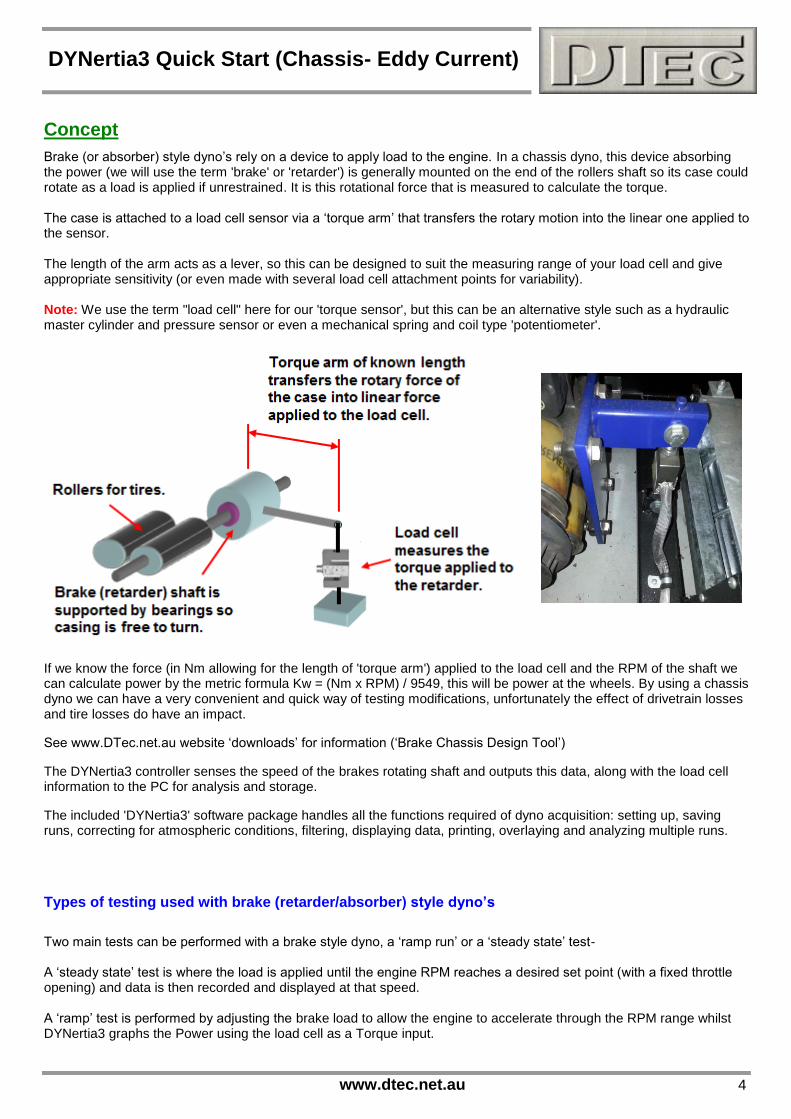
Concept
Brake (or absorber) style dyno’s rely on a device to apply load to the engine. In a chassis dyno, this device absorbing the power (we will use the term 'brake' or 'retarder') is generally mounted on the end of the rollers shaft so its case could rotate as a load is applied if unrestrained. It is this rotational force that is measured to calculate the torque. The case is attached to a load cell sensor via a ‘torque arm’ that transfers the rotary motion into the linear one applied to the sensor. The length of the arm acts as a lever, so this can be designed to suit the measuring range of your load cell and give appropriate sensitivity (or even made with several load cell attachment points for variability). Note: We use the term "load cell" here for our 'torque sensor', but this can be an alternative style such as a hydraulic master cylinder and pressure sensor or even a mechanical spring and coil type 'potentiometer'.
If we know the force (in Nm allowing for the length of 'torque arm') applied to the load cell and the RPM of the shaft we can calculate power by the metric formula Kw = (Nm x RPM) / 9549, this will be power at the wheels. By using a chassis dyno we can have a very convenient and quick way of testing modifications, unfortunately the effect of drivetrain losses and tire losses do have an impact.
See www.DTec.net.au website ‘downloads’ for information (‘Brake Chassis Design Tool’)
The DYNertia3 controller senses the speed of the brakes rotating shaft and outputs this data, along with the load cell information to the PC for analysis and storage.
The included 'DYNertia3' software package handles all the functions required of dyno acquisition: setting up, saving runs, correcting for atmospheric conditions, filtering, displaying data, printing, overlaying and analyzing multiple runs.
Types of testing used with brake (retarder/absorber) style dyno’s
Two main tests can be performed with a brake style dyno, a ‘ramp run’ or a ‘steady state’ test- A ‘steady state’ test is where the load is applied until the engine RPM reaches a desired set point (with a fixed throttle opening) and data is then recorded and displayed at that speed. A ‘ramp’ test is performed by adjusting the brake load to allow the engine to accelerate through the RPM range whilst DYNertia3 graphs the Power using the load cell as a Torque input.

www.dtec.net.au 5
DYNertia3 Quick Start (Chassis- Eddy Current)
Hardware Mounting & Basic Wiring for Initial Setup Mounting the speed sensor
Mount the sensor system to detect the rotation of the dyno brake shaft by mounting the included sensor against your ‘target’ wheel. It must be made of an iron based metal (i.e. a magnet must be able to stick to it), do not use brass, aluminium, stainless steel etc. Note: The target wheel must have an even number of teeth. The number of teeth is entered into the software so there is some flexibility in design. Too many teeth and upper RPM is limited, too few and control precision is reduced. We suggest using a target with between 40 and 100 teeth (60 are common), contact us if any doubts! Note: We suggest 1.0mm to 1.8mm clearance if you can set this without any chance of collision during operation. After the gap is set you must slowly turn dyno and check clearance for a full rotation to allow for any ‘runout’ in your target wheel, quality sensors are expensive! Observe speed reading when testing (note that software will not display at very low RPM, you will need a test vehicle to turn fast enough), adjust clearance if required.
DO NOT MOUNT SENSOR AT 90° TO TARGET WHEEL, MOUNT AS SHOWN ABOVE ONLY! KEY POINTS- Small air gap (with no chance of collision), iron target wheel and even number of teeth!
Mounting electrical components
1) Mount the sensor at the furthest distance from the engine and brake as possible.
2) Keep the sensor leads (speed, load cell, accessories etc.) as far as possible away from the engine, brake power supply and mains wiring (and any electric motors such as cooling fans). It’s best to wire sensors with a shielded cable and route sensor cables inside protective metal tubing or keep separated from any high current wiring by mounting behind the earthed metal of the dyno frame or shields. Secure at the control units to prevent movement of the cables.
3) Keep the controller and PC at a distance. Coil any spare cable up neatly at the PC.
DYNertia3 software can even be operated by remote control if required (using a cheap PC ‘page turner’ or wireless keyboard are some options), tests can be started and stopped and new files even created (names incremented).
4) Always use resistive Spark plugs and suppressed Spark plug leads to prevent interference (at least during
testing).
KEY POINTS- Keep sensor wires away from high current wires/devices, keep all electronics and sensor wiring away from the engine and beware of un-suppressed leads and non-resistor plugs!
www.dtec.net.au 6
DYNertia3 Quick Start (Chassis- Eddy Current)
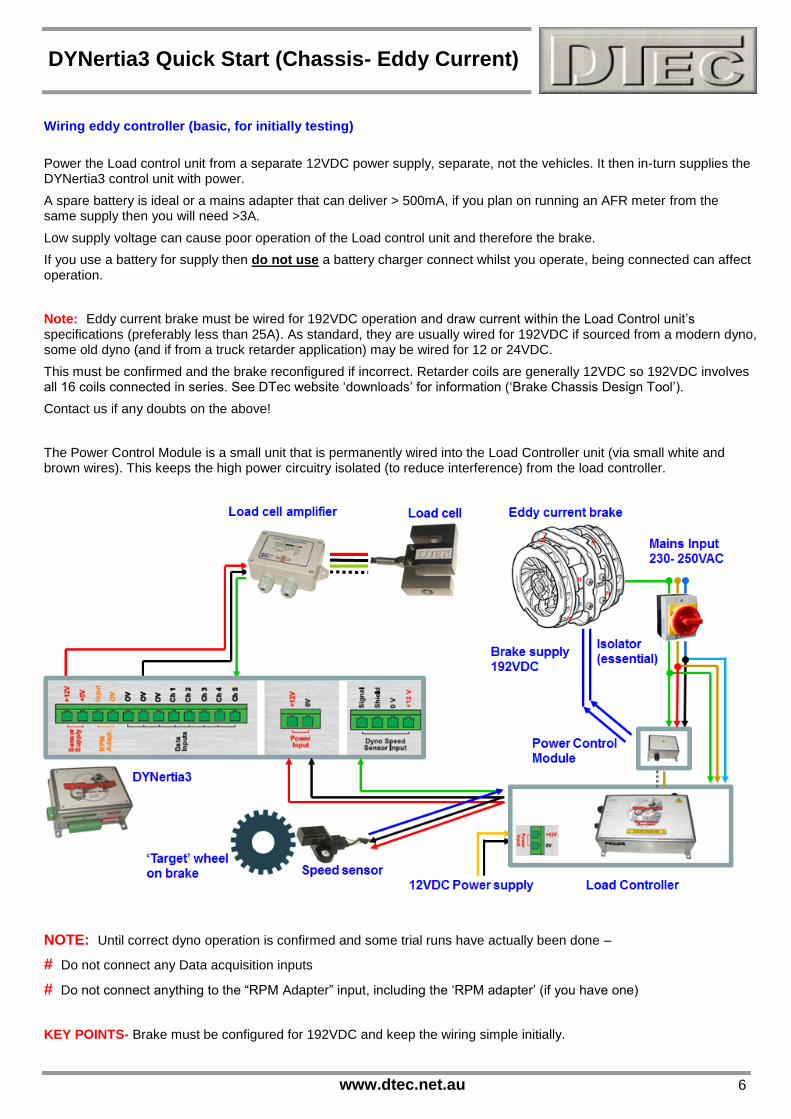
Wiring eddy controller (basic, for initially testing)
Power the Load control unit from a separate 12VDC power supply, separate, not the vehicles. It then in-turn supplies the DYNertia3 control unit with power.
A spare battery is ideal or a mains adapter that can deliver > 500mA, if you plan on running an AFR meter from the same supply then you will need >3A.
Low supply voltage can cause poor operation of the Load control unit and therefore the brake.
If you use a battery for supply then do not use a battery charger connect whilst you operate, being connected can affect operation.
Note: Eddy current brake must be wired for 192VDC operation and draw current within the Load Control unit’s specifications (preferably less than 25A). As standard, they are usually wired for 192VDC if sourced from a modern dyno, some old dyno (and if from a truck retarder application) may be wired for 12 or 24VDC.
This must be confirmed and the brake reconfigured if incorrect. Retarder coils are generally 12VDC so 192VDC involves all 16 coils connected in series. See DTec website ‘downloads’ for information (‘Brake Chassis Design Tool’).
Contact us if any doubts on the above!
The Power Control Module is a small unit that is permanently wired into the Load Controller unit (via small white and brown wires). This keeps the high power circuitry isolated (to reduce interference) from the load controller.
NOTE: Until correct dyno operation is confirmed and some trial runs have actually been done –
# Do not connect any Data acquisition inputs
# Do not connect anything to the “RPM Adapter” input, including the ‘RPM adapter’ (if you have one)
KEY POINTS- Brake must be configured for 192VDC and keep the wiring simple initially.

www.dtec.net.au 7
DYNertia3 Quick Start (Chassis- Eddy Current)
Eddy current controller wiring harness connections
WARNING: Mains wiring must be performed in accordance to local electrical standards by an appropriately qualified
technician.
Wiring junctions must be protected fully from accidental contact and components must be earthed in accordance to best practice to ensure electrical protection devices are fully functional.
The system is to be powered via protection devices incorporated into the buildings supply distribution, ensure all circuit wiring and breakers are correctly sized for your brakes current draw. Fit a mains isolation switch and never work on the system (inc. retarder) with the power on.
The current drawn from the mains supply depends on the brakes electrical design and the power setting in DYNertia3 software. It is generally highest in the ‘roller brake enabled’ mode when the rollers are locked to assist in remove a vehicle from a chassis dyno. Use suitable wiring size for the current draw (i.e. 4mm^2 may be suitable based on brake choice). When calculating peak current draw into the brake resistance, allow for fact that up to 240VDC may be supplied.
Mains input into Power Control Module (High current for brake is sourced from here):
Black Neutral 230 - 250VAC
Red Active 230 - 250VAC
Green/Yellow Earth 230 - 250VAC
High Voltage power supply output to brake from Power Control Module:
Blue Negative 192VDC. An Eddy brake has no polarity i.e. it doesn’t matter which blue
Blue Positive 192VDC. wire is positive or negative.
Mains input into Load Controller unit (Low current used only for sensing mains voltage):
Blue Neutral 230 - 250VAC
Brown Active 230 - 250VAC
Green/Yellow Earth 230 - 250VAC
Power supply input for Load Controller unit (terminal connector):
2 pin Connector 12VDC Connect a power supply to the input terminals of Load Controller unit
Power supply output from Load Controller for DYNertia3:
Black Negative Connects to “Power Input” terminal of DYNertia3 unit
Red Positive Connects to “Power Input” terminal of DYNertia3 unit
Speed signal from Load Controller to DYNertia3:
Green Pulse out Connects to speed sensor input “Signal” terminal of DYNertia3 unit
Speed sensor input to Load Controller:
Blue Pulse in Connects to Yellow wire of provided speed sensor
Black Negative Connects to Black wire of provided speed sensor
Red Positive Connects to White wire of provided speed sensor
USB leads from Load Controller and DYNertia3 units:
USB Data Connect USB leads into PC
A USB isolation ‘hub’ is provided to allow full electrical isolation from the computer (often not enough USB ports either). Connect DYNertia3, Load Controller and WeatherWatch via this hub. Use only quality USB leads for all connections. Note: Low speed USB devices such as mice and keyboards will not work in the hub, plug these directly into computer.
www.dtec.net.au 8
DYNertia3 Quick Start (Chassis- Eddy Current)
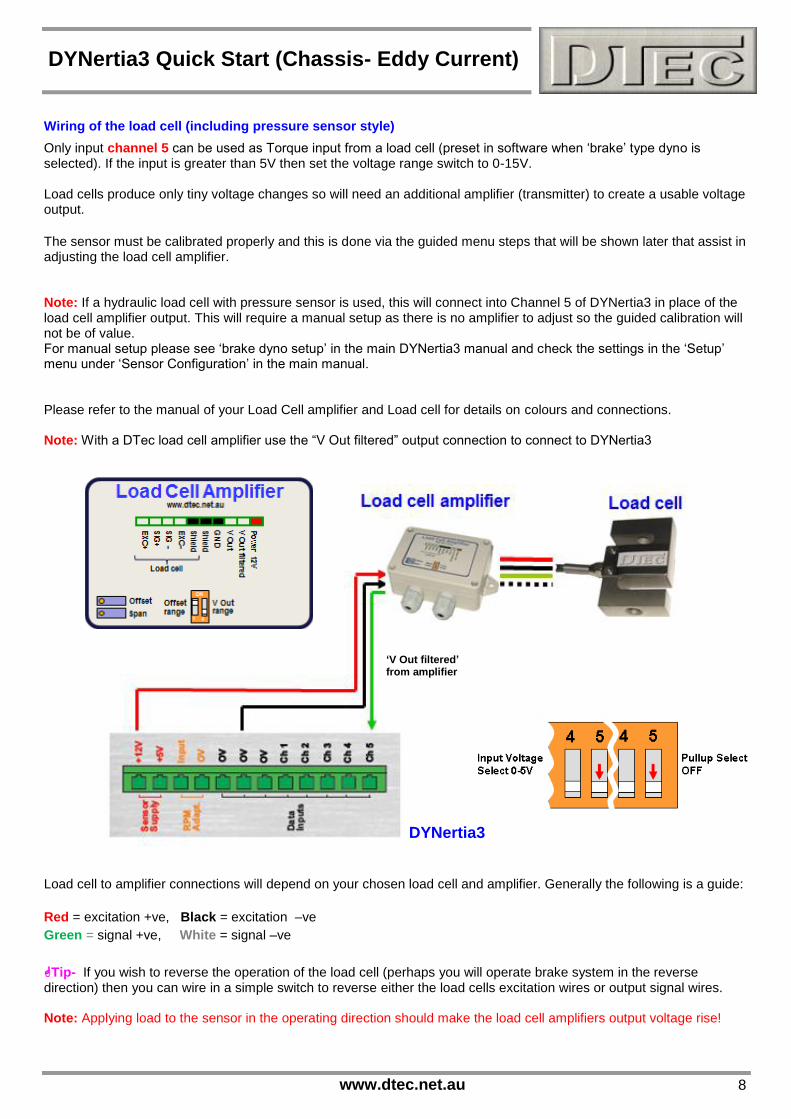
Wiring of the load cell (including pressure sensor style)
Only input channel 5 can be used as Torque input from a load cell (preset in software when ‘brake’ type dyno is selected). If the input is greater than 5V then set the voltage range switch to 0-15V. Load cells produce only tiny voltage changes so will need an additional amplifier (transmitter) to create a usable voltage output.
The sensor must be calibrated properly and this is done via the guided menu steps that will be shown later that assist in adjusting the load cell amplifier. Note: If a hydraulic load cell with pressure sensor is used, this will connect into Channel 5 of DYNertia3 in place of the load cell amplifier output. This will require a manual setup as there is no amplifier to adjust so the guided calibration will not be of value. For manual setup please see ‘brake dyno setup’ in the main DYNertia3 manual and check the settings in the ‘Setup’ menu under ‘Sensor Configuration’ in the main manual. Please refer to the manual of your Load Cell amplifier and Load cell for details on colours and connections. Note: With a DTec load cell amplifier use the “V Out filtered” output connection to connect to DYNertia3 Load cell to amplifier connections will depend on your chosen load cell and amplifier. Generally the following is a guide:
Red = excitation +ve, Black = excitation –ve
Green = signal +ve, White = signal –ve
Tip- If you wish to reverse the operation of the load cell (perhaps you will operate brake system in the reverse direction) then you can wire in a simple switch to reverse either the load cells excitation wires or output signal wires. Note: Applying load to the sensor in the operating direction should make the load cell amplifiers output voltage rise!
DYNertia3
‘V Out filtered’ from amplifier

www.dtec.net.au 9
DYNertia3 Quick Start (Chassis- Eddy Current)
Example of typical wiring (additional devices shown)
Note: Make sure you have successful completed the basic installation and testing before connecting ANY sensors or even an ‘RPM Adapter’ to the DYNertia3 Control unit!
Please refer to the main DYNertia3 Manuals chapter called ‘Inputs- Using’ for full wiring details on connection of data acquisition devices and methods of connecting an optional ‘RPM Adapter’.

www.dtec.net.au 10
DYNertia3 Quick Start (Chassis- Eddy Current)
‘Linking’ Hardware to PC
Do not run other programs when using DYNertia3, background processes could interfere.
1. When you first run DYNertia3 you will be shown this Window. Press the “Continue OFFLINE” button, this is
necessary as DYNertia3 software does not yet know what PC communication port your control units are connected to, it must be first ‘Linked’.
Once ‘Linked’ DYNertia3 will automatically find the hardware in future when it is connected, powered and the software is started. If you plug DYNertia3 or Load Controller hardware into another USB port you may need to re-link. This Window will also appear whenever DYNertia3 is started and the control units are not connected, powered or ‘Linked’. Pressing the “Continue OFFLINE” button allows you to continue to use DYNertia3 to view and analyse data ‘off-line’ (i.e. with no hardware connected to the PC).
2. Power your DYNertia3 and Load Control units and plug the USB in, start DYNertia3 software, select the menu option
“Setup” and then choose “Communication” and then press the “LINK” button to DYNertia3 to automatically configure the port interface. Then repeat for ‘Load Controller’ or ‘Weather Watch’ if connected.

www.dtec.net.au 11
DYNertia3 Quick Start (Chassis- Eddy Current)
Two Main DYNertia3 Windows (DYNO / GRAPH) Press the “DYNO” / “GRAPH” button to change between the 2 main Windows of DYNertia3. The ‘DYNO’ Window is used to select and create files, enter the weather details, record vehicle test data, ‘teach’ gear ratios, view RPM/speed and control the testing. Note: This Window is only visible when the control unit is connected, powered and ‘Linked’.
Note: The Row of gauges (input channel data) shown along the bottom of the screen are visible with a single monitor. With duel monitors this data is displayed on the second monitor instead and replaced with the test ‘comments’ field (also found in ‘View’ menu).
The ‘GRAPH’ Window displays the Power and Torque as traces that can be overlayed and analysed. Traces from a test Run can be selected, loaded from file and compared.
Note: The ‘Setup’ menus (and most menus) discussed in the following pages are only accessible from this GRAPH screen (they are ‘greyed’ out in DYNO screen)
Note: The RPM/Speed button makes the software use either units of RPM or speed (e.g. kph) for the controls, displays and graphs.
Note: When test Runs are visible on the graph we refer to them as ’traces’.
Note: The DYNertia3 Window does not size itself to the PC screen, if you wish you can adjust your PC screen resolution to best suit (Program Window size is1024 x 768)

www.dtec.net.au 12
DYNertia3 Quick Start (Chassis- Eddy Current)
Basic Hardware Settings As an example we will perform both a ‘steady state’ test and then a ‘ramp’ test, we will save the results and look at basic analysis of the data. We will assume the brake is driven directly by the roller. This is common when eddy brakes are used on chassis dynos. Assumed is also that DYNertia3 sensor is picking dyno RPM up from the brake (load) shaft and your load cell has been wired to input channel 5 and calibrated as required. At the top Left of the Window you will find the menu options. Under the menu option “Setup” you will find “Hardware”.
Ensure ‘BRAKE’ mode is selected. Select ‘CHASSIS’ dyno type.
Roller Circumference: Enter roller circumference (1000mm in this example) to ensure speeds displayed (kph/mph) are correct Pulse Generator: The number of teeth on the sensor ‘target’ wheel must be entered (“60” here as typical example). # Leave other settings in their default position as shown, especially DO NOT choose any alternative RPM source. Note: Your dyno’s inertial mass will be needed later if you choose to test with Inertia correction (critical for ramp testing) or do a ‘losses’ rundown (see main DYNertia3 manual in setup/hardware section for details).

www.dtec.net.au 13
DYNertia3 Quick Start (Chassis- Eddy Current)
Basic Software settings (default) Shown below are the software settings (menu choice ‘Setup/Software’), see the main DYNertia3 manual for any details. Leave the settings at default (except multiple monitor if possible), but take the time to see what options are available–
Note: The option “Multiple Monitor Support” is strongly recommended. Having two monitors allows additional functions. This is particularly important with a load controller connected and performing tests as the ‘Load Control’ window and test progress ‘Graph’ can be positioned to view without interference.
Quick Test of Dyno Speed Sensor Before performing testing it is advisable to do a quick function check. Open the main ‘DYNO’ Window and observe the RPM gauge while vehicle is turning the dyno. It is often worth a quick look before dyno testing to check for a steady and accurate reading as this will show the RPM ratio setup is correct and the speed sensor is operating.
At this stage of setup the gauge will just be displaying dyno roller RPM, not engine RPM as no drive ratio has been specified It may require you to rescale to observe the reading. See ‘Note’ below. The software will not display at very low RPM, so drive at reasonable speed.
The RPM/Speed button makes the software use either units of RPM or speed (e.g. kph).
Note: The scales of the gauges used during actual testing can be altered in the menu option ‘Scales’ (when analysing existing runs they are automatically scaled). Note: In inertia dyno mode the ‘Torque’ and ‘Power’ displays do not show data during a test, these are for analysing data after a test.
www.dtec.net.au 14
DYNertia3 Quick Start (Chassis- Eddy Current)
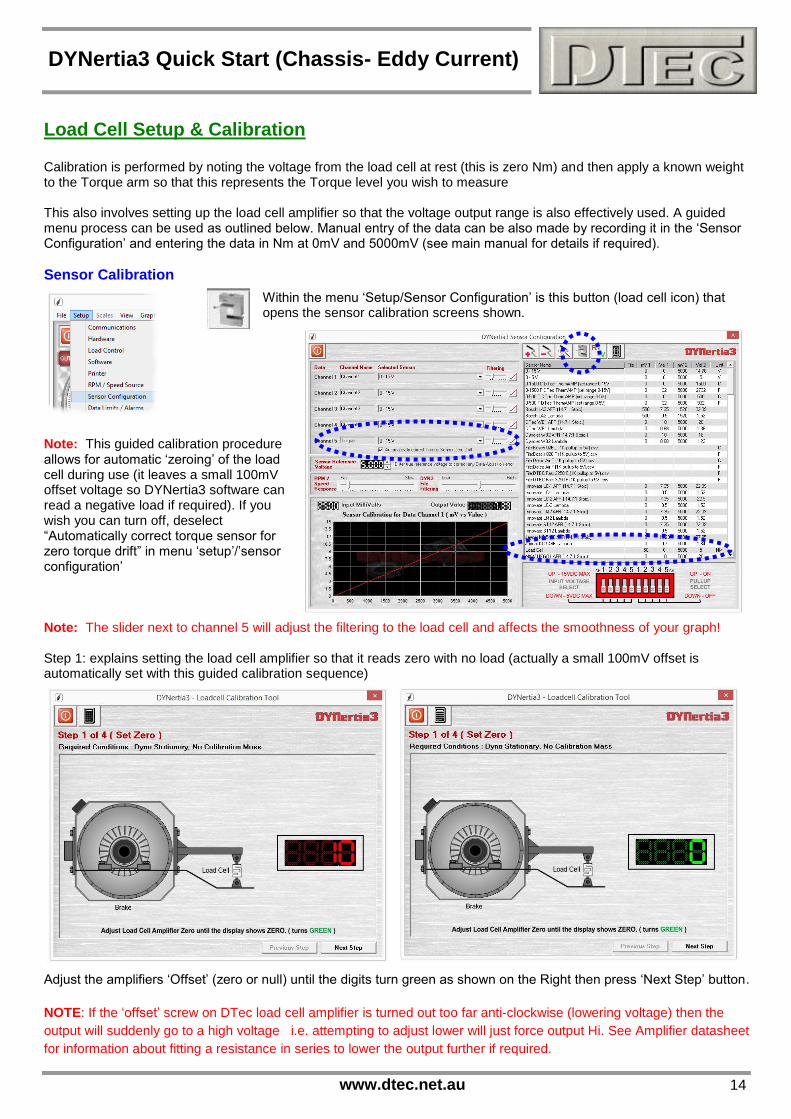
Load Cell Setup & Calibration Calibration is performed by noting the voltage from the load cell at rest (this is zero Nm) and then apply a known weight to the Torque arm so that this represents the Torque level you wish to measure This also involves setting up the load cell amplifier so that the voltage output range is also effectively used. A guided menu process can be used as outlined below. Manual entry of the data can be also made by recording it in the ‘Sensor Configuration’ and entering the data in Nm at 0mV and 5000mV (see main manual for details if required).
Sensor Calibration
Within the menu ‘Setup/Sensor Configuration’ is this button (load cell icon) that opens the sensor calibration screens shown.
Note: This guided calibration procedure allows for automatic ‘zeroing’ of the load cell during use (it leaves a small 100mV offset voltage so DYNertia3 software can read a negative load if required). If you wish you can turn off, deselect “Automatically correct torque sensor for zero torque drift” in menu ‘setup’/’sensor configuration’ Note: The slider next to channel 5 will adjust the filtering to the load cell and affects the smoothness of your graph! Step 1: explains setting the load cell amplifier so that it reads zero with no load (actually a small 100mV offset is automatically set with this guided calibration sequence)
Adjust the amplifiers ‘Offset’ (zero or null) until the digits turn green as shown on the Right then press ‘Next Step’ button.
NOTE: If the ‘offset’ screw on DTec load cell amplifier is turned out too far anti-clockwise (lowering voltage) then the
output will suddenly go to a high voltage i.e. attempting to adjust lower will just force output Hi. See Amplifier datasheet
for information about fitting a resistance in series to lower the output further if required.

www.dtec.net.au 15
DYNertia3 Quick Start (Chassis- Eddy Current)
Step 2: requires applying a known weight and entering the data. Then the load cell amplifiers ‘Span’ (gain) is adjusted till the digits turn green. Software calculates the target figure based on full scale being equal to the load cells rating and the target being a portion of this based on the test weight you use. Note: When calibrating, accuracy will suffer if a test weight is used that is too low a percentage of the load cells maximum scale, use a high a weight as practical. You can add an extension to or lever above the load cell mounting arm (called a ‘calibration arm’ in the industry) so less actual weight is needed during calibration (i.e. it acts as a lever to apply more effective weight onto the load cell), but factor this in so you only enter the actual weight applied to the load cell.
Step 3: asks to repeat the process to confirm. This is because with a load cell amplifier adjusting Span will effect Offset and vice versa. Note: Please see your DTec Load Cell Amplifier technical sheet if you are having trouble adjusting the settings within range. You can also alter your load cells entered rating figure slightly if required to get the adjustments within range.
Step 4: asks you to press the ‘Save Calibration’ button. It then loads the data into the sensor configuration screen under a sensor called “Load Cell”. It will automatically set the voltage that represents no load and also set the torque that is represented by 5000mV Tip- Press the “i” button you can see the data that will be used by the software. You can check the data if you like by using- Torque = load (weight in Kg applied x 9.80665) x length of torque arm in meter’s

www.dtec.net.au 16
DYNertia3 Quick Start (Chassis- Eddy Current)
Load Control System Commissioning Use menu option ‘Setup/Load Control’ to open the tool below that is used to setup the Load control system and adjust its performance.
The Load Controller Setup Window below is designed to allow you to adjust the control behaviour of your dyno. You set a target RPM or speed and then see how well the system can hold the RPM on this target and how quickly it can stabilise. Once setup, these ‘Load Controller Setup’ settings and PID tunning values are unlikely to need adjusting again!
Note: All RPM displayed in this Window will be roller (brake) RPM unless a ratio has been entered (discussed later). Tip-You can use speed (kph as shown above) instead of RPM by changing modes with this button (top left of main “GRAPH’ screen. However RPM provides better resolution for setup.
Load Unit- Current Limitation: This sets the maximum power that is provided to the brake. 100% can be used if you are sure that both the mains supply and DYnertia3 can handle the maximum current drawn by the brake.
Note: 100% gives the controller maximum effective control and is usually best, but only if you are sure of not exceeding electrical ratings. Please contact us if in doubt as destruction of the system may result!
Load Control Output: For an eddy current dyno set to ‘AC Phase
Sudden RPM/Speed Drop Warning: This determines the acceptable drop in RPM or speed that is allowed when a test is started i.e. it would not be good to have an engine at high RPM and then suddenly demand a very low RPM as mechanical damage (or strain on vehicle restraints) could result.
Tip- Before actually tunning the PID as below, for an initial test that the system is functioning you can connect the brake supply wires to a standard 240VAC incandescent globe (e.g. a desk lamp) instead of the brake, watch the lamp light up as the test target speed is exceeded and turn off as you fall below the target speed.

www.dtec.net.au 17
DYNertia3 Quick Start (Chassis- Eddy Current)
Close to being OK (still oscillating slightly)
Load control system commissioning (cont.)
PID Test Settings: You can set the test format for PID tunning. Usually the ‘Constant’ mode is used for setup and then a ‘Ramp’ is used for confirmation that the PID power displayed is not fluctuating wildly under an actual ramp test simulation
PID power control smoothness test after tunning by doing a ‘ramp’ shown Left (good result)
The method the Load controller uses to maintain the set RPM is called a PID algorithm; this comes from the three terms it uses to operate (Proportional, Integral and Derivative). A PID algorithm measures the difference between the desired RPM and the actual RPM, based on this ‘error’ the brake current is controlled to correct it. Ideal control of the brake would allow the engine RPM to very quickly achieve the target RPM and then maintain it without large fluctuations. In reality it is OK to have some ‘overshoot’ or to have a small time to settle, these are both preferred over oscillations (‘hunting’ up and down)! Compromises such as a little overshoot in turn for smoother operation are often made. The screen above shows the speed is holding but has a slight oscillation (surge) that should be tuned out, the ‘PID power’ is very constant as is required for good data during testing (less torque fluctuations from brake), it’s close! Note: Every dyno design has different behaviour due to inertia, brake power, engine power, gearing etc. so it is not possible to have one setting for all dyno. You WILL need to tune to get acceptable behaviour when commissioning.
www.dtec.net.au 18
DYNertia3 Quick Start (Chassis- Eddy Current)
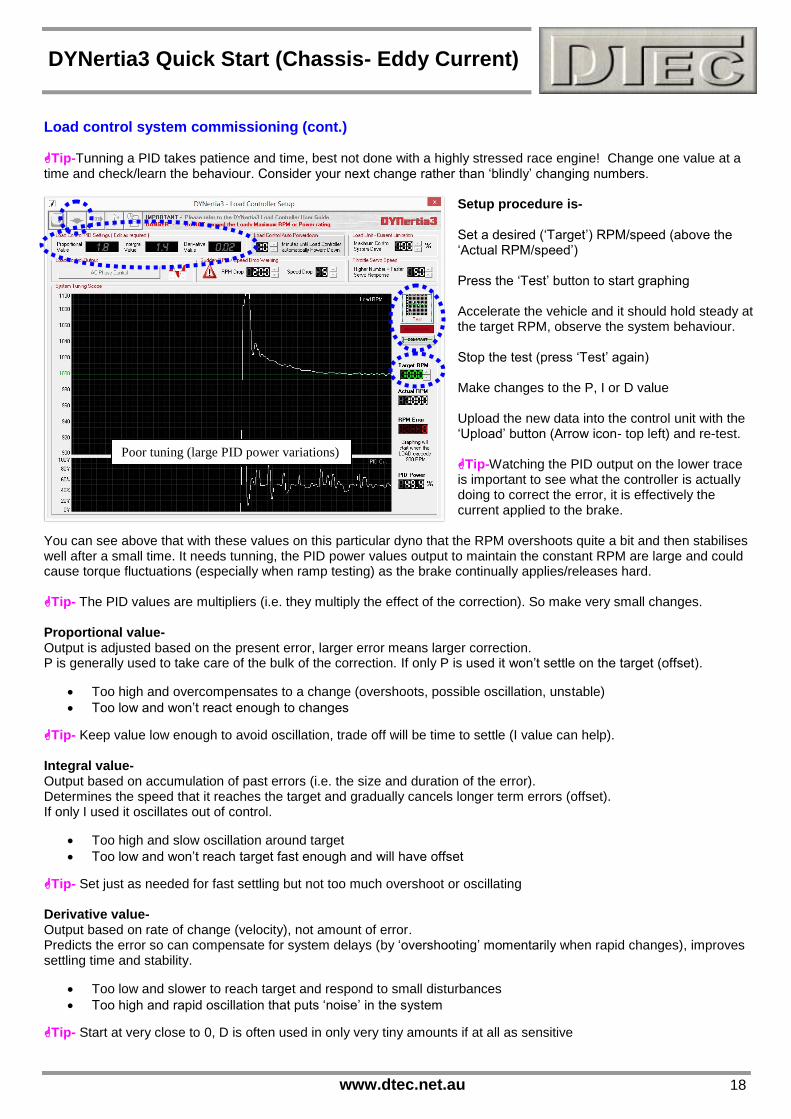
Poor tuning (large PID power variations)
Load control system commissioning (cont.) Tip-Tunning a PID takes patience and time, best not done with a highly stressed race engine! Change one value at a time and check/learn the behaviour. Consider your next change rather than ‘blindly’ changing numbers.
Setup procedure is- Set a desired (‘Target’) RPM/speed (above the ‘Actual RPM/speed’) Press the ‘Test’ button to start graphing Accelerate the vehicle and it should hold steady at the target RPM, observe the system behaviour. Stop the test (press ‘Test’ again) Make changes to the P, I or D value Upload the new data into the control unit with the ‘Upload’ button (Arrow icon- top left) and re-test. Tip-Watching the PID output on the lower trace is important to see what the controller is actually doing to correct the error, it is effectively the current applied to the brake.
You can see above that with these values on this particular dyno that the RPM overshoots quite a bit and then stabilises well after a small time. It needs tunning, the PID power values output to maintain the constant RPM are large and could cause torque fluctuations (especially when ramp testing) as the brake continually applies/releases hard. Tip- The PID values are multipliers (i.e. they multiply the effect of the correction). So make very small changes. Proportional value- Output is adjusted based on the present error, larger error means larger correction. P is generally used to take care of the bulk of the correction. If only P is used it won’t settle on the target (offset).
Too high and overcompensates to a change (overshoots, possible oscillation, unstable)
Too low and won’t react enough to changes
Tip- Keep value low enough to avoid oscillation, trade off will be time to settle (I value can help). Integral value- Output based on accumulation of past errors (i.e. the size and duration of the error). Determines the speed that it reaches the target and gradually cancels longer term errors (offset). If only I used it oscillates out of control.
Too high and slow oscillation around target
Too low and won’t reach target fast enough and will have offset
Tip- Set just as needed for fast settling but not too much overshoot or oscillating Derivative value- Output based on rate of change (velocity), not amount of error. Predicts the error so can compensate for system delays (by ‘overshooting’ momentarily when rapid changes), improves settling time and stability.
Too low and slower to reach target and respond to small disturbances
Too high and rapid oscillation that puts ‘noise’ in the system
Tip- Start at very close to 0, D is often used in only very tiny amounts if at all as sensitive

www.dtec.net.au 19
DYNertia3 Quick Start (Chassis- Eddy Current)
Displaying Engine RPM (One Method) We are going to test for now without a direct engine RPM signal (such as from the optional ‘RPM Adapter’). Knowing the engine RPM allows the torque to be derived to the engine, not just be at the rollers. As we do not have direct measurement of engine RPM we have three options for testing. We could test quickly (as most commonly do) with just Speed as the graph X-axis (kph instead of RPM), but we will choose another option which we will call ‘option 3’; this option will assume the vehicle has its own tacho fitted already. All RPM input options and the effect on testing are explained in the main manual! Option 3- Ratio Teach- If DYNertia3 knows the drive ratio between the engine and the dyno it can calculate actual engine RPM from the dyno roller RPM (as measured by the sensor).
Press the ‘Speed to RPM’ button, right hand side on the main ‘DYNO’ Window to make the Window shown below visible.
Drive vehicle until it’s tacho matches the ‘Engine Target RPM’ in your test gear (4000 RPM in this example shown; alter this set point if RPM not suitable for your vehicle) then simply press a ‘Compute Ratio’ button, we will use “Compute Ratio 4” in this example to remind us we are testing in 4th gear. The calculated ratio will now appear in the box above the button (1.9895 in this example) Tip- If you know the RPM at a certain speed you can enter this and DYNertia3 will calculate the drive ratio. For example if it does 3500RPM at 150kph then enter “3500=150” manually in any of the ‘Target to Engine Ratio’ fields. Press Enter and your setting will be transferred to the ‘Record Settings’ panel for “Current Ratio” (in the ‘DYNO’ Window). That’s it! DYNertia3 now knows the engine RPM for any speed driven in the gear just used. You can ‘teach’ other gears also if you want to do testing in multiple gears. The ratio you want to use for testing can then be selected in the ‘Record Settings’ panel for “Current Ratio” (in the ‘DYNO’ Window).

www.dtec.net.au 20
DYNertia3 Quick Start (Chassis- Eddy Current)
Performing a Brake ‘Steady State’ Manual Test We will perform basic ‘Steady State’ tuning by manually setting various target speed and observe the Torque/Power changes on the dials, chart recorders and various displays as modifications are made.
Note: ‘Speed’ mode (kph) is often best as ‘RPM’ mode requires the drive ratio to be set and not alter (as it will with gear shifts or torque convertor slip). Button is top Left on main ‘GRAPH’ screen.
Steady state tuning by monitoring live torque and power
Enter the main ‘DYNO’ Window.
Enter the current Temperature, Barometric pressure and Humidity into the ‘Correction Factors’ box. If you have no weather data then go to menu option “Setup/Software” and select “No correction” in “DYNO Correction Systems”.
If you have the optional ‘Weather Watch’ hardware all this data is updated automatically, but first you must select the menu option “Setup/Communications”, connect the unit and ‘Link’ the Weather Watch hardware. .
The small ‘Load Control’ Window below appears. This is used to set the type of testing we wish to do and any settings required. This window can be ‘dragged’ to any location on the screen/screens so that it doesn’t obscure vision. It can even be made transparent with the ‘AB’ icon button.
Enable ‘Manual’ control by selecting the ‘Dial’ button. Pressing the large “MANUAL START” button now activates the load controller so that it powers the brake and maintains the target RPM/speed.
The target RPM/speed can be adjusted in slow or fast steps with 3 options- 1) Use mouse to drag the by the knob by the edge (hold Left button for slow,
Right for fast) 2) Adjust with the PC’s F1-F4 keys (F1/F2 slow, F3/F4 fast) 3) Manually entering a figure (press the icon of dial with “SET” on it)
Settings (shown below) for the adjustment step size, adjustment RPM/speed, min RPM/speed and other parameters can be found by pressing this button on the Load control Window.
You can now set a target RPM/speed and gradually accelerate up to that speed until the brake begins to hold the speed constant, adjust as required.
Tip- The RPM/speed step size applied to the F1–F4 keys can be set so that it coincides with RPM points in the fuel/ignition table of an engine ECU, this speeds up ECU mapping i.e. to quickly jump from one RPM ‘cell’ to another. # To exit the test press the “MANAL STOP” button and then press “GRAPH” button to return to main Graph Window.

www.dtec.net.au 21
DYNertia3 Quick Start (Chassis- Eddy Current)
Observing the engine data
The available windows to view data in depend on the fitment of a second monitor. Due to limited screen space, with only a single monitor the data is displayed as shown to the Left. There are chart recorders and gauges for RPM, torque and power, whilst the 4 data channels are displayed on a second set of gauges with alarm limits.
If a multiple monitors are fitted then there will be a dropdown list of possible display Windows for the second monitor.
Note: Press the ‘GAUGES’ button to turn second display on and off.
Below is a preview of the Windows available on a second monitor, please see main manual for full details.
www.dtec.net.au 22
DYNertia3 Quick Start (Chassis- Eddy Current)
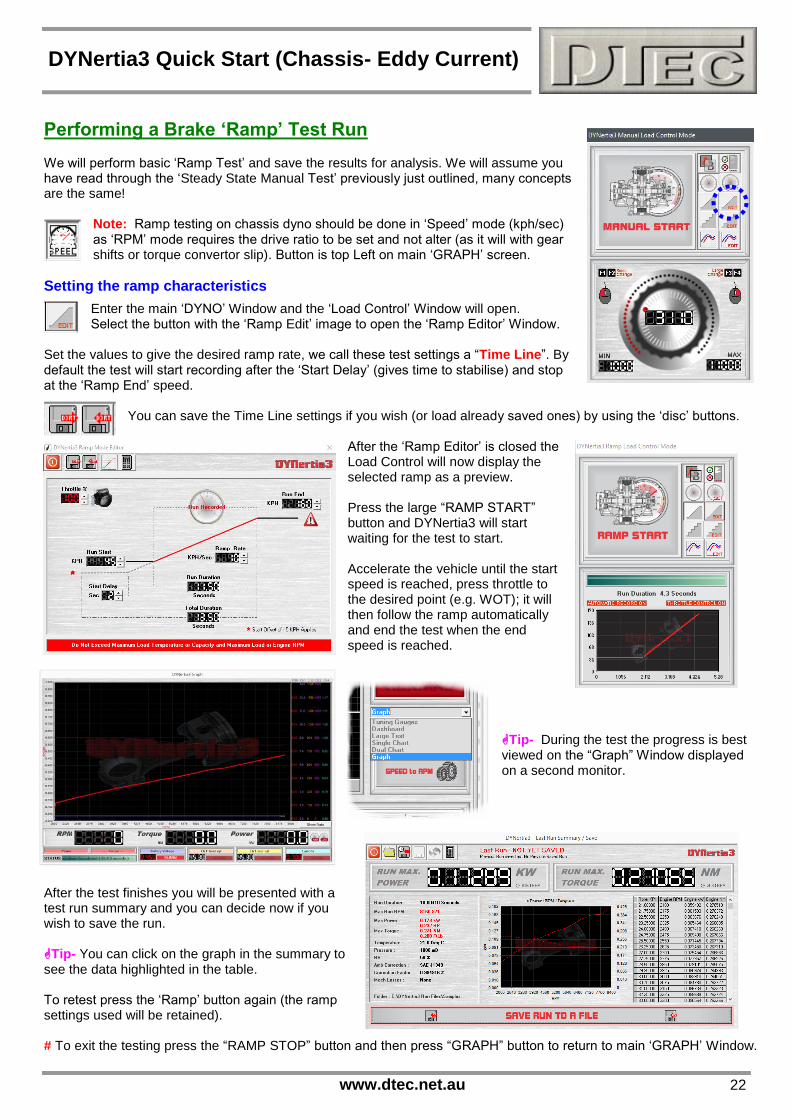
Performing a Brake ‘Ramp’ Test Run We will perform basic ‘Ramp Test’ and save the results for analysis. We will assume you have read through the ‘Steady State Manual Test’ previously just outlined, many concepts are the same!
Note: Ramp testing on chassis dyno should be done in ‘Speed’ mode (kph/sec) as ‘RPM’ mode requires the drive ratio to be set and not alter (as it will with gear shifts or torque convertor slip). Button is top Left on main ‘GRAPH’ screen.
Setting the ramp characteristics
Enter the main ‘DYNO’ Window and the ‘Load Control’ Window will open. Select the button with the ‘Ramp Edit’ image to open the ‘Ramp Editor’ Window.
Set the values to give the desired ramp rate, we call these test settings a “Time Line”. By default the test will start recording after the ‘Start Delay’ (gives time to stabilise) and stop at the ‘Ramp End’ speed.
You can save the Time Line settings if you wish (or load already saved ones) by using the ‘disc’ buttons.
After the ‘Ramp Editor’ is closed the Load Control will now display the selected ramp as a preview. Press the large “RAMP START” button and DYNertia3 will start waiting for the test to start. Accelerate the vehicle until the start speed is reached, press throttle to the desired point (e.g. WOT); it will then follow the ramp automatically and end the test when the end speed is reached.
Tip- During the test the progress is best viewed on the “Graph” Window displayed on a second monitor.
After the test finishes you will be presented with a test run summary and you can decide now if you wish to save the run. Tip- You can click on the graph in the summary to see the data highlighted in the table. To retest press the ‘Ramp’ button again (the ramp settings used will be retained). # To exit the testing press the “RAMP STOP” button and then press “GRAPH” button to return to main ‘GRAPH’ Window.

www.dtec.net.au 23
DYNertia3 Quick Start (Chassis- Eddy Current)
Viewing/Loading of Runs (‘Graph’ Window) We will outline the basic functions needed for viewing, selecting and loading data from test Runs.
Loading test Runs into the Graph Window to view and analyze
With default software settings, If you have just performed a test then this ‘GRAPH’ Window will appear automatically. The last Run you did will appear as a RED trace (not shown here) and any others already ‘loaded’ will be shown as various alternate coloured traces. The scales are automatically set to the highest data values. To ‘zoom’ in or out of areas of interest on the graph use the “” buttons in the lower graph corners.
When Runs are ‘loaded’ into the GRAPH Window we use the ‘Trace Set Controls’ (coloured boxes beneath the graph) to control them, one for each of the 5 traces that can be viewed (actually 10 using secondary screen). To temporarily ‘hide’ any trace from view ‘click’ on its Check Box “”, to view associated data and notes ‘click’ on the “?” button.
Load runs- To load a new Run into the graph for viewing or to change an existing one ‘click’ on a trace number
(button numbered “2” in this example above), this will open our ‘DYNertia File Explorer’ Window (detailed next page) where we can select a test Run to be shown as trace ‘2’. In ‘DYNertia File Explorer’ you can select a Folder of choice and when each Run file is selected (one ‘Left Click’) its data table, its general notes, key data and preview graph are shown. Single ‘Right Click’ on the Run file of interest and it will be loaded as the new ‘trace set’ back in the main GRAPH Window!
Clear runs- To remove traces from the graph (un-load them) press your
keyboards Shift and Delete keys (or menu option “View/Clear Graphs”). Note: Files are not deleted or modified; they are just not selected for viewing. Tip- DYNertia3 already has some test runs in a Folder called ‘Samples’, use these to learn the software operation.

www.dtec.net.au 24
DYNertia3 Quick Start (Chassis- Eddy Current)
Finding Folders to view or to save tests into
As mentioned on the previous page, ‘DYNertia File Explorer’ is used to select a storage Folder of choice and when each Run file within it is selected (one ‘Left Click’) its data table, general notes, key data and preview graph are shown. Single ‘Right Click’ on the Run file of interest and it will be loaded as the new ‘trace set’ back in the main Graph Window!
Tip- Clicking on the preview graph image will bring up a cursor line and highlight the corresponding data in the table.
You can browse folders to view the contents of, or to store runs into, by using the ‘Folder List’ section (shown above, just below the green “File Unlocked” text box). You can also use the search function for finding DYNertia3 files on your PC.
Note: If you are selecting a Folder that you wish to use to save runs into then press the ‘File Storage’ icon (top LH). It will be this Folders content that is shown when then saving runs in the main Dyno Window!
Tip- ‘DYNertia File explorer’ can be opened from the menu option ‘View/DYNertia File Explorer’, by pressing ‘ctrl + F’ buttons or from the ‘Trace Set Controls’ (coloured boxes under graph) as discussed previously.
Creating/Deleting new Folders to save tests into
Next to the Folder list is a black arrow “►”, ‘Clicking’ on this will open a menu that allows you to create/delete new Folders easily.
Once you type in a name, press the button shown to create the Folder and also set it as default. It will then be used to save files into and view when explorer is opened.
Pressing these buttons will delete a test Run file (disc/eraser icon) or respectively a Folder (cross icon) Note: Standard ‘Windows Explorer’ (‘My Computer’) can also be used to delete, create or move Folders and files!

www.dtec.net.au 25
DYNertia3 Quick Start (Chassis- Eddy Current)
Basic Analysis of Saved Data Basic analysis using the main GRAPH Window; refer to the full DYNertia3 manual for details. The main Graph Window can be used for overlaying and analysing data from test Runs.
To analyse a trace choose the trace of interest by selecting it with the buttons underneath the RPM/speed gauge and then ‘Click’ on the Graph Window. The coloured cursor (matches selected trace) will indicate via the gauges the values present. ‘Clicking’ in the graphs Right hand side (where the scales are) will display the ‘floating’ data Window as shown to reveal information for all the traces.
Holding the mouse over a data box will show that data Channels label (e.g. Exh Temp) Tip- Don’t forget you can ‘zoom’ in or out of the graph, use the “” buttons in the lower graph corners.
‘Click’ on the “?” button in lower Left Hand graph corner displays a graph summary.
‘Double Clicking’ on any row in the graph summary will bring up full information on that trace (shown Right)

www.dtec.net.au 26
DYNertia3 Quick Start (Chassis- Eddy Current)
Windows for Further Analysis of Saved Data A brief over view of more complex analysis, read the main DYNertia3 manual for many more options and details.
Most Windows used for analysing saved data are in the menu option ’View’ Load the test runs you wish to analyse into the GRAPH Window first using the trace set boxes as already explained. Note: Windows may only be relevant if the required data was collected e.g. Lambda deviation Window is only valid if you are recording Lambda into a data channel.
Torque analysis- Area under curve, averages, peaks, stats Individual trace set- Detailed study of single Run data
Lambda/AFR deviation- How far from the target air fuel ratio Compare- Difference between Runs (smoothed) Point to point- time to accelerate between RPM or speed points. There are many more options for getting the most from your testing. You can even export data directly into Excel to try out your own analysis concepts.

www.dtec.net.au 27
DYNertia3 Quick Start (Chassis- Eddy Current)
Shortcut Keys
In the menu ‘Setup/Software/General’ is the ability to allocate some functions to the ‘page up’ and ‘page down’ keys. This allows the opportunity to use wireless ‘presenters’ to control some dyno functions. Of course there are always wireless keyboards available that can be used.
Tip- ‘Page down’ can be set to “AutoInc/Save/Close” end this can greatly speed testing. “AutoInc” is to automatically increment a file name rather than re-typing it in!
The menu ‘Help/Shortcut Keys’ lists the shortcut keys including those that are user assigned e.g. PgUp & PgDn
Tip- There are settings in the in the menu ‘Setup/Software’ that also effect the speed of testing- Auto Display Graph of Last run: If you turn off it won’t jump to the GRAPH screen after every test for analysis. Main Graph-Auto Shift Traces Right: If you want to compare each run as it is done then this allows the previous runs to remain visible (only relevant if the Auto Display above is turned on).