earnings management and its relationship with corporate
TRANSCRIPT

Earnings Management and its Relationship with Corporate Governance Mechanisms in
Jordanian Industrial Firms
By
Adel Almasarwah
Lecturer in Accounting Department
Hashemite University - Jordan
A Doctoral Thesis
Submitted in partial fulfilment of the requirements for the award of the degree of
Doctor of Philosophy in Accounting
Loughborough University
August 2015
© Adel Almasarwah 2015

i
Earnings Management and its Relationship with Internal
Control and Corporate Governance Mechanisms in Jordanian Industrial Firms
Abstract
This thesis investigates the association between corporate governance mechanisms and earnings management in industrial Jordanian firms. We identify the most important corporate governance mechanisms that have an effect on accounting choices and operating decisions, investigate the tools that managers use to decrease or increase earnings in Jordanian industrial firms, and finally, determine which accruals model is more powerful to detect earnings management in Jordanian industrial companies.
Historically, corporate governance mechanisms are considered to be the most important factors in assessing and monitoring the effectiveness of financial reporting (Brown, Pottb and Wömpenerb, 2014), and may be considered to be a cornerstone of control in general. Internal and external corporate governance is established by senior managers to improve the efficiency and effectiveness of operations and reduce the incidence of error or manipulation in accounting systems (Lee, 2006). Earnings management is considered one of the most important issues related to financial reporting, particularly after the Enron and WorldCom scandals. Earnings management behaviours are also related to low levels of corporate social responsibility and improvements in both areas would be expected to lead to improvements in the quality of corporate governance.
Mixed methodology is used in this research including both quantitative and qualitative analyses. The quantitative analysis used accruals models the Standard Jones model (Jones 1991), modified Jones model (Dechow, Sloan and Sweeney, 1995), and the Peasnell, Pope and Young margin model (2000) as measures of earnings management and used these variables in conjunction with corporate governance factors. Annual financial reports that were published by the Amman stock market over the period 2005 to 2012 were used to extract the data for corporate governance characteristics of the firms. The qualitative analysis involved semi-structured interviews, conducted with general managers, financial managers and internal audit managers to provide in-depth information about corporate governance issues that we could not investigate easily through quantitative methods and to provide understanding of the context for the firm’s earnings management.
The qualitative analysis identified a range of motivations for earnings management in Jordanian firms including attempts to reduce customs fees; tax avoidance; the desire to attract more investors and increase share price, and the desire to increase management compensation. We find also that the Peasnell, Pope and Young margin model (2000) is a more powerful model for explaining earnings management in Jordan than the more commonly used accruals models.
Quantitative results indicate that the ownership structure of the business plays a more significant role in constraining earnings management than characteristics relating to the board of directors or the characteristics of the audit process. Furthermore, the interviews also explored in depth a number of cultural factors and external economic factors, which were found to be related to the incidence of earnings management. Relevant cultural factors include particularly the tribal system that operates in Jordan, which creates pressures on firms

ii
likely to increase earnings management and external economic factors include the recent Middle East revolutions and adoption of International Financial Reporting Standards.
The findings could be useful to investors, senior managers in Jordanian industrial firms, and legislators in Jordan, in relation to decisions about how to enhance the quality of monitoring mechanisms and constrain the incidence of earnings management. Our methodology and evaluation of standard accruals models in this context may also prove useful to other researchers on earnings management in developing economies.
Keywords: Earnings management, corporate governance, Cultural factors, Jordanian
Industrial firms.

iii
شيء كل فوق الله إرادة ولكن اللحظة، ھذه ینتظر كان الذي ،خلف والدي روح إلى العمل ھذا یكرس
This work is dedicated to the soul of my Dad Khalaf, who was waiting for this moment but
God's will, above everything.

iv
Acknowledgements
IN THE NAME OF GOD, THE MERCIFUL, THE COMPASSIONATE
Alhamdulillah, and thank him for giving us this science to light up this universe.
Very special thanks go to my first supervisor, Dr Rhoda Brown for her great guidance and
assistance, which were crucial in completing this thesis.
Also, I would like to express my deep gratitude to my second supervisor, Dr Kai Hong-Tee
for his guidance, efforts and attention to this thesis.
My deep, sincere and great love to my mother Nijma, who continually prays for me all the
time that I will be the best one.
I would like to express my deepest love and special thanks to my wife (Arwa), my son
(Abdullah), and my daughters (Alma and Mariyam) for their eternal patience and support
during my PhD.
Last, but not least, I would like to thank my sponsor, Hashemite University, for financing my
PhD studies and for supporting me during my study journey.
May Allah bless us
Adel Almasarwah 2015

v
Table of Contents Abstract ................................................................................................................................................... i
Acknowledgements .............................................................................................................................. iv
Table of Contents .................................................................................................................................. v
List of Figures ....................................................................................................................................... xi
Abbreviations ...................................................................................................................................... xii
1. Chapter One: Introduction .......................................................................................................... 1
1.1 Preface..................................................................................................................................... 1
1.2 Research Objectives ................................................................................................................ 3
1.3 Research Questions ................................................................................................................. 3
1.4 Research Methodology and Data Collection........................................................................... 4
1.5 The Expected Contribution of this Research and the Gap in Literature ................................. 5
1.6 Thesis Structure ...................................................................................................................... 7
2. Chapter Two: Corporate Governance Mechanisms .................................................................. 8
2.1 Introduction ............................................................................................................................. 8
2.2 Corporate Governance Definitions ......................................................................................... 8
2.3 Overview of Corporate Governance Mechanisms ................................................................ 11
2.4 Corporate Governance in Developed and Developing Countries ......................................... 17
2.5 Corporate Governance Mechanisms in the UK .................................................................... 19
2.6 Corporate Governance Reports throughout the UK .............................................................. 20
2.7 Corporate Governance Mechanisms in Jordan ..................................................................... 26
2.7.1 Board of Directors ......................................................................................................... 27 2.7.2 Audit Committee ........................................................................................................... 29 2.7.3 External Audit ............................................................................................................... 30 2.7.4 The Role of Shareholders .............................................................................................. 31
2.8 Summary ............................................................................................................................... 33
3. Chapter Three: Earnings Management Models ...................................................................... 34
3.1 Introduction ........................................................................................................................... 34
3.2 Earnings quality throughout the World ................................................................................. 35
3.2.1 Analysts’ Forecasts Accuracy ....................................................................................... 37

vi
3.2.2 Representational Faithfulness ....................................................................................... 39 3.3 Definitions of Earnings Management ................................................................................... 40
3.4 Earnings Management Motivations ...................................................................................... 42
3.5 Earnings Management Models in Prior literature ................................................................. 45
3.5.1 Aggregate Accruals Models .......................................................................................... 45 3.5.2 Specific Accruals Models ............................................................................................. 49 3.5.3 Distribution of Earnings Models ................................................................................... 51 3.5.4 Discretionary Revenues Models ................................................................................... 51 3.6.1 The Healy Model (1985) ............................................................................................... 54 3.6.2 The DeAngelo (1986) Model ........................................................................................ 58 3.6.3 The DeAngelo (1988) Model ........................................................................................ 62 3.6.4 The Jones (1991) Model ............................................................................................... 65 3.6.5 The Modified Jones Model (Proposed by Dechow, Sloan and Sweeney, 1995) .......... 70 3.6.6 The Peasnell, Pope and Young (2000) Model .............................................................. 75 3.6.7 The Caylor 2010 Model ................................................................................................ 77
3.6 Earnings Management and Cultural Factors ......................................................................... 79
3.7 Earnings Management and Agency Theory .......................................................................... 82
3.8 Summary ............................................................................................................................... 85
4. Chapter Four: The Role of Corporate Governance and Earnings Management ................. 86
4.1 Introduction ........................................................................................................................... 86
4.2 The Political and Economic Context of Jordan..................................................................... 87
4.3 Overview of Internal Control ................................................................................................ 91
4.4 Culture and Legal System in Jordan ..................................................................................... 94
4.5 Taxation System in Jordan .................................................................................................... 95
4.6 Internal Control, Corporate Governance Mechanisms and Earnings Management .............. 96
4.6.1 The Characteristics of the Board of Directors and Earnings Management ................... 97 4.6.2 The Characteristics of Audit Committee and Earnings Management ......................... 101 4.6.3 External Auditors and Earnings Management ............................................................ 106 4.6.4 Ownership Structure and Earnings Management ........................................................ 110 4.6.5 Chief Financial Officer (CFO), Chief Executive Officer (CEO) and Earnings Management................................................................................................................................ 119
4.7 Summary ............................................................................................................................. 120
5. Chapter Five: Research Methodology and Data Collection .................................................. 122

vii
5.1 Introduction ......................................................................................................................... 122
5.2 Research Methodology and Research Paradigm ................................................................. 122
5.3 Paradigm Incommensurability ............................................................................................ 130
5.4 Research Methodology ....................................................................................................... 132
5.4.1 Quantitative and Qualitative Methods Complementing Each Other ........................... 136 5.4.2 Quantitative and Qualitative Methods Challenging Each Other ................................. 137 5.4.3 Quantitative and Qualitative Methods “Talk Past Each Other” .................................. 137
5.5 Hypothesis Development and Measurement of Variables ................................................... 138
5.5.1 Board of Directors’ Characteristics ............................................................................. 140 5.5.2 Audit Committee Characteristics ................................................................................ 143 5.5.3 External Auditor Factors ............................................................................................. 146 5.5.4 Ownership Structure ................................................................................................... 147 5.5.5 Measuring Control Variables....................................................................................... 151
5.6 DATA Collection ................................................................................................................. 154
5.6.1 Earnings Management Models Sample ....................................................................... 154 5.6.2 Semi-structured Interview Sample .............................................................................. 157
5.7 Analytical Procedures ......................................................................................................... 157
5.7.1 The Processes of Secondary Data Analysis (Quantitative Methods) .......................... 157 5.7.2 Interviews Analysis ..................................................................................................... 159
5.8 Summary ............................................................................................................................. 160
6. Chapter Six: Secondary Data Analysis, Findings and Discussions ...................................... 161
6.1 Introduction ......................................................................................................................... 161
6.2 Measuring Accruals Models ............................................................................................... 162
6.3 Descriptive Statistics and Univariate Analysis ................................................................... 165
6.3.1 Dependent Variable (Earnings Management) ............................................................. 165 6.3.2 Board of Directors Characteristics .............................................................................. 168 6.3.3 Audit Committee Characteristics ................................................................................ 171 6.3.4 External Auditors Factors ........................................................................................... 172 6.3.5 Ownership Structure ................................................................................................... 174 6.3.6 Control Variables ........................................................................................................ 175
6.4 Correlation Matrix .............................................................................................................. 175
6.5 Hypotheses Tests (T-test and Multivariate Analyses) ........................................................ 181
6.5.1 T-Test (Comparing Means) ......................................................................................... 181

viii
6.5.2 Discriminant Analysis (Multivariate Analyses) .......................................................... 195 6.6 Chapter Summary ............................................................................................................... 201
7. Chapter Seven: Analysis of Semi-structured Interviews ....................................................... 204
7.1 Introduction ......................................................................................................................... 204
7.2 Descriptive Statistics Based on Interviewees’ Information ................................................ 205
7.3 Semi-structured Interviews: Analysis and Discussion ........................................................ 208
7.3.1 Interviewees Primary Financial Objectives ................................................................ 208 7.3.2 Corporate Governance Structure ................................................................................. 213 7.3.3 Corporate Governance Mechanisms ........................................................................... 216 7.3.4 Characteristics of Internal Control System ................................................................. 220 7.3.5 Managers’ Incentives to Manage Profit ...................................................................... 231 7.3.6 Does the Adoption of International Financial Reporting Standards (IFRS) affect earnings management? ................................................................................................................ 233 7.3.7 Cultural factors and Earnings Management ................................................................ 237 7.3.8 Financial Crises and Earnings Management ............................................................... 242 7.3.9 Different Approaches to Accounting Systems in Jordan ............................................ 244 7.3.10 The Effect of the Taxation System.............................................................................. 247 7.3.11 Bad Debt Provisions and Earnings Management ........................................................ 251 7.3.12 Issues Related to External Auditors ............................................................................ 254 7.3.13 Internal Auditors and Earnings Management ............................................................. 257 7.3.14 Ownership Structure and Earnings Management ........................................................ 259 7.3.15 Firms’ Changing Positions in the Amman Stock Market and Internal Control Systems 262 7.3.16 Government Regulations and Earnings Management ................................................. 264
7.4 Summary ............................................................................................................................. 266
8. Chapter Eight: Summary and Conclusions ............................................................................ 269
8.1 Introduction ......................................................................................................................... 269
8.2 A Brief Summary of the Research Methodology ................................................................ 269
8.3 Summary of the research findings and Conclusion ............................................................. 271
8.3.1 Quantitative Findings .................................................................................................. 271 8.3.2 Summary of Semi-structured Interviews Results and Conclusion .............................. 273
8.4 Combination of Quantitative and Qualitative Results ........................................................ 276
8.5 Summary of Research Contributions .................................................................................. 277
8.6 Research Limitations .......................................................................................................... 278
ix
8.7 Future Research and Recommendations ............................................................................. 281
9. REFERENCES .......................................................................................................................... 283
10. Appendices ................................................................................................................................. 301
10.1 Appendix (1) Semi-structured Interview Questions ........................................................... 301
10.2 Appendix (2) Interviewee’s Organisations Detail ............................................................... 307
10.3 Appendix (3) Earnings Management Values Carves for all Sample Models (SJ, MJ, and PPY) 319
10.4 Appendix (4) Regression results and Diagnostics .............................................................. 321
10.5 Appendix (5) Model Specification Tests ............................................................................ 327

x
List of Tables
Table 3-1 Summary of Developing of Aggregate Accruals Models in the Previous Literature ........... 46 Table 3-2 Summary of Development of Specific Accrual Models in the Previous Literature ............. 50 Table 4-1 Characteristics of Amman Stock Market under Securities law No. 76 in 2002 (Major Financial Indicators) ............................................................................................................................. 89 Table 4-2 Tax Rates in Jordanian Industrial Firms (2013/2014) .......................................................... 95 Table 4-3 Ownership Concentration in Jordanian Industrial Firms (Shareholders owning 1% and more 2012/2013) .......................................................................................................................................... 112 Table 5-1 The Differences between the Positive and Interpretive Paradigms. .................................... 123 Table 5-2 Characteristics of Quantitative and Qualitative Methods ................................................... 127 Table 5-3 Relevant Situations for Different Research Methods.......................................................... 128 Table 5-4 Links between Research Questions, Objectives and Methods ............................................ 130 Table 5-5 Summary of Research Variables and Their Measurements ................................................. 152 Table 5-6 Breakdown of firms used in the Sample Margin Model (PPY Model) ............................... 155 Table 5-7 Breakdown of firms used in the Sample Jones and Modified Jones Models ...................... 156 Table 5-8 Industry Distribution of firms used in all models ............................................................... 156 Table 6-1 Summary of Models Fit ...................................................................................................... 163 Table 6-2 Mean Coefficient (t-statistic) on Partitioning and Explanatory Variables for Earnings Management Models (SJ, MJ and PPY) ............................................................................................. 163 Table 6-3 Descriptive Statistics and Univariate Test for SJ and MJ Models and Explanatory Variables (Pooled Data) ...................................................................................................................................... 168 Table 6-4 Descriptive Statistics and Univariate Test for PPY Model and Explanatory Variables (Pooled Data) ...................................................................................................................................... 169 Table 6-5 Pearson Correlation for Firms in the SJ/MJ Sample .......................................................... 177 Table 6-6 Pearson Correlation for Firms in the PPY Sample ............................................................. 179 Table 6-7 T-Test (Comparing Means) for Standard Jones Model (SJ) ............................................... 183 Table 6-8 T-Test (Comparing Means) for Modified Jones Model (MJ) ............................................. 187 Table 6-9 T-Test (Compare Means) for Margin Model (PPY) ........................................................... 188 Table 6-10 Quadratic Discriminant Analysis SJ Model Sample ........................................................ 198 Table 6-11 Quadratic Discriminant Analysis MJ Model Sample ....................................................... 198 Table 6-12 Quadratic Discriminant Analysis PPY Model Sample ..................................................... 198 Table 6-13 Quadratic Discriminant Analysis Board of Directors Characteristics, Audit Committee Characteristics, External Auditor Factors and Ownership Structures (MJ Model Sample) ................ 200 Table 7-1 Interviewees Information .................................................................................................... 206 Table 7-2 Tax Rates in Jordanian Industrial Firms (2013) ................................................................. 248 Table 7-3 Shareholder Concentration in Semi-structured Interviews ................................................. 260

xi
List of Figures Figure 2-1 Relationships within a Corporate Governance Structure .................................................... 10 Figure 3-1 Earnings Management Motivations .................................................................................... 42 Figure 4-1 Map of Jordan ..................................................................................................................... 87 Figure 4-2 the Relationship between External Audit Mechanism and Earnings Management Level 107 Figure 5-1 Methodology Processes ..................................................................................................... 126 Figure 5-2 the Relationship between the Characteristics of Quantitative and Qualitative Methods .. 128 Figure 5-3 Integrated Quantitative and Qualitative Method ............................................................... 135 Figure 5-4 Earnings Management Values Carve for Modified Jones Model ...................................... 138 Figure 6-1 the Relationship between Internal Control, Corporate Governance Mechanisms and Earnings Management. ........................................................................................................................ 161 Figure 6-2 EM Estimates for the SJ Model ......................................................................................... 167 Figure 7-1 Corporate Governance Chart for Jordanian industrial firms ............................................. 215

xii
Abbreviations
Item Name Symbol
AAER Accounting and Auditing Enforcement Release
ACCMJ Accruals Modified Jones Model
ACCSJ Accruals Standard Jones Model
ACEXPERTISE Audit Committee Expertise
ACINDEPEND Audit Committee Independence
ACMEETING Number of Audit Committee Meetings
ACSIZE Audit Committee Size
AICPA American Institute of Certified Public Accountants
APL Accountancy Profession Law
ASE Amman Stock Exchange
BINDEPEND Board of Directors Independence
BLOCKOWN Blockholders Ownership
BMEETING Number of Board of Directors Meetings
BOUTSIDE Board of Directors Outsiders
BSIZE Board of Directors Size
CAEU Council of Arab Economic Unity
CEO Chief Executive Officer
CFO Chief Financial Officer
CFOA Cash Flow from Operating Activities
COSO Committee of the Sponsoring Organizations of the Tread way Commission
DACMJ Discretionary Accruals for Modified Jones
DACSJ Discretionary Accruals for Standard Jones
EM Earnings Management
EPS Earnings Per Share
EXACHANG External Audit Change

xiii
EXAOPIN External Audit Opinion
EXAREPUT External Auditor Reputation
EXATENURE External Audit Tenure
FAMOWN Family Ownership
FDICIA Federal Depository Insurance Corporation Improvement
FLVE Financial Leverage
FSUB Firm Subsidiary
GAAP Generally Accepted Accounting Principles
GDP Gross Domestic Product
GLS Generalised Least Square Regression
IAS International Accounting Standards
IASB International Accounting Standards Board
IFAC International Federation of Accountants
IFRS International Financial Reporting Standards
INDOWNF Foreign Individual ownership
INDOWNL Local Individual ownership
IOWNFOR Foreign Institutional ownership
IOWNLOC Local Institutional ownership
ISA International Standard on Auditing
JACPA Jordan Association of Certified Public Accountants
JD Jordan Dinar
JSC Jordan Securities Commission
MANOWN Managerial Shareholders
MJ Modified Jones Model (Dechow et al, 1995)
OECD Organization of Economic Cooperation and Development
OLS Ordinary Least Square Regression
PPY Margin Model (Peasnell et al, 2000)
ROA Firm Performance

xiv
SEC Securities and Exchange Commission
SDC Securities Depository Centre
SJ Standard Jones Model (Jones, 1991)
STATOWN State Ownership
VIF Variance Inflation Factor
WAPPY Working Capital Accruals

Chapter One: Introduction
1
1. Chapter One: Introduction
1.1 Preface
Published earnings are one of the most powerful financial statements items and as such have
an impact on business activities, management decisions firms and investment decisions.
Because of this, the managers may be tempted to adjust earnings to achieve desirable
incentives (Healy and Wahlen, 1998). The weakness of existing corporate governance
mechanisms could facilitate this process. Numerous incentives motivate managers to engage
in earnings management. Existing literature on earnings management has discussed these
motivations to be 1) opportunistic earnings management and 2) beneficial earnings
management. Managing earnings to achieve private incentives (the managers’ desired goals)
constitutes opportunistic earnings management, and managing earnings to achieve
stockholders’ incentives constitutes beneficial earnings management (Rezaei, 2012; Jiraporn,
Miller, Yoon, and Kim, 2008).
The existence of strong corporate governance mechanisms in a firm can lead to
improvements in professional conduct in business transactions and limit the opportunities for
earnings management. In contrast, the existence of weak corporate governance may
encourage manipulation, corruption and mismanagement in the business (e.g. Leventis and
Dimitropoulos, 2012; Clarke, 2007; Vafeas, 2005).
Jordan is a growing country that needs to attract new investors, suppliers, lenders and other
participants in business. The publication of earnings by Jordanian firms for external
consumption is a relatively new phenomenon, and this new accountability brings with it
requirements for corporate governance mechanisms, and the possibility of earnings
management.
The aim of this thesis is to investigate the relationship between corporate governance
mechanisms and earnings management in Jordanian industrial firms. We reach this aim by
exploring the nature of corporate governance mechanisms and earnings management in
Jordan, whether internal or external, and determining how they affect accounting choices and
operating decisions. We identify the particular accounting policies and tools that managers
use to manage earnings. Estimates of earnings management are made using accruals-based

Chapter One: Introduction
2
models and we evaluate which model is the most effective in detecting earnings management
in this context.
The analysis begins by discussing the context in which the firms operate in order to
understand the differences between the economic environment of Jordan as a developing
country, other developing countries, and developed countries, based on prior literature to
facilitate the comparison between the results of this research and those of prior literature.
After that, we critically analyse and compare earnings management models employed in the
literature, such as the work of Healy (1985), DeAngelo (1986), DeAngelo (1988), Jones
(1991), Dechow, Sloan and Sweeney (1995), Peasnell, Pope, and Young (2000), and Caylor
(2010), in order to understand the differences and similarities in these models’ approaches to
detecting earnings management, to understand the definitions of accruals used in the different
models and to facilitate the process of interpretation of our empirical findings.
Understanding the characteristics of earnings management in Jordan could potentially be
useful to regulators in setting standards; to investors in making investment decisions; to
auditors in auditing Jordanian companies and to the government in drafting legislation.
Eventually, such understanding could lead, via these mechanisms, to more reliability and
transparency in published financial statements (Al-fayoumi, Abuzayed and Alexander, 2010).
The literature reviews (chapters 2, 3 and 4) of the thesis is divided into two sections: (1)
literature related to the role of corporate governance, (2) literature related to earnings
management models, and (3) literature related to the role of corporate governance and
earnings management.
The methodology section of the thesis (chapter 5) explains the rationale of our selected
methodology, which is a mixed methods approach. This approach involves 1) a quantitative
analysis using secondary data related to the accruals models and also other to investigate the
relationships between corporate governance factors and earnings management measures and
2) a qualitative analysis involving interviews of individual firms to uncover the mechanisms
by which earnings management occurs and the motivations behind it.
The rest of this introductory chapter is organized as follows: section 1.2 discusses our
research objectives. Section 1.3 discusses the research questions. Section 1.4 provides a brief
discussion of our research methodology and data collection. Section 1.5 discusses the
expected contribution of this research and Section 1.6 explains the structure of the thesis.

Chapter One: Introduction
3
1.2 Research Objectives
This research aims to study the processes of corporate governance in Jordanian firms, and
their relationship with earnings management. To do this, we set out a few objectives as
follows:
• To explain the nature of the relationship between corporate governance
mechanisms and earnings management in Jordanian industrial companies.
• To identify the characteristics of corporate governance that have the most
effects on earnings management.
• To analyze the motivations that may lead managers in Jordanian industrial
firms to engage in earnings management.
• To assess the econometric power and appropriateness of various accruals-
based models to detect earnings management in the context of Jordanian industrial
firms.
1.3 Research Questions
Financial reporting manipulation (earnings management) is an important issue to researchers,
industry practitioners, legislative boards, auditors and individual firms. Consequently,
corporate governance mechanisms are some of the most important channels to prohibit the
publication of financial statements which could be misleading or erroneous (Ashbaugh-
Skaife, Collins, Kinney and LaFond, 2008).
We investigate the effects of corporate governance mechanisms on earnings management by
addressing the following questions:
• Is there a relationship between corporate governance mechanisms and
earnings management in Jordanian industrial firms?
• Do the independence and competence (education, training, professional
experience, and professional qualifications) of internal and external auditors affect
the relationship between corporate governance mechanisms and earnings
management?
Chapter One: Introduction
4
• Do differences in corporate governance structures affect the degree of
manipulation in earnings management in Jordanian industrial firms?
• What are the most effective elements of corporate governance in reducing
earnings management practices?
• What is the best model for detecting earnings management in Jordanian
industrial firms?
• How do external cultural factors affect earnings management in Jordanian
industrial firms?
• How do the legal and taxation systems affect earnings management in
Jordanian industrial firms?
• How does firms’ internal culture affect earnings management in Jordanian
industrial firms?
1.4 Research Methodology and Data Collection
This thesis uses mixed methods (quantitative and qualitative) to investigate the relationship
between corporate governance mechanisms and earnings management by adopting four
stages to fulfill the main aim of this research, and these stages are as follows:
Quantitative Methods
In the first stage, we use the accruals-based earnings management models (Standard Jones
Model, Jones, 1991; Modified Jones Model, Dechow et al, 1995 and the Margin Model,
Peasnell et al, 2000) to derive estimates of earnings management for each firm. The data for
these models such as operating income, cash flow from operating activities, revenue, total
assets, account receivable, and short-term deferred revenue are extracted from (1)
DataStream; (2) Amman Stock Exchange (http://www.ase.com.jo) and (3) Jordan Securities
Commission (http://www.jsc.gov.jo). We use SPSS (22) and STATA (13) to carry out
empirical studies.
In this stage we use three-way classification of earnings management and the fact that this is
a novel approach, and these classification are high positive earnings management (High +ve
EM, high negative earnings management (High -ve EM), and low earnings management (Low
EM).

Chapter One: Introduction
5
In the second stage, we use annual financial reports published by the Amman Stock Exchange
and Jordan Securities Commission during the period of 2005 to 2012 to collect data on
corporate governance factors such as boards of directors’ characteristics, audit committees,
external auditing factors, and ownership structures.
In the third stage, we use data from the first and second stages to examine the effect of
corporate governance mechanisms on earnings management estimates by the application of
quadratic discriminant analysis.
Qualitative Methods
In the fourth stage, we conduct a semi-structured interviews carried out with 16 managers in
Jordanian firms (e.g. general managers, financial managers, and internal audit managers). The
interview helps to gather in-depth information in order to explore more complex and subtle
issues that could not be examined using quantitative methods. The interview also aims to
explore the context of the Jordanian firms, the processes through which earnings management
occurs and the underlying motivations.
1.5 The Expected Contribution of this Research and the Gap in Literature
The literature review reveals that most studies investigating the relationship between
corporate governance, either internal or external, and earnings management tend to restrict
the measures to one or two characteristics of corporate governance and relating them to
earnings management. This PhD research studies the similar area in a much wider context
and involve a greater range of research techniques.
In the context of corporate governance, researchers have previously assumed that their
measures are representative of the firm’s entire corporate governance and have then
generalized these results, without considering the fact that corporate governance is an
integrated system. Therefore, using this approach (testing each factor of corporate governance
separately on earnings management) led to confecting results even in the same country which
is not correspondent with research reliability. In addition, they tend not to pay attention to
contextual factors that could have affected the corporate governance processes such as the
country’s religion and culture. Consequently, most of prior studies the focused their research
attention on quantitative approach by ignoring these factors that are considered from most
factors that could effected business aspects in any country. In addition, the economic
conditions in Jordan since 2008 (e.g. the financial crisis and the revolutions in the Middle

Chapter One: Introduction
6
East) have caused problems to Jordanian industrial firms which may have led to these firms’
managers engaging in earnings management. For example, the Egyptian revolution that has
affected Jordan’s economy with the supply of natural gas to Jordanian firms coming to an
end. This PhD research presents several empirical results that are consistent with Jordanian
managers engaging in earnings management.
In the context of earnings management, as far as I know, this PhD research is the first to
apply Peasnell et al's (2000) working capital model (Margin model) to the Middle East.
Numerous studies that have researched developing economies have found that the Modified
Jones Model failed to detect earnings management (e.g. Islam, Ali and Ahmad (2011) for
research on Bangladesh; Yoon, Miller and Jiraporn (2006) for research on Korea),
consequently, based on these studies results, we made a comparison between the results of
accrual models and working capital accruals models in order to determine which of them is
the best at detecting earnings management in Jordanian companies.
Our PhD research also includes a number of factors, specific to the context of Jordan, which
have not been identified by other studies. These include the effects of different approaches to
the use of IT within the accounting system; consideration of the effects of foreign and local
institutional ownership and individual ownership. According to this contribution, this
research has added a new theoretical assumed that each researcher should considered all the
factors that could affect earnings management in their studies by using qualitative method to
determine such of these factors, which means that the researcher should start combining
between quantitative and qualitative methods, which this assume is corresponded with
Steckler, McLeroy, Goodman, Bird and McCormick (1992). Therefore, this PhD research
uses mixed methods (quantitative and qualitative) to investigate the associations between
earnings management and corporate governance mechanisms, whereas large number of
studies that examine the same issue have used only quantitative methods.
This PhD study is also the first to use different techniques of categorising earnings
management onto three categories: 1) high positive EM group, 2) high negative EM group,
and 3) Low EM group, to reflect the nature of EM.1 Where the prior studies that used
standard approach (two groups (1) high positive and negative earnings management, (2) and
low earnings management) fails to allow for the possibility that there may be different
1 More discussions of these categories can be found in chapter 5.

Chapter One: Introduction
7
motivations underlying the two types of earnings management behaviour (Ball and Brown,
1968).
This PhD used a new quantitative method (quadratic discriminant analysis) to investigate the
relationship between earnings management and corporate governance mechanisms, since the
OLS/GLS regressions were poorly specified and yielded weak results in our research. This
method is equivalent to regression analysis (Bramhandkar, 2011) to predict the relationship
between corporate governance mechanisms and earnings management level in our sample
firms.
Finally, and based on the aforementioned discussion, this PhD research contributes to the
existing literature by providing an analysis of the context of and determinants of earnings
management in Jordanian industrial firms. It will also add to the increasing number of studies
of earnings management in emerging economies. Also, this research provided auditors and
regulators in Jordan with evidence of the relationship between different characteristics of
firms’ corporate governance mechanisms and the likelihood of engage in earnings
management.
1.6 Thesis Structure
This thesis consists of seven chapters. This chapter presents an overview of this PhD
research, and a summary for each chapter of the thesis.
Chapter two presents an overview of corporate governance mechanisms in the context of
Jordan, UK, and World; the definitions of corporate governance in prior literature; corporate
governance between developed and developing countries; corporate governance reports
through UK; and chapter summary.
Chapter three reviews the literature on earnings management; a discussion of the motivations
for earnings management; an introduction and critique of accrual-based earnings management
models used in prior studies; an overview of the literature on earnings management and
cultural factors and finally, a discussion of agency theory in the context of earnings
management research.
Chapter four describes Jordan’s historical background; the cultural and legal system; the
taxation system; In addition, we review the relationship between earnings management and
factors such as board of directors’ characteristics, audit committee characteristics, the chief

Chapter One: Introduction
8
financial officer (CFO), chief executive officer (CEO), external audit factors, and ownership
structure.
Chapter five presents rationale for the methodology adopted for this PhD research. This
chapter includes an analysis of research paradigms; paradigm incommensurability;
hypothesis development based on prior literatures; and data collection methods. Finally, we
present the procedures with which the quantitative (secondary) data and the qualitative data
(interviews) are analyzed.
Chapters six and seven present the findings of the analysis of the secondary data and
interviews in order to answer the research questions. Chapter five presents the results related
to measurable corporate governance variables and their effects on earnings management in
Jordanian industry firms, while chapter six provides an in-depth discussion of the 12
interviews.
Chapter eight includes interpretations of the findings; a discussion of the limitations of the
methodologies used; the conclusions drawn and the contribution to knowledge made by the
PhD research.

Chapter Two: Corporate Governance Mechanisms
8
2. Chapter Two: Corporate Governance Mechanisms
2.1 Introduction
The previous chapter introduced the overall structure of this research including research
objectives, research problems and equations, a summary of the research methodology,
research hypotheses, the research model, the research contribution and the gap in the prior
literature, and finally the structure of the thesis.
This chapter will review and discuss the prior literature on the attributes of corporate
governance mechanisms. To this end, the review will be used to identify each attribute with
which we are concerned. Corporate governance was established to solve the agency problem
(Jensen and Meckling, 1976) through mechanisms that enhance the security of the return for
investors. Shleifer and Vishny (1997) suggested that corporate governance mechanisms can
be divided into internal and external mechanisms, which will facilitate the monitoring and
measurement of these mechanisms. In addition, they found that the effectiveness of these
mechanisms differs from country to another based on four factors: (1) the usual economic
circumstances in which firms operate, (2) political systems, (3) the dominant industrial
sectors, and (4) labour relations.
This chapter is structured as follows: section 2.2 provides a summary of corporate
governance terms. Section 2.3 presents an overview of corporate governance mechanisms
throughout the world. Section 2.4 sheds light on corporate governance mechanisms between
developed and developing countries. Section 2.5 provides a brief summary of the corporate
governance mechanisms in the UK. Section 2.6 presents an overview of corporate
governance reports throughout the UK. Section 2.7 provides a brief summary of the
corporate governance mechanisms in Jordan. Section 2.8 presents the chapter summary.
2.2 Corporate Governance Definitions
The practices of corporate governance differ among countries and they are usually based on
the individual corporate governance code and the legal system within the country. Donaldson
(1990, page 376) defines corporate governance as a “structure whereby managers at the
organisation apex are controlled through the board of directors, its associated structures,
executive initiative, and other schemes of monitoring and bonding”. The Cadbury Report
(1992) defines corporate governance as “a system by which companies are directed and
Chapter Two: Corporate Governance Mechanisms
9
controlled”, where this definition “highlights the roles of the main players in an organisation
that is comprised of shareholders, a board of directors and the auditor”.
Shleifer and Vishny (1997, page 737) define corporate governance as “dealing with the ways
in which suppliers of finance to corporations assure themselves of getting return on their
investment”. Sternberg (2004) defines corporate governance as the methods the firms use to
achieve the objectives of shareholders by directing the corporation’s transactions, agents and
assets. This definition consists of two important factors: (1) the shareholders are considered
to be the main factor determining the type of corporate governance in the firm by establishing
their objectives, and (2) the board of directors and general managers have to direct and
monitor firms' transactions in a professional way in order to achieve shareholders’ objectives
in accordance with corporate systems that are applied in their country. These two points lead
to a distinction between the rights and responsibilities of shareholders, board of directors and
general managers deriving from the separation of ownership and control functions in limited
liability companies (Jensen, 1993).
In another definition, The Organization of Economic Cooperation and Development (OECD,
2004) defines corporate governance as “one key element in improving economic efficiency
and growth as well as enhancing investor confidence. Corporate governance involves a set of
relationships between a company’s management, its board, its shareholders and other
stakeholders. Corporate governance also provides the structure through which the objectives
of the company are set, and the means of attaining those objectives and monitoring
performance are determined”. The difference between these two definitions lies in their
relation to the developed and developing countries. Sternberg (2004) defines corporate
governance based on the perspective in developed country, and therefore focus almost
entirely on the requirements of the capital market. As an international organisation, OECD
defines it based on both developed and developing countries’ perspectives and therefore
consideration of other stakeholders groups are taken into account when monitoring
performance.
In accordance with the aforementioned definitions of corporate governance, it was noticed
that Shleifer and Vishny (1997) focused on how firms maintain returns from investments
regardless of their objectives and this characteristic dominatescorporate governance
definitions prior to the 20th century. It can be noted that Tricker (1994) described the exact
structure of corporate governance (see figure 2.1), and the main reason for ignoring this

Chapter Two: Corporate Governance Mechanisms
10
structure could refer to the weaknesses of adopting corporate governance roles before 2000.
On the other hand, all the definitions of corporate governance after 2000 such as Sternberg
(2004) and OECD (2004) focused their interest on organising the relationship between
shareholders and top management.
Figure 2-1 Relationships within a Corporate Governance Structure
Source: Tricker, 1994.
The various definitions of corporate governance in the prior literature presented above can be
classified as deriving from two separate viewpoints:
• Corporate governance related shareholders and control, the aim of which is to
increase shareholder wealth (e.g. Rohaida, 2011; Shleifer et al., 1997).
• Corporate governance which takes a wider view of accountability, and firm
performance including social and environmental issues (e.g. Sternberg, 2004; OECD,
2004)
Clarke (2007) documents that the evaluation of corporate governance in developed and
developing countries is usually based on concepts of accountability and the performance in
the firms, and the way that they comply with corporate governance policies and procedures.
Furthermore, the corporate governance system is considered to be the main guide that
provides the firms with information about their rights and responsibilities in organising
management processes.
Other shareholder
(e.g. employees, customers, creditors, suppliers)
Shareholders
Top Management
Regulators and Auditors
Board of Directors

Chapter Two: Corporate Governance Mechanisms
11
2.3 Overview of Corporate Governance Mechanisms
Corporate governance is a phenomenon that has received much academic interest because of
the numerous incidences of corporate failures experienced by several, highly visible firms in
countries around the world (Okpala, 2012). In 1999, the World Bank divided corporate
governance mechanisms into two types, and these are: (1) internal corporate governance;
here, internal control is concerned with the interests of shareholders and monitoring to the top
level of management in the firm. (2) External corporate governance; which includes
processes for assessing the credit risk for customers, investment policies; controlling the
behavior of non-executive directors; and monitoring the regulations that affect the firm (The
World Bank, 2013). The elements of corporate governance such as board of directors’ roles,
external auditor factors, and audit committee characteristics have been used to explain the
association between shareholders and management in the firm (Kim, 2006).
Recently, the rules of corporate governance have become one of the most important matters
that are discussed in the world economies. Applying these rules has become a priority for
both private and public firms, which has driven the making of new rules of corporate
governance such as instruments intended to enhance assurance; increase the transparency of
polices for protecting creditors, investors and bankers and reduce corruption and encourage
foreign investment (Alhaddad, Alzurqan, and Alsufy, 2011).
Board of Directors’ Characteristics
The main tenent of Agency Theory the separation of firms’ management and shareholders,
where the management is employed as an agent to protect the interests of shareholders and
increase their wealth (Klein, 2002). The board of directors is the highest level of the
management hierarchy, and it has several responsibilities such as monitoring and organising
senior management, ensuring the quality of financial reports and therefore reducing the
manipulation of accounting information. Boards may not always be proactive in fulfilling
their responsibilities, particularly in smaller organisations. A study by Schulze, Lubatkin and
Dino (2003) based on a sample of 883 family firms in US, concluded that board of directors
were generally passive and inactive in the firms, following rather than leading management
decisions and not supervising the managers’ efficiency. The situation tends to be different in
larger, publicly owner organisations. Fama and Jensen (1983) and Iskander and Chambrou
(2000) documented that in large companies the board of directors is considered the

Chapter Two: Corporate Governance Mechanisms
12
cornerstone of firms’ decisions systems, and this board is responsible for enhancing and
monitoring management’s performance.
Prior literature presents evidence that the strong board of directors’ characteristics lead to
improved firm performance. For example, Ebaid (2011) found the larger boards could be
more effective in monitoring senior management due to an increased ability to allocate the
oversight load over a greater number of observers. In a similar study in the US, Xie,
Davidson and DaDalt (2003) show that larger boards lead to improved financial performance.
According to prior studies, the success of the board of directors in achieving their
responsibilities could be affected by numerous characteristics such as board size, board
leadership structure, board capital, board independence, and director compensation (Gkliatis,
2014; Ebaid, 2011; Abdul Rahkman and Ali, 2006; Schulze et al, 2003).
Board size whether small or large, has been found to be one of characteristics that can affect
firm performance. In some cases, a large board size has been found to enhance the critical
resources and expertise, and prevent the CEO from taking actions against shareholders’
interests. In other studies, a small board size has been thought to lead to increase the ability of
board to exercise and adopt monitoring roles more easily leading to improved board
performance in the firms (Gkliatis, 2014).
Board leadership structure (CEO duality) or board independence feature in several prior
studies such as Wang and Campbell (2012), particularly situations where the same person
occupies CEO and board chairman positions simultaneously (Ebaid, 2011; Yermack, 1996).
Firms that separate the roles of CEO and board chairman tend to perform better, to have
increased financial transparency and less earnings management. Furthermore, the separation
between CFO and board chairman roles is considered one of the conditions of avoiding
conflict between shareholders and management interests (OECD, 2004).
Gkliatis (2014) stated that the board capital is “the capital that the members of the board
bring to the firm, and this capital is often divided into two categories the human and social
capital” (page 30). However, board capital is related positively with four benefits that could
lead to improvement in the corporate governance mechanisms (Hillman and Dalziel, 2003).
These are as classified in Gkliatis (2014, page 31) as follows:

Chapter Two: Corporate Governance Mechanisms
13
• The first benefit that is related to board capital is the provision of advice and counsel
that all directors facilitate through their knowledge, experience and expertise.
• Board of directors’ capital provides legitimacy to the firm’s actions.
• The board capital provides channels of communication and information between the
firms and other external organisations.
• Board capital can help in accessing critical resources from the outside, such as
influence in financial capital, influence with political bodies, or any other important
stakeholder group.
Audit Committee Characteristics
Recently, there has been renewed interest in audit committees that has occurred in light of the
new regulations created because of major corporate scandals (Bhasin, 2012). In the last three
decades, the audit committee has become the most popular mechanism of corporate
governance. Professional and regulatory committees in many countries have recommended
their more worldwide acceptance and have supported expanded roles for audit committee
(Abdullatif, 2006; Turley and Zaman, 2004). In 2001, the Basel Committee encouraged firms
to established audit committees in order to solve the difficulties that would arise for the board
of directors if a suitable system of controls was not in operation.
DeZoort (1997) showed that a firm with a strong audit committee has incentives to avoid
negative effects such as litigation and damage to reputation. Furthermore, DeZoort and
Salterio (2001) presented evidence that the existence of strong independent audit committees
could lead to more audit effectiveness and efficiency through mitigating external auditors’
perceptions of customers’ business risk.
There is a consensus from prior literature that the audit committee has learned and inquired
about important issues affecting financial statements and their performance, and that these
committee members should be independent. Accordingly, when the audit committee follows
and applies their responsibilities appropriately, the outcomes are reliable financial reports,
good corporate governance and less likelihood of firms’ failure (Okpala, 2012; Datta, 2000).
Jennings (2002) indicated that the main aim of establishing independent audit committees is
to provide shareholders with a high quality of assurance about the activities, behaviours and
practices of firms’ managers and employees. Additionally, Turley and Zaman (2004) assume
Chapter Two: Corporate Governance Mechanisms
14
that the good corporate governance mechanisms result from the strong audit committee
characteristics, wherein they found that the audit committee affect the firms through:
• Structural incentives -in this regard, the authors present several examples such as
issues related to audit committee acceptance and possible reduction in agency costs
linked with other governance activities.
• Audit function -here, the researchers found that the audit committee affected audit
functions through the processes of selection and remuneration, ensuring the
independence of external auditors, the audit process and auditor communication, and
the monitoring of internal control and audit systems.
• Financial reporting quality -in this regard there are several examples such as the
committee’s impact of errors and irregularities, adoption of accounting standards and
accounting policy choice, legal and regulatory action for defective reporting, and
audit qualifications.
• Finally, firm performance -for example through influence on wealth creation and
share price.
Several previous studies documented that four characteristics determine the effectiveness of
the audit commitee and these are: (1) audit committee size, (2) the frequency of audit
committee meetings, (3) audit committee independence and (4) audit committee expertise
(Bronson, Carcello, Hollingsworth and Neal, 2009; Bedard, Chtourou and Couteau, 2004).
In a recent study, Madi, Ishak and Manaf (2014) present empirical results showing that high
audit committee independence and large audit committee size lead to an increase in firms’
voluntary disclosure in Malaysia.
Bedard and Gendron (2010) include several arguments about audit committee characteristics.
First, they argue that the existence of independent of audit committee help to mitigate the
agency problem since audit committee members have no economic and personal relationship
with management. Second, they assume that financial expertise leads audit committee
members to identify and ask knowledgeable questions of management and external auditors
which challenge them to improve financial reporting quality. Third, the authors suggest large
audit committees are more likely to increase monitoring and controlling effectiveness through
bringing diversity of views, expertise, experiences and skills. Furthermore, Greco (2011)

Chapter Two: Corporate Governance Mechanisms
15
shows that a higher number of audit committee meetings would allow better examination of
the firm’s accounting choices, disclosures and estimates, and audit standards.
External Audit Factors
Most of prior studies focus on the Agency problem, which is centred on the separation of
ownership and control of firms. Lin and Hwang (2010) assume that the existence of strong
external auditors will mitigate agency problems. In addition, an external audit of high quality
will mean that auditors are less willing to accept uncertainty about accounting methods and
are more likely to report errors and irregularities revealed during the audit work, and this
leads the external auditor to be more effective in monitoring the firm’s activities (Habbash,
2010).
Fan and Wong (2005) suggest that the external auditors play a significant governance role in
East Asian firms, and that these firms are more likely to hire big five audit firms (now big
four), particularly when their ownership structure is likely to cause agency conflict. In
addition, Fan and Wong (2005) find no significant relationship between auditor choice and
the incentive alignment effect measured by the controlling owners’ cash flow.
Based on International Audit Standards, the external auditor should consider four key factors,
and these are: “(1) internal audit objectivity in terms of the status and reporting lines of the
internal audit function; (2) the technical competence of internal audit staff; (3) their exercise
of due professional care; and (4) the communication between internal and external audit
(Munro and Stewart, 2011, pages 466-467).
Accordingly, external audit is considered an important process for the shareholders to ensure
the credibility and reliability of financial reports. Assessing the quality of external audit is
based on several factors such as external auditor experience and knowledge in the industry,
external auditor independence, and external auditor reputation (Alghamdi, 2012).
Ownership Structure
The nature of the association between the ownership structure and the firm’s top management
has been the essential issue in the corporate governance mechanism. Demsetz and Lehn
(1985) used the proportion of shares owned by large shareholders, particularly the five largest
shareholders in the firms, to measure ownership concentration. Later studies used the
proportion of shares owned by a firm’s management to reflect ownership structure. However,

Chapter Two: Corporate Governance Mechanisms
16
the types of ownership are not mutually exclusive. In a study by Demsetz and Villalonga
(2001) the overlap between family ownership and the proportion of shares owned by
managers was 0.67 which meant there are existing categories overlapping these two types.
This in turn assumes that each one of these types of ownership represented the other one.
Based on a sample of 456 US firms, Shleifer and Vishny (1986) analyse the ownership
structure and find a high level of ownership concentration. For example, they show that the
354 of these firms have at least one shareholder owning at least 5% of the firm shares.
In the 1990s, the conflict of interest between larger shareholders and smaller shareholders has
received more attention from academic researchers. Where it is considered that concentrated
ownership structure could lead larger shareholders to dominant minority shareholders. This is
known as the expropriation-of-minority-shareholders hypothesis (Hu and Izumida, 2009).
The current literature of corporate governance also covers the agency problem where
ownership is dispersed and shareholders have a more passive role (Okpara, 2011).
Accordingly, Shleifer and Vishny (1997) find that an increase of ownership concentration is
likely to reduce the free-rider problem and enhance firm efficiency. Ownership concentration
has therefore been considered as a means by which to reduce the agency problem and
improve corporate governance (Hu and Izumida, 2009).
Recently several emerging markets start following developed markets by moving from
command economy, where the government own the firm totally or partially, to privatisation
economy since it approved its ability to develop their corporate governance mechanisms such
as US and UK (e.g. Fazlzadeh, Hendi and Mahboubi, 2011; Ghazali, 2010).
Theoretically, large shareholders could affect minority shareholders’ rights and firm
performance in two ways: the first is a positive way, where the large shareholders protect
minority shareholders. In this regard, Shleifer and Vishny (1997) argue that ownership
concentration is considered one of most important issues in corporate governance. The
second is a negative way, where the large shareholders conspire with managers to achieve
their personal incentives regardless of the effect on minority shareholders. For example, La
Porta, Lopez-de-Silanes and Shleifer (1999) found that the poor protection of small
shareholders from large shareholders is deemed to be a significant agency problem.

Chapter Two: Corporate Governance Mechanisms
17
Overall, the evidence on ownership concentration around the world suggests that firms with
high ownership concentration are the most effective in surviviving natural selection (La Porta
et al, 1999). As a final point, prior literature divides ownership structure into several types of
ownership such as management and/or board ownership, government ownership, family
ownership, foreign ownership, and institutional ownership (Almudehki and Zeitun, 2012;
Gurunlu and Gursoy, 2010).
2.4 Corporate Governance in Developed and Developing Countries
The majority of published studies of corporate governance have been located in developed
countries. Bleicher, Leberl and Paul (1989) is considered one of the first studies of corporate
governance mechanisms. Bleicher et al (1989) conduct their study to compare corporate
governance between listed firms in Germany, US and Switzerland. They find the corporate
governance mechanisms in these countries are developed during the previous ten years, and
this led to improving managers’ professionalism, which increased their abilities to monitor
the activities of the firm. Furthermore, Bleicher et al (1989) present several ways to improve
corporate governance mechanisms such as: the composition of the board, imposing more
duties on the boards, expanding the duties of care and to increasing the liability of monitors,
and employing external auditors to conduct audits on the performance of managers.
In a recent study from a developing country, Ebaid (2011) shows that strong corporate
governance is related with more favourable auditors’ decisions than weak corporate
governance. His results demonstrate that the voluntary adoption of corporate governance in
Egyptian firms improves the quality of financial reporting procedures and, therefore, impacts
upon external auditors’ decisions.
Based on comparative study between developing and developed countries, Mulili (2011)
relates the differences in corporate governance in developed and developing countries to
culture, politics and technology, showing that each country adopts a set of corporate
governance procedures based on many factors such as the culture, economic circumstances,
legal and financial systems, and firm ownership structures. In the same vein, Davies and
Schlitzer (2008) find corporate governance practices differ across countries.
Clarke (2004) presents several reasons for establishing corporate governance throughout the
world such as the prevention of corporate failure, and the existence of growing
acknowledgement in the business world. Whereas, Mulili (2011) stated that the corporate

Chapter Two: Corporate Governance Mechanisms
18
governance became an international issue due to the business globalisation, and it plays a big
role in the management of firms in both developed and developing countries.
By comparing corporate governance mechanisms between developed and developing
countries, Mulili (2011) identifies eight key elements of a good corporate governance
environment: (1) laying a solid foundation for management, (2) establishing a board that adds
value, (3) equitable treatment of shareholders, (4) accurate and timely disclosure of financial,
performance, ownership, and governance matters, (5) effective monitoring of management
and the accountability of the board, (6) operating ethically and responsible decision making,
(7) fairness in dealing with employees, and (8) recognising the legitimate interests of
stakeholders.
Aguilera and Jackson (2010) and Reddy (2009) examine how economics, management,
culture, society, law, and politics affect the development of corporate governance
mechanisms over several countries, where they found that each one of them has different
effect on corporate governance based on the nature of each country. Anderson and Gupta
(2009) find the financial structure and legal system have affected the nature of corporate
governance over sample of 1,736 unique firms representing 22 countries. In another study
that covered several developed and developing countries, Doidge, Karolyi and Stulz (2007)
document that the incentives to adopt good governance mechanisms in the firm are based on
the countries financial and economic development. The countries with poor economic and
financial development have poor incentives to develop their corporate governance
mechanisms.
Based on a practical comparison analysis throughout 33 countries, Hopt (2011) states that the
corporate governance is a system by which firms are controlled and directed, and that it plays
a big role at the stock exchange. Furthermore, he finds that the board of directors is
considered a main actor in corporate governance mechanism, shareholder protection is the
major concern of corporate governance and some countries try avoiding to go to court to
solve their corporate governance problems and make this choice their last solution. Unlike
developing countries, developed countries such as (UK, US, and Australia) now pay less
attention to studying corporate governance issues, since they believe that the corporate
governance mechanisms are developed enough to affect firms performance in these countries
(Nicholson and Kiel, 2004).

Chapter Two: Corporate Governance Mechanisms
19
In another study from Greece, Lazarides and Drimpetas (2011) show that the firm size,
leadership power and board characteristics lead corporate governance to be less effective in
Greece compared with other countries (e.g. US and UK).
Developing countries might face restrictions which could lead to corporate governance
weaknesses. For example, Okpara (2011) identifies a number of restrictions that hinder
Nigerian firms in developing and applying corporate governance mechanisms, such as abuse
of shareholders’ rights, absence of law enforcement mechanisms, lack of obligation on the
part of boards of directors, lack of commitment of the regulatory framework, weak
enforcement and monitoring systems and lack of transparency and disclosure.
2.5 Corporate Governance Mechanisms in the UK
The UK starts its approach from the position that strong corporate governance is considered
as a means to improve the board of directors’ ability to manage the firm efficiently and
provide accountability to shareholders. The UK approach has been found better than other
countries in achieving high standards of corporate governance with low costs. In this regard,
Governance Metrics International documented that the UK ranked second in its analysis
showing average governance performance by companies in different countries (Financial
Reporting Council, 2010).
Following several serious, unexpected, high profile accounting scandals and corporate
failures (e.g. Polly Peck International, Bank of Credit and Commerce International, and
Robert Maxwell) in the UK that happened in late 1980s and early 1990s, questions were
raised concerning the trustworthiness of financial reporting, and the weakness of corporate
governance in UK firms was revealed (Man and Wong, 2013). The Committee on the
Financial Aspects of Corporate Governance chaired by Sir Adrian Cadbury published the
Cadbury Report in 1992 to improve the corporate governance mechanisms in UK. Initially,
the recommendations of this report mostly tended to produce best practice regarding the
board structure. Following implementation there were reviews of the effect of the Cadbury
Report on board structure, investors’ protection and firm performance.
The Cadbury Report was dealt with several issues such as the relationship between
shareholders and board of directors, the effectiveness of the audit and how to increase its
value, board of directors’ responsibilities and structure, and institutional shareholders
responsibilities (Dedman, 2002). Consequently, The Cadbury Report identified best practice

Chapter Two: Corporate Governance Mechanisms
20
in terms of the quality of governance, it focused on board monitoring responsibilities and
defined the roles of non-executive directors (Belcher, 1996).
In 1996, the Hampel Committee was convened in order to review and assess the extent to
which the recommendations of the Cadbury and Greenbury Reports1 had been applied (see
section 1.6), and if the objectives for both of them had been met. In 1998, the Hampel Report
lead to the publication the Combined Code of Corporate Governance, which covered several
areas, including board structure, board operations of the board, directors’ remuneration,
accountability and audit, institutional shareholders, and the responsibilities of institutional
shareholders (Mallin, 2006; Dedman, 2002).
In 1999, the Turnbull guidance was published to support the board of directors with guidance
on how to develop corporate governance and internal control systems. Following the Enron
and WorldCom scandals in the US 2002, the Financial Reporting Council Combined between
the previous reports2 in 2003 to integrate the recommendations from these reports particularly
on the role of non-executive directors (the Higgs Report in 2003) and the role of the audit
committee (the Smith Report in 2003). In 2006, the Financial Reporting Council update the
corporate governance code by doing limit changes for previous code (Financial Reporting
Council, 2006).
Following this period, several problems appeared in the UK financial services sector, around
2010, including credit risk problems and financial dysfunction, which lead the Financial
Reporting Council to change the corporate governance code to overcome these problems
(Financial Reporting Council, 2010). Finally, the latest update for the UK corporate
governance code was in 2014, which amends auditing and ethical standards for auditors. The
next section explains in more detail the main corporate governance reports in UK over the
last two decades.
2.6 Corporate Governance Reports throughout the UK
1 The Greenbury report was issued in 1995 by a committee under the chairmanship of Sir Richard Greenbury to
improve a number of recommendations of the Cadbury report particularly related to the committee of non-
executive directors, the provision of information on remuneration policy in the annual report and accounts, and
the restriction of notice and contract periods to less than one year.
2 Cadbury, Greenbury, Hampel and Turnbull reports

Chapter Two: Corporate Governance Mechanisms
21
Over the past two decades, the UK has introduced several corporate governance reports to
organise and improve the corporate governance in the UK listed firms. Jones and Pollitt
(2004) demonstrated that there are several characteristics for each report, which is effected
the corporate governance roles in the UK listed firms.
Cadbury Report (1992)
This report was issued by the Financial Reporting Council, the London Stock Exchange, and
the accountancy profession, to overcome several scandals that have occurred in earlier
periods as shown in above section.
The Cadbury Report established several recommendations to limit the power of boards of
directors (Dahya, 2007; Dedman, 2002), and these are:
• Separation between CEO and board chairman, to avoid the power of combination
between these two positions.
• Minimum the number of non-executives directors - The Cadbury Report requires a
minimum of three non-executives directors and one of them may be the chairman of
the firm. In this regard, the Cadbury Report (1992, Para 4.11) stated that “Non-
executive directors should bring an independent judgement to bear on issues of
strategy, performance, resources, including key appointments, and standards of
conduct. We recommend that the calibre and number of non-executive directors on a
board should be such that their views will carry significant weight in the board’s
decisions. To meet our recommendations on the composition of sub-committees of the
board, all boards will require a minimum of three non-executive directors, one of
whom may be the chairman of the company provided he or she is not also its
executive head. Additionally, two of the three should be independent in the terms set
out in the next paragraph”.
• Highlighting the importance of the audit committee characteristics such as the
independence of the audit committee. This committee should include three non-
executives directors. In this regard, Cadbury report (1992, Para 4.3) stated “The board
should establish an audit committee of at least 3 non-executive directors with written
terms of reference which deal clearly with its authority and duties”.
• Enhancing the role of institutional shareholders in UK, where the Cadbury report
(1992, Para 6.12) stated that “The Institutional Shareholders' Committee's advice to

Chapter Two: Corporate Governance Mechanisms
22
its members to use their voting rights positively is important in the context of
corporate governance. Voting rights can be regarded as an asset, and the use or
otherwise of those rights by institutional shareholders is a subject of legitimate
interest to those on whose behalf they invest. We recommend that institutional
investors should disclose their policies on the use of voting rights”.
Stiles and Taylor (1993) state that the Cadbury Code is extensively observed as an attempt to
keep a regulation system under monitoring and controlling, and this report is considered as a
big step of developing the corporate governance in the UK.
Greenbury Report (1995)
In considering the important issues of directors’ pay and share options, the Confederation of
British Industry in 1995 established a committee directed by Sir Richard Greenbury to
identify good practice in determining directors' remuneration for UK firms (Hughes, 1996).
Three main recommendations were discussed and developed in the Greenbury report as
documented in Hampel (1998), and these are as follows:
• The level and make-up of remuneration - Levels of remuneration should be sufficient
to attract and retain the directors needed to run the company successfully. The
compound parts of remuneration should be structured so as to link rewards to
corporate and individual performance.
• Procedures - Companies should establish a formal and transparent procedure for
developing policy on executive remuneration and for fixing the remuneration
packages of individual directors. No director should be involved in fixing his or her
own remuneration.
• Disclosure - The Company’s annual report should contain a statement of
remuneration policy and details of the remuneration of each director.
Hampel Report (1998)
The committee who produced this report was established in 1995 and directed by Sir Ronald
Hampel, to review and evaluate the Cadbury Committee's recommendations on corporate
governance. The Hampel Committee published the final report version in 1998 (Stapledon,
1998).

Chapter Two: Corporate Governance Mechanisms
23
Chapman (1997) documented that there several recommendations made in the Hampel
Report, and these are:
• The U.K.'s unitary board system should be retained instead of adopting German-style
two-tier boards.
• Directors should submit themselves for re-election at least once every third year.
• A majority of non-executive directors should be entirely independent, and at least
one-third of the board should be non-executives.
• Paying non-executives in shares is not objectionable, but share options may cloud
their judgment.
• Smaller companies should not enjoy a lighter corporate governance code.
• Directors should not have to declare in annual reports that the system of internal
control.
• To bolster auditor independence, regulators should consider reducing the current 10 %
limit on the proportion of audit income an audit firm may earn from any one client. In
addition, audit committees should keep under broad review what other services their
external auditor offers the company in case their independent judgment is threatened.
• Companies should explain in the annual report how they have
followed Hampel's principles.
• A final report, which will merged the committee's recommendations with those of the
Cadbury committee on corporate governance and the Greenbury committee on
executive pay into a single set of principles and code was planned.
Turnbull Report (1999)
The committee producing this report was established in 1999 and directed by Nigel Turnbull,
to identify the characteristics of internal control systems needed in order to have a good
audits, ensure the quality of financial reporting, and catch any fraud before it becomes a
serious problem (Page and Spira, 2004).
Mainly, the Turnbull Report focused on risk management and internal control as both of them
are considered equally important. Risk management could have a large influence on the firm
performance and so should be the main concern of all directors. The internal control system is
therefore focused largely on protecting the firm from potential risk (Turnbull, 2000).

Chapter Two: Corporate Governance Mechanisms
24
Three areas were covered in this report to improve firms’ performance in UK, and these are:
• The importance of internal control and risk management • Maintaining a sound system of internal control • Reviewing the effectiveness of internal control
Higgs Report (2003)
At the time of the major US accounting scandals (Enron, WorldCom and Tyco) The
Secretary of State for Trade and Industry in the UK appointed Derek Higgs as a head of a
committee whose remit was developing corporate governance. In early 2003, the Higgs
Report was published and this report reviewed the role and effectiveness of non-executive
directors. Jones and Pollitt (2004) summarised several issues that this report assessed:
• The population of non-executive directors in the UK, who are they, how are they
appointed, how the pool might be widened.
• Non-executive directors’ independence.
• Non-executive directors’ effectiveness.
• Non-executive directors’ accountability; their relationship – actual and potential –
with institutional investors.
• Issues relating to non-executive directors’ remuneration.
• The role of the Combined Code.
• What, if anything, could be done – by individual boards, by institutional investors, by
the Government or otherwise – to strengthen the quality, independence and
effectiveness of non-executive directors.
Smith Report (2003)
Around the same time, the Financial Reporting Council appointed Sir Robert Smith to lead a
committee established to clarify the role and responsibilities of audit committees (Smith,
2003).
Briefly, the Smith Report was interested in developing and improving three areas in the audit
committee: (1) the purposes of audit committee such as monitoring the integrity of accounts,
reviewing internal financial control and risk management systems, and monitoring and
reviewing the effectiveness of internal audit (2) audit committee membership, with regard to
which the Smith Report recommends that the minimum number of members should be at
least three and all should be independent non-executive directors, and the firm chairman

Chapter Two: Corporate Governance Mechanisms
25
should not be one of these members, (3) audit committee communication. In this regard the
committee should issue a report, which includes several points such as the role and
responsibilities of the committee, all members should have relevant qualifications, expertise
and experience, resources available to the committee, number of meetings and details of
individual directors' attendance, and remuneration of committee members.
Several prior studies have investigated the compliance of UK listed firms with corporate
governance code (e.g. Sheridan, Jones and Marston, 2006; Jones et al, 2004), and they found
that the introduction of the Cadbury, Greenbury and Hampel, and Higgs reports led to a
significant increase and improvements in corporate governance.
Finally, the Corporate Governance Code in the UK that has been developed over last three
decades, has led to improvement of the UK economy at all levels. The Financial Reporting
Council (2014, page 5-6) describes the main principles of the Corporate Governance Code,
and these are as follows:
“Section A: Leadership
Every company should be headed by an effective board which is collectively responsible for
the long-term success of the company. There should be a clear division of responsibilities at
the head of the company between the running of the board and the executive responsibility
for the running of the company’s business. No one individual should have unfettered powers
of decision. The chairman is responsible for leadership of the board and ensuring its
effectiveness on all aspects of its role. As part of their role as members of a unitary board,
non-executive directors should constructively challenge and help develop proposals on
strategy.
Section B: Effectiveness
The board and its committees should have the appropriate balance of skills, experience,
independence and knowledge of the company to enable them to discharge their respective
duties and responsibilities effectively. There should be a formal, rigorous and transparent
procedure for the appointment of new directors to the board. All directors should be able to
allocate sufficient time to the company to discharge their responsibilities effectively. All
directors should receive induction on joining the board and should regularly update and
refresh their skills and knowledge. The board should be supplied in a timely manner with

Chapter Two: Corporate Governance Mechanisms
26
information in a form and of a quality appropriate to enable it to discharge its duties. The
board should undertake a formal and rigorous annual evaluation of its own performance and
that of its committees and individual directors. All directors should be submitted for re-
election at regular intervals, subject to continued satisfactory performance.
Section C: Accountability
The board should present a fair, balanced and understandable assessment of the company’s
position and prospects. The board is responsible for determining the nature and extent of the
principal risks it is willing to take in achieving its strategic objectives. The board should
maintain sound risk management and internal control systems. The board should establish
formal and transparent arrangements for considering how they should apply the corporate
reporting, risk management and internal control principles and for maintaining an appropriate
relationship with the company’s auditors.
Section D: Remuneration
Executive directors’ remuneration should be designed to promote the long-term success of
the company. Performance-related elements should be transparent, stretching and rigorously
applied. There should be a formal and transparent procedure for developing policy on
executive remuneration and for fixing the remuneration packages of individual directors. No
director should be involved in deciding his or her own remuneration.
Section E: Relations with shareholders
There should be a dialogue with shareholders based on the mutual understanding of
objectives. The board as a whole has responsibility for ensuring that a satisfactory dialogue
with shareholders takes place. The board should use general meetings to communicate with
investors and to encourage their participation”.
2.7 Corporate Governance Mechanisms in Jordan
The Corporate Governance Code for the Amman stock market was designed for the
development of the economy at all levels. The Jordan Securities Commission (JSC) is
considered the main body responsible for the development of capital markets and the
regulation of corporations. This code produced by the JSC includes the rules of corporate
governance that are directing firms listed at Amman Stock Exchange (ASE) to institute a
clear framework to manage and control their rights, duties and responsibilities in order to

Chapter Two: Corporate Governance Mechanisms
27
achieve the firms’ objectives and protect the rights of all stakeholders. These rules are based
on several pieces of legislation such as: Jordan Companies Law; Jordan Securities Law; and
the international principles recognized by the Organization of Economic Cooperation and
Development1 (OECD). The monitoring of corporate governance rules is achieved through
distinguishing the approach of the Jordanian firms that comply with these rules from other
firms that do not comply with them. In the case of firms that do not comply with these rules
sanctions are imposed such as moving from the first to the second market, stopping firms’
shares from being listed on the stock market and the result may be a decreased in firms’
share price. The Corporate Governance Code suggests that compliance with these rules will
lead to several advantages such as: enhancing the performance of national economy and
improves the practices in the business communities.
Boards of directors, audit committee, external auditors and shareholders are considered to be
the most important within the Jordanian corporate governance code, and the following
sections discuss them.
2.7.1 Board of Directors
Jordan’s corporate governance code includes a number of provisions related to the board of
directors such as the number of board members, which is to be between five and thirteen
members, and they have to be elected by a secret ballot. The board of directors has to meet no
less than six times per year. In addition, the board of directors’ chairman is not allowed to
work in any executive position within the firm at the same time. In fact, it is not allowed that
any member of the board of directors to be a member of another board, particularly in the
same business or a competitor’s business, and it is also not allowed for any member of the
board of directors to combine more than four memberships of different board of directors.
The firms do not have the right to lend money to the chairman and members of board. The
Code also specifies that the firm has to provide all directors with sufficient information for
them to fulfill their roles and for the firm to achieve its objectives (Corporate Governance
Law for Shareholding Companies Listed on the Amman Stock Exchange, 2012).
1 Organization for Economic Cooperation and Development (OECD): it is goes back to 1960, and is an organization that acts as a meeting ground for 30 countries which believe strongly in the free market system, The OECD provides a forum for discussing issues and reaching agreements, some of which are legally binding.

Chapter Two: Corporate Governance Mechanisms
28
Jordan’s corporate governance code specifies criteria about board of directors’ functions,
qualifications and responsibilities as below:
First: board of directors functions, based on the Jordan Corporate Governance Code 2012,
the board of directors held several functions, and these are:
• Managing the company particularly in the early years of the company. This applies to the first 3 or 4 years.
• The board of directors represents all shareholders
• Verifying all administrative and technical qualifications and experience for members of the executive management to make sure that they have appropriate qualifications and experience for their position
• Listening to any external consultant that might provide them with important information; this in turn leads to improving the firm's productivity.
Second: Board of directors qualifications
• All board of directors members have to be knowledgeable and experienced in administrative affairs.
• All board of directors’ members have to be aware about government legislation and they have to be aware about their rights and duties in the board.
Third: board of directors’ responsibilities, based on the Corporate Governance Code, the
board of directors have several responsibilities (Davies, 2000; Corporate Governance Law for
Shareholding Companies Listed on the Amman Stock Exchange, 2012), and these are:
• Reporting to the authorities concerning any of the following affairs: (1) if the firm was affected by any financial issues such as, a loss that will impact shareholders’ rights, (2) if any one of the board of directors used his/her position or power to achieve any personal benefit, and (3) if any directors, general managers or internal auditors acted in a way that might lead to fraud, embezzlement or misrepresentation.
• Establishing the firm's policies, strategies and procedures in order to achieve shareholders’ and firms’ goals.
• Controlling the firm's employment by ensuring that each person in their firm complies with policies and regulations.
• Authentication of the financial reporting and making sure that these reports have been prepared in accordance with the codes and laws.
• Employing the firm’s general managers and finishing his/ her services based on the evaluation of his/her progress in relation to his/her contract.
Chapter Two: Corporate Governance Mechanisms
29
• Organising the annual general meeting, and receiving shareholders' complaints and suggestions.
• Determining the responsibilities and authorities of executive management in the firm.
• Taking any necessary procedures to ensure that the internal control work in the right way.
2.7.2 Audit Committee
Jordan attempted to organise the corporate governance code by legislating several Acts. Since
1998, establishing the audit committee has become compulsory in Jordanian firms and firms
must file their annual reports with the Jordan Securities Commission (Abdullatif, 2006). The
audit committee is considered as the core system of corporate governance since it helps the
board of directors to accomplish their responsibilities to shareholders, and corporate
governance law has deemed the audit committee as one of the most important committees to
assess internal control systems (Oqab, 2012).
In 2008, the trade law stipulated that in Jordan the audit committee had to contain at least 3
members and some of these should be non-executive members (Hamdan et al, 2013).
The audit committee has to meet at least four times per year, with these meeting spread
regularly throughout the year. The firms have to offer all facilities that the audit committee
needs, and provide it with expert assistance at any required time. The audit committee has to
meet at least once a year with the firm’s external auditors, avoiding the presence of the
general manager or any person who is related to the top level of management (Corporate
Governance Code for Shareholding Companies Listed on the Amman Stock Exchange,
2012).
Jordan’s Corporate Governance Code details audit committee duties, qualifications and
power as below:
First: audit committee duties
There are several duties that the audit committee has to carry out, and these are as follows:
• Discussing all issues that are related to external auditor work and reporting to the board of directors.
• Monitoring and reviewing all firm communication with the external auditor and assessing its issues and providing board of directors with any explanations.
• Monitoring the firm’s compliance with Jordan business regulations.

Chapter Two: Corporate Governance Mechanisms
30
• Reviewing and monitoring periodic financial reports, for internal and external use, and reporting the comments and recommendations for board of directors.
• Assessing internal control and auditing procedures, and evaluating the reports of external auditors about internal auditing procedures.
• Monitoring all financial transactions with related parties such as suppliers, customers and lenders, also, dealing with any issues that the board of directors might suggest in future.
Second: audit committee qualifications and power
Jordan’s corporate governance code determines the level of experience and education for
audit committee members, it stipulates that all audit committee members have to be
knowledgeable and experienced in accounting and finance fields, and at least one of them has
to possess a professional certificate such as CMA, CPA or CIA.
In addition, corporate governance law gave the audit committee powers for monitoring all
financial processes in the firm through: (1) the right to communicate directly with the
external auditors about any firm issues, (2) suggesting and recommending the board of
directors to choose the appropriate external auditors, and (3) recommending a candidate to be
selected as the firm’s internal auditor.
2.7.3 External Audit
The external audit process is also deemed an important factor that affects corporate
governance (Suwaidan, and Qasim, 2012). Corporate governance law has stipulated that one
or more external auditors should be chosen to monitor firms’ processes, and whether or not
they comply with international accounting standards. External auditors are hired by
shareholders for one year and renewed year by year, and they have to be independent.
Finally, external auditors are responsible for an independent and impartial evaluation of the
firms’ processes and systems.
External auditors should not be: one of the shareholders of firms they audit, a member of
board of directors or an employee in the firm. External auditors should also avoid supporting
the firm with any services such as technical consultations or administrative services
(Corporate Governance Law for Shareholding Companies Listed on the Amman Stock
Exchange, 2012).
The Jordanian corporate governance code specifies the required level of the external auditor’s
knowledge and experience as below:

Chapter Two: Corporate Governance Mechanisms
31
• Holding a valid license that allows an external auditor to practice auditing work.
• Registering as a member with the Jordan Association of Certified Public Accountants (JACPA).
• Having at least three years sequential experience as a full time worker in auditing after receiving his/ her license.
• Having in his/ her firm one partner or more, and one of these partners at least meets the aforementioned requirements.
Finally, there are several duties that the external auditors have to achieve such as, meeting all
the requirements of external auditors regarding neutrality and independence, auditing all
firm's operations based on the international accounting standards and the accepted
profession’s rules; controlling and examining internal auditing of the financial and
administration system in the firm; reporting to shareholders and authorities concerning any
violation of the law or if there are any issues that might impact negatively on the firm’s
financial situation; auditing the ownership statements issued by the firms; attending the
annual general meeting and answering all the questions that the shareholders might ask
(Okab, 2013; Asawalqa and Qtish, 2012).
2.7.4 The Role of Shareholders
Shareholders are owners of the firm and as such they have numerous and varied rights and
responsibilities. Nevertheless, it is not permitted for shareholders to manage the firm since
this responsibility is assigned to the board of directors and general managers who are
responsible to shareholders, and it is not permitted for any shareholder to ask about certain
information without knowing the other shareholders (Jordan Companies Control Department,
2008). Alhaddad, et al (2011) state that the issue of controlling shareholders managing the
firm is the main problem that firms in developing countries are facing and Jordan is not
isolated from this problem. More than 30% of shareholders in the world are family
shareholders, where family shareholders have higher levels of internal control than other
types of shareholders (La Porta, Lopez-de-Silanes and Shleifer, 1999).
In the last three decades, ownership structure is considered to have been one of the most
important issues that affects firms’ policies such as, accounting choices, dividends, and
shares (Algharaibeh, Zurigat, and Alharahsheh, 2013). Based on a sample of 167 Jordanian
firms from the Amman stock market during the period of 1989 to 2006, the empirical results

Chapter Two: Corporate Governance Mechanisms
32
published by Zeitun (2009) reveal that the ownership structure has an effect on Jordanian
firms’ policies. For example government ownership (state ownership) has a negative effect
on firms’ accounting policies.
Jordanian company law (1997) stipulates that all firms in Amman Stock Market are obliged
to publish their annual financial reports, details of the number of shareholders, members of
board of directors, and the ownership percentage for each shareholder and their relatives..
Alfayoumi and Abuzayed (2009) identified three types of ownership structure in Jordanian
firms that affected firms’ decisions and performance and these are: insider ownership,
institutional ownership, and individual block-holders ownership.
The Corporate Governance Code for (2012) has categories shareholders’ rights and duties,
which are detailed in the two sections below:
2.7.4.1 Shareholders’ Rights
In this section, two types of rights are discussed: general shareholders' rights and rights
within the powers of the general assembly.
Information about shareholders:
The firm has to keep shareholders’ records that include all the information about them, such
as their names, the number of shares that they hold and any restrictions on their ownership,
access to shareholder records related to any shareholder for any reason, contributing and
voting in general annual meetings in person or by proxy with a number of votes equal to the
number of shares that he/she holds in the firm, priority to subscribe in any new share issues
by the firms, before these shares are offered to other investors.
The firm must also keep records of any shareholder filing a lawsuit against the board of
directors, claiming compensation for damages incurred as a result of not following the
legislation, any mistake or negligence in conducting the firm processes, or disclosure the
firm’s secrets.
In Jordan, shareholders who hold 25% of the firm’s subscribed shares are empowered to
request an extraordinary general meeting for any purpose. Shareholders who hold 20% of the
firm shares can request extraordinary general assembly meeting to request the resignation of
any board members or board chairman. Also, the shareholders that hold 10% of firm shares
can request auditing of firms' activities and records.

Chapter Two: Corporate Governance Mechanisms
33
Shareholders' rights within the powers of the general annual meeting
The specific rights of shareholders in the annual general meeting and as below:
• Discussing the firm’s plans and its performance for coming period with board of directors.
• Approving the issue of corporate bonds convertible to shares.
• Authentication of the financial statements for the preceding year.
• Electing the board of directors’ members and external auditors.
• Amending any matters relating to firms' objectives in accordance with the law.
• Dismissing the board chairman or any board member if that is necessary.
• Enabling the employees to own the company's shares
2.7.4.2 Shareholders Responsibilities
In this area, the Jordan Companies Control Department determined two responsibilities for
shareholders in Jordanian firms, and these are: (1) shareholders have to use the forum of a
general shareholders meeting to ensure that their firm tend to achieve the objectives, (2) all
shareholders who are absent from the annual general meeting have to authorise another
person to vote on their behalf.
2.8 Summary
In the context of reviewing the literature of corporate governance, this chapter started with
definition of corporate governance in the prior studies. Then, it presented and reviewed
corporate governance mechanisms such as board of directors’ characteristics, audit
committee characteristics, external audit factors, and ownership structure, over the world.
This chapter reviewed the prior literature comparing corporate governance mechanisms in
developed and developing countries in order to show the differences and similarities.
Accordingly, and because this PhD thesis is conducted in the UK, we presented a brief
summary about corporate governance in the UK, and showed how it developed in the last
three decades particularly through viewing the main corporate governance reports in the UK
such as Cadbury report, Higgs report and Smith reports. Finally, corporate governance
mechanisms in Jordan were discussed.

Chapter Three: Earnings Management Models
34
3. Chapter Three: Earnings Management Models
3.1 Introduction
Light has been shed on world corporate governance mechanisms, and how corporate
governance operates in developing and developed countries. This chapter presents the
earnings quality throughout the world as well as investigating earnings management as a
tool to measure a firm’s earnings quality. Earnings management is considered one of the
most important issues in financial reporting, particularly after the Enron and WorldCom
scandals. Consequently, several issues are covered in prior literature related to earnings
management: earnings management definitions, managers’ motivations to engage in
earnings management, measuring earnings management, the tools that managers use to
manipulate the earnings, and the relationship of this phenomenon with the regulation of
financial reporting.
In the past three decades, numerous studies have attempted to answer these questions by
employing models such as the aggregate accruals model, specific accruals model, the
distribution of earnings model (McNichols, 2000; Bissessur, 2008), the discretionary
revenues model (Stubben, 2010), and the earnings informativeness model (Easton and
Harris, 1991), using different measures such as discretionary accruals, non-discretionary
accruals, and total accruals or single accruals as proxies for earnings management. These
models are analysed and evaluated in the following chapter.
The chapter is structured as follows: section 3.2 presents overview of earnings quality
throughout the world. Section 3.3 explores definitions of earnings management. Section
3.4 examines earnings management types by debating opportunistic and beneficial
earnings management motivations. Section 3.5 shows how earnings management models
have worked in prior studies. Section 3.6 discusses and critiques all earnings management
models that will be used in this research and other models that are considered important
models such as, Healy (1985), DeAngelo (1988, 1986). Section 3.7 presents an overview
of the literature concerning earnings management and cultural factors. Section 3.8

Chapter Three: Earnings Management Models
35
discusses earnings management in the context of agency theory. Finally, Section 2.9
presents an overview for this chapter.
3.2 Earnings quality throughout the World
Previous studies used earnings attributes to investigate the weakness and strength of
earnings quality in the firms. Dichev, Graham, Harvey and Rajgopal (2013) and Francis,
LaFond, Olsson and Schipper (2004) divide earnings attributes into seven factors to
measure earnings quality, and these are as follows; accrual quality, persistence,
predictability, smoothness, value relevance, timeliness, and conservatism. Accordingly,
they classify the first four attributes as accounting-based earnings signals and the last
three attributes as market-based measures.
Until now, there has been disagreement between the researchers about earnings quality
definition and measurement (Dichev, et al, 2013). A recent study by Hamdan, Sarea and
Reyad (2013) state that the most prior literature revolves around two definitions of
earnings quality and these are: (1) earnings quality is the capability of investors to
forecast future abnormal earnings depending on the recent financial data that is published
in the stock markets (Ohlson and Feltham, 1995), and (2) earnings quality is considered
as indicators to measure recent earnings ability to present a real and strong picture about
the firm’s financial situation in present and future periods (Dechow and Schrand, 2004).
Previous researchers have used different measurements to evaluate earnings quality in
firms. For example, Dechow and Dichev (2002) found earnings management practices
are deemed to be the most important issue that affected earnings quality level in the
firms. In other words, they indicated that the firms with less earnings management
practices have higher earnings quality and vice versa. Sloan (1996) states that earnings
quality is based on the comparison between the cash flow and accruals components of
current earnings and investors fail to adequately adjust for accruals. Dechow, Ge and
Schrand (2010) point out that there is no single conclusion on what earnings quality is,
since earnings quality is based on several measurements such as, persistence, accruals,
smoothness, timeliness, loss avoidance, and investor responsiveness.

Chapter Three: Earnings Management Models
36
Dichev et al (2013) criticize prior studies examining earnings quality that use the
quantitative methods approaches. They state that there are several questions which cannot
be answered by using such approaches such as, what opportunities and constraints do
managers trade off to choose one set of earnings attributes over the other? What
accounting policies promote higher quality earnings? How prevalent is earnings
management? What is the typical magnitude of earnings management? How can an
outside investigator tell whether ex-ante earnings quality is poor before observing ex-
post outcomes such as restatements and SEC enforcement actions? Therefore, they use
large numbers of surveys and interviews, particularly with CFOs, in order to collect in-
depth information that would potentially help address the issues underlying the questions
more appropriately. Their findings show that the quality of financial reporting has
improved over time and that avoiding long-term estimates led to high earnings quality. In
addition, most of the respondents believed that the innate factors (e.g. forces outside
manager’s immediate control) were considered the main reason for more than 50%
increasing of earnings quality.
Recently, earnings quality has been considered among the most important issues that the
academic researchers paid attention to investigating, particularly after the financial crisis
and the adoption of IFRS. Kousenidis, Ladas and Negakis (2013) investigate the effect
of the financial crisis on earnings quality in the European Union (e.g. Spain, Greece,
Ireland, Italy, and Portugal). Their findings show that the majority of firms prefer high
earnings quality, and they refer that to an increase in the opportunities to attract more
investors to mitigate the financial crisis effects.
As for the IFRS adoption, Wang and Campbell (2012, a) found that IFRSs are more
likely to reduce earnings management more than domestic GAAP. Furthermore, Liu,
Yao, Hu and Liu (2011) encourage researchers to focus their attentions on investigating
the relationship among IFRS and accounting quality and earnings management in the
non-English-speaking countries. They begin by first examining the influence of IFRS on
accounting quality in China. Their empirical results show that the adoption of IFRS
reduced earnings management, which usefully reflected on accounting quality.

Chapter Three: Earnings Management Models
37
Furthermore, a large number of studies also examine the relationship between earnings
quality and corporate governance mechanisms. These studies reach a consensus that
strong corporate governance is more likely to lead to high earnings quality (e.g. Baxter
and Cotter, 2009; Xie, Davidson and DaDalt, 2003). Based on prior literature, many
arguments about earnings quality issue have been put forward. Dechow et al (2010)
document that earnings quality has three features;
• Earnings quality is conditional on the decision-relevance of the information.
Therefore, earnings quality term alone is meaningless.
• The quality of a reported earnings number depends on whether it is informative
about the firm’s financial performance, many aspects of which are unobservable.
• Earnings quality is jointly determined by the relevance of underlying financial
performance to the decision and by the ability of the accounting system to
measure performance.
Based on the aforementioned discussion, the sections below discuss two characteristics of
earnings quality.
3.2.1 Analysts’ Forecasts Accuracy
Earnings accuracy has gained considerable attention, where extensive prior studies
investigating this issue have been based on using the accuracy of analysts' earnings
forecasts (e.g. Barker and Imam, 2008; Jacob, Rock and Weber, 2008; Hussain, 1997;
Wiedman, 1996). Porter and Kraut (2013) define earnings accuracy as a deviation of
reported earnings from earnings forecast. Goeij, Smedts, Campenhout and Verhestraeten
(2013) examine the influence of earnings quality on analysts’ forecast accuracy. Their
findings show that the firms with highly predictable and smooth earnings direct the
analysts to proper financial information, which results in more accurate forecasts. In
addition, they find that earnings attributes (four accounting-based information signals)
have affected earnings accuracy forecasts more than the discretionary components.
Hussain (1997) use a set of forecasts of annual corporate earnings to investigate the
influence of segmental data on earnings forecast errors in UK. The findings of this study

Chapter Three: Earnings Management Models
38
presented empirical results that show a negative relationship between forecasts error and
firm size, and positive association with size of the change in earnings. In a recent study,
Huang, Chan, Chang and Wong (2012) document that the earnings accuracy forecasts are
more likely to be conservative in the firms that have high portion of insider
shareholdings, higher institutional shareholdings, or that have a CEO serving as the board
chairman. On the other hand, they found that earnings accuracy forecasts is less likely to
be conservative for the firms that have high portion of family ownership. In addition, they
stated that the 20% positive error and 20% negative error have completely different
effects on investors and managers. Therefore, the main reason for using the firms’
earnings accuracy forecasts is to mitigate the conflicting information between managers
and investors (Verrecchia, 2001).
From the standpoint of research, Dechow, et al (2010) argue that the high earnings
quality is deemed as a strong indicator for present and future firm performance. In this
contrast earnings quality assessed by ensuring that the information that is presented is
free from any error or mistake. Bédard, Coulombe and Courteau (2008) suggest that audit
committees might assist managers in formulating future strategy but their existence is not
considered as an indicator for earnings forecasts accuracy.
In another context, several academic researchers went further to explore the association
between corporate governance mechanisms and analysts’ earnings forecasts accuracy,
which proxies for earnings quality. Igan and Pinheiro (2012) devise a model, which
found that strong corporate governance mechanisms led to an increase in earnings
forecast accuracy. Moreover, based on 235 Malaysian firms during the period of 1999 to
2006, Ahmad-Zaluki, and Wan-Hussin (2010) document that the earnings forecasts
accuracy is greater for firms that had audit committees that were composed of a higher
percentage of non-executive directors and were considered as large audit committees. In
addition, they found that strong corporate governance is a credible signal of improving
the quality of financial information. Similar findings are seen in Bhat, Hope and Kang
(2006).
Only a few studies have been conducted about earnings forecasts accuracy in Jordan. For
example, El-Rajabi and Gunasekaran (2006) explore the association between forecast

Chapter Three: Earnings Management Models
39
errors and the firms’ characteristics by using 41 firms over the period of 1992 to 1995.
They found that the earnings forecasts accuracy in Jordan is optimistic. Based on these
results, one of their recommendations for Jordanian regulators is to give more attentions
to solving this problem as it might give negative indicators for foreign and local investors
about firms’ performance in Jordan. Finally, the association between corporate
governance and earnings accuracy is natural because strong governance is likely to lead
to fewer errors in recording transactions or in valuing assets and hence reducing the
likelihood of managers engaging in earnings management.
3.2.2 Representational Faithfulness
Most financial reports are subject to some element of risk of errors or mistakes, which
means less faithful representation in the financial reports. This is not due to bias in these
reports, but because it is problematic to identify and record the financial transactions
under conditions of risk and uncertainty. Representational faithfulness is considered one
of the fundamental qualitative characteristics of accounting information and it entails
representing economic phenomena that the information purports to represent, and annual
reports must be complete, neutral and free from material error (IASB, 2007).
Consequently, applying the qualitative characteristics should lead to accounting standards
of high quality; this in turn leads to high quality of financial reporting information, which
is capable of providing the decision making process with useful information.
Spiceland, Sepe and Tomassini (2007) define representational faithfulness as “agreement
between a measure and a real-world phenomenon that the measure is supposed to
represent”. In another definition, Alexander and Archer (2003) state that the concept of
representational faithfulness is related to notions such as financial statements giving a
true and fair view or presenting fairly, which form a key part of auditors' opinion
statements, and to creative accounting”.
Few studies have been completed to investigate representational faithfulness. For
example, Murdoch and Krause (2010) examine which methods of evaluating inventories
(FIFO and LIFO) are providing a more faithful representation of earnings, where they
reach the conclusion that LIFO does this more than FIFO for a majority of firms in US.

Chapter Three: Earnings Management Models
40
Strong corporate governance is related to increasing the probability of faithfully
represented information in the financial reports (Sloan, 2001). In a recent study, Fiador
(2013) examine the effect of internal mechanisms of corporate governance on the value
relevance of reported accounting earnings in Ghanaian firms during the period of 1997 to
2006. Their findings indicate that Ghanaian firms have presented the financial
information fairly, even if they have small board size and CFO duality.
Based on prior literature debates, several studies measure faithful representation by using
various proxies such as, an unqualified auditor’s report, neutrality, completeness,
freedom from material error and verifiability (Maines and Wahlen, 2006; Jonas and
Blanchet, 2000; Dechow, Sloan and Sweeney, 1996; Beasley, 1996).
Only a few studies have investigated the association between accounting information
quality and corporate governance mechanisms, which consider representational
faithfulness as one of the accounting information quality measurements. Alsufy,
Almbaideen, Alabbadi and Makhlouf (2013) document that strong corporate governance
mechanisms (e.g. larger board size, more board meetings, larger audit committee size,
more audit committee meetings) is positively related to the accounting information
quality in Jordanian industrial firms. Based on a sample of listed firms in the Tunis Stock
Exchange during the period of 1997 to 2007, Klai and Omri (2011) argue that the board
of directors’ characteristics and ownership structure increase the quality of accounting
information. In fact, some of their findings show the firms that are controlled by foreign
investors, families or blockholders reduced the reporting quality, and the firms that are
controlled by state and financial institutions have good financial disclosure quality.
As with Dechow and Dichev’s (2002) findings, this thesis focused on earnings
management to measure earnings quality. The next sections discuss earnings
management issues in detail.
3.3 Definitions of Earnings Management
In order to understand more specifically about how earnings management is defined, we
first consider a few definitions from previous literatures. Schipper (1989, p.92) define

Chapter Three: Earnings Management Models
41
earnings management as “an intervention to prepare and control the external financial
reporting process, and obtain some special benefit (facilitating the operation process)”.
Healy and Wahlen (1999, page 368) argue that earnings management “occurs when
managers use judgment in financial reporting and in structuring transactions to alter
financial reports to either mislead some stakeholders about the underlying economic
performance of the company, or to influence contractual outcomes that depend on
reported accounting numbers”. Earnings management is considered to be one of the most
important issues that affects the structure of financial statements, which may be changed
to mislead the stockholders and other users of financial statements. Ronen and Yaari
(2008) organise the definitions of earnings management into three clusters according to
existing literatures; these are as follows:
Earnings management
• “…. is taking advantage of the flexibility in the choice of accounting treatment to
signal the manager’s private information on future cash flow”. (Dubbed
“beneficial and white earnings management”.)
• “…. is choosing an accounting treatment that is either opportunistic (maximizing
the utility of management only) or economically efficient”. (Dubbed “neutral and
grey earnings management”.)
• “…. is the practice of using tricks to misrepresent or reduce transparency of the
financial reports”. (Dubbed “pernicious and black earnings management”.)
Managers may manipulate their earnings via two types of accounting approach, and these
are: (1) the accounting choices approach and this approach has two aspects, legal and
illegal transactions. (2) Operations decisions (Dianita and Rahmawati, 2011).
Earnings management achieved via operating decisions is notoriously difficult to detect
and therefore published research has tended to focus on the former category, the
accounting choices approach. Distinguishing between legal and illegal accounting
choices is deemed one of the most common difficulties that auditors and accountants
face; the reason being that there are many gaps in the accounting standards, GAAP, and

Chapter Three: Earnings Management Models
42
international auditing standards. This increases the opportunities for managers to
manipulate the financial statements to achieve their desired goals, and also it is a
daunting task to determine whether transactions are legal or illegal because there is no
clear guidance on where this boundary lines.
3.4 Earnings Management Motivations
Numerous incentives motivate managers to engage in earnings management. Existing
literature on earnings management has discussed these incentives under two headings:
opportunistic earnings management and beneficial earnings management. Managing
earnings to achieve private incentives (managers’ desirable goals) constitutes
opportunistic earnings management, and managing earnings to achieve stockholders’
incentives constitutes beneficial earnings management (Rezaei, 2012; Jiraporn et al,
2008).
Studies have claimed that managers engaged in earnings management opportunistically in
order to change revenues and expenses in different reporting periods, in order to achieve
strategic reporting incentives (Omonuk, 2007). In other words, they exercise their
discretion in financial reporting decisions in order to exploit an opportunity that results in
gains for their own benefit (Jiraporn et al, 2008). Prior studies of earnings management
found numerous opportunistic and beneficial incentives. Figure (2.1) presents earnings
management motivations in prior literature.
Figure 3-1 Earnings Management Motivations
Earnings Management Motivations
Compensation and Bonuses
Capital Market
Mergers and Acquisition
Research and Developm
ent (R&D)
Information Value
Regulatory and Political

Chapter Three: Earnings Management Models
43
Based on figure (3.1), one of the primary ones being compensation and bonuses of
managers; Healy (1985) present evidence to indicate that managers engaged in earnings
management to increase their compensation and bonuses. His findings showed that the
terms of their bonus contracts affected accounting and reporting decisions and the
adoption of new bonus plans. DeAngelo (1988) found that managers exercise their
accounting discretion to present an ideal picture of their performance in order to stay in
their positions for longer and earn more profit-related bonuses. In addition, Veenman,
Hodgson, Praag and Zhang (2011) showed that managers engage in earnings
management in order to increase their own stock options
Looking at capital market expectations, McNichols and Stubben (2008) examined
possible consequences of earnings management motivations from the managers’
perspective, and focused on internal decisions such as capital investment. They found that
the misreporting firms overinvest in property, plant, and equipment are related to
overstated earnings, which in turn lead them to belief that the internal decisions strongly
influence earnings management.
Investigating stock-for-stock mergers, prior studies provided several examples that
explain this motivation. Louis (2004) focuses his study to present an explanation of the
earnings management in acquiring firms. He concluded that the pre-merger earnings
management was significantly related to the performance of stock-for-stock acquirers in
both the short-term and the long-term. Also he found that acquiring firms increased their
earnings in the period preceding a stock swap announcement.
Another motivation to manage earnings found in the prior literature indicates that the
managers will consider the information content of particular disclosures. Graham, Harvey
and Rajgopal (2005) suggest that managers believe missing information in the earnings
report will lead to a decrease in the predictability of earnings, which in turn leads to
decreased stock prices due to the fact that investors and analysts dislike uncertainty. For
Chapter Three: Earnings Management Models
44
example, they found that managers prefer to take economic actions that would result in
earnings smoothing in order to avoid this uncertainty.
Furthermore, several researchers claimed that managers decrease/increase research and
development expenses in order to affect the income statement and achieve their desired
incentives (e.g. Baber, Fairfield, and Haggard, 1991). Bange and De Bondt (1998) and
suggest that the managers could change their research and development costs in order to
manage earnings to achieve several results such as reducing taxable profit taxes or
increasing free cash flow. Their empirical results showed that the CEO owning a
significant portion of the firm’s shares resulted in less earnings management.
Regulatory and political conditions are two other issues that affect earnings management
level. Based on a sample that includes 13 Europe countries, Burgstahler, Hail and Leuz
(2006) showed that the countries with a weak legal system suffered a high earnings
management level; additionally, they found that private and public firms react
differentially to the capital market. For example, they found that the stronger alignment
between the tax system and the financial reporting system resulted in more earnings
management, but this result is mitigated by market pressure exerted on public firms.
Chen, Wang and Zhao (2009) present evidence on the Chinese stock market showing that
firms have a regulatory incentive for manipulating reversals of asset impairments in order
to avoid the possibility of trading suspension or de-listing. Moyer (1990) found that
managers in commercial USA banks manipulated earnings to reduce obligatory
regulatory costs.
Key (1997) investigates the relationship between regulations and discretionary accruals in
the US cable television industry, an industry with highly concentrated prices competition.
The study concluded that firms with existing high prices, have more negative earnings
management than the firms with low prices.
Several studies have also suggested different motivations for managers’ to manipulate
earnings in order to enhance the information content of published earnings, which leads
to benefits for shareholders (Holthausen, 1981). In order to achieve optimal earnings

Chapter Three: Earnings Management Models
45
management, Louis and Robinson (2005) show that managers create positive abnormal
accruals, particularly in the preceding period of stock split announcements.
Finally, Arya, Glover and Sunderthe (2003) suggest that the level and pattern of earnings
can convey information, which in turn helps managers to direct their motivations based
on the incentives that they are attempting to achieve. Moreover, based on a sample of
5318 firm-year observations in Japan during the period of 1992-1999, Habib (2004)
reveal that, both earnings management measures and aggregate earnings management
measures are related negatively with the combined value relevance of book values of
equity and earnings.
3.5 Earnings Management Models in Prior literature
In the past three decades, numerous studies have been completed to detect earnings
management by employing models such as, aggregate accruals models, specific accruals
models, distribution of earnings models (McNichols, 2000; Bissessur, 2008),
discretionary revenues model (Stubben, 2010), and earnings informativeness model
(Easton and Harris, 1991).
McNichols (2000) use three earnings management models (aggregate accruals, specific
accruals and distribution of earnings model) to examine earnings growth. His findings
showed that aggregate accruals models that do not consider long-term earnings growth
are possibly misspecified, which in turn leads to incorrect conclusions about earnings
management behavior. Therefore, McNichols (2000) conclude that the specific accruals
models and distribution of earnings models are more likely to be applicable in future
research than aggregate accruals models.
3.5.1 Aggregate Accruals Models
This type of earnings management research design goes back to Healy (1985) and
DeAngelo’s (1986) models: they used total accruals and change in total accruals to detect
earnings management. Healy (1985) and DeAngelo’s (1986) models focused on
discretionary accruals. Thereafter, Jones (1991) introduced a new model to test and

Chapter Three: Earnings Management Models
46
control for non-discretionary accruals, which had not been considered by earlier authors
(Bissessur, 2008). McNichols (2000) summarised the developing of aggregate accruals
models in Table (3.1).
Table 3-1 Summary of Developing of Aggregate Accruals Models in the Previous
Literature
Year Author Discretionary accrual proxy
1985 Healy Total accruals
1986 DeAngelo Change in total accruals
1991 Jones Residual from regression of total accruals on change in sales and property, plant and equipment
1995 Dechow et al 1995 (DSS) Modified Jones Model
Residual from regression of total accruals on change in sales and on property, plant and equipment, where revenue is adjusted for change in receivables in the event period
1995 Kan and Sivaramarkrishnan Residual from a regression of noncash current assets less liabilities. on lagged levels of these balances, adjusted for increases in revenues, expenses and plant and equipment
Source: McNichols (2000)
Kan and Sivaramarkrishnan (1995) adopt a new technique based on the instrumental
variable method to detect earnings management using the following model:
𝐃𝐃𝐃𝐃𝐢𝐢,𝐭𝐭 = 𝛃𝛃 𝐏𝐏𝐃𝐃𝐏𝐏𝐏𝐏 𝐢𝐢,𝐭𝐭 + 𝛆𝛆𝐢𝐢,𝐭𝐭 …………………………………………………………. (1)
Where; DA is discretionary accruals for firm i and year t; PART is a partitioning
variable that captures factors that allegedly motivate earnings management; ε is random
accruals unrelated to the specific earnings management hypothesis.
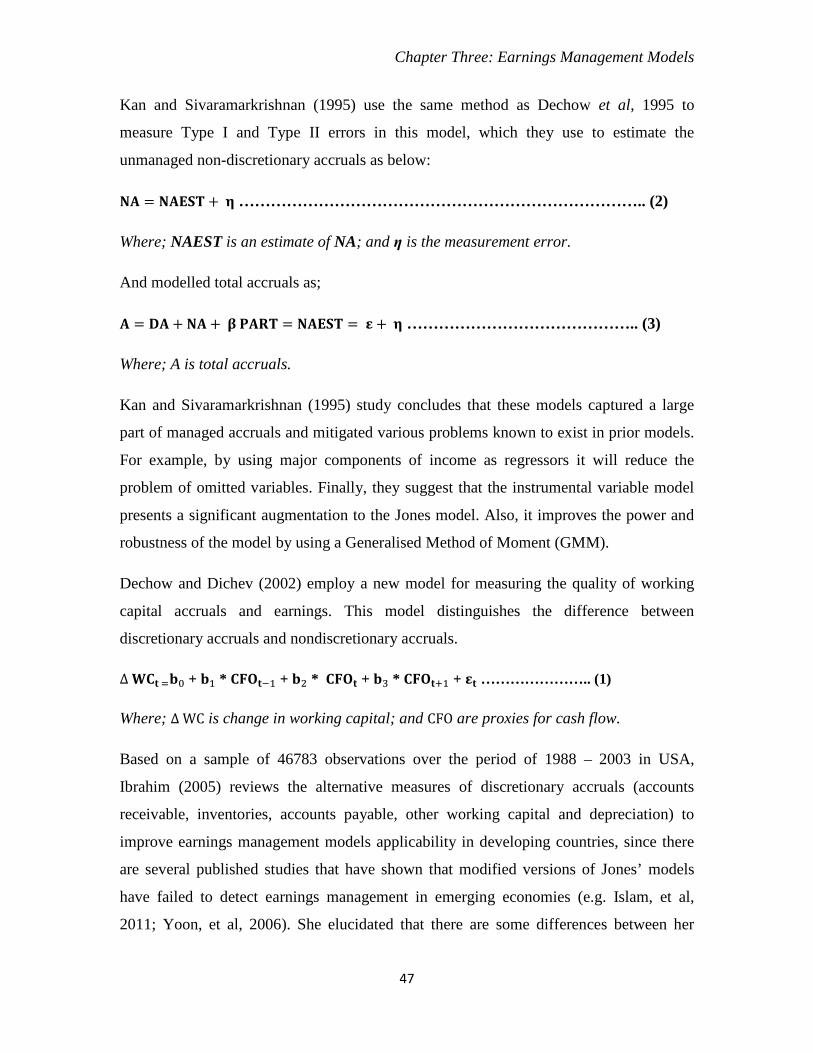
Chapter Three: Earnings Management Models
47
Kan and Sivaramarkrishnan (1995) use the same method as Dechow et al, 1995 to
measure Type I and Type II errors in this model, which they use to estimate the
unmanaged non-discretionary accruals as below:
𝐍𝐍𝐃𝐃 = 𝐍𝐍𝐃𝐃𝐍𝐍𝐍𝐍𝐏𝐏 + 𝛈𝛈 ………………………………………………………………….. (2)
Where; NAEST is an estimate of NA; and η is the measurement error.
And modelled total accruals as;
𝐃𝐃 = 𝐃𝐃𝐃𝐃 + 𝐍𝐍𝐃𝐃 + 𝛃𝛃 𝐏𝐏𝐃𝐃𝐏𝐏𝐏𝐏 = 𝐍𝐍𝐃𝐃𝐍𝐍𝐍𝐍𝐏𝐏 = 𝛆𝛆 + 𝛈𝛈 …………………………………….. (3)
Where; A is total accruals.
Kan and Sivaramarkrishnan (1995) study concludes that these models captured a large
part of managed accruals and mitigated various problems known to exist in prior models.
For example, by using major components of income as regressors it will reduce the
problem of omitted variables. Finally, they suggest that the instrumental variable model
presents a significant augmentation to the Jones model. Also, it improves the power and
robustness of the model by using a Generalised Method of Moment (GMM).
Dechow and Dichev (2002) employ a new model for measuring the quality of working
capital accruals and earnings. This model distinguishes the difference between
discretionary accruals and nondiscretionary accruals.
∆ 𝐖𝐖𝐖𝐖𝐭𝐭 =𝐛𝐛0 + 𝐛𝐛1 * 𝐖𝐖𝐂𝐂𝐂𝐂𝐭𝐭−1 + 𝐛𝐛2 * 𝐖𝐖𝐂𝐂𝐂𝐂𝐭𝐭 + 𝐛𝐛3 * 𝐖𝐖𝐂𝐂𝐂𝐂𝐭𝐭+1 + 𝛆𝛆𝐭𝐭 ………………….. (1)
Where; ∆ WC is change in working capital; and CFO are proxies for cash flow.
Based on a sample of 46783 observations over the period of 1988 – 2003 in USA,
Ibrahim (2005) reviews the alternative measures of discretionary accruals (accounts
receivable, inventories, accounts payable, other working capital and depreciation) to
improve earnings management models applicability in developing countries, since there
are several published studies that have shown that modified versions of Jones’ models
have failed to detect earnings management in emerging economies (e.g. Islam, et al,
2011; Yoon, et al, 2006). She elucidated that there are some differences between her

Chapter Three: Earnings Management Models
48
study and studies using estimated discretionary accruals and alternative measure of
discretionary accruals (Healy, 1985; DeAngelo, 1986; Jones, 1991; and Jones, 1995).
Ibrahim use the Healy (1985) model, the DeAngelo (1986) model, the Jones (1991)
model and the modified Jones model (1995) to determine the study variables. The results
suggest that alternative measures of discretionary accruals are more likely to decrease the
error in the previous measurements.
In the context of the UK, Atieh and Hussain (2012) use a sample of listed firms on the
London stock exchange over the period of 1994 to 2004 to detect earnings management
by using two cases: dividend-paying firms in cases where pre-managed earnings would
fall below the expected dividend, and non-dividend-paying firms proposing to avoid
reporting losses. The researchers use total discretionary accruals (TDA) following the
cross-sectional model in Dechow et al. (1995) to identify high and low levels of earnings
management in dividend-paying companies and non-dividend-paying companies.
Atieh and Hussain (2012) find that UK dividend-paying firms are more likely to manage
their earnings upward than UK non-dividend-paying companies. It also shows that
working capital discretionary accruals is better than total discretionary accruals in
detecting earnings management in this context. Cohen and Zarowin (2010) distinguish
between two types of earnings management: real earnings management and accrual-based
earnings management by examining the relationship between these two types around
seasoned equity offerings. They examine substitution and complementary relationships
between real strategies and accrual-based strategies using a cross section modified Jones
model. Finally, they state that real earnings management activities around specific
corporate finance events are more important than accruals based earnings management;
therefore they recommend that future research focus on this issue.
Based on a sample of 209530 US firm-year observations during the period of 1950-2009,
Dechow, Hutton, Kim and Sloan (2012) provide a new approach, which they claimed
would help to strengthen the power to explain earnings management. They use a number
of models and four main tests to measure earnings management, and these are:

Chapter Three: Earnings Management Models
49
1. Tests of firms where earnings management is expected: these tests used a random
sample of company-years to measure and evaluate the misspecifications that were
an obstacle in the previous models.
2. Simulation tests with a sample including artificially induced earnings
management: these tests are used to measure the power of the models.
3. SEC Accounting and auditing enforcement release (AAER) sample: these firms
are known to have engaged in earnings management since they were subject to an
SEC investigation. This sample was used to measure the power of the different
models and tests to detect earnings management.
4. Tests where the earnings management year is randomly selected from portfolios
with a wide range of economic characteristics (e.g. ROA, sales growth, market
capitalization, operating cash flows, and forecast of long-term earnings growth):
in this test they identified the specifications earnings management models that
were related most closely to common economic characteristics.
Dechow, et al (2012) indicates that incorporating reversal tests increased the power of the
models by around 40%, and reduced model misspecification arising from correlated
omitted variables.
3.5.2 Specific Accruals Models
Specific accruals models in the prior literature focused on the industry model, implying
that practices of non-discretionary accruals in the same industry were common (Bartov,
Gul and Tsui, 2000). This type of earnings management research design goes back to
McNichols and Wilson (1988).
The McNichols and Wilson (1988) model:
The model investigates whether managers manipulate earnings by using the bad debts
provision:
𝐃𝐃𝐃𝐃𝐏𝐏 = 𝛟𝛟 + 𝛄𝛄 𝐏𝐏𝐃𝐃𝐏𝐏𝐏𝐏+ 𝛎𝛎 …………………………………………………………. (1)
Where; 𝛄𝛄 = 𝛃𝛃 + 𝛒𝛒𝐏𝐏𝐃𝐃𝐏𝐏𝐏𝐏𝛈𝛈 ∗ 𝛔𝛔𝛈𝛈 / 𝛔𝛔𝐏𝐏𝐃𝐃𝐏𝐏𝐏𝐏 = 𝛃𝛃 + 𝐛𝐛𝐢𝐢𝐛𝐛𝐛𝐛 𝐢𝐢𝐢𝐢 𝛄𝛄.

Chapter Three: Earnings Management Models
50
𝛈𝛈 = 𝐍𝐍𝐃𝐃− 𝐍𝐍𝐃𝐃𝐍𝐍𝐍𝐍
Thus, 𝜸𝜸 is a biased estimate of 𝜷𝜷 when the partitioning variable and 𝜼𝜼 are correlated,
and the extent of this correlation can depend critically on the estimate of NA. DAP is
discretionary accrual; NA is nondiscretionary accrual; NAEST is an estimate of NA, and
PART is a dummy variable that partitions the data into two groups for which earnings
management predictions are specified,
This model is based on the US generally accepted accounting principles (USGAAP) and
the sample is partitioned based on the behaviors of discretionary accruals. Their findings
show that the discretionary component of the provision for bad debts decreases a firm’s
earnings. They also found that firms with low earnings are unlikely to employ income
smoothing techniques. McNichols (2000) summarizes the development of specific
accrual models in Table (3.2).
Table 3-2 Summary of Development of Specific Accrual Models in the Previous Literature
Year Author Discretionary accrual proxy
1988 McNichols and Wilson
Residual provision for bad debt, estimated as the residual from a regression of the provision for bad debts on the provision opening balance, and current and future write-offs.
1992 Petroni Claim loss reserve estimation error, measured over five years of loss reserves of property insurers.
1996 Beaver and Engel Residual allowance for loan losses, estimated as the residual from a regression of the allowance for loan losses on net charge-offs, loan outstanding, nonperforming assets and one year ahead change in nonperforming assets
1997 Beneish Days in receivables index, gross margin index, asset quality index, depreciation index, selling general and administrative expense index, total accruals to total assets index
1998 Beaver and McNichols
Serial correlation of one year development of loss reserves of property insurers
Source: McNichols (2000)

Chapter Three: Earnings Management Models
51
3.5.3 Distribution of Earnings Models
Generally, distribution of earnings models have been employed to examine the statistical
properties of earnings by identifying firm’s behaviours such as benchmarking (Bissessur,
2008). Distribution of earnings models have been developed by Myers, Myers and
Skinner (2007), Degeorge, Patel and Zeckhauser (1999), and Burgstahler and Dichev
(1997).
Degeorge, Patel and Zeckhauser (1999) investigate the implicit and explicit earnings
management patterns that a firm's senior executives tend to target, on decisions about
employment or compensation benefits. They outline a model that predicts how executives
strategically impact upon a firm’s earnings in two periods:
𝑹𝑹1 = 𝑳𝑳1 +𝑴𝑴1
𝑹𝑹2 = 𝑳𝑳2 − 𝜿𝜿(𝑴𝑴1)
Where; R1 is reporting earnings in period one; R2 is reporting earnings in period two;
L1 is true earnings management in period one; L2 is true earnings management in period
two; K is marginal cost; and M1 is the possible amount that will be added to R1 and R2
(possibly negative).
Their findings show that senior executives tend to engage in upward earnings
management when making these decisions. Additionally, Myers et al (2007) focus on
firms that have manipulated their earnings by increasing earnings per share (EPS) for
long period of consecutive years. Their findings show that managers tactically raise their
firms’ stock repurchases to increase EPS when it would otherwise decline.
3.5.4 Discretionary Revenues Models
Historically, this model dates back to the work of Plummer and Mest (2001), which
Marquardt and Wiedman (2004), Stubben (2006) and Caylor (2010) developed
subsequently. Caylor (2010) employed two discretionary revenue models in order to
examine whether managers manipulate their revenue to avoid losses in earnings; the
normal changes in gross accounts receivable model and the normal changes in deferred

Chapter Three: Earnings Management Models
52
revenue model.
(a) Normal changes in gross accounts receivable model:
∆𝑮𝑮𝑮𝑮𝑮𝑮𝑮𝑮𝑮𝑮 𝑨𝑨𝑹𝑹𝒕𝒕𝑨𝑨𝒕𝒕−1
= 𝜶𝜶0 + 𝜶𝜶1 ∗ �1
𝑨𝑨𝒕𝒕−1� + 𝜷𝜷1 ∗ �
∆𝑺𝑺𝒕𝒕𝑨𝑨𝒕𝒕−1
� + 𝜷𝜷2 ∗ (∆𝑪𝑪𝑪𝑪𝑪𝑪𝒕𝒕+1𝑨𝑨𝒕𝒕−1
)+ 𝜺𝜺𝒕𝒕
Where; ∆Gross A/R is the change in gross accounts receivable during year t; At−1 is the
beginning of the year total assets; ∆St is the change in sales during year t; and ∆CFO t+1
is the change in cash flow from operations during year t + 1.
(b) Normal changes in deferred revenue model:
∆ 𝑫𝑫𝑫𝑫𝑫𝑫𝑹𝑹𝑫𝑫𝑹𝑹𝒕𝒕𝑨𝑨𝒕𝒕−1
= 𝜶𝜶0 + 𝜶𝜶1 ∗ �1
𝑨𝑨𝒕𝒕−1� + 𝜷𝜷1 ∗ (
∆𝑺𝑺𝒕𝒕+1𝑨𝑨𝒕𝒕−1
) + 𝜷𝜷2 ∗ �∆𝑪𝑪𝑪𝑪𝑪𝑪𝒕𝒕𝑨𝑨𝒕𝒕−1
�+ 𝜺𝜺𝒕𝒕
Where; ∆Def Rev is the change in short-term deferred revenue during year t; At−1is the
beginning of the year total assets; ∆St+1 is the change in sales during year t + 1; and
∆CFOt is the change in cash flow from operations.
His findings indicate that managers manage their earnings via accrued revenue and
deferred revenue in order to avoid negative earnings. Stubben (2010) examine the power
of accrual and revenue models to reveal simulated and actual earnings management,
particularly by using these models to detect manipulations of revenues and expenses:
𝐏𝐏𝐢𝐢𝐭𝐭 = 𝐏𝐏𝐢𝐢𝐭𝐭𝐔𝐔𝐔𝐔 + 𝛅𝛅𝐢𝐢𝐭𝐭𝐏𝐏𝐔𝐔 …………..………..……. (1)
𝐃𝐃𝐏𝐏𝐢𝐢𝐭𝐭 = 𝐜𝐜 × 𝐏𝐏𝐢𝐢𝐭𝐭𝐔𝐔𝐔𝐔 + 𝛅𝛅𝐢𝐢𝐭𝐭𝐏𝐏𝐔𝐔 …………….……. (2)
∆𝐃𝐃𝐏𝐏𝐢𝐢𝐭𝐭 = 𝐜𝐜 × ∆𝐏𝐏𝐢𝐢𝐭𝐭 + (1 − 𝐜𝐜) × ∆𝛅𝛅𝐢𝐢𝐭𝐭𝐏𝐏𝐔𝐔 …..... (3)
∆𝐃𝐃𝐏𝐏𝐢𝐢𝐭𝐭 = 𝛂𝛂 + 𝛃𝛃∆𝐏𝐏𝐢𝐢𝐭𝐭 + 𝛆𝛆𝐢𝐢𝐭𝐭 ……………..…. (4)
∆𝐃𝐃𝐏𝐏𝐢𝐢𝐭𝐭 = 𝛂𝛂 + 𝛃𝛃1∆𝐏𝐏1_3𝐢𝐢𝐭𝐭 + 𝛃𝛃2∆𝐏𝐏4𝐢𝐢𝐭𝐭 + 𝛆𝛆𝐢𝐢𝐭𝐭 . (5)
Where; R is revenues; RUM is the sum of non-discretionary revenues; δRM is discretionary
revenues; AR is accounts receivable; �c × RUM� is the sum of uncollected non-
discretionary revenues; (1 − c) is the understatement of the amount of revenue
management estimated; R1_ 3 is revenues in the first three quarters; R4 is revenues in
the fourth quarter; and ∆ is annual change.

Chapter Three: Earnings Management Models
53
Stubben (2010) adapts the model in Caylor (2010). He makes some changes by
distinguishing between two revenue periods, the first three quarters and the fourth
quarter. Furthermore, Stubben (2010) show that his discretionary revenue model is
similar to Jones’ (1991) and Dechow et al.’s (1995) models but with three types of
variation:
1. The discretionary revenue model used receivables, but the accruals models used
aggregate accruals.
2. The discretionary revenue model employed receivables accruals instead of the
change in cash revenues in order to show the change in reported revenues.
3. The discretionary revenue model distinguished between the change in revenues in
the first three quarters and the change in fourth-quarter revenues by drawing on
the change in the annual receivables.
The results of Stubben's (2010) study indicate that the discretionary revenue model is
better than the accrual models in detecting earnings management, and has less bias and
error than the accrual models. However, neither the discretionary revenue nor the accrual
models would reveal manipulations in the expenses. Stubben (2010) also explains that the
Jones’s (1991) model has a different specification from the modified Jones model of
Dechow et al. (1995), because the Jones model used receivables and cash revenues rather
than just cash revenues, as in the modified Jones model. In addition, Stubben (2010)
referred the result (a discretionary revenue model is better than an accruals model) for
several reasons. One relates to the period of applying each model and another to the
economic circumstances since the discretionary revenue model was used late in 2006.
In this thesis both were applied (the discretionary revenue model and the accrual model
and it was found that the accrual models were more powerful than the discretionary
revenue models in the context of the Jordanian industrial firms based on the fit model
test, model specification model, and the corporate governance model (See section 6.2)
and (appendixes 4 and 5).
The Development of Earnings Management Models

Chapter Three: Earnings Management Models
54
This section provides an overview of the development of earnings management models in
previous literature by discussing and critiquing the models that are used in this research:
the Jones model (1991); the Modified Jones model (1995); the Margin model (2000); and
the discretionary revenue model (2010), in addition we discuss Healy (1985) and
DeAngelo’s (1986, 1988) models, as these are of historical importance. We provide an
in-depth analysis and critique of the seminal models of this kind because these are the
models that form the basis of our empirical analysis. Among the models discussed in
sections 2.2 to 2.5, we select these accruals based models because the results of these
models are more consistent and they are widely used and understood.
3.6.1 The Healy Model (1985)
Introduction
Positive accounting theory (PAT) is one of the most important accounting theories during
the last decades, largely because PAT attempts to explain real world events (Watts and
Zimmerman, 1978). There are three motivations for earnings management suggested by
PAT (as discussed in Watts and Zimmerman, 1978) and these are; the bonus plan
hypothesis, the debt covenant hypothesis, and the political cost hypothesis. Deriving from
the importance of PAT, Healy (1985) developed his model by studying the effect of
bonus schemes on accounting decisions. This led Healy to state that executive managers
use a number of accounting policies to maximise their earnings-based bonuses.
Healy (1985) designs his study to avoid two limitations affecting empirical results in
previous literature:
(1) Ignoring the definition of earnings that is applied in the executive bonus plan,
such as earnings before tax or earnings after tax. Healy used a different approach
to avoid this limitation. Firstly, using the real terms existing in bonus contracts;
for instance, more than 50 % of his sample participants’ bonus contracts were
based on earnings before taxes. Secondly, using real variables for accounting
changes; for example, this study used real accounting changes that have been

Chapter Three: Earnings Management Models
55
reported in Accounting Trends and Techniques1, and measure their specific
effects on income and bonus payments. This makes Healy’s study different from
previous studies that measured the effect of accounting policies on income in each
firm in general by using a dummy variable with a value of 1 if it increases, and 0
otherwise such as Hagerman and Zmijewski (1979).
(2) Existing literature assumes that managers always increase their income by
using accounting procedures to raise their bonuses. Healy develops this idea to
allow for behavior by managers that extended over more than one accounting
period. In this context, the managers can choose to either decrease or increase
earnings in the short term in order to increase their bonuses over a longer time
period. For example, the managers might reduce earnings in the current period, in
order to achieve their targets in future periods, by accelerating write-offs or
deferring revenue.
Healy uses three different scenarios to describe the observed characteristics of the bonus
schemes, and these are: (1) where earnings are above point where the upper limit of the
bonus plan is binding and bonuses will be paid at their maximum level. (2) Where
earnings are below the point where the lower limit of the bonus plan is binding and no
bonus will be paid. (3) Where earnings are between the upper and lower limits of the
bonus plan which means that a bonus will be paid at a level between the minimum and
maximum specified in the bonus contract.
The model describing these three scenarios is formulated as follows:
𝑩𝑩𝒕𝒕 = 𝒑𝒑𝒕𝒕 �𝒎𝒎𝒎𝒎𝒎𝒎 �𝑼𝑼𝒕𝒕,𝒎𝒎𝒎𝒎𝒎𝒎��𝑬𝑬𝒕𝒕 − 𝑳𝑳𝒕𝒕,�, 0���
Where; 𝐵𝐵𝑡𝑡 is the value of the bonus pool; 𝑃𝑃𝑡𝑡 is the contract; 𝐸𝐸𝑡𝑡 is reported earnings; 𝑈𝑈𝑡𝑡 is
the upper limit. And 𝐿𝐿𝑡𝑡 is the earnings target.
Healy employed two measures of earnings management as follows:
1 Accounting Trends and Techniques is a prominent publication put out annually by the American Institute of Certified Public Accountants (AICPA) to update accountants on current financial reporting practices. The publication has been distributed since 1946.

Chapter Three: Earnings Management Models
56
Accruals Models
The accruals model earnings are decomposed into:
• Cash flow from operations
• Non-discretionary accruals (NDA)
• Discretionary accruals (DA)
Non-discretionary accruals are “accounting adjustments to the firm's cash flows
mandated by accounting standard-setting bodies (e.g., the Securities Exchange
Commission and the Financial Accounting Standards Board)” (Page 89).
Discretionary accruals here are defined as modifications to cash flows that are organised
by managers based on generally accepted procedures that are defined by accounting
standard-setting bodies.
Based on this measure of DA, Healy hypothesized that the sign and magnitude of DA are
a function of
• Expected earnings before DA (which are unobservable)
• The parameters of the bonus plan
• The limits on DAs (e.g. the size of the underlying accounting numbers)
• The manager’s risk preferences
• The discount rate
Since DA is an unobservable variable, Healy’s models rely on total accruals as a proxy.
Total accruals are defined as below:
𝑨𝑨𝑪𝑪𝑪𝑪𝒕𝒕 = −𝑫𝑫𝑬𝑬𝑫𝑫𝒕𝒕 + 𝑬𝑬𝒎𝒎𝒕𝒕𝑮𝑮𝒎𝒎𝑮𝑮𝑮𝑮𝑬𝑬𝑮𝑮 𝒕𝒕 + ∆𝑰𝑰𝑰𝑰𝑰𝑰𝒕𝒕 − ∆𝑨𝑨𝑫𝑫𝒕𝒕 − {∆𝑻𝑻𝑫𝑫𝒕𝒕 + 𝑫𝑫𝑬𝑬𝑪𝑪𝒕𝒕}
ACCt is defined as the difference between reported earnings and cash flow from
operations and is specified in terms of the main accounting items for which accruals are
considered. Depreciation (DEP) and extraordinary items (Extraords) are included here
as they are often part of the bonus contract terms, tax payable (TP) and deferred tax
(DEF).

Chapter Three: Earnings Management Models
57
Accruals tests
Following the development of the Accruals model, Healy discusses the Accruals tests and
state that “managers have an incentive to select income-decreasing discretionary accruals
when their bonus plan's upper and lower bounds are binding” (page 95). Therefore, he
selected these tests of his hypothesis: (1) comparing the observed accruals and identifying
managers’ incentives in each year and firm. (2) Measuring if the different bonus plan
formats lead to a divergence in accruals.
Contingency tests showed that managers decrease firm’s income when the lower and
upper bounds of their bonus plans are compulsory and earnings are at a level to make
these constraints binding
Limitations of the contingency test
Healy discusses a number of limitations in his approach. Most of these limitations arise
because he can only observe the earnings after earnings management had occurred.
1. The sample of firms with low earnings is based on reported earnings and this
measure and total accruals both contain NDA. This makes it more likely that an
association between the two will be found. For example, if NDA is negative, total
accruals might be negative, earnings will be low and so the observation will be
more likely to be assigned to the portfolio of firms with low earnings.
2. As TA is used as a proxy for DA the measurement errors will be correlated with
firms’ cash flows and earnings and these are used to assign the firm-year to a
portfolio. For example, inventory accruals reflect inventory levels and the
manager has the incentive to manage inventory levels as well as the power to
choose policies for inventory accruals that increase the bonus payments. If
demand for a product increases, inventory decreases, NDAs decrease and CFO
increases. The relationship between DA and earnings is driven here by an external
factor that is nothing to do with the bonus plan.
3. CFO proxies for the unobservable earnings before DA.

Chapter Three: Earnings Management Models
58
By definition
∑𝑫𝑫𝒎𝒎𝑮𝑮𝒎𝒎𝒎𝒎𝒎𝒎𝒆𝒆𝑮𝑮 𝒃𝒃𝑫𝑫𝑫𝑫𝑮𝑮𝑮𝑮𝑫𝑫 𝑫𝑫𝑨𝑨+ 𝑫𝑫𝑨𝑨 = ∑𝑪𝑪𝑪𝑪𝑪𝑪 + 𝑻𝑻𝑨𝑨
This means that measurement errors in earnings must be perfectly negatively correlated
with measurement errors in DA. Observations with a positive measurement error are
more likely to be assigned to the portfolio of firms with high earnings and these will have
negative measurement errors in DA, which makes it more likely that hypothesis is
accepted.
Healy devised additional tests to attempt to cover some of these limitations and, in
addition, performed an analysis of the firms in his sample that had undergone a change in
accounting policies in the period of study.
Healy claims the results demonstrate “a strong association between accruals and
managers’ income reporting incentives under their bonus contract” and a “high incidence
of voluntary changes in accounting procedures” during years following changes to the
bonus plan (page 106).
3.6.2 The DeAngelo (1986) Model
In this paper, DeAngelo studies the accounting decisions in sixty-four US firms that
proposed a management buyout of public shareholders during the period of 1973-1982).
DeAngelo identified a range of relevant income-reducing accounting techniques such as,
over-stating expenses, deferring revenue, and write-offs or expensing rather than
capitalising items. She established her hypothesis based on the following notions: (1)
agency theory is used to establish a context of information symmetry and conflict of
interests wherein managers have the incentives to understate reported earnings and thus
reduce the buyout compensation; (2) Regulators and business people assume that
managers have the ability to manipulate earnings to understate buyout compensation; (3)
Security exchange commission commissioners stating that managers are more likely to
decrease a firm’s stock price by managing earnings reports, particularly before the
management buyout period.

Chapter Three: Earnings Management Models
59
Management opportunistic behaviour through understating earnings in the pre-
management buyout period is considered the main behaviour in which managers
engaged, particularly in the private firms. Therefore, managers are motivated to choose
earnings management techniques that are hardest for outsiders to detect, which is a
disadvantage to academic researchers. Management opportunistic behaviour is seen as
being constrained by a number of factors:
1. Regulation from securities exchange commission (SEC). 2. The audit process. 3. The type of auditors. 4. Stockholders’ ability to appoint their own financial experts to detect earnings
management. 5. Management buyout firms employing an investment bank to act as independent
valuer. 6. Stockholders threatening to oppose the buyout.
DeAngelo used two bases to evaluate share price to explain why a given earnings
understatement will have a substantially greater impact on buyout compensation, and
these are as follows: (1) accounting base, and (2) marketing base. The Accounting base
used earnings capitalisation:
𝑬𝑬𝑪𝑪 = 𝑺𝑺𝑺𝑺 × 𝑎𝑎𝑎𝑎𝑎𝑎𝑎𝑎𝑎𝑎𝑎𝑎𝑎𝑎 𝑫𝑫/𝑬𝑬
Where EC is earnings capitalisation; SH is earnings per share; P/E is price/ earnings
ratio.
The concept of earnings capitalisation derives from Lippitt and Mastracchio (1995),
where DeAngelo calculates earnings capitalisation by using earnings share as shown in
the model above.
As for market base, she “compare the magnitude of the above-market premium to that of
average premiums paid in other (both arm’s length and nonarm's-length) acquisitions”
(page 403).
Accrual Tests

Chapter Three: Earnings Management Models
60
Several factors lead DeAngelo to develop a normal level of expected total accruals in
periods before management buyout, and these are:
• If nondiscretionary accruals are large relative to total accruals then total accruals is considered a poor proxy for discretionary accruals. To solve this problem DeAngelo suggests that nondiscretionary accruals has to be large to introduce strong proxy;
• If nondiscretionary accruals are large and systemically negative even where no discretionary accruals have occurred, then an empirical observation of total accruals less than zero (AC>0) could lead to the inference that managers have deliberately understated earnings when the correct explanation is that total accruals normally contain a large negative nondiscretionary accruals.
• Total accruals are likely to normally be negative due to: (1) the relative size of the depreciation charge, and (2) Healy’s evidence in his study (1983) that average accruals for fortune 250 firms over a roughly contemporaneous period are (-2%) of total assets.
DeAngelo (1986) employed a new method to define total accruals by using the average
changes of discretionary accruals and non- discretionary accruals:
(𝐃𝐃𝐖𝐖1 − 𝐃𝐃𝐖𝐖0) = (𝐍𝐍𝐃𝐃1 − 𝐍𝐍𝐃𝐃0) + (𝐃𝐃𝐃𝐃1 − 𝐃𝐃𝐃𝐃0) …………………….………… (1)
Where; (AC1 − AC0) is average change in total accruals; (NA1 − NA0) is average change
in non-discretionary accruals; and (DA1 − DA0) is average change in discretionary
accruals.
The change in total accruals is also defined as the difference between net income and
operating cash flow:
(𝐃𝐃𝐖𝐖1 − 𝐃𝐃𝐖𝐖0) = (𝐍𝐍𝐍𝐍1 − 𝐍𝐍𝐍𝐍0) + (𝐖𝐖𝐂𝐂1 − 𝐖𝐖𝐂𝐂0) …………………….…………… (2)
Where; (NI1 − NI0) is average change in net income; and (CF1 − CF0) is average change
in operation cash flow.
The empirical results showed that the average value of the above formula is
approximately zero, which led to the conclusions that the change in nondiscretionary
accruals is not systemically positive, and the change in discretionary accruals is not
systemically negative.

Chapter Three: Earnings Management Models
61
Furthermore, DeAngelo (1986) used a different technique from Healy (1983, 1985) and
Liberty and Zimmerman (1986) to calculate total accruals by using the change in all
current operating accounts instead of using some operating accounts such as depreciation,
accounts receivable, income tax payable, deferred income tax, account payable and
inventory. This in turn led to decreasing the noise problem that occurred in Healy (1983)
and Liberty et al’s (1985) models. Finally, DeAngelo (1986) utilises additional accrual
tests to improve the significance of the results.
Additional Accrual Tests
DeAngelo suggested a possible reason for the result that there is no evidence of a
systematic reduction in total accruals before a management buyout, and that is “managers
of only a subset of sample firms have sufficient accounting discretion to understate
earnings by a significant amount” (page 413). Therefore, three techniques were devised
to test total accruals by dividing the research sample into three groups:
(1) Twenty-three public firms which are mainly controlled by management, who were therefore assumed to have more discretion. In this case the results indicate negative but insignificant average accrual changes.
(2) Fourteen firms which are neither mainly controlled nor currently subject to hostile activities (so it is assumed that managers have less discretion): the statistical results for this group showed that accruals were significant and negative.
(3) Twenty-seven firms which are currently the subject of a hostile takeover attempt (assuming a moderate level of discretion): the statistical results are not significant and one possible reason for this was thought to be because: “the negative accrual changes in this section are not directly associated to the buyout itself” (page 415). These tests showed that the only significant results (at 10%) are in the prior year variables; so, one explanation of this result is that managers who propose a management buyout understate income by such big margin that they draw in a hostile bidder, which means that the management buyout is more likely to respond to the takeover bid rather than it being an action that was planned for several years.
The most important result in this study is that managers have the motivation to hide
earnings. However, DeAngelo (1986) found that there was not enough evidence to
support based on the theory of accounting choices, and she gives three possibilities for
this result:

Chapter Three: Earnings Management Models
62
Firstly, the accrual methodology is not powerful enough to detect systemic income
manipulation. Secondly, accounting earnings realization is not a major factor in
management buyout and union negotiations, which means that the scenario may not be
the best choice as a basis for investigating earnings management
Finally, buyouts may have caused a conflict in the management’s interests.
3.6.3 The DeAngelo (1988) Model
Introduction
This study examined the extent in which the use of accounting performance measures
will affect proxy contests for board seats (between previous and present managers) during
the period from 1970 to 1983 in eighty-six American firms by stating two hypotheses: (1)
firms involved in proxy contests exhibit systematically poor pre-contest accounting
performance; (2) firms’ pre-contest accounting returns, but not their stock returns, are
systematically below-market suggests that dissidents emphasize those numbers that
support their cause.
DeAngelo (1988) considered that previous and present managers are always competing to
control the firm, since both of them need to achieve their desirable incentives by
decreasing or increasing their earnings to control firms’ resources. DeAngelo
distinguished between public corporations and private corporations regarding managerial
behaviours, and she found that managerial behaviour in public corporations is more likely
to be subject to constraints deriving from corporate governance.
Accounting performance during the election campaign
Accounting performance in the election period has been investigated by using two
hypotheses:
• Managers manage their unexpected earnings upward during the election period to increase their chances of winning the election.
• Managers use unexpected accruals to improve their earnings by utilising their accounting discretion.

Chapter Three: Earnings Management Models
63
Based on these hypotheses, DeAngelo (1988) use the accruals approach that was
developed by Healy (1985) and DeAngelo (1986), to develop her model by using the
year-earlier period. Therefore, DeAngelo’s (1988) model is as below:
To measure accruals in event period:
(𝐃𝐃𝐖𝐖1) = (𝐍𝐍𝐍𝐍1 − 𝐖𝐖𝐂𝐂1) …………………….……………… (1)
Where; 𝐴𝐴𝐴𝐴1 is the accrual in the event period, 𝑁𝑁𝑁𝑁1is net income, and 𝐴𝐴𝐶𝐶1 is cash flow
from operating activities.
DeAngelo (1988) employs a random walk model to measure accruals in prior period:
𝐍𝐍(𝐃𝐃𝐖𝐖0) = (𝐍𝐍𝐍𝐍0 − 𝐖𝐖𝐂𝐂0) …………………….…………… (2)
Where; E is denoting the expectation operator; AC0 is accruals in the year-earlier
comparison period; 𝑁𝑁𝑁𝑁0is net income in the year-earlier comparison period; and 𝐴𝐴𝐶𝐶0is
operating cash flow in the year-earlier comparison period.
DeAngelo (1988) used the prior period instead of time series data to reduce the
possibility of the structural shifts problem that is more likely to appear during long time
intervals and which may result in the models identifying false positive relationships.
Working capital measures were used instead of operating cash flow, based on the analysis
provided by Bowen, Burgstahler and Daley (1986):
(𝐃𝐃𝐖𝐖0) = (𝐍𝐍𝐍𝐍0 −𝐖𝐖𝐖𝐖0) …………………….…………… (3)
Where; WK0 is working capital from operations in the year-earlier comparison period.
DeAngelo (1988) utilised these models to predict that:
- Unexpected earnings are positive during the election campaign since the
managers are seeking to win the election.
- Unexpected accruals are positive since the managers are seeking to achieve their
incentives.

Chapter Three: Earnings Management Models
64
The empirical results, which were based on 43 proxy contests for board seats in listed
corporations 1970-1983, supported two out of the three hypotheses:
1. Incumbent managers typically report increased earnings during an election
campaign.
2. Managers exercise their accounting discretion to portray a favourable earnings
picture before a contested board election.
On the other hand, the third hypothesis, which suggested that cash flows are positive
since the managers are seeking to increase the profit to achieve their incentives, is not
supported by the results.
The evidence as to whether the earnings manipulation affected the outcome of the
election was not conclusive. To answer this question, DeAngelo (1988) divided the
sample into two groups, and these are: (1) contests in which dissidents posed an
especially serious threat to the incumbents (the ‘close’ contests), which include 28 of 43
contests. (2) The remaining contests, which includes 15 contests. The findings showed
that the random walk model identified significant differences, but an alternative model
did not show any difference.
DeAngelo (1988) undertook a further investigation to ascertain whether newly elected
dissident managers engaged in earnings ‘baths’ after a successful control contest order to
increase future earnings. The policies that were investigated were: (1) reducing future
expenses, (2) reducing the asset base for accounting returns and (3) gains from asset
sales at reduced book values. The findings indicate that earnings tended to reduce
materially in the year of control change, which supported the above hypothesis.
Concluding Remarks of DeAngelo’s (1988) Paper
DeAngelo (1988) demonstrates that current managers attempted to manage their
earnings, via accruals, particularly during the period of election in order to present a
favourable earnings picture for stockholders. In addition, the dissident managers used
declining earnings during the election campaign to help them to remove the current
managers.

Chapter Three: Earnings Management Models
65
DeAngelo (1988) made a number of suggested for future research, including an
assessment of whether changes in internal governance processes lead to poor earnings
performance and whether current managers circumvent internal corporate governance
mechanisms in an attempt to manage their earnings.
3.6.4 The Jones (1991) Model
Introduction
Jones (1991) develops the model on basis of establishing a context for earnings management
during investigations by International Trade Commission of import relief where the decisions are
known to be based on accounting numbers (and industry profitability) and the incentive is for
managers to decrease earnings in order to obtain/increase import relief.
Import reliefs are measures used by Governments to reduce the costs to domestic
producers of cheap imports and include measures such as tariffs, quotas, marketing
agreements and subsidies. The contracting parties in this situation are assumed to be the
government/regulators, the producers receiving import relief and a diverse group of
consumers losing an amount of wealth equal to the import reliefs.
Investigations are carried out on an industry basis and relief is granted where imports are
deemed to have caused “serious injury” to an industry based on assessment of
“reasonable levels of profitability”, decline in sales, growing inventory and downward
trends in production, profits, wages or employment. Two categories of investigation are
identified: general escape clause investigations; and antidumping/countervailing duty
investigations. The second category occurs where there is evidence of unfair trading
practice due to imports sold at less than fair value (antidumping) or benefiting from
foreign subsidies (countervailing duty). In the first category (general escape clause
investigations) it is not necessary to prove unfair trading practices but there must be
“serious injury” to the industry due to increased imports, and in this case a country is

Chapter Three: Earnings Management Models
66
temporarily released from its obligations under the General Agreement on Tariffs and
Trade (GATT), hence the term “escape clause”.
Jones (1991) identifies the differences between the Total Accruals Model and the Single
Accruals Model as follows
• The Total Accruals Model is preferable to the single accruals model because it is
more powerful in terms of capturing earnings management.
• The Total Accruals Model measures the change in non-cash working capital
before income tax payable minus depreciation expenses, and the Single Accrual
Model measures cash working capital.
Jones stated that earnings management could achieved by several means, shown in the
figure below:
Jones (1991) Earnings Management
Earnings Management Assumption
The Jones (1991) model is based on the DeAngelo model, which assumes that the
“average change in non-discretionary accruals (NA) is approximately zero so that the
change in total accrual (TA) reflects change in discretionary accruals (DA)” (page 207)
Earnings management
Debt-equity swaps
Debt defeasance (hedging)
Change in accounting methods
Capital structure changes
Accruals

Chapter Three: Earnings Management Models
67
However, this assumption is less reasonable in the scenario studied by Jones. Total
accruals are dependent on the economic circumstances of the firm (Kaplan, 1985) and
decreases in revenues (which we have by definition in this sample) are likely to cause
decreases in NA.
A new model is developed to take into account changes in the economic circumstances of
the firm (falling revenues and asset values). This is an OLS regression model
𝑻𝑻𝑨𝑨𝒎𝒎,𝒕𝒕𝑨𝑨𝒎𝒎,𝒕𝒕−1
= 𝜶𝜶𝒎𝒎 �1
𝑨𝑨𝒎𝒎,𝒕𝒕−1�+ 𝜷𝜷1,𝒎𝒎 �
∆𝑹𝑹𝑬𝑬𝑰𝑰𝒎𝒎,𝒕𝒕𝑨𝑨𝒎𝒎,𝒕𝒕−1
� + 𝜷𝜷2,𝒎𝒎 �𝑫𝑫𝑫𝑫𝑬𝑬𝒎𝒎,𝒕𝒕𝑨𝑨𝒎𝒎,𝒕𝒕−1
� + 𝝐𝝐𝒎𝒎,𝒕𝒕
Total accruals (TA) is given by
𝑻𝑻𝑨𝑨𝒕𝒕 = [∆𝑪𝑪𝑪𝑪𝑮𝑮𝑮𝑮𝑫𝑫𝒎𝒎𝒕𝒕 𝒎𝒎𝑮𝑮𝑮𝑮𝑫𝑫𝒕𝒕𝑮𝑮 − ∆𝑪𝑪𝒎𝒎𝑮𝑮𝑪𝑪 − ∆𝑪𝑪𝑪𝑪𝑮𝑮𝑮𝑮𝑫𝑫𝒎𝒎𝒕𝒕 𝒍𝒍𝒎𝒎𝒎𝒎𝒃𝒃𝒎𝒎𝒍𝒍𝒎𝒎𝒕𝒕𝒎𝒎𝑫𝑫𝑮𝑮]
− 𝑬𝑬𝑫𝑫𝒑𝒑𝑮𝑮𝑫𝑫𝒅𝒅𝒎𝒎𝒎𝒎𝒕𝒕𝒎𝒎𝑮𝑮𝒎𝒎 𝒎𝒎𝒎𝒎𝑬𝑬 𝒎𝒎𝒎𝒎𝑮𝑮𝑮𝑮𝒕𝒕𝒎𝒎𝑮𝑮𝒎𝒎𝒕𝒕𝒎𝒎𝑮𝑮𝒎𝒎 𝑫𝑫𝒎𝒎𝒑𝒑𝑫𝑫𝒎𝒎𝑮𝑮𝑫𝑫
All variables are scaled by total assets (A) in year t-1 to reduce heteroskedasticity, and T
is the estimation period used to establish the level of “normal accruals” for each firm,
which ranges between 14 and 32 years.
The models of normal total accruals are estimated as time series but the significance of
income-decreasing accruals is tested using cross-sectional tests in years 0 and 1 of the
ITC investigation.
There are two issues related to the assumption that average change in non-discretionary
accruals (NA) is approximately zero so that the change in total accrual (TA) reflects
change in discretionary accruals (DA), and these are:
• REV (firm’s revenues) which is used to control for the economic environment is not a completely exogenous variable to earnings management levels.
• The relationship between NA and the independent variables is assumed to be stationary.
The residual term from this model represents discretionary accruals (DA). The overall
significance of discretionary accruals is tested using a standardised prediction error.

Chapter Three: Earnings Management Models
68
Measuring Earnings Management
Jones’s (1991) model differs from prior studies such as Healy (1985), DeAngelo (1986)
and McNichols and Wilson (1988), because Jones (1991) uses total accruals as a proxy
for earnings management. Healy (1985) and DeAngelo (1986) measured earnings
management by dividing total accruals into discretionary and non-discretionary
components. McNichols et al. (1988) measured earnings management by using models of
single accruals. Jones (1991) suggested that using total accruals under accruals is more
appropriate for measuring earnings management in her sample than single accruals,
because international trade commissioners select their cases based on earnings before tax,
which will reflect total accruals. Therefore, Jones (1991) suggested that the total accrual
should capture managers’ manipulation better than previous studies such as: Healy
(1985), DeAngelo (1986), and McNichols et al (1988).
Jones’ version of total accruals was calculated as below:
𝑻𝑻𝑨𝑨 = 𝑪𝑪𝑰𝑰𝑪𝑪𝑪𝑪𝑩𝑩𝑻𝑻− 𝑫𝑫𝑬𝑬 ……………………………………..…….……………. (1)
Where; TA is total accruals; CNWCBT is the change in non-cash working capital before
income taxes payable less total depreciation expenses, and DE is total depreciation
expenses.
CNWCBT was measured as below
𝐖𝐖𝐖𝐖𝐖𝐖𝐂𝐂𝐏𝐏 = (𝐖𝐖𝐃𝐃 − 𝐖𝐖𝐃𝐃𝐍𝐍𝐍𝐍)− (𝑪𝑪𝑳𝑳 − 𝑪𝑪𝑴𝑴𝑨𝑨𝑰𝑰𝑻𝑻𝑫𝑫) ……………………………….…… (2)
Where; CA is current assets; CASI is cash and short-term investments; CL is current
liabilities, and CMAITP is current maturities of long-term liabilities and income taxes
payable.
Jones used the DeAngelo (1986) model (specific expectation model) to model total
accruals:
∆𝐏𝐏𝐃𝐃𝐭𝐭 = (𝐏𝐏𝐃𝐃𝐭𝐭 − 𝐏𝐏𝐃𝐃𝐭𝐭−𝐤𝐤) = (𝐃𝐃𝐃𝐃𝐭𝐭 − 𝐃𝐃𝐃𝐃𝐭𝐭−𝐤𝐤)− (𝐍𝐍𝐃𝐃𝐭𝐭 − 𝐍𝐍𝐃𝐃𝐭𝐭−𝐤𝐤) ………………… (3)
Where; (TAt − TAt−k) is the change in total accruals; (DAt − DAt−k) is the change in discretionary accruals; and (NAt − NAt−k) is the change in non-discretionary accruals

Chapter Three: Earnings Management Models
69
Jones (1991) explained that differences in revenue would bring variations in numerous
elements in the financial statements.
Based on the results, Jones found the changes in accruals and earnings in year (+1) are
positive and not significant. In addition she reported that the changes in cash flow and
revenue are negative and not significant, which results from firm managers decreasing
income to avoid any ex post settling up by the regulators or to avoid taxes.
Accruals Model
Based on the results in the above section Jones (1991) established a new model; which
assumes that the relationship between non-discretionary accruals and the explanatory
variables is stationary.
𝐏𝐏𝐃𝐃𝐢𝐢𝐭𝐭𝐃𝐃𝐢𝐢𝐭𝐭−1
= 𝐛𝐛𝐢𝐢 (1
𝐃𝐃𝐢𝐢𝐭𝐭−1) + 𝐂𝐂1𝐢𝐢 (
∆𝐏𝐏𝐍𝐍𝐑𝐑𝐢𝐢𝐭𝐭 𝐃𝐃𝐢𝐢𝐭𝐭−1
) + 𝐂𝐂2𝐢𝐢 (𝐏𝐏𝐏𝐏𝐍𝐍𝐢𝐢𝐭𝐭𝐃𝐃𝐢𝐢𝐭𝐭−1
) + 𝛆𝛆𝐢𝐢𝐭𝐭 …………………….…......…….. (4)
Where; TA it is the total accruals for company (i) during period (t); ∆REV it is the change in the revenue for company (i) during period (t); PPE is property, Plant and Equipment; Ai t-1 is the total assets for company (i) for end of period (t-1); and εit is the random error.
Total accruals included change in working capital accounts such as accounts receivable,
accounts payable and inventories, which could affect revenues. However, the results
showed that the change in revenues is not a significant factor.
Tests of Model Misspecification
Jones (1991) also investigates the relationship between abnormal accruals and change in
revenue by using a sample of 459 firms that are not included in the ITC investigation
sample. The findings show no systematic relationship between these two variables. This
result lends support to the main hypothesis of the paper, which states that “managers of
domestic producers that would benefit from import protection make accounting choices
that reduce reported earnings during ITC investigation periods as compared to non-
investigation periods” (page 200).
The results were refined further by additional tests completed in order to test the
subsidiary hypothesis that “managers may have greater incentives to manage earnings if

Chapter Three: Earnings Management Models
70
the ITC investigation is being conducted under the general escape clause1” (page 202).
Her results in this section showed that petitioners are engaged in downward earnings
management. Furthermore, she showed that the firms in the general escape clause sample
were engaged in more downward earnings management than the firms in the antidumping
sample2. These results support her earnings management hypothesis.
Portfolio Tests
By using OLS regression, the Jones (1991) model implicitly assumes no correlation
between prediction errors and discretionary accruals (DAs). In order to determine the
effect of relaxing this assumption, the firms were grouped by industry and DAs averaged
across each group. This approach also addressed the “free rider” problem that arises since
all firms in the industry benefit from any relief granted. The results of these tests show
that “after the problems relating to cross-sectional correlation are mitigated by grouping
firms in industry portfolios (which also results in grouping by year) the DAs in year 0 are
still significantly income-decreasing” (page 223).
Concluding Remarks of Jones’s (1991) Paper
The Jones (1991) study found explicit evidence showing that managers decrease their
earnings in the period of import relief investigation, particularly in year zero and the
motivation for this was assumed to be the desire to maximize the relief granted to their
firm. The empirical tests also show improvement in the power of the Jones model to
detect earnings management compared to the models in Healy (1985), DeAngelo (1986)
and McNichols et al. (1988).
3.6.5 The Modified Jones Model (Proposed by Dechow, Sloan and Sweeney, 1995)
This paper reports on a replication study that tests the statistical power and specification
office models of discretionary accruals: Healy (1985); DeAngelo (1986); Jones (1991), a
modified version of the Jones model and the Industry Model (formulated by Dechow et al
1 General escape clause designed by Trade Act of 1974, to aid domestic industries that are seriously injured by increased imports. 2 Antidumping designed by Trade Act of 1974, to protect domestic industries from imports that are sold at less than fair value

Chapter Three: Earnings Management Models
71
themselves). These models are evaluated with reference to Type I and Type II error rates
and distribution of residuals.
• A type I error involves incorrectly accepting a research (alternative) hypothesis
when the null hypothesis is true. Here, concluding that firms have used earnings
management when they have not.
• A type II error involves incorrectly rejecting a research (alternative) hypothesis
when the null hypothesis is true. Here, not identifying earnings management when
firms have managed earnings.
This study is different from previous studies because they focus on samples of firm-years
with extreme financial performance because in this case there are likely to be more
motivations for managers to manipulate their earnings.
Dechow, et al (1995) measured potential misspecification by using McNichols and
Wilson (1988) analysis as follow:
𝑫𝑫𝑨𝑨𝒕𝒕 = 𝜶𝜶 + 𝜷𝜷 𝑫𝑫𝑨𝑨𝑹𝑹𝑻𝑻 𝒕𝒕 + ∑ 𝜸𝜸𝒌𝒌𝒌𝒌𝒌𝒌=1 𝑿𝑿𝒌𝒌𝒕𝒕 + 𝜺𝜺𝒕𝒕 …………………………………… (1)
Where; DA is discretionary accruals; PART is the partition dummy for which earnings
management prediction; 𝑋𝑋𝑡𝑡 are variables suggested to influence discretionary accruals;
and 𝜀𝜀 is errors.
In most studies, PART is set equal to one for firm-years where the researcher believes
earnings management is occurring in response to some stimulus. 𝑿𝑿𝒕𝒕 cannot usually be
observed directly and therefore, is excluded from the model; and discretionary accruals
cannot be observed and are measured using a proxy, which Dechow, et al (1995) call
DAP and which measures DA with error.
By using this model the researchers cannot arrive at precise results because they cannot
categorise relevant variables for discretionary accruals such as, (𝑿𝑿𝒌𝒌). Therefore, Dechow,
et al (1995) measured the previous model with error:
𝑫𝑫𝑨𝑨𝑫𝑫𝒕𝒕 = 𝜶𝜶� + 𝒃𝒃�𝑫𝑫𝑨𝑨𝑹𝑹𝑻𝑻 𝒕𝒕 + 𝝁𝝁𝒕𝒕 + 𝜺𝜺𝒕𝒕 …………………………………… (2)

Chapter Three: Earnings Management Models
72
Where; 𝐷𝐷𝐴𝐴𝑃𝑃𝑡𝑡 = Discretionary accruals with error; 𝑏𝑏�= Estimated 𝛽𝛽 with bias and the
direction of the bias is the same as the correlation between PART and µ; 𝜇𝜇𝑡𝑡= Term that
capture the omitted 𝑋𝑋𝑡𝑡 variables and the measurement error in𝐷𝐷𝐴𝐴𝑃𝑃𝑡𝑡; and 𝜀𝜀𝑡𝑡= an error
term that is independently and identically normally distributed.
The models were run both with and without the variable μ in order to evaluate its effect
on the power of this model.
There are three generic statistical problems that occur with the models, and these are: (1)
incorrectly attributing earnings management to PART (dummy variable partitioning the
data for two groups for earnings management), and this problem lead to increase the
probability of Type I error. “This problem will arise when (i) the proxy for discretionary
accruals contains measurement error that is correlated with PART and/or (ii) other
variables that cause earnings management are correlated with PART and are omitted
from the analysis. In this latter case, earnings management is correctly detected by the
model, but causality is incorrectly attributed to PART” (page 196).
(2) Unintentionally extracting earnings management caused by PART, which in turn
leads to an increase in the probability of Type II error. “This problem will arise when the
model used to generate the discretionary accrual proxy unintentionally removes some or
all of the discretionary accruals” (page 196). (3) The low power of the available test
statistics, leads to increasing the probability of Type II error. This problem will occur
when some variables are omitted from discretionary accruals.
Dechow et al (1995) develop the Modified Jones model to address the estimation
problems underlying the Jones model (1991). Dechow et al (1995) suggest that the
misspecification problems in the Jones model arises due to the omission of a separate
variable to reflect managers exercising their discretion over revenues. Therefore, the only
difference between the Jones model and the Modified Jones model is the inclusion of the
change in credit sales in the model, as a proxy for this. The Dechow et al (1995) model
assumes that all the changes in credit sales during the period of study resulted from
earnings management, and Jones (1991) includes the credit sales among total revenues.
Dechow, et al (1995) define total accruals as:

Chapter Three: Earnings Management Models
73
𝑻𝑻𝑨𝑨𝒎𝒎,𝒕𝒕 = 𝑰𝑰𝑪𝑪𝑫𝑫𝑰𝑰𝒎𝒎,𝒕𝒕 − 𝑪𝑪𝑪𝑪𝑪𝑪𝒎𝒎,𝒕𝒕………...……………............................................. (3)
Where; TA is total accruals; NOPI is net operating income; CFO is cash flow from
operating activities.
Non-discretionary accruals (NDAC) are modeled by:
𝑻𝑻𝑨𝑨𝒎𝒎,𝒕𝒕𝑨𝑨𝒎𝒎,𝒕𝒕−1
= 𝒎𝒎1 (1
𝑨𝑨𝒎𝒎,𝒕𝒕−1) + 𝒎𝒎2(∆𝑹𝑹𝑬𝑬𝑰𝑰𝒎𝒎,𝒕𝒕 −∆𝑹𝑹𝑬𝑬𝑪𝑪𝒎𝒎,𝒕𝒕
𝑨𝑨𝒎𝒎,𝒕𝒕−1) + 𝒎𝒎3 (𝑫𝑫𝑫𝑫𝑬𝑬𝒎𝒎,𝒕𝒕
𝑨𝑨𝒎𝒎,𝒕𝒕−1) + 𝜺𝜺𝒎𝒎,𝒕𝒕………………….... (4)
Where; TAi,t is the total accruals for the company (i) during period (t); ∆REVi, t is the
changes in the revenue (from credit sales) for company (i) during period (t); ∆RECi, t is
the changes in account receivable for company (i) during period (t); PPEi, t is Property,
Plant and Equipment; Ai, t-1 is the total assets for company (i) for end of period (t-1); and
𝜀𝜀𝑖𝑖,𝑡𝑡 is random error.
Discretionary accruals are defined as follows:
𝐃𝐃𝐃𝐃𝐖𝐖𝐢𝐢,𝐭𝐭 = 𝐏𝐏𝐃𝐃𝐢𝐢,𝐭𝐭 - 𝐍𝐍𝐃𝐃𝐃𝐃𝐖𝐖𝐢𝐢,𝐭𝐭 ……………………………………………………………. (6)
Ultimately, if the null hypothesis stated that discretionary accruals are less than or equal
zero is rejected, then the alternative hypothesis stated that accruals are managed upwards
will be accepted (Healy, 1985).
The Modified Jones model is one of the most powerful earnings management models for
two reasons:
• Since it is the first paper that used time series data to conduct the research.
• The standard errors resulting from the Jones model are lower than for other models which imply that it is a more powerful to detect earnings management.
The fifth model, Dechow et al (1991) test the Industry Model, which they devised
themselves. This model is similar to the Jones model, except that it assumes that
“nondiscretionary accruals are fixed all the times” and also that the difference in the
components of nondiscretionary accruals is common across all firms in a given
industry. Nondiscretionary accruals are defined, in this case, as below:
𝑰𝑰𝑫𝑫𝑨𝑨𝒕𝒕 = 𝜸𝜸1 + 𝜸𝜸2𝒎𝒎𝑫𝑫𝑬𝑬𝒎𝒎𝒎𝒎𝒎𝒎𝑰𝑰(𝑻𝑻𝑨𝑨𝒕𝒕)

Chapter Three: Earnings Management Models
74
• Where; 𝑇𝑇𝐴𝐴𝑡𝑡 is the median value of total accruals; and 𝛾𝛾1,2 are the firm specific
parameters.
Dechow et al (1995) use four samples to test the various earnings management models, and these are:
• The first sample is compiled from 1000 firm-years are selected from 168771 US firm-years from 1950 to 1991, to test the problem of incorrectly attributing earnings management to PART, particularly to measure the error of discretionary accruals (µ).
• The second sample is compiled from a pool of firms with distinctively different financial performance and where, as mentioned previously, is assumed to give greater incentives for earnings management.
• The third sample is compiled from the firm-years into which the researchers have artificially inserted synthetic accruals manipulations. These accruals include (1) expense manipulation over two periods (deferred expenses which reverse the following period). (2) Revenue manipulation: achieved by increasing accruals, revenue and accounts receivable (assuming that all costs are fixed). (3) Margin manipulation: premature recognition of revenue assuming all costs are variable.
• The last sample consists of 56 firm-years from firms subject to the securities exchange commission (SEC) enforcement actions for allegedly overstating annual earnings. This sample is established to test the earnings management in firms that violated the generally accepted accounting principles.
Dechow et al (1995) draw the following conclusions: the low explanatory power of
discretionary accruals models, the problem of finding suitable proxies, the problem of
confounding variables, measurement error and the low power of statistical tests suggest
that the Type II errors are generally much more of a problem for discretionary accruals
than Type I errors.
The models appear well specified, particularly when applied to firms with distinctively
different financial performances (and these are arguably the most likely to employ
earnings management). However, based on the assumption that economically plausible
magnitudes of earnings management would be around 1% to 5% of total assets, the
models have low power for detecting effects of this size. The modified version of the
Jones model has the highest power and, in particular, is the model that produces the
lowest incidence of Type II errors.

Chapter Three: Earnings Management Models
75
The researchers suggest that given the low power of the models, a sample of several
hundred firms would be needed in order to provide a reasonable chance of detecting
earnings management of the order of 1% of total assets. Researchers also need to be
aware of the characteristics of their sample in order to avoid using a model of non-
discretionary accruals that unintentionally removes some of the discretionary accruals
(e.g. using the industrial model when discretionary accruals are correlated across the
industry or the DeAngelo (1986) model when firms are in financial distress).
3.6.6 The Peasnell, Pope and Young (2000) Model
Peasnell, Pope and Young (2000) examine the power and specification for three accruals-
based models (Jones model 1991, Modified Jones model 1995, their own model, the
Margin Model) with a sample of UK firms in the period 1990 to 1997. This study differs
from prior studies because those researchers used cross-sectional analysis instead of time
series analysis. One result of this is the approach introduces noise into the estimation
process to the extent firms differ structurally within a given industry.
Peasnell et al (2000) Margin Model goes back to Kang and Shivaramakrishnan (1995)
who separate different discretionary components out of total accruals. This model is also
different from prior models because its focus on working capital accruals, which are
included as separate variables. Working capital accruals are defined as:
𝑪𝑪𝑪𝑪𝑨𝑨 = (∆𝑺𝑺𝑻𝑻𝑪𝑪𝑪𝑪𝑺𝑺− ∆𝑫𝑫𝑬𝑬𝑩𝑩𝑻𝑻) − ∆𝑪𝑪𝑹𝑹𝑬𝑬𝑫𝑫𝑰𝑰𝑻𝑻+ (𝑰𝑰𝑪𝑪𝑪𝑪𝑨𝑨+ 𝑻𝑻𝑫𝑫 + 𝑪𝑪𝑳𝑳𝑪𝑪𝑪𝑪) … … … … … … (1)
Where; WCA is working capital accruals; ∆STOCK is the difference between the
purchases of materials and the cost of finished goods sold; ∆DEBT is the difference
between revenue from credit sales, cash received from customers and the bad debt
expense; ∆CREDIT is the difference between the purchases of materials and cash paid to
suppliers; NCCA is non-cash current assets other than stocks; TD is trade debtors; and
CLOC is all current liabilities other than creditors.
Working capital accruals are then modeled as below:
𝑪𝑪𝑪𝑪𝑨𝑨𝒎𝒎 = 𝝀𝝀0 + 𝝀𝝀1𝑹𝑹𝑬𝑬𝑰𝑰𝒎𝒎 + 𝝀𝝀2𝑪𝑪𝑹𝑹𝒎𝒎 + 𝜼𝜼𝒎𝒎 … … … … … … … … … … … … … … … … … … … … . . (2)

Chapter Three: Earnings Management Models
76
Where:
𝑅𝑅𝐸𝐸𝑅𝑅𝑖𝑖 is total sales, 𝐴𝐴𝑅𝑅𝑖𝑖is total sales minus the change in trade debtors, 𝝀𝝀0 is regression
coefficients, 𝝀𝝀1 is coefficient represents an estimate of the sales margin and is predicted
to be positive, 𝝀𝝀2 is coefficient represents an estimate of the cash margin and is predicted
to be negative, and 𝜂𝜂 is regression residual.
The main difference between the standard Jones Model, Modified Jones Model and the
Margin Model is that the Margin Model divides the change in revenue into two elements
in the model fitting stage, replacing cash receipts in the current period for revenues in the
prior period.
In order to examine the power of the standard Jones model, Modified Jones Model and
the Margin Model Peasnell et al used three types of earnings management manipulations,
and these are:
(1) expense manipulation excluding bad debt expenses; this approach is different
from Dechow et al (1995) since this study uses a cross-sectional approach,
therefore they cannot make any change adjustments for accrual reversals in future
accounting periods, for example, delayed recognition of an expense.
(2) Manipulation of the bad debt provision; this type of accrual was not included
in the Modified Jones Model.
(3) Revenue manipulation: this type is used in the Modified Jones Model.
The reported results for the Margin Model show an increase in the power to detect
earnings management of 40%, for the UK sample, compared to the Modified Jones
model.
Peasnell et al (2000) identify three problems related to the standard Jones and Modified
Jones Models and these are: (1) certain bias issues arise naturally as a result of the models
continuing to apply time series analysis. (2) The assumption that the estimates of
coefficients on the change of revenue and PPE are stationary over time. (3) The self-
reversing property of accruals could lead to specification problems, particularly in the
form of serially-correlated residuals.

Chapter Three: Earnings Management Models
77
The paper showed that both the Modified Jones and Jones models are more powerful in
detecting earnings management when applying them to a random sample with cross-
sectional analysis than when applying them to a random sample with time series analysis.
However, Peasnell, et al (2000) designed the Margin Model to further increase the power
of the standard Jones and modified Jones Model to detect revenue manipulations in cross
sectional analysis.
They found that the margin model was most powerful when the cash flow performance
was extreme, and was particularly effective in terms of detecting accruals associated with
bad debt. On the other hand, the researchers found that cross-sectional analysis has a
significant disadvantage, in that it induces noise into the parameter estimation due to
different structures of firms in the same industry. Finally, Peasnell et al (2000) showed
that precise detection of accruals management still remains difficult, particularly at levels
that are less than 5% of total assets.
3.6.7 The Caylor 2010 Model
The Caylor (2010) model focuses particularly on managers using their discretion over
revenue recognition, such as through accrued revenue (accounts receivable) and deferred
revenue (advance from customers) Caylor (2010) structures the analysis around three
earnings objectives (which he calls benchmarks):
1. Avoidance of losses
2. Avoidance of earnings decreases
3. Avoidance of negative earnings surprises.
The model is based on real business activities such as easing customer credit policies and
it uses gross accounts receivable instead of net accounts receivable because abnormal
changes in net accounts receivable could reflect changes in the allowance for bad debt.
The study uses three separate samples to test the different earnings benchmarks:
• To test the first hypothesis Caylor used 15,193 (7284) firm-year observations for
the loss and earnings decrease (earnings surprise) benchmarks for fiscal years
2001–2005

Chapter Three: Earnings Management Models
78
• To test the second benchmarks he used 4846 (2664) firm-year observations for the
loss and earnings decrease (earnings surprise) benchmarks for fiscal years 2001–
2005.
• To test the third hypothesis the sample decreased to 1807 firm-year observations
since he used the firms that have both accounts receivable and deferred revenue.
Two earnings management models are used in Caylor (2010). One of them is based on
gross accounts receivable and the other one based on deferred revenues.
The normal changes in gross accounts receivable model uses Dechow et al’s (1998)
insight that gross accounts receivable are related to current period’s sales, as accounts
receivable are sales accrued in the current period.
Caylor (2010) construct the following model to examine this factor:
∆𝐆𝐆𝐆𝐆𝐆𝐆𝐛𝐛𝐛𝐛 𝐃𝐃𝐏𝐏𝐭𝐭𝐃𝐃𝐭𝐭−1
= 𝛂𝛂0 + 𝛂𝛂1 ∗ �1
𝐃𝐃𝐭𝐭−1� + 𝛃𝛃1 ∗ �
∆𝐍𝐍𝐭𝐭𝐃𝐃𝐭𝐭−1
� + 𝛃𝛃2 ∗ �∆𝐖𝐖𝐂𝐂𝐂𝐂𝐭𝐭+1𝐃𝐃𝐭𝐭−1
� + 𝛆𝛆𝐭𝐭
Where; ∆Gross A/Rt = the change in gross accounts receivable during year t; 𝐴𝐴𝑡𝑡−1is the
beginning of year total assets; ∆St is the change in sales during year t; ∆CFO t+1 is the
change in cash flow from operations during year t + 1.
The normal changes in the deferred revenue model is specified as follows:
∆𝐃𝐃𝐃𝐃𝐃𝐃 𝐏𝐏𝐃𝐃𝐑𝐑𝐭𝐭𝐃𝐃𝐭𝐭−1
= 𝛂𝛂0 + 𝛂𝛂1 ∗ �1
𝐃𝐃𝐭𝐭−1� + 𝛃𝛃1 ∗ �
∆𝐍𝐍𝐭𝐭+1𝐃𝐃𝐭𝐭−1
� + 𝛃𝛃2 ∗ �∆𝐖𝐖𝐂𝐂𝐂𝐂𝐭𝐭𝐃𝐃𝐭𝐭−1
�+ 𝛆𝛆𝐭𝐭
Where; ∆Def Revt is the change in short-term deferred revenue during year t; 𝐴𝐴𝑡𝑡−1is the
beginning of year total assets; ∆𝑆𝑆𝑡𝑡+1is the change in sales during year t+1; ∆CFO t is
the change in cash flow from operations.
Caylor’s (2010) results indicate that “there is a significant and positive relationship
between the changes of gross account receivable and the changes of current sales and
future cash flow from operating with t-statistic (18.69 and 4.03 respectively)” (page 88).
There is a significant and positive relationship between the changes of deferred revenue
and the changes of current sales and future cash flow from operating with t-statistic (4.86
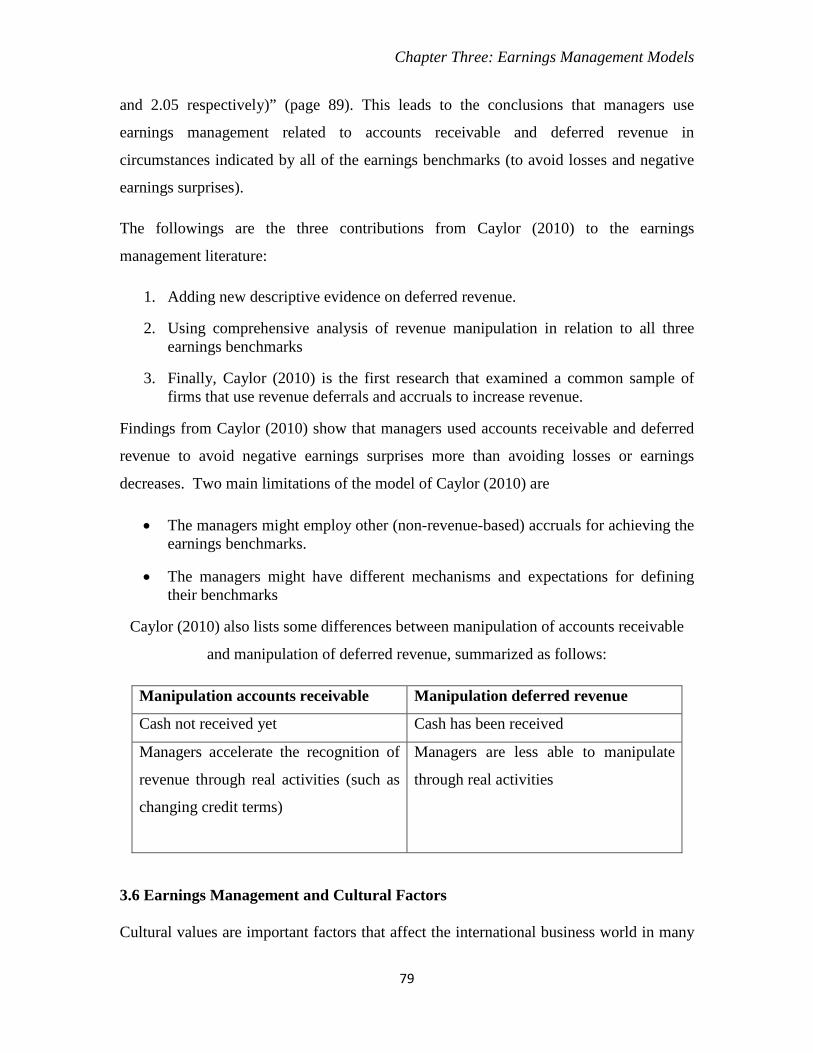
Chapter Three: Earnings Management Models
79
and 2.05 respectively)” (page 89). This leads to the conclusions that managers use
earnings management related to accounts receivable and deferred revenue in
circumstances indicated by all of the earnings benchmarks (to avoid losses and negative
earnings surprises).
The followings are the three contributions from Caylor (2010) to the earnings
management literature:
1. Adding new descriptive evidence on deferred revenue.
2. Using comprehensive analysis of revenue manipulation in relation to all three earnings benchmarks
3. Finally, Caylor (2010) is the first research that examined a common sample of firms that use revenue deferrals and accruals to increase revenue.
Findings from Caylor (2010) show that managers used accounts receivable and deferred
revenue to avoid negative earnings surprises more than avoiding losses or earnings
decreases. Two main limitations of the model of Caylor (2010) are
• The managers might employ other (non-revenue-based) accruals for achieving the earnings benchmarks.
• The managers might have different mechanisms and expectations for defining their benchmarks
Caylor (2010) also lists some differences between manipulation of accounts receivable
and manipulation of deferred revenue, summarized as follows:
Manipulation accounts receivable Manipulation deferred revenue
Cash not received yet Cash has been received
Managers accelerate the recognition of
revenue through real activities (such as
changing credit terms)
Managers are less able to manipulate
through real activities
3.6 Earnings Management and Cultural Factors Cultural values are important factors that affect the international business world in many

Chapter Three: Earnings Management Models
80
areas, such as foreign investment decisions, international trade, economic growth,
earnings management, and corporate governance (Desender, Castro and Escamilla De
Leon, 2011).
Rohaida (2011) suggests a number of audit firm culture indicators that could lead to higher
audit quality and potentially they could also constrain earnings management practices
among UK firms. These are:
• creating an environment where achieving high quality is valued, invested in and
rewarded;
• emphasising the importance of behaving in the public interest and the effect of
doing so on the reputation of both the firm and individual auditors;
• ensuring partners and staff have sufficient time and resources to deal with difficult
issues as they arise,
• ensuring that financial considerations do not drive actions and decisions having a
negative effect on audit quality;
• promoting the merits of consultation on difficult issues and supporting partners in
the exercise of their personal judgment,
• ensuring robust systems for client acceptance and continuation,
• fostering appraisal and reward systems for partners and staff that promote the
personal characteristics essential to quality auditing, and
• ensuring audit quality is monitored within firms and across international networks
and appropriate consequential action is taken.
Several studies have investigated the association between cultural values and earnings
management, for example, Desender, et al (2011), who based on a sample of 8,616 non-
financial firms across 31 countries during the period 1990 – 1999 to conduct his research.
Desender, et al (2011) investigate the relationship between cultural values, particularly
individualism and earnings management. Their results show that countries exhibiting
high levels of individualism tended to have lower levels of earnings management.
Guan, et al (2005) examine the potential effect of cross-country differences in culture by
Chapter Three: Earnings Management Models
81
using variables defined by Hofstede (1983): individualism1, power distance2, uncertainty
avoidance3 and long-term social values on earnings management in five Asia-Pacific
countries: Australia, Japan, Hong Kong, Malaysia and Singapore. Their results indicate
that cultural values significantly affect earnings management. In other evidence, based on
a dataset of 27 countries during the period 1987 – 2001, Guan and Pourjalali (2010)
analyze the relationship of cultural values, disclosure and earnings management. They
found that uncertainty avoidance influence earnings management downwards, and other
cultural values, such as individualism, power distance, and masculinity4 affect
significantly the degree of earnings management.
Nabar and Boonlert-U-Thai (2007) produce a comparative study, examining the impact
of notional culture on earnings management by using a sample from thirty countries. The
study found that culture is an important factor affecting accounting choices and should
have received more attention from standard setters enacting and enforcing international
financial reporting standards. Additionally, they found that earnings management was
relatively lower in countries in which the main language is English, and relatively higher
in countries with a high score of uncertainty avoidance. Finally, their additional analysis
of earnings management show that uncertainty avoidance and masculinity have a
relationship with earnings management and no relationship with earnings smoothing5.
Doupnik (2008) investigates the relationship between national culture and earnings
management. His findings, based on a sample of thirty one countries, show that there is a
stronger relationship between culture and earnings smoothing than in the relationship
between culture and earnings management.
1 Individualism: The extent to which the individual expects personal freedom versus the acceptance of responsibility to family, tribal, or national groups. 2 Power Distance: The degree of tolerance for inequality of wealth and power indicated by the extent to which centralization and autocratic power are permitted. 3 Uncertainty Avoidance: The extent to which society avoids risk and creates security by emphasizing technology and buildings, laws and rules, and religion. 4. Masculinity: The extent to which society differentiates roles between the sexes and places emphasis on masculine values of performance and visible achievement.
5 They defined earnings smoothing with two dimensions, and these are: (1) the country’s median ratio of firm-level standard deviations of operating income and operating cash flow (both scaled by lagged assets), (2) the country’s Spearman correlation between change in accruals and change in operating cash flow (scaled by lagged assets).

Chapter Three: Earnings Management Models
82
3.7 Earnings Management and Agency Theory
Historically, agency theory has been used in previous studies as an approach that
describes the relationship between companies’ owners (principals) and companies’
managements (agents). Agency theory has developed because of the separation between
the ownership and control in firms, particularly when the owners or the board of directors
have to hire a person to manage and assess their work. Two important problems are: (1)
How to align the conflicting goals of principals and agents. (2) How to ensure agents
perform in the way principals expect them (Jensen and Meckling, 1976). Agency theory
posits that the gap between the owners interests and the manager’s interests, will lead to
new managerial problems such as, managerial mischief (Nyberg, Fulmer, Gerhart and
Carpenter, 2010).
Eisenhardt (1989) posits that agency problems will arise when the executives or the
managers manipulate financial information in the firm to achieve their motivations, such
as, when a manager decides to buy a new machine with less quality and a cheaper price to
reduce the cost, which in turn leads to an increase in his bonuses. The seminal paper,
Demski and Feltham’s study (1978) investigates the relationship between accounting and
agency theory by exploring why and how budgets should be used to achieve the
managers’ motivation in an economic setting. They focus on three types of employment
contracts in the labour market, and these are: (1) Contracting incentives. (2) Contracting
in a perfect and complete market setting. (3) Contracting in an incomplete market setting.
Finally, they found that agency theory that use employment contracts differently
influences the financial information based on the firm’s situation in the labour market,
and the standards that have been used in this firm.
Several studies have investigated the relationship between earnings management and
agency theory (e.g. Nyberg et al, 2010; Jiraporn et al, 2008; Davidson III, Jiraporn, Kim
and Nemec, 2004).
Nyberg et al (2010) investigate the relationship between CEO compensation and
shareholder returns by developing a new theoretical concept. They found that agency
theory was not suitable to analyse all corporate problems, but it can, nevertheless,

Chapter Three: Earnings Management Models
83
contribute to solving some of the individual problems such as board monitoring and the
market for corporate control, which could both lead to increased agency costs, that occur
from asymmetric information and lack of goal congruence between owners and
managers.
On the other hand, Jiraporn et al (2008) use agency theory as a tool to distinguish
between the opportunistic and beneficial uses of earnings management, by suggesting
that the poor association between earnings management and shareholders wealth
maximization leads to increased earnings management in firms, particularly when the
agency costs are more acute. The empirical evidence reveals a positive relationship
between earnings management and firm value, and a negative relationship between
earnings management and agency costs.
Davidson III, et al (2004) use a sample of 173 duality-creating1 succession
announcements and 112 non-duality-creating succession announcements during the
period 1982-1992, to examine the relationship between earnings management and agency
theory. They posit that impression management (through earnings management) could be
regarded as an agency cost if it leads to non-optimal decision making by shareholders.
Their results show that duality-creating successions are more likely to result in earnings
management than non-duality-creating successions, because the managers and the chief
executive officer in the firm have the power to control earnings more than stockholders.
Palliam and Shalhoub (2003) examine the techniques that managers used to manipulate
their earnings based on a sample of 74 firms during the period of 1998 to 2001. Two
manipulation models used are as follows:
𝐔𝐔𝐍𝐍1 =𝐖𝐖𝐢𝐢𝐏𝐏𝐖𝐖𝐆𝐆𝐍𝐍
… … … … … … … … … … … … … … … … … … … … … … … . (1)
𝐔𝐔𝐍𝐍2 =𝐖𝐖𝐢𝐢𝐜𝐜𝐆𝐆∗ �1 −
𝐍𝐍𝐏𝐏�… … … … … … … … … … … … … … . … … . … … … (2)
where Ci is the cash inflows generated from sales, Ci is the cash outflows from purchases
of the goods, T is the turnover that the company generated, S is the cost of goods sold,
1 Duality is that the position of CEO and Chairman being occupied by the same individual.

Chapter Three: Earnings Management Models
84
and (1−S/T ) is gross profit margin.
Their findings, which are based on the above two models, show that the use of income
from continuing operations, reflects permanent earnings totally.
Numerous researchers use agency theory to explain the relationship between corporate
social responsibility and earnings management, such as Kim, Park and Benson (2012);
Yongtao and Margaret (2011); Rahmawati and Dianita (2011); Hsiang-Lin, Chung-Hua
and Feng-Ching (2008) and Prior, Surroca and Tribo (2006).
Based on a cross-sectional study of 10 Asian countries, Kim, et al (2012) posit that
responsible social behaviour is associated with a reduction in earnings management. They
find that firms exercising corporate social responsibility are less likely to manipulate their
earnings by using discretionary accruals, and less likely to manage their real operating
activities, thereby delivering more transparency and reliability in earnings. Yongtao, et al
(2011) and Rahmawati et al (2011) also find that firms which have more social
responsibility are less likely to engage in earnings management. Heltzer (2011)
investigates the influence of corporate environmental responsibility on earnings
management based on 2171 American firms in 2007. His findings show that firms with
strong environmental policies had less earnings management
Gargouri, Shabou and Francoeur (2010) examine 109 Canadian firms over the period of
2004- 2005, to examine the association between earnings management and corporate
social performance. The study shows a positive relationship between the level of
corporate social performance and earnings management. Additionally, it finds a positive
connection between firms’ environment and employees, and earnings management
activities.
In another cross-sectional study based on 1,653 firms from 46 countries over the period
of 1993–2002, Hsiang-Lin, et al (2008) examine the impact of corporate social
responsibility on three types of earnings management; earnings aggressiveness, earnings
smoothing, and earnings losses and avoidance of earnings decreases. Their statistical
evidence showed that firms that have more social responsibility are more likely to
decrease earnings smoothing and earnings losses, and increase earnings aggressiveness.

Chapter Three: Earnings Management Models
85
In the same way, Prior, Surroca and Tribó (2008) examine the connection between
corporate social responsibilities and earnings management based on a multi-national
panel sample of 593 firms from 26 countries during the period of 2002 to 2004. The
researchers used the Jones (1991) model and the Dechow, et al’s (1995) model to
examine discretionary accruals, and use Kothari, Leone and Wasley’s (2005) model to
separate between discretionary accruals and non-discretionary accruals. This study found
a positive relationship between earnings management and strong corporate social
responsibilities. Also, it found a combination of high earnings management and strong
corporate social responsibilities to have negative effects on financial performance.
Prior, et al (2006) found a positive relationship exist between corporate social
responsibility and discretionary accounting accruals, and a negative relationship between
corporate social responsibility and financial performance, particularly in firms that used
earnings management practices. The findings reveal a weak relationship between
corporate social responsibility and financial performance in firms that have high earnings
management.
3.8 Summary This chapter presents an overview of published studies on earnings management. It
begins with discussions on a few versions of Earnings management definitions and
followed up with discussion on the motivations for earnings management. This includes
the analysis and debate on the opportunistic earnings management motivations and
beneficial earnings management motivations. Then, it discussed how earnings
management models worked in prior studies, and also provides a critique of earnings
management models that have been used in this PhD research and other models that are
important in measuring earnings management with an aim to provide a more
comprehensive understanding. Finally, association of earnings management, agency
theory and cultural values are also discussed.

Chapter Four: The Role of Corporate Governance and Earnings Management
86
4. Chapter Four: The Role of Corporate Governance and Earnings
Management
4.1 Introduction
Several issues related to earnings management were discussed in the previous chapter.
Namely, earnings management types including opportunistic earnings management
motivations and beneficial earnings management motivations and how earnings
management models have worked in prior studies. The chapter discussed and provided a
critique of earnings management models that are used in this research and other models
that are considered important such as, Healy (1985), DeAngelo (1988, 1986); an
overview of the literature on earnings management and cultural values, and the use of
agency theory to explain earnings management. Following on from this, the current
chapter discusses the research methodologies used in the prior literature and methods of
collecting primary and secondary data, which were adopted for this research.
This chapter presents an outline of the Jordanian context in order to give an insight into:
Jordan’s political and economic history, internal control practices, the legal system, the
auditing profession and corporate governance mechanisms. The existence of strong
corporate governance mechanisms and high quality disclosure of financial data could in
fact lead to improved professional conduct in business transactions. This in turn would
facilitate the firm’s access to capital and support economic growth. In contrast, the
existence of weak corporate governance could encourage manipulation, corruption and
mismanagement. Leventis et al (2012) find that banks using good corporate governance
mechanisms have a strong ability to reduce aggressive earnings management compared to
other banks.
Understanding the background to these underlying issues would help to provide potential
support or evidence on interpreting the empirical results from the quantitative analysis
and interviews conducted, which aim at reaching out to a wider context. Accordingly, we
structured this chapter as follows: Section 4.2 presents a background of Jordan; Section
4.3 sheds light on earnings quality; particularly earnings quality and representational

Chapter Four: The Role of Corporate Governance and Earnings Management
87
faithfulness; Section 4.4 provides an overview of issues relevant to internal control in
Jordanian firms; Section 4.5 presents overview of corporate governance mechanisms in
Jordan; Section 4.6 offers a brief historical view of the legal system and culture in Jordan;
Section 4.7 provides a brief summary of the taxation system in Jordan; Section 4.8
analysis the nature of the relationship between internal control, corporate governance
mechanisms and earnings management; and Section 4.9 presents an overall chapter
summary.
4.2 The Political and Economic Context of Jordan
Jordan, whose capital city is Amman, is a developing country in the Middle East. The
foundation of Jordan dates back to 1921, when Prince Abdullah ben Al-Hossen ben Ali
(1921) announced the birth of the Emirate of Transjordan, which at the time was under
British mandate. On 22 March 1946 a treaty was signed with Britain which recognised
the independence of Jordan. The system of government in Jordan is a constitutional
monarchy that is restricted to the male descendants of the Hashemite family. Arabic is the
official language of the state, but English is used widely, particularly in the field of
business (Ministry of Education, 2012; Ministry of Tourism, 2012).
Figure 4-1 Map of Jordan
Source: The Royal Jordanian Geographic Centre (2012)
As Figure 4.1 shows, Jordan is located at the confluence of Europe, Asia and Africa, and
located between latitudes 29 and 32 north, and between longitudes 35 and 39 east and the
Syrian Arab Republic is bordered to the north, and Palestine from the west, and Saudi

Chapter Four: The Role of Corporate Governance and Earnings Management
88
Arabia to the south and east, and Iraq to the east. Jordan location contains an area of 89.3
thousand kilometres square.
Jordan is a generally resource-poor country compared with Middle East countries, but it
does contain significant deposits of both oil shale and sources of uranium. These potential
sources of indigenous energy have been the focus of renewed interest in recent years.
However, despite difficulties regarding regional political problems, Jordan keeps its
status by continuing with increasing economic growth compared to other developing
countries, particularly in the Middle East region. The most important industries in Jordan
are cement, fertilizers, petroleum refining, the iron and steel industry, electricity,
foodstuffs, textiles and fabrics, leather industries in addition to potash and phosphate
(The Royal Jordanian Geographic Centre, 2012). Until early 1970, Jordan followed the
British financial reporting system. In early 1973, Jordan began to convert to the US
financial reporting system, particularly after the establishment of the FASB in 1973.
The official currency in Jordan is the Jordanian dinar (JD) which is divided into 1000 fils,
or 100 piastres. The Jordanian dinar takes two forms: paper currency with a value of 50,
20, 10, 5, 1, and 0.5 dinars, and metal currency (coins) with a value of 10, 5, 1, 0.5, 0.25
dinars or 100, 50, 25, 10 and 5 fils (Central Bank of Jordan, 2012). One Jordanian dinar
and eleven piastres is equivalent to one UK pound (2012).
The Jordanian government focused on developing the industrial sectors to develop its
economy. This provides new jobs and produces much of the creativity and innovation
that fuels economic progress. The country is very attractive to foreign investments due to
its political stability and central location in the Middle East. Industries in Jordan can be
divided into the following two types:
• The Manufacturing Sector: this sector includes several industrial areas such as:
leather and footwear manufacturing, and the chemical industry. This sector
contributes to about 18% of Jordanian Gross Domestic Product (GDP).
• The Mining Sector, this sector contributes about 2% of Jordanian Gross
Domestic Product (Ministry of Industry and Trade, 2012).

Chapter Four: The Role of Corporate Governance and Earnings Management
89
The Jordan business environment has recently been changed to bring corporate financial
reporting systems in line with international standards on auditing (ISA), and International
Accounting Standards (IAS). Accordingly, several bodies have been made responsible for
achieving this:
• The Ministry of Industry and Trade.
• Jordan securities commission (JSC).
• Amman stock exchange (ASE).
• Securities depository center (SDC).
• Jordan Companies Law (1997).
Table (4.1) describes the characteristics of the Amman Stock Market under securities law
No. 76 in 2002. This table sheds light on the decreasing growth in ASE during the period
of this study. Firms’ capitalisations, as shown in Table (2.1), tended to decrease in the
period of 2007 to 2012. Even increasing the numbers of firms in years 2008, 2009 and
2010 did not make any significant difference to the increase in firms’ capitalisations.
Table 4-1 Characteristics of Amman Stock Market under Securities law No. 76 in 2002
(Major Financial Indicators)
Year Number of Firms
Market Capitalisation (JD million)
Book Value (JD million)
Dividends (JD million)
No. of Shares (million)
2006 227 21,078 10,095 506 4,561 2007 245 29,214 11,654 609 5,393 2008 262 25,406 12,837 617 6,395 2009 272 22,527 13,627 577 6,726 2010 277 21,858 692 608 7,006 2011 247 19,273 1,087 843 6,951 2012 243 19,142 N.A N.A 7,074
Source: Amman Stock Market 2013.
The Amman Stock Market consists of three main sectors, and these are: (1) industrials
firms; (2) financial firms, which include banking and insurance firms, and (3) service
firms. This study focuses on the industrial sectors since the other two sectors have
different accountings methods and regulations. Each firm, regardless of its sector of the
Amman Stock Market, has to register under one of the Amman Stock Markets. There are

Chapter Four: The Role of Corporate Governance and Earnings Management
90
three markets based on different conditions, and the following section explains the
conditions for each market:
First Market
There are several conditions that firms have to achieve to be inserted under the first
market (ASE 2014), and these are:
• A full year at least must have elapsed during which its shares were listed on the
second market.
• The net shareholders' equity in the firm must not be less than 100% of its paid-in
capital.
• The firm must have realised net pre-tax profits for two financial years at least of
the last three preceding the listing transfer, provided the company's average net
pre-tax profit for the last three years is not less than 5% of the company's paid-in
capital.
• The ratio of the Free Float in the firm to the number of subscribed shares at the
end of its financial year must not be less than 10% of its paid-in capital (if less
than 50 million Jordanian Dinars, excluding firms whose paid-in capital equals or
exceeds 50 million Jordanian Dinars).
• The number of the company's shareholders at the end of its financial year must
not be less than 100.
• The company's paid-in capital must not be less than 5 million Jordanian
Dinars.
Second Market
There are also several conditions that firms have to achieve in order to enter the second
market (ASE 2014), and these are:
• A full year at least must have elapsed during which its shares were listed on the third market.

Chapter Four: The Role of Corporate Governance and Earnings Management
91
• The net shareholders' equity in the firm must not be less than 50% of its paid-in capital.
• The percentage of the Free Float in the firm must not be less than 5% of the paid-in capital of such firms whose paid-in capital is less than 10 million Jordanian Dinars, excluding firms whose capital equals or exceeds 10 million Jordanian Dinars.
Third Market
There are several conditions that firms have to achieve to be inserted into the third market
(ASE 2014), and these are:
• The new firms, which must have been established for a year at least, must gain the right to initiate work.
• Firms that do not meet the conditions to be included in either the first or second.
• Efficacy in the third market
• The firms that will be inserted into the third market are various and include mismatch distressed firms, low liquidity firms, firms that do not comply with instructions of disclosure or modern additions to corporate governance, and others.
4.3 Overview of Internal Control
The top management in the firm is responsible for establishing strong internal control
systems, which may include complying with internal auditing standards, international
accounting standards, and Sarbanes-Oxley Act of 2002. In order to understand internal
control systems, this research presents several definitions. For example, Romney and
Steinbart (2003) define internal control as “a plan or method that will be used from the
organisations to preserve their assets, provide accurate and reliable information, promote
and improve operational efficiency, and encourage adherence to prescribed managerial
policies”. In another definition, Amudo and Inanga (2009) describe internal control as “a
system to monitor and control the manipulation, and accounting scandals in the financial
statements in the developed and emerging markets”. Hayes, Dassen, Schilder and
Wallage (2005) define internal control as “a procedure that guides the board of directors

Chapter Four: The Role of Corporate Governance and Earnings Management
92
and management to monitor and achieve all the performance and profitability goals in the
firms”.
Aforementioned definitions document that the main aim of internal control is to prevent
any potential errors, mistakes or fraud that might occur during the preparation of financial
statements, which means that the strong internal controls are more likely to increase the
transparency and reliability in financial statements (Doyle, Ge and McVa, 2007). Internal
control and management control act as a combined system and work together to control
business affairs. In other words, it is not possible to separate internal control from
management functions (i.e. planning, organizing, staffing, directing, leading, controlling
and coordinating), where both of them are working to achieve firm objectives (Chambers
and Rand, 1997).
The Committee of Sponsoring Organizations of the Treadway Commission, the Public
Oversight Board and the Board of Directors of the AICPA document that the reports of
internal control would lead to the improvement of internal control systems for two
reasons: (1) good internal control will lead the firms to comply with the operating and
financial objectives that have issued by accounting institutions, and (2) reporting the
quality of internal control in financial reporting could lead to improvements in the quality
of firm’s disclosures by providing financial reporting users, whether internal or external,
with proper information (COSO, 2009). On the other hand, there are some writers who
believe that internal control reporting does not affect internal control systems. This
debate makes internal control reporting an important issue to the accounting profession,
and generates significant controversy in the context of internal control (McMullen,
Roghunandan and Rama, 1996).
Several studies in prior literature document that internal control is considered as one of
the most important factors that prevent the errors and mistakes or manipulations that
might occur during the preparation of financial statements. Altamuro and Beatty (2010)
find a positive relationship between the application of internal control regulations and
quality of financial reporting. In another research study, Karagiorgos, Drogalas,
Gotzamanis and Tampakoudis (2010) investigate the roles of internal audit contribution
to corporate governance from the theoretical side in which three variables were used to

Chapter Four: The Role of Corporate Governance and Earnings Management
93
measure internal auditing quality (audit committee composition, external auditor, and
internal audit process). This study finds that the audit committees contributed to
corporate governance by providing information about internal controls, risk management
processes, fraudulent activities or irregularities, managing and reviewing annual and
periodic audits reporting. They also found that external audit and internal audit processes
contributed to corporate governance by conducting and reviewing ethics policies and the
organization’s code and communicating to employees. Finally, their empirical evidence
indicates that external audit and internal audits are considered to be a cornerstone of
corporate governance by detecting any error or mistake or manipulation that might arise
during the preparation of financial statements.
Based on a sample of 13,395 firms from Germany, Australia, Switzerland, France and the
UK over the period 1994-2002, Brown, Pottb and Wömpenerb (2014) argue that greater
effectiveness and efficiency in internal control could lead to increased earnings quality in
these firms. They used two models to examine their argument; (1) the returns-based
model, and (2) the accruals-based model. Cross-sectional regressions were used to
compare German firms with UK, Swiss, French and Australian firms. Thus, they made a
comparison between legislation of SOX and KTG for German companies in order to
reflect internal control variables. Their findings show that the effectiveness and efficiency
of internal control leads to increased earnings quality in the financial statements in these
countries.
Prior studies have also investigated the impact of internal control on different issues such
as financial reporting, earnings quality and financial institutions taking lending decisions.
For example, Altamuro and Beatty (2010) examine the impact of internal control
regulations on financial reporting in the US. Their results show a positive relationship
between the application of internal control regulations and financial reporting disclosure.
Based on interviews with 111 loan officers, Schneider and Church (2008) investigate the
relationship between internal control systems and lending officers’ assessments of
company’s creditworthiness. Measures such as an adverse internal control opinion,
unqualified internal control opinion and employing a "big four" firm as external auditor
were used to assess the quality of the internal control system. Their results show the firms

Chapter Four: The Role of Corporate Governance and Earnings Management
94
that receive unqualified internal control opinions by external auditors could easily get
bank loans.
4.4 Culture and Legal System in Jordan
Prior studies document that legal and regulatory issues play a different role in corporate
governance mechanisms based on the cultural, economic and political circumstances in
each country (Denisa and McConnella, 2003). The current legal system in Jordan derives
from several periods in legal history, the Ottoman Empire law, British laws particularly
during the period of their mandate on Jordan, and Islamic law (Sharia'a). Hence,
numerous legal systems exist together such as Sharia'a law and tribal law (Furr and
Alserhan, 2008). This is in addition to corporate and commercial laws; and these laws
include three main types of laws; (1) the civil code law No. 43 of 1976, (2) companies
law No. 22 of 1997, and (3) financial papers law No. 23 of 1997. In general, the legal
system in Jordan is a combination of policies and influences.
The Sharia'a law is applied in all aspects of social life (e.g. marriage, divorce, and
inheritance) and some business aspects, particularly in the firms that have a religious
character such as, Jordan Islamic bank and Islamic Insurance firms.
As for Tribal law, this law is not written but each Sheikh of a clan must memorize the
rules, which are common across the different tribes, and nominate another person to
succeed him, whom he can train. Tribal law is still applied in different aspects of life in
Jordan, including business. In theory, the tribe should be a supporter of the government in
relation to policies such as access to jobs, economic opportunity, schooling and social
privileges (Alon, 2005). Rowland, Altabini and Almomani (2009) states “….. The tribal
law is still used in Jordan officially to smooth things over, and unofficially just as a form
of social identification. In rural areas of Jordan, the tribal system is much more palpable
and plays a larger part in people’s lives than it does in the urban centres”.
In addition to the tribal system in Jordan, there exists a common practice among business
community, known as favouritism or nepotism called Wasta1. Culture is an important
1 Wasta is a system that involves requesting help and assistance from a connected party who has the power and influence to achieve a particular interest for someone who cannot achieve it alone.

Chapter Four: The Role of Corporate Governance and Earnings Management
95
factor that affects businesses, through different means including social structure, political,
religion, language, and education (Maitah, 2013). These are normally very difficult to
identify and therefore make it even harder to ascertain their effects.
4.5 Taxation System in Jordan
This section includes preliminary points that are designed to assist in the understanding
of the taxation system in Jordan. The taxation system is deemed amongst the most
sensitive issues for firms’ investors and for governments, as the fiscal policy applied by
the government must strike a balance between taxing corporations to raise revenue and
leaving profit in the firms to generate future economic growth and maintain healthy
capital markets.
The Income Tax system in Jordan was instituted in 1951. It has been applied under the
Law No. (50) since the year 1950. Nowadays, Jordan still applies the Income Tax Law,
No. 57 of 1985 that deals with tax issues. As in other jurisdictions, taxes in Jordan are
collected in two ways: direct taxes and indirect taxes.
As for the tax rates for the corporations in Jordan, there are different rates and these rates
are based on the firms’ activities (e.g. communication firms, mediation and financial
exchange firms, bank and financial firms and industrial and commercial firms), and are
subject to a lot of variations based on government objectives. Table (4.2) provides the tax
rates that are imposed on each type of activity:
Table 4-2 Tax Rates in Jordanian Industrial Firms (2013/2014)
Number Sector Tax Rate
1 Banks and Financial firms 30%
2 Commercial firms 14%
3 Industrial firms 14%
4 Communication 24%
5 Mediation firms 24%
6 Financial exchange firms 24%

Chapter Four: The Role of Corporate Governance and Earnings Management
96
Source: Income and Sales Tax Law, 1985.
Depreciation is a tax allowable expense in Jordan and therefore firms select their
depreciation policy with this in mind, since it allows them to reduce their tax bill. Also,
the Income and Sales Tax law (1985) allows firms to deduct expenses from their income
for purpose of net income tax, including the following:
“ …… punitive and civil penalties, penalties paid as civil compensation, capital expenditures, expenditures related to income from years for which the tax year has been finalized with the Income and Sales Tax Department, expenditures related to income exempted from income tax, provisions and reserves, personal expenses and expenses not related to work activities, income losses from investments, donations to governmental parties that exceed net income, donations to charities that exceed 25% of net income (Ernst and Young, 2011)”.
The existence of these deductible expenses may well provide an incentive to managers to
manipulate earnings downwards in order to reduce the amount of tax they pay (Healy and
Whalen, 1999),
4.6 Internal Control, Corporate Governance Mechanisms and Earnings Management
Proceeding from the importance of corporate governance that has been discussed, several
prior studies have investigated if the corporate governance mechanisms would affect
earnings management practices. Numerous empirical results presented in prior literature
show that a weakness of corporate governance mechanisms could lead to managers
engaging in earnings management to achieve some of their desired objectives such as,
increasing their bonuses and compensation (e.g. Healy, 1985; Deangelo, 1988; Dechow,
et al 1996; Rohaida, 2011; Alghamdi, 2010).
Dechow et al (1996) investigate the effect of internal corporate governance and earnings
management. Their findings reveal firms engaged in earnings management in several
situations such as: (1) when the firm’s board of directors were controlled by executive
directors; (2) when the firm has a Chief Executive Officer who is also working as
Chairman of the Board; (3) when the firm has a Chief Executive Officer who is also one
of the firm founders, (4) when the firm has a weak audit committee; and (5) when the
Chapter Four: The Role of Corporate Governance and Earnings Management
97
firm has small numbers of outside block-holders. In addition, they found that the main
incentive to manipulate earnings management in this study is attracting more external
investors at low cost.
4.6.1 The Characteristics of the Board of Directors and Earnings Management
According to Fama and Jensen (1983), financial transactions must be controlled; and the
validity and credibility of these operations are imperative in order for boards of directors
to achieve the objectives of shareholders, while protecting their rights. In 2002, Klein
found a negative association between the characteristics of the board of directors (e.g.
board independence and the number of outside directors) and earnings management,
particularly earnings management involving the use of abnormal accruals. In addition, the
empirical results of Vafeas (2005) found that board characteristics (e.g. length of board
tenure) are related to small earnings management.
4.6.1.1 Board Size and Earnings management
In the context of accounting and financial issues, the effect of board size is different from
one field to another. Yermack (1996) and Xie et al (2003) document that the larger board
is more likely to prevent earnings management.
In another context, Abdul Rahkman and Ali (2006) examine how the board of directors’
size affects the earnings management level by using a sample of 97 firms listed in the
main board of Bursa Malaysia, during the period of 2002-2003. Here, their findings show
a positive association between board of directors’ size and level of earnings management.
In contrast, Ahmed, Hossain and Adams (2006) also provide evidence that the board size
is negatively related to earnings management in New Zealand during the period 1991 to
1997. The possible explanations for the difference between these two results could be
related to: (1) the nature of Corporate Governance Code in each country, and (2) the
difference between the periods covered by each study.
A few studies have also investigated into the relationship between board size and
earnings management in the US after applying the Sarbanes-Oxley Act (SOX).This
includes, Ghosh, Marra and Moon (2010) and Alves (2011) who find the bigger boards
tends to discourage earnings management. In contrast, and based on a sample of 180

Chapter Four: The Role of Corporate Governance and Earnings Management
98
French and Canadian listed firms' data over the period 2006 – 2008, Jouber and Fakhfakh
(2012) found no relationship between board of directors’ size and earnings management
level. In the case of Jordan, Abed, Al-Attar, and Suwaidan (2012), they found a
significant relationship. However, their findings show that earnings management varied
significantly between sectors, being higher in the service sector than the industrial sector.
Based on the aforementioned mixed results, the association between earnings
management and board size is still considered to be a controversial issue (Ghosh et al,
2010).
4.6.1.2 Board Meeting and Earnings management
In the last three decades, the need for frequent board meetings has been disputed since it
involves high expenditure such as preparation fees, hotels expenses, and travel expenses,
which increase the firm’s expenses and decrease shareholders’ profit (Vafeas, 1999).
Accordingly, prior literature document that the frequency of board meetings has affected
earnings management in a positive and negative way. For example, Vafeas (1999) argue
that, if the number of board meetings exceeded the normal annual rate compared with
other years, then this would tend to lead to more earnings management which is a
negative effect. On the other hand, he states that if the number of board meetings
corresponded with corporate governance law and did not exceed the normal annual rate,
then there is less manipulation. This is a positive effect.
The effect of board meeting frequency may vary depending on two other factors. Firstly,
the existence of strong internal corporate governance mechanisms; secondly, the
existence of qualified board members in the main firms' activity. In other studies, Anglin,
Edelstein, Geo and Tsang (2013) and Xie, et al (2003) provide evidence that, in the
presence of strong corporate governance, earnings management is reduced when directors
hold more frequent board meetings.
In contrast, in firms with weaker corporate governance mechanisms researchers found
that more frequent board meetings are associated with more earnings managements,
particularly in firms that have been dominated by unqualified board of directors. In this
regard, Awais and Wang (2011) test the influence of board meeting frequency on
earnings management practices, by using 1009 listed firms on the Shanghai and

Chapter Four: The Role of Corporate Governance and Earnings Management
99
Shenzhen stock exchange during the period of 2002 to 2004. Their empirical results show
a significant positive association between board meeting and earnings management,
where they interpret that as the weakness of corporate governance in this regard.
4.6.1.3 Board Outsiders and Earnings management
Agency theory suggests that board independence would be increased by the presence of a
higher proportion of outside directors on the board (Abed et al, 2012). An extensive
number of studies have argued that firms whose boards are controlled by outsiders are
more likely to be in a better situation to monitor and control firms’ transactions and limit
managerial discretion (e.g. Bikki, and Tsui, 2009; Cornett, Marcus and Tehranian, 2008;
Beasley, 1996).
Dechow et al (1996) report that a higher percentage of board outside members is related
to a low level of earnings management and this in turn led to more financial reporting
credibility in the firms. In other studies, Craven and Wallace (2001) and Xie, et al (2003)
argue outside members on the board of directors created an independent controlling
mechanism over the board process, which mitigated earnings management practices.
Furthermore, Agrawal and Knoeber (1996), Beasley (1996), Peasnell, Pope and Young
(2005) and Bushman, Chen, Engel and Smith (2004) found a negative relationship
between earnings management and outside members on the board of directors. In a
contrary finding, Mather and Ramsay (2006) in their study of Australian firms, found the
existence of a high proportion of outsiders among board of directors members to be
positively related to unexpected accruals. The studies periods could be the potential
reason for the differences between these results.
Other studies found no significant relationship between board outsiders and earnings
management practices (e.g. Yang, Chun, and Ramadili, 2009; Osma et al, 2007; Klein,
2002; Klein, 1998). Two issues in relation to this findings were raised. Firstly, if firms
have higher proportion of institutional shareholders. Secondly, there may be no clear
guidance in Corporate Governance Code about electing outside directors, which may
result in the appointment of directors who are less effective in their roles.

Chapter Four: The Role of Corporate Governance and Earnings Management
100
On the other hand, large numbers of studies have examined the relation between earnings
management and the proportion of board insiders (corporate employees). Based on a
study with a sample of 500 large firms over 2003 and 2004, Sarkar, Sarkar and Sen
(2008) examine the influence of board insiders on opportunistic earnings management.
Their results indicate that the board insiders led to an increased level of earnings
management practices, particularly opportunistic earnings management.
In a study of 78 non-financial firms from Spain during the period of 1999–2001, Osma
and Noguer (2007) found that a higher proportion of insiders among board members is
more likely to lead to increased earnings management practices.
In contrast, Nugroho and Eko (2011) provide empirical results for Indonesian companies
showing no significant relationship between the number of board insiders and earnings
management practices. They attribute this to the nature of the Indonesian market; since it
is considered as one of emerging markets that still have weakness in their Corporate
Governance Code.
4.6.1.4 Board Independence and Earnings Management
Beasley (1996) explains that the ability of the board of directors to actively achieve and
control their responsibilities in firms was based on the separation of the board from
management. However, earlier studies have chosen to focus on the influence of the board
independence on the level of earnings management, and this is usually defined with
reference to the separation of the roles of CFOs and CEOs. Davidson, Goodwin-Stewart
and Kent (2005) examine a sample of 434 listed Australian firms in 2000 and study the
impact of the operation of the board of directors on earnings management. They found
that independent board members mitigated earnings management. However, Prencipe and
Bar-Yosef (2011) found that an independent board has little effect on earnings
management in family-controlled firms, particularly if the CEO is one of the members of
the board of directors, or is the chairman of the board. In addition, Chtourou Bedard and
Courteau (2001) are unable to find a relationship between board independence and
earnings management in their sample of US firms.

Chapter Four: The Role of Corporate Governance and Earnings Management
101
In addition, and in the context of the UK, Peasnell et al (2005) suggest that an
independent board of directors is more likely to be related to a decline in earnings
management. In another study, Jouber, et al (2012) use a sample of 180 firms from both
France and Canada between 2006 and 2008. They explore whether the strongest
corporate governance mechanism (e.g. board independence, institutional ownership)
could lead to a mitigation of earnings at management level. In the USA, Anglin, et al
(2013) found that an independent board led to a constrained level of earnings
management, using a sample of 153 real-estate investment trusts firms between 2004 and
2008.
The aforementioned studies have been expanded to study the influence of the
independent board on earnings management both before and after adopting IFRS. Callao
and Jarne (2010) found that earnings management increased after the adoption of IFRS in
Europe, where the discretionary accruals increased in the period following the
implementation. They refer this result to be arising from the difference between the local
(GAAP) and the international standards (IAS, IFRS), which then leads to the
manipulation. Marra, Mazzolab, and Prencipea (2011) found that the independent board,
after adopting the IFRS in Italy, has a negative impact on earnings management. Wang
and Campbell (2012) also found that the independent board impacted negatively on the
level of earnings management once China had adopted IFRS.
4.6.2 The Characteristics of Audit Committee and Earnings Management
The importance of this issue arises from the main objective of the audit committee, which
is to ensure the transparency and accuracy of the financial statements. The audit
committee is therefore one of the most important components in the corporate
governance system (Buchalter and Yokomoto, 2003; Beasley and Salterio, 2001; Abbott
and Parker, 2000).
In addition to overseeing the process of financial reporting in the firms, the audit
committee is also involved in meeting the financial managers and external auditors to go
over the audit process, the internal control process and the corporation’s financial
statements (Vafeas, 2005; Klein, 2002; Wild, 1996). The existence of full audit
committees (e.g. qualified, independent and expertise) leads to a strong internal corporate
Chapter Four: The Role of Corporate Governance and Earnings Management
102
governance structure, which in turn works to constrain the level of earnings management
(Davidson et al, 2005).
Audit committee structure has been found by prior studies to be related to earnings
quality, For example, Vafeas (2005) found that the characteristics of a strong audit
committee (e.g. a large audit committee, frequent meetings, a high level of audit
committee expertise and audit committee independence) led to an increase in earnings
quality, based on a sample of 252 listed firms in the New York stock exchange from 1994
to 2000.
A large number of studies were compiled and reviewed to further study the relationship
between audit committee characteristics and earnings management. For example, Lin and
Hwang (2010) compare the results of 48 studies in this area by conducting seventeen tests
(using the meta-analytic techniques) to examine the relationship between corporate
governance, audit quality and earnings. Their overview reveals mixed results such as a
significant relationship between strong corporate governance and audit quality, and a
positive relationship between audit committee share ownership and earnings
management. On the other hand, a negative relationship between audit committee
independence and earnings management were also found. In addition, Baxter and Cotter
(2009) argue that the audit committee structure and characteristics play a strong role in
the mitigation of earnings management and they found strong evidence that showed the
reduction of earnings management throughout firms with a good audit committee
structure.
4.6.2.1 Audit Committee Size and Earnings management
In the UK, audit committees should include two or three non-executive directors because
of their relevant experience and qualifications (Song and Windram, 2004). In the context
of Jordan, the Corporate Governance Code (2012) stipulates that the committee should
consist of at least three non-executive directors (Hamdan, et al, 2013). Accordingly,
several studies group audit committees' size into small, medium and large sizes based on
the number of audit committee members (e.g. Alkdai and Hanefah, 2012).

Chapter Four: The Role of Corporate Governance and Earnings Management
103
Prior literature that investigate the relationship between earnings management and audit
committee size found mixed results, and they relate this to the differences in corporate
governance mechanisms in each country since each country has different structures for its
corporate governance based on their legal system, culture and political issues. Saleh,
Iskandar and Rahmat (2007) and Abdul Rahman et al (2006) indicate in their studies that
the number of audit committee members is related positively with earnings management
level in Malaysian firms.
In the context of Jordan, Alhaddad et al (2011) found that earnings management is
affected positively by audit committee size. In contrast, Lin, Li and Yang (2006) found a
negative relationship between earnings management and the size of audit committee in
America. Finally, several studies such as Bedard, Chtourou and Couteau (2004) and Xie,
et al (2003) conducted based on USA and Baxter (2009)'s study, which based on
Australia, do not find any association between earnings management and audit committee
size. Based on the contradictory results from the above studies, we note that the country’s
economic classification (e.g. developed and developing countries) might affect the nature
of the relationship between audit committee size and level of earnings management.
4.6.2.2 Audit Committee Meetings and Earnings management
The frequency of audit committee meetings is important to the audit committee in
providing assistance to the management to resolve any conflicting issue. This could help
to improve the internal control mechanism within the firms (Jenny and Lois, 2007).
Abbott et al (2000) show that the firms with fully independent audit committees that met
two times yearly were less prone to financial reporting problems, such as waste,
embezzlement and misleading accounting, compared to the firms whose audit committee
are not independent.
Prior studies were conducted to explore the relationship between earnings management
and the number of audit committee meetings. As with audit committee size, the results
are mixed and vary across geographical areas, where the research was based upon. For
example positive relationships between the number of audit committees meeting and
earnings management was reported by Saleh et al, 2007 and Abdul Rahman et al, 2006
(Malaysia); and a negative relationship between the number of audit committees meeting

Chapter Four: The Role of Corporate Governance and Earnings Management
104
and earnings management was found by; Baxter, et al, 2009 (Australian); Bedard, et al,
2004 (US); Davidson, et al, 2005 (Australian); Xie, et al, 2003 (US). The differences
between these results are related to: (1) the existence of an active audit committee and is
associated with a reduced level of earnings management, and (2) the classification as
developed and developing economy could be another reason, whereas all studies that
were completed using data from developing countries indicate a positive relationship
while those using data from developed countries exhibit a negative relationship. Finally,
Thoopsamut and Jaikengkit (2009) found no relationship between numbers of audit
committee meetings and earnings management in Thailand.
4.6.2.3 Independence of Audit Committee and Earnings management
Prior research presents ample evidence on the relationship between earnings management
and audit committee composition. Klein (2002) predicts that an independent audit
committee will reduce earnings management since an audit committee is the best
mechanism to serve and oversee the financial accounting process. Accordingly, he finds
high abnormal accruals in the firms whose audit committees do not contain a majority of
independent members, and lower abnormal accruals where there is an independent audit
committee. In a similar vein, Saleh et al (2007) and Abbott et al (2000) found that the
association between earnings management and independent audit committees is negative.
Based on this result, they conclude that an independent audit committee is considered as
a strong mechanism in corporate governance as it reduces the manipulation of earnings
arising from opportunistic behavior by managers.
Paik and Selby (2011) also found that the firms with a majority of independent audit
committees were more likely to affect managers’ discretionary behaviour. In the context
of Singapore and Malaysia, Bradbury, Mak and Tan (2006) show that the independence
of audit committees led to higher accounting quality, measured by abnormal accruals
models that demonstrate increasing income earnings management. Earnings quality
assurance is one of the most important issues matters to shareholders as they would exert
more efforts (e.g. controlling and assessing the audit committee and board of directors
processes) to ensure the credibility of financial statements so as to achieve their
objectives. Dhaliwal, Naiker and Navissi (2010) found that the existence of an

Chapter Four: The Role of Corporate Governance and Earnings Management
105
independent audit committee where the members do not hold multiple directorships leads
to an increase in accruals quality. In the context of America, Lee, Mande and Ortman
(2004) show that the emergence of fully independent audit committees and boards of
directors has resulted in a reduction in the number of resignations of external auditors as
the reported financial performance of the firm became more reliable and credible.
4.6.2.4 Audit Committee Expertise and Earnings Management
Audit committee expertise is another important factor in the corporate governance
mechanism. The level of expertise in the audit committee could lead to an increase in
financial reports quality (Baxster and Cotter, 2009). This is in relation to audit committee
members holding the necessary qualifications, professional certificates, skills, and
experience in accounting and financial issues that would help improve the effectiveness
in the audit process and ensure the accuracy of financial reports (e.g. Hamdan, et al,
2013; Bedard, et al, 2004). Bedard et al (2004) found that the existence of at least one
audit committee member with a financial degree and financial background led to a
reduction in earnings management in the USA. In another study that is based on a
sample of 266 listed firms in China in the year 2004, Lo, Wong and Firth (2004) argue
that firms with a high level of audit committee expertise are likely to engage in less
earnings management, particularly, engaging in transfer pricing. Based on a sample of
300 firms listed in the Malaysian stock market, Puat and Susela (2013) presented
empirical evidence showing that the existence of “experts” in the audit committee
(whether the expertise was in accounting or another area relevant to the firm) was
significantly related to the magnitude of earnings management. Other studies such as
Abdul Rahman, et al (2006), who use data from Malaysia, and Lin, et al (2010), who use
from USA instead, however found no association between earnings management level
and audit committee members’ competence.
Finally, there are a few studies that have studied the effects of other audit committee
members’ personal characteristics (e.g. audit committee member age, and gender) on
earnings management practices. For example, Erhardt, Werbel and Shrader (2003)
investigate the association between audit committees’ gender and they found that
diversity on the audit committee influenced firms’ earnings positively. In a more recent

Chapter Four: The Role of Corporate Governance and Earnings Management
106
study, Qi and Tian (2012) provide evidence, showing that the older audit committees are
more likely to undertake audit work to detect earnings management than younger
committees; male dominated audit committees are also found to be less efficient than
female dominated audit committees; and audit committees with more experienced
members are found to be more effective in reducing the level of earnings management in
the firm.
4.6.3 External Auditors and Earnings Management
This section discusses the external audit function as another factor within the corporate
governance mechanism. External auditors play a big role in mitigating the earnings
management levels. Their influences have created much awareness following the
WorldCom and Enron scandals (Velury, 2005). Mariani, Tettamanzi and Corno (2010)
conducted a study using 157 annual reports of non-listed Italian companies over 2004 –
2005 and show that earnings management was involved when a firm was audited by one
of the big four auditors. The external audit process involves reassessing and monitoring
the internal control systems of the firm. This includes auditing financial statements to
reduce the level of mistakes or errors in these statements such as, material mis-statements
and changing accounting methods without fully disclosing them in the firm’s annual
report.
In prior literature, the researchers have identified several factors that could affect the
external auditor’s ability to increase or decrease earnings management such as, external
auditors’ reputation, external auditors’ tenure, industry specialist auditors, external
auditors’ opinion and changes in external auditors (Alghamidi, 2012; Habbash, 2010;
Piot and Janin, 2007; Mariani et al, 2010). In the context of Jordan, Alhayale and Lan
(2005) use questionnaire methods to explore the association between earnings
management and external auditors factors and they found external auditors’

Chapter Four: The Role of Corporate Governance and Earnings Management
107
characteristics affect the level of earnings management, particularly in firms where
managers are not behaving ethically. In another study, Alkhabash and Althuneibat (2008)
document that the external auditors are believed to have known that the management
significantly engaged in legitimate earnings management either (income decrease or
income increase). Figure (4.2) explains the association between earnings management
and external auditors’ factors.
Figure 4-2 the Relationship between External Audit Mechanism and Earnings
Management Level
Based on Figure (4.2), this research discussed the effect of external auditing mechanism
factors on earnings management as follows:
4.6.3.1 External Auditor Reputation and Earnings Management
Most of the prior literature assess the audit reputation by reference to whether the auditor
is one of the Big Four firms and assume that a large audit firm implies higher audit
quality, which in turn leads to an increase in financial reporting transparency and
credibility (e.g. Krishnamurthy, Zhou and Zhou, 2006; Beatty, 1989). In a recent study
about situation in Portugal, Alves (2013) provides evidence that the appointment of a Big
Four external audit firm and independent audit committees together have led to a
reduction in earnings management practices.
External Audit Reputation
External Audit Mechanism
External Auditor Tenure
External Auditor Opinion
External Auditor Change
Earnings Managem
ent

Chapter Four: The Role of Corporate Governance and Earnings Management
108
Krishnamurthy et al (2006) investigate the effect of external auditors on financial
reporting quality, using Arthur Andersen as a case study, and conclude that strong
external auditors, particularly the big-four firms, are playing a major role in mitigating
mistakes or errors in financial reporting, but they do not consider earnings management
directly.
In the last decade, several studies investigate how external auditors’ reputations (e.g. by
auditor type and auditor industry specialization) are constraining earnings management
practices in the firms (Kanagaretnama, Lim and Lobo, 2010). DeBoskey and Jiang (2012)
based their study in the US banking sector, and found that auditor industry specialization
reduced income smoothing. In a similar vein, Krishnan (2003) demonstrates that industry
specialist auditors decrease accruals-based earnings management more than non-
specialist auditors.
4.6.3.2 External Auditor Tenure and Earnings Management
Auditing standard setters suggest that the length of tenure of external auditors may affect
their independence. The longer the number of years of services provided by the external
the more likely they are to build strong personal relationships with their clients' (i.e., the
firms) management. This may lead them to be less watchful and develop the tendency to
conduct auditing in a mechanical rather than an analytical way (Piot et al, 2007). Davis,
Soo and Trompeter (2009) found a strong association between discretionary accruals and
short-term audit firm tenure, long-term audit firm tenure especially before the compliance
with Sarbanes-Oxley Act of 2002 (SOX). This relationship disappeared after complying
with (SOX). Based on a sample of 4720 firms in US over 2000 – 2001, Gul, Jaggi and
Krishnan (2007) found a positive association between non-audit fees and earnings
management in the firms that have short-term auditor tenure.
In another study, Myers, Myers and Omer (2003) argue that they expect longer audit
tenure to reduce earnings quality in US, but in fact, their empirical findings show the
opposite result where long term audit tenure leads to an increase in earnings quality, and
they relate this different result to the differences of environment and economic
circumstances such as, industry growth, auditor age, and industry type.

Chapter Four: The Role of Corporate Governance and Earnings Management
109
4.6.3.3 External Auditors Opinion and Earnings Management
Prior studies have investigated the association between earnings management and the
firms that are receiving a going-concern modified audit opinion. These studies present
mixed empirical results regarding the relationship. Omid (2015), for example, provides
evidence showing a positive relationship between qualified opinions and discretionary
accruals in Iran, which means that the higher the level of discretionary accruals, the
greater the possibility of receiving a qualified opinion. Consistent with this study result,
Similarly, Chen, Chen and Su (2001), who based on data from China and Bartov, et al
(2000) and Francis and Krishnan (1999), who both based on data from US, also found the
same result.
On the other hand, Herbohn and Ragunathan (2008) examine the association between
receiving a qualified audit opinion and earnings management in Australia, where their
results show a significant negative relationship between both of them. In the same year,
and based on a sample of Spain firms, Arnedo, Dallo and Alegria (2008) found also, a
negative relationship between qualified opinion and discretionary accruals. A few studies,
however, found no relationship between earnings management and audit opinions. For
example Butler, Leone, and Willenborg (2004) who based their data from the US.
Based on the mixed results in the aforementioned studies, most of these studies come to
the conclusion that there are two reasons behind these mixed results: (1) the nature of the
relationship between external auditor and firm management and the extent of their
independence, and (2) Variation in the extent of compliance in the application of
corporate governance policies in each country.
4.6.3.4 External Auditor Change and Earnings Management
The association between external auditor changes and earnings management has recently
become an important consideration for regulators and academic researchers (Alghamidi,
2012). For example, Chung, Firth and Kim (2005) and Gaver and Paterson (2001) argue
that changing to a large audit firm (now the big four but at the time of the study the big
six) is deemed to be an important factor in detecting managers’ earnings manipulations.
These studies findings supported their arguments, where they found that the firms audited
by big audit firms are related to less earnings management. Study by Hackenbrack and

Chapter Four: The Role of Corporate Governance and Earnings Management
110
Hogan (2002), which is based on a sample of 802 auditor changes over 1991 – 1997 in
the US, show that earnings quality is low in the firms that changed their external auditors
from the big four to non-big four companies in order to save auditing fees. They found
that the firms that used the big four external auditors are more likely to prevent managers'
opportunistic earnings management. However, existing literature on the relationship
between earnings management and external auditor change also suggests that the audit
fees are the main concern, rather than any consideration of earnings management, that
could lead firms to change their external auditors from the big four auditors to non-big
four auditors (e.g. Ettredge, Li and Scholz, 2007; Grothe and Weirich, 2007; Turner,
Williams and Weirich, 2005).
4.6.4 Ownership Structure and Earnings Management
Ownership structure is deemed to be another important factor that is likely to be related
to a range of accounting issues such as earnings quality, audit quality, audit fees, firm
performance and earnings management. A large number of studies have examined the
impact of ownership structure on earnings management. Hosseini and Abdoli (2012)
show that the type of corporate ownership, composition of board and family ownership
significantly could affect the level of earnings management. In addition, Alves (2012)
also attempts to examine the effect of ownership structures (e.g. managerial ownership,
ownership concentration and institutional ownership) in mitigating earnings management
levels in Portuguese firms. Their findings show mixed results. For example, they found a
negative relationship between managerial ownership, ownership concentration and
discretionary accruals, but no significant relationship between institutional ownership and
discretionary accruals.
Veprauskaite and Adams (2013) found that ownership concentration is negatively
associated with firms’ financial performance in the UK. In contrast, study by Yang and
Krishan (2005) which is based on a sample of 896 firm-year observations in the US
during the period of 1996 – 2000, documents that the ownership structures have a
significant effect on earnings management practices.
In the context of Jordan, Alfayoumi, Abuzayed, and Alexander (2010) examine the
influence of ownership structure (e.g. managerial ownership, institutions ownership and

Chapter Four: The Role of Corporate Governance and Earnings Management
111
block-holders ownership) on earnings management by using a sample of industrial listed
firms in the Amman Stock Market in the period 2001-2005. Their findings show that the
relationship between earnings management and managerial ownership is significantly
positive, and there is no relationship between the other two types of ownership structure
and earnings management.
Lopez and Jara (2007), using a sample of 185 Chilean industrial firms over 1991-2001,
find that the ownership concentration has a non-linear relationship with earnings
management. This result can be explained by the conflicts between large controlling
shareholders and minority shareholders’ interests. Some researchers suggest that,
contrary to Agency Theory, the conflict between shareholders and managers interests
could affect earnings management level less than the conflict between large and small
shareholders' interests (Fan and Wong, 2002; Bianco and Casavola, 1999).
Table (4.3) gives the details of the concentration of ownership in Jordanian industrial
firms, based on the information from Amman Stock Market, including the average
ownership concentration for eleven sectors.

Chapter Four: The Role of Corporate Governance and Earnings Management
112
Table 4-3 Ownership Concentration in Jordanian Industrial Firms (Shareholders owning 1% and more 2012/2013)1
Sector name Managerial Shareholders %
Institutional Shareholders Foreign %
Institutional Shareholders Local %
Individual Foreign %
Individual Local %
Family ownership %
Blockholder ownership2
State ownership %
Pharmaceutical and Medical Industries
58.0
10.0
14.0
12.0
36.1
32.0
50 3.0
Chemical Industries 37.4 2.2 26.3 4.6 45.0 29.2 89 0.5 Paper and Cardboard Industries
65.2
10.0
52.1
12.0
11.6
4.0
100 0.6
Printing and Packaging 82.0 40.0 49.7 - 3.1 - 100 - Food and Beverages 73.0 18.4 42.8 0.7 22.9 24.7 100 1.0 Tobacco and Cigarettes 59.0 1.00 64.0 4.0 15.0 - 100 - Mining and Extraction Industries
53.0
19.0
25.0
3.0
29.0
17.0
89 11.1
Engineering and Construction 42.1 14.6 35.7 5.6 22.5 11.1 100 2.0 Electrical Industries 47.8 23.3 24.4 1.9 20.3 12.4 100 3.00 Textiles, Leathers and Clothing 34.5 1.50 41.7 1.10 26.0 11.1
80 16.9
Glass and Ceramic Industries 18.0 - 23.2 3.9 21.0 9.0 100 - TOTAL (AVERAGE) 51.8 12.7 36.3 4.4 23.0 13.7 92 3.0
1 These categories are not mutually exclusive and therefore the rows in Table 4.3 do not add upto 100%, since individual and family ownerships are overlapping according to the Amman stock market bulletin (Amman stock market, 2015). This information has been provided by the Amman stock market. Jordan has a different system to divide ownership types, since institutional, individual, blockholders and family ownerships overlap with each other and this is the main reason that in Table 4.3 the figures do not add up to 100% for all types of ownership. For example, the Amman stock market considered family ownership as part of individual ownership whether local or foreign. Blockholders are also considered as part of the individual and institutional ownership. Furthermore, the Securities Depository Center (SDC) (2015) stated that ownership is registered under the name of the beneficial owner whether individual or judicial. 2 This variable was measured in our study by giving a dummy variable of value 1 if the firm has external stockholder ownership of 5% or more of the outstanding shares.

Chapter Three: Earnings Management Models
113
According to Table (4.3), ownership concentration in Jordanian industrial firms is classified
as: managerial ownership or insider ownership (51.8%), local institutional ownership
(36.26%). Foreign individual ownership and foreign institutional ownership with 4.44% and
12.73% respectively.
The empirical analysis in chapter five explores the relationship between earnings
management and the following categories of ownership: (1) family ownership, (2) individual
ownership, (3) state ownership, (4) managerial ownership (5) institutional ownership, and (6)
block-holder ownership. The following sections review the literature relating to each of these
ownership categories.
4.6.4.1 Family Ownership and Earnings Management
Previous literature indicates that family ownership is more concentrated in developing and
East Asian countries than in developed countries (e.g. Yang, 2010; Fan et al, 2002). Fan et al
(2002) in their study document that a higher level of family ownership has led to more
earnings management and constraints on the participation of minority shareholders. In
another study that includes a sample of firms from Standard and Poor’s (S&P) 500 index,
Wang (2006) shed light on the association between earnings quality and founding family
ownership, by using abnormal accruals models (following Dechow et al, 2002) to measure
earnings quality. Their empirical results show the higher levels of family ownership are
associated with lower abnormal accruals.
In another similar study, Yang (2010) found the tendency of chief executive officers (CEO)
in non-family firms to manage firms’ income was higher than a chief executive officer in
family firms, which means that family firms are less engaging in earnings management
compared to non-family firms to keep their reputation in the market. Cascino, Pugliese,
Mussolino, and Sansone (2010) use a sample of non-financial listed firms in Italy’s stock
market from1998-2004, argue that the quality of financial information in the family firms is
higher than non-family firms and their findings support their argument.
Several other studies have suggested that family-controlled firms have lower levels of
earnings management as they attempt to keep their reputations at the best level (e.g. Prencipe
et al, 2011; Jara and López, 2011; Block, 2010; Jaggi, Leung, and Gul, 2009; Siregar et al,
2008).

Chapter Three: Earnings Management Models
114
The literature as reviewed above shows that some academic researchers had found a positive
association between family ownership and earnings management level. They relate this result
to family owners' misunderstanding of other shareholders’ interests and assume the family
owners' interests are similar across the different shareholders, because they know their
business best. As for the academic researchers who found a negative relationship between
these two factors, they relate this to the fact that these firms operate strong corporate
governance systems in order to safeguard the reputation of the families.
Researchers also further examine the relationship between earnings management and family
ownership by extending the models to include the effect of several corporate governance
mechanisms. Jaggi and Leung (2007) in their study conducted based on Hong Kong's data in
1999-2000, found that family-controlled firms with an audit committee had low levels of
earnings management. Chen and Jaggi (2000) argue that in family firms the existence of
independent non-executive directors is positively related to a level of financial disclosure.
4.6.4.2 Individual Ownership and Earnings Management
Individual ownership is the ownership of shares by individual rather than by institutions,
which could include insurance company and banks. Family owners are considered a subset of
individual owners. Individual ownership has received little attention in the literature and this
may be because we find this type of ownership most often in developing countries such as,
Jordan and Indonesia (Denisa et al, 2003). Table 2.3 shows that individual ownership, both
foreign and locally based, constitute more than 25% of the ownership of firms in Jordan,
implying the significant importance to include them when analyzing earnings management
practices in the industrial sector.
Only a few prior studies have examined the effect of individual ownership on earnings
management (e.g. Alfayoumi et al, 2010; Siregar and Utama, 2008; Ali, Salleh and Hassan,
2008). Based on the sample of listed industrial firms in the Amman stock exchange over
2001 to 2005, Alfayoumi et al (2010) document that there is no significant relationship
between individual ownership and earnings management, where they measure this variable
by using the percent of shares held by the individual block-holders (excluding managers)
who own 5% or more of firm's equity share capital. Furthermore, Ali et al (2008) also present
similar findings to that of Alfayoumi et al (2010), showing that there is also no significant
relationship between earnings management and individual ownership in Malaysia.

Chapter Three: Earnings Management Models
115
Although the empirical results reported in the literature for individual ownership are not
strong, this factor is included in our analysis because there are theoretical reasons for its
inclusion and in our case the same arguments applied to this factor as to family ownership.
4.6.4.3 State Ownership and Earnings Management
State ownership has received a greater attention in academic research compared to other
types of ownership structures around the world. A large number of academic researchers have
analysed the role played by state ownership in corporate governance mechanisms and
earnings quality, (Wang and Yang, 2011; Shleifer et al, 1997).
Organisation for Economic Co-operation and Development (OECD) (2005) states that state
ownership is considered a major challenge for numerous countries’ economies. It is a
complex issue, especially concerning the relationship between state ownership
responsibilities and ownership functions (e.g. nominating board of directors and limit their
responsibilities in the same time). Furthermore, ensuring honest competition between private
sector and state-owned firms without government intervention by establishing new
regulations, taxes and policies to affect the private sector, is also another challenge.
Based on the Jones and modified Jones accrual models, Wang et al (2011) argue that state
ownership reduced earnings management levels in China. The authors suggest that the
protection of state-owned firms by the government might reduce managers’ discretion to
manage firm earnings. Ding, Zhang and Zhang (2007) found that firms with state ownership
are more likely to have earnings management than private firms that are family owned. In the
context of Jordan and other Arab countries, several studies have investigated the relationship
between state ownership and firms’ performance. These studies suggest that state-ownership
is negatively related to firms’ performance, which leads to a greater possibility for managers
to use their discretions to manage earnings (e.g. Alfaraih et al, 2012, (Kuwait); Omran,
Bolbol and Fatheldin, 2008, (Egypt, Jordan, Oman and Tunisia); Zeitun, 2009, (Jordan)).
Wang, Wong and Xie (2008) found that state-owned firms have limited responsibilities to
hire auditors. They explained that the structure of state ownership in China involves three
levels as follows: (1) provinces, (2) cities, or (3) counties. Jordan, as a developing country,
also has different levels of state ownership such as, ministries, state treasury, and Social

Chapter Three: Earnings Management Models
116
Security Department. The interactions among these different levels make the understanding
of the relationships in state ownership more complicated.
4.6.4.4 Managerial Ownership (Insider ownership) and Earnings Management
Prior literature on the influence of managerial ownership on earnings management does not
provide a consensus on whether the relationship is positive or negative (Ruan, Tian and Ma,
2011; Nahum and Hoang, 2008, Warfield, Wild and Wild, 1995). Warfield et al (1995) argue
that level of managerial ownership creates great incentives to manipulate accounting numbers
in order to achieve managers’ personal objectives. In the context of Japanese firms, Teshima
and Shuto (2008) develop a new model which suggests that a high proportion of managerial
ownership led to a decrease in earnings management.
Based on a large sample of Taiwanese listed firms during the period from 1997 – 2004, Yang,
Lai and Tan (2008) examine the relationship between director ownership, as proxy for
managerial ownership, and earnings management based on the modified Jones model,
through which they found a positive association between managerial ownership and
discretionary accruals. In another study based on data from Singapore, Yeo et al (2002)
found a positive association between managerial ownership and income-increasing
discretionary accruals.
In a similar vein, Sanchez-Ballesta and Garsa-Meca (2007) found that when company
insiders own a small percentage of shares, there is likely to be a lower level of earnings
management; and when they own a large percentage this tends to be related to a high level of
earnings management. Also, based on a study that includes 22 countries, Gopalan and
Jayaraman (2012) investigate the association between insider control in firms and earnings
management. They conclude that having a higher proportion of insiders among shareholders
led to more earnings management practices in these countries.
Finally, the main reason why these results lack consistency is the lack of a unified system of
corporate governance for all countries, and this may be because these country have different
legal systems. These countries may have each applying the civil law, the common law,
religion law or a combination of a few of them. Jordan is one of the countries that apply more
than one law (e.g. Sharia'a law, tribal system, and civil law). For example, under the tribal
system firm may be forced to employ the same individuals as owners and managers.

Chapter Three: Earnings Management Models
117
4.6.4.5 Institutional Ownership and Earnings Management
Institutional ownership has been linked in the prior literature to accounting characteristics
such as, corporate operating performance (e.g. Alfaraih, Alanezi1 and Almujamed, 2012;
Cornett, Marcus, Saunders, and Tehranian, 2007); research and development (R&D);
corporate investment performance (e.g. Fung and Tsai, 2012; Eng and Margaret, 2001;
Bushee, 1998); quality of reported earnings (e.g. Velury and Jenkins, 2006); and earnings
management (e.g. Koh, 2007; Koh, 2003; Chung et al, 2005). The reason for this is that
institutional investors have the power to control and monitor corporate managers and can
affect the board of directors’ decisions, which places institutional owners at the heart of the
firm’s corporate governance system(Ping and Wing, 2011, Rose, 2007).
Bushee (1998) and Velury, et al (2006) define institutional ownership as investors that hold
no less than $100 million from total firm equity. In our study institutional ownership is
defined in the same way as the Amman stock exchange definition, and relates to the type of
shareholder rather than the amount of investment. Level of institutional ownership plays a big
role in affecting earnings management; for example when institutional investors own a large
number of firms’ shares that could allow them to monitor the firm, this in turn might create
the incentive for the firm to manage their earnings upward, to meet the requirements of the
institutional investors (Koh, 2003).
The size of the effect of institutional investors on earnings management levels varies. Koh
(2003) found that, in the context of Australian firms, institutional investors are associated
with income increasing discretionary accruals in the short term, and but that long-term
institutional investors are associated with a reduction in aggressive earnings management.
Prior studies have also divided institutional ownership into foreign institutional ownership
and local institutional ownership and investigate the effect of each one of them on earnings
management practices. For example, Heard and Sherman (1987) found that local institutional
ownership led to more relationships between investors and managers which in turn led to
more engagement in earnings management in an attempt to achieve the objectives of the local
institutions. On the contrary, Ben-Nasr, Boubakri and Cosset (2012) propose a theory
different to Heard et al (1987), where they argue that local institutions could lead to increase
managers’ monitoring, which would lead to less risk of firms manipulating earnings.

Chapter Three: Earnings Management Models
118
Foreign institutional ownership is another important issue in general since it could lead a
country’s economy into two states: the first one is a positive state, where the foreign
investment leads to the economy booming through a decreasing unemployment rate. The
second is a negative state, which leads to reduction of the average stock return in capital
markets particularly in developing countries, and Jordan not isolated from this dilemma. Lel
(2013) used a samples from 75 countries over the period 1999-2012 to examine the effect of
foreign institutional ownership on earnings management and he found that foreign
institutional ownership is related to low earnings management levels.
4.6.4.6 Block-holders’ Ownership and Earnings Management
Block-holders’ ownership is defined as a large number of shares that are owned by investors,
and there are numerous distinct forms that these investors take. These include banks and
trusts, mutual funds, individual investors, and pension funds Zhong, Gribbin and Zheng
(2007) define outside blockholders “as those shareholders who own at least 5 percent of a
firm’s outstanding common stocks while they serve neither as the firms’ executive officers nor
on the board directors”. In these circumstances, there could be a small number of investors
who hold most of the firm shares, this means that there is the possibility of greater incentives
to manipulate earnings, to meet the interest of these investors. However, government
regulations tend to play a significant role to protect the interests of small investors, as big
investors that have more power by virtue of being large (Shleifer et al, 1997).
Jensen and Meckling (1976) is one of the earliest studies to examine the effect of the role of
block-holders in corporate governance, suggesting that monitoring by block-holders could be
a way to reduce agency costs. Zhong et al (2007) use 5,475 firm-year observations from the
New York Stock Exchange to examine two hypotheses: (1) outside block-holders have a
higher ability to monitor earnings incentives than small shareholders which leads to a
decrease in earnings manipulation, and (2) the higher investment return rate for block-holders
could lead them to put pressure on management to manage their earnings, particularly with
income-increasing techniques. Their empirical results show that the presence of block-
holders is positively related with a level of discretionary accruals, especially for firms that
faced declining pre-managed earnings. Regarding the second hypothesis, they found no
relationship between block-holders and income-increasing earnings management, particularly
in the firms that comply with GAAP.

Chapter Three: Earnings Management Models
119
Dechow et al (1996) found that a lower percentage of block-holders in firms is considered to
be a significant incentive for managers to engage in earnings manipulations in the US. In
another study based on data from Tunisia, Halioui and Jerbi (2012) suggest that the level of
discretionary accruals is affected by the presence of block-holders, and earnings management
is not affected by block-holders ownership.
The mixed results among the aforementioned studies may derive from variation in the
regulatory environments found in different countries. In the context of developed countries,
the government and equity market regulations generally do not allow high ownership
concentration by a limited numbers of shareholders (e.g. Black and Coffee, 1994, (United
Kingdom); Roe, 1994, (United States)). In contrast, the concentration of ownership in
developing countries is less restrictive. For example Alfayoumi, et al (2010) report that one
or two shareholders frequently could hold a high portion of firm shares in Jordan firms.
Isenmila, et al (2012) suggest that the existence of block-holders is more likely to lead the
firm's managers to manipulate earnings upward in Nigeria.
4.6.5 Chief Financial Officer (CFO), Chief Executive Officer (CEO) and Earnings
Management
Prior literature used the CFOs and CEOs incentives to explore the effect of CFOs/ CEOs
roles on earnings management. The Securities and Exchange Commission (SEC) (2002)
stipulate that the CEO's and CFOs in big public firms have to certify the financial statements
in the US. Caixing and David (2008) examine the impact of CEO/CFO qualifications on
earnings management. Their results show that firms with CFOs and CEOs with more
qualifications have lower earnings management levels. They found more income-increasing
earnings management than income-decreasing earnings management. In the same vein, Jiang,
Petroni and Wang (2010) provide empirical results, showing that the CFO and CEO equity
incentives could increase the chances of managing firm earnings.
Many authors suggest that the stock value incentive is one of the most important motivations
that leads the CFOs and CEOs to engage in earnings management. For example, Bergstresser
et al (2006) found that firms where their top management and CEO compensation related to
stock value are more likely to manage their earnings upward. Jouber et al (2010) found htat
CEOs based in Canada and France who owned stocks in their firms have a greater incentive
to manage their earnings upward. Furthermore, Fenga, Ge, Luo and Shevlin (2011) argue that

Chapter Three: Earnings Management Models
120
not only are the CFOs and CEOs engaged in managing firms’ earnings in order to achieve
their incentives (e.g. increase their stock value), they are helping each other at the same time.
For example, CFOs, who managed firm earnings, not only are they doing that for their
personal benefits, but also to achieve CEOs incentives since they are at the level that give
them the power to do so.
In a recent study conducted in the UK that include 468 firms listed on the London Stock
Exchange (LSE), Veprauskaite, et al (2013) found that CEOs' power, measured by proxies
such as CEO/chairman duality, CEO share ownership and CEO tenure, impacts negatively on
firms’ financial performance and this may create more need to use earnings management.
4.7 Summary
This chapter aims to provide a brief view of the background of Jordan, the culture of legal
systems, and the important regulations that are related to this research. In addition, this
chapter has reviewed the literature on the association between earnings management and
corporate governance mechanisms. A number of corporate governance issues are discussed,
namely, definitions of corporate governance, board of directors’ characteristics, audit
committee characteristics, chief financial officer (CFO), chief executive officer (CEO),
external auditors, and ownership structure. The chapter then discussed how the corporate
governance factors are believed to have an effect on earnings management levels.
The literature review has revealed relatively inconsistent findings about the relationship
between corporate governance and earnings management for developing and developed
countries. For example, the studies related to the number of board meetings to earnings
management in developed countries found that more board meetings tended to reduce
earnings management (e.g. Anglin et al, 2013; Xie, et al, 2003), whereas the opposite appears
to be true in developing countries (e.g. Awais and Wang, 2011). Furthermore, some of the
empirical results, such as Jouber et al (2010), found no association between board
characteristics and earnings management level.
Part of the explanation for this is that the corporate governance systems and the structure of
corporate entities varies from country to country since each country has its own
characteristics. For example, in Jordan, managerial ownership is the largest ownership
category (51.83% in Table 2.2), whereas family ownership is the most common ownership

Chapter Three: Earnings Management Models
121
type in Italy (Cascino et al, 2010). In another example, in Jordan, state ownership is the
smallest ownership category, whereas institutional ownership is the largest ownership type in
Kuwait (Alfaraih et al, 2012).
This chapter has discussed the literatures that investigate the relationship of internal control,
corporate governance mechanisms and earnings management around the world, which would
form a basis for comparison with regards to our empirical findings to be presented in chapter
5. The next chapter reviews the literature related to earnings management issues such as
earnings management motivations (e.g. opportunistic and beneficial earnings management
motivations) and earnings management models used in prior studies. We provide a critique of
the published earnings management models that will be used in this research and other
models that are considered important, and discuss earnings management in the context of
agency theory. This analysis helps us to choose appropriate earnings management models for
our empirical analysis in chapter five (empirical chapter).

Chapter Five: Research Methodology and Data Collection
122
5. Chapter Five: Research Methodology and Data Collection
5.1 Introduction
The previous chapter presents literatures about Jordan’s political history, economic history
and internal control practices. It also includes the legal system, the auditing profession and
corporate governance mechanisms. The understanding of issues underlying the literature is
helpful when interpreting empirical results from quantitative analysis and interviews in a
wider context. This chapter discusses the literature relating to earnings management models
and their development.
This chapter is organised as follows: Section 5.2 discusses the research methodology and
research paradigm. Section 5.3 analyses some important issues concerning mixed
methodologies in social science research. Section 5.4 explains the research methodology
adopted for our study. Section 5.5 details the hypotheses and research questions and identifies
ways to collect relevant empirical evidence. Section 5.6 explains the data collection methods,
including semi-structured interviews and secondary data (financial data). Section 5.7 reviews
the analytical procedures for the quantitative analysis of secondary data and the qualitative
empirical methods employed in the semi-structured interviews, and section 5.8 presents a
chapter summary.
5.2 Research Methodology and Research Paradigm
An important step in conducting social science research is to choose and justify a suitable
research paradigm to be used by the researcher, which in turn enables the researcher to
understand the phenomena that he/she is investigating and to determine the suitable research
tools. Easterby-Smith, Thorpe and Lowe (2002) present three arguments on the importance of
research philosophy: firstly, it assists the researcher in refining and identifying research
methods related to the researched phenomena. Secondly, knowledge of research philosophy
helps the researcher to evaluate the differences between research methodologies and methods
and hence avoid using unsuitable methods in the early stages. Thirdly, it allows the researcher
to gain new knowledge by adopting a new methodology of which he/she has no previous
experience.
To determine the appropriate research philosophy epistemological, ontological and
methodological assumptions were investigated. Epistemology has been defined as “…the

Chapter Five: Research Methodology and Data Collection
123
possible ways of gaining knowledge of social reality, whatever it is understood to be”
(Blaikie, 2000) (page 8). Consequently, and based on this definition, epistemological is
assumed to be the practical term for the theory of knowledge (Marsh and Stoker, 2002).
Research philosophy has two epistemological positions: namely, positivism and
interpretivism (Hussey and Hussey, 1997).
The two most popular epistemological paradigms in social research philosophy are (1) the
positivism paradigm, and (2) the interpretivism paradigm (Bryman 2008; Hussey and Hussey
1997), both of which are used extensively in accounting research. The positivism paradigm is
the approach that investigates studies with complex sets of facts and associations between
those facts (Smith 1998).
This paradigm is frequently associated with quantitative methods of analysis that examine the
relationships between measurable variables (Bryman 2008). The aim of such research is to
reveal patterns within quantitative data that can be used to produce general laws and to
predict future pattern of behaviour (Blaikie 2007). One of the biggest problems facing
researchers using these approaches is the extent to which their results can be generalised, in
other words, how to make the connection from the empirical world to the mental world.
The interpretive paradigm solves this problem in a different way, by attempting to directly
uncover the means by which this process of connection occurs. In their definition, Hughes
and Sharrock (1997) define interpretivism as a paradigm that researches the essential
differences between the natural (empirical) world and the social world.
Some of the criticisms levelled at the interpretivist paradigm are that the methods associated
with it (e.g. the interview method) are not generalisable; it cannot produce universal laws,
and that the research is strongly affected by the individual characteristics and backgrounds of
the researchers. Table (5.1) presents the differences between positivism and interpretivism.
Table 5-1 The Differences between the Positive and Interpretive Paradigms.
Characteristic Positivist View Interpretive View
Purpose The researcher will predict and explain changes from the forensic knowledge of participants
The researcher will interview the participants and recognise the value and depth of individual content
Research Methods Quantitative Qualitative

Chapter Five: Research Methodology and Data Collection
124
Characteristic Positivist View Interpretive View
Beliefs
• One truth exists • Must be objective
• Many truths and realities • Different people have different perceptions, needs and experiences
What Study Data is Based Upon
Measurable outcomes from measurable data
Descriptive, explanatory and contextual words from interview data
Study Sample
Clear and precise inclusion and exclusion of data
Representatives who are able to provide expertise from different points of view
Source: Kukn 1962.
After reviewing prior literature, this thesis has investigated two approaches: namely, the
deductive and inductive approaches. These two approaches are related to epistemological
paradigms (the positivist paradigm and the interpretivist paradigm), where the deductive
approach is related to the positivist paradigm and the inductive to the interpretivist. In other
words, deductive research relates to hypothesising relationships according to an existing
theory or a set of theories before testing these hypotheses by collecting and analysing data.
The inductive approach is applied when data is collected and analysed first, and a theory is
developed to rationalise the findings of the data analysis.
Ontology is defined as “…claims and assumptions that are made about the nature of social
reality, what exists, what it looks like, what units make it up and how these units interact with
each other. In short, ontological assumptions are concerned with what we believe constitutes
social reality” (Blaikie, 2000) (page 8). Flahive, Tanlar, Rahayu and Apduhan (2011) defined
ontology “…as the specification of conceptualization, used to help programs and humans
share knowledge” (page 618). Marsh and Stoker (2002) stated that understanding the nature
of the research politically, economically and socially will help the researcher to determine the
appropriate ontological position, whereas there are two contrasting ontological positions
which support the categorisation of the ontological viewpoints of researchers, namely,
subjectivism and objectivism (Burrell and Morgan, 1979).
This choice is informed by an understanding of the ontology of the discipline in question.
Consideration of ontological philosophies will affect the approaches researchers use to assess
their research, and how the research relates to real world phenomena (Blackburn, 1996). In
the context of an accounting study, Brown and Brignall (2007) discussed three ontological
worlds in connection with research approaches as categorised in prior studies such as, Popper

Chapter Five: Research Methodology and Data Collection
125
(1972), Sayer (1992) and Archer (2003), and these worlds are as follows: the physical world,
the mental world, and the intelligible world (the world of ideas). Many studies in accounting
are informed by this concept of a three-tiered reality, which can be found in philosophical
approaches such as Critical Realism (see for example Archer, Bhaskar, Collier, Lawson and
Norrie, 1998) or more recently in Pragmatic Constructivism (see for example Dewey, 2009)
and Actor Network Theory (see for example Latour, 2005). Within this kind of framework,
the difficulties of the middle tier, which translates and connects the physical (empirical
world) to the world of ideas (theories), are explored. What these approaches have in common
is a motivation to examine the tendencies and mechanisms through which the different
worlds are connected and to explore ways in which they can be made to talk to each other.
Research methodology is a core issue in research procedures. It allows researchers to
understand the problems to be examined in their research and choose the appropriate research
method. Research paradigm is also important to the understanding of the epistemology of a
particular field of study and for the researcher to understand the contribution to knowledge
made by his/her research. Research may be defined as: “a process of intellectual discovery,
which leads the researchers to understand the world around them by transforming the
knowledge (objects and subjects) that is produced from this world to proper information to
help the internal and external users of this information” (Ryan, Scapens and Theobald, 2002).
Burrell and Morgan (1979) conceptualised social science research as having two dimensions
(subjective and objective). The subjective dimension includes four paradigms: anti-
positivism, nominalism, voluntarism and the ideographic (qualitative) approach. The
objective dimension also includes four paradigms: positivism, realism, determinism and the
nomothetic (quantitative) approach. The nomothetic/ideographic approaches refer to different
ways of constructing knowledge and derive originally from Kant, who described the
nomothetic approach as a process of generalising empirical results to generate universal laws.
The ideographic approach focuses on the study of individual cases and events, for example
ethnographic studies, to generate an understanding of the processes and mechanisms in
operation. Saunders and Lewis (2003) argue that research philosophy can use a combination
of paradigms, such as positivism, interpretivism and realism, based on the nature of the
research and adapted by the researcher.
This PhD research adopted a dual-methodological approach to investigate the relationship
between corporate governance mechanisms and earnings management practices in Jordan,

Chapter Five: Research Methodology and Data Collection
126
which draws on both positive and interpretative paradigms. The research methods used are:
(1) Quantitative methods, including estimating earnings management values by using
accruals models, and using t-test and quadratic discriminant analysis to investigate the
relationship between corporate governance variables and earnings management; and (2)
Qualitative methods, including analysis of interviews, the main evdience for which was
obtained through conducting in-depth semi-structured interviews.
Ultimately, based on the aforementioned discussions, this PhD research constructed Figure
(5.1) below to explain the methodological processes that the researcher used in this present
research:
Figure 5-1 Methodology Processes
These research methods can both be classified as empirical methods of analysis although the
interpretation of the results for each varies according to the relevant paradigm and this creates
a philosophical problem about the extent to which the two sets of results could be combined
to form a coherent body of knowledge. For more explanation of the characteristics of
Research Methodology
Quantitative and Qualitative
Research Paradigms
Epistemology → positivism and anti- positivism (Interpretive)
Research Approaches
Deductive
Research Method
Earnings management models
Semi-structure interviews
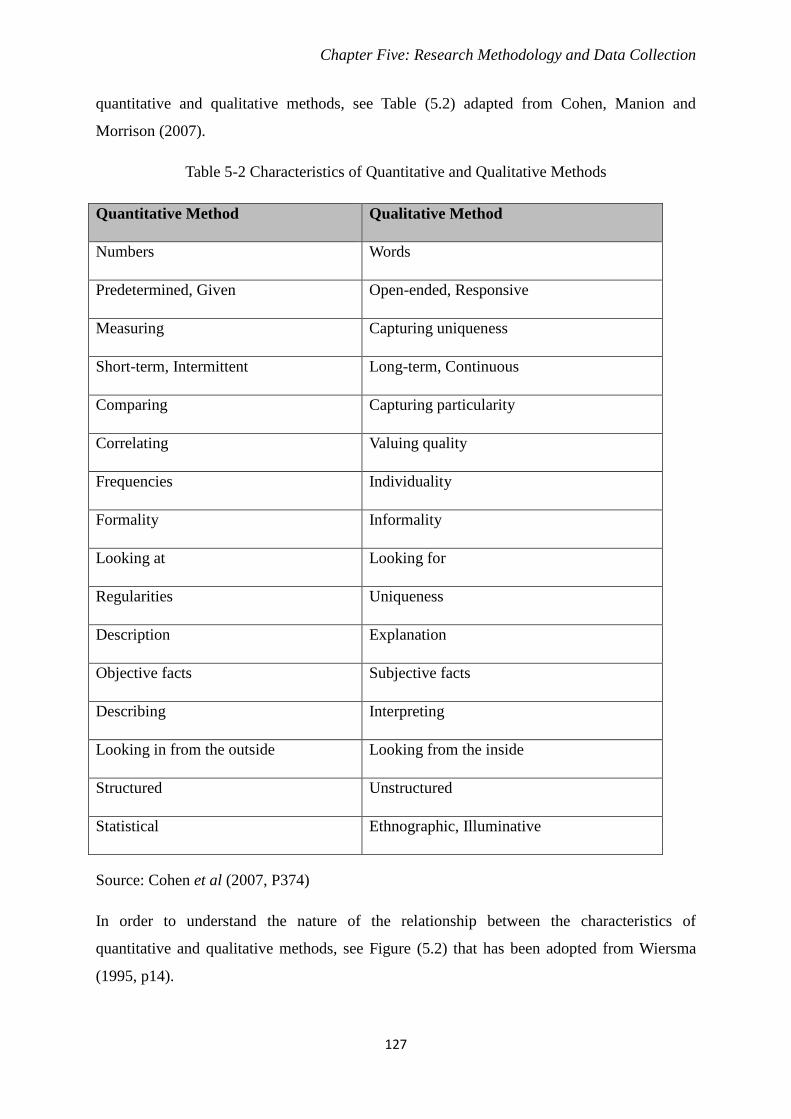
Chapter Five: Research Methodology and Data Collection
127
quantitative and qualitative methods, see Table (5.2) adapted from Cohen, Manion and
Morrison (2007).
Table 5-2 Characteristics of Quantitative and Qualitative Methods
Quantitative Method Qualitative Method
Numbers Words
Predetermined, Given Open-ended, Responsive
Measuring Capturing uniqueness
Short-term, Intermittent Long-term, Continuous
Comparing Capturing particularity
Correlating Valuing quality
Frequencies Individuality
Formality Informality
Looking at Looking for
Regularities Uniqueness
Description Explanation
Objective facts Subjective facts
Describing Interpreting
Looking in from the outside Looking from the inside
Structured Unstructured
Statistical Ethnographic, Illuminative
Source: Cohen et al (2007, P374)
In order to understand the nature of the relationship between the characteristics of
quantitative and qualitative methods, see Figure (5.2) that has been adopted from Wiersma
(1995, p14).

Chapter Five: Research Methodology and Data Collection
128
Figure 5-2 the Relationship between the Characteristics of Quantitative and Qualitative
Methods
,
Yin (2009) suggests two points that researchers have to consider to determine their research
methodologies, and these are: (1) the core of the research (i.e. what is the main aim of the
research), and (2) the type of “W” questions they want to use in their research. Table (5.3)
presents Yin’s suggestions for the researchers determining the method that is consistent with
their research question.
Table 5-3 Relevant Situations for Different Research Methods
Method Form of Research Question?
Requires Control of Behavioural Events?
Focuses on Contemporary Events?
Experiment How, why? Yes Yes
Survey Who, what, where, no yes how many, how much?
No Yes
Archival Analysis
Who, what, where, no yes how many, how much?
No Yes/No
NATURALISTIC SCIENTIFIC
QUALITATIVE QUANTITATIVE
QUANTITATIVE
Experiment Case study
Quasi‐experiment Ethnography
Historical Survey Interview
POSTPOSITIVISM
Critical Realism
EXPLANATORY
POSITIVIST/MECHANISTIC
Nomothetic
EXPLORATORY
INTERPRETIVE
Idiographic

Chapter Five: Research Methodology and Data Collection
129
History How, why? No No
Case Study How, why? No Yes
Source: Yin 2009.
The specific research questions developed for our study are shown in relation to these
different research methods.
Table (5.4) explains the association between research questions, objectives and methods.
Research questions
Objective Methods
Is there a relationship between corporate governance mechanisms and earnings management in Jordanian industrial firms?
Investigating the association between earnings management and corporate governance as an integrated system.
Main and Support: Database analysis
Do the independence and competence (education, training, professional experience, and professional qualifications) of internal and external auditors affect the relationship between corporate governance mechanisms and earnings management?
Identify the internal auditor’s characteristics and examining if these have an effect on the relationship between corporate governance and earnings management.
Main: Annual report and Interviews. Support: Database analysis
Do differences in corporate governance structures affect the degree of manipulation in earnings management in Jordanian industrial firms?
Examining the relationship between each corporate governance mechanisms and earnings management, then comparing their results with the results of the relationship between corporate governance mechanisms as an integrated system and earnings management.
Main: Annual report and Database analysis Support: Interviews.
What are the most effective elements of corporate governance in reducing earnings
Determining which corporate governance mechanisms is more effective in reducing earnings management.
Main: Annual report and Database analysis Support: Interviews.

Chapter Five: Research Methodology and Data Collection
130
Table 5-4 Links between Research Questions, Objectives and Methods
5.3 Paradigm Incommensurability
There have been extensive debates in prior social sciences research that indicate the difficulty
that might face researchers in choosing between the different paradigms, theories, concepts,
and approaches they could use to investigate their theoretical and practical problems.
The concept of a paradigm includes several others, such as theories, assumptions, methods,
instruments, and standards (Kuhn 1962). Kuhn (1970) explained a paradigm as follows “it
stands for the entire constellation of beliefs, values and techniques, and so on, shared by the
members of a community.” The determination of the concept of a paradigm is based on three
levels of organizational theory (Burrell et al 1979), and these are:
• The philosophical level, which is a basic belief about the world we are living in.
• The social level, where guidelines exist as to how a researcher should conduct their work.
management practices? What is the best model for detecting earnings management in Jordanian industrial firms?
Determining which model among accruals models (SJ, MJ, and PPY) is the best in detecting earnings management.
Main and Support: Annual report and Database analysis.
Research questions
Objective Methods
How do external cultural factors affect earnings management in Jordanian industrial firms?
Exploring the relationship between external cultural factors (e.g. revolutions in middle east, financial crisis in 2008, economics and politics circumstances) with earnings management.
Main and Support: Interviews.
How do the legal and taxation systems affect earnings management in Jordanian industrial firms?
Exploring the relationship between legal and taxation system with earnings management.
Main and Support: Interviews.
How does firms’ internal culture affect earnings management in Jordanian industrial firms?
Exploring the relationship between internal culture factors with earnings management.
Main and Support: Interviews.

Chapter Five: Research Methodology and Data Collection
131
• The methods used when conducting research, which are considered the technical level.
Kuhn (1962) argues that direct access to any of these world levels is prohibited without using
a specific paradigm. Also, he mentions that the use of different paradigms in the same
observation might lead to different meanings and results. Finally, his philosophy stated that
changes in science are not a linear progression. Bisman (2010) discusses some of these ideas
in the context of accounting research. “The paradigm debate in accounting was fuelled by
arguments over the nature of reality and empiricism, together with opposing views about the
means for discovering reality, and was exacerbated by unstated ontological, epistemological
and methodological assumptions” (page 6).
Paradigm incommensurability is a problem for social studies that use mixed methodology,
particularly when the research results contradict each other. Brown et al (2007) state that
paradigm incommensurability means that the findings of quantitative and qualitative methods
do not complement each other, since each of these methods has different purpose and
objective, which in turn lead to different kind of results. The proponents of paradigm
incommensurability have documented that a combination of the results of two methodologies
could lead researchers to misguide and mislead others, or produce an error in the unified body
of knowledge. Paradigm incommensurability implies that “there are no common points of
reference between existing individual paradigms as they each adhere to distinct ontological,
epistemological, and methodological assumptions about the social world and about what
constitutes science” (Clegg and Bailey, 2007). The paradigm incommensurability problem
lies in the differences and inconsistencies of paradigm meanings and references:
• Several studies, such as Frege (1892) and Hempel (1965), point out that the
meanings of words change based on their places in texts. For example, a "nail" in a
wooden board is different from a “nail” on a human hand, and a tribe’s "eye" is
different from a human "eye"; each of them has different meanings and can refer to
different things.
• On the other hand, several other studies, such as Putnam (1981) and Kripke
(1972), show some cases where the meanings and references of words are consistent
even when the places of these words in the texts are changed.
Early writers on paradigm incommensurability, such as Burrell and Morgan (1979), took a
strong view on paradigm incommensurability, stating that a synthesis or mix between

Chapter Five: Research Methodology and Data Collection
132
paradigms cannot be achieved; that they must be remain separate and develop independently.
Since then, however, other authors have taken a less black-and-white view. It has been
suggested that the use of different paradigms might be made possible and meaningful by
understanding others’ approaches or translating the languages and cultures of the scientists of
prior centuries to fit our contemporary research. Jackson and Carter (1991) investigate
whether the incommensurability of paradigm could be elucidated by the argument that each
paradigm has a separate language and may contribute to research fields significantly.
Therefore, in this case, paradigm incommensurability may not be an entirely negative
concept, but might instead help to establish the integrity of each paradigm, obviating the
necessity for justifications of different assumptions about the subject area and different
beliefs about human nature, which allow potential of divergent opinions to develop.
5.4 Research Methodology
In any framework of research procedure, the researchers should reveal their viewpoint, the
goals and methods of their research, how they collect and analyse the data and display the
results. Therefore, the researchers have to consider the procedures that they need to follow by
identifying the models that they decide to use, which in turn allows them to identify and
determine the path of the research. The idea of using two approaches, quantitative and
qualitative, is a controversial issue.
The previous arguments on paradigm incommensurability notwithstanding, we decided on a
mixed methodology study for this research, using both the qualitative method and the
quantitative methods, as we wished to investigate not only the relationships (between internal
control, corporate governance mechanisms and earnings management in Jordan), but all the
mechanisms through which these processes occurred and this relationship was created the
issues of paradigm incommensurability, the nature of the assumptions behind the use of
different methods and the approach to the use of theory were all reflected upon in the
analysis of our results and in the conclusions drawn from them.
Following an analysis of mixed methodology by Tashakkori and Teddlie (1998) a number of
researchers in accounting have chosen to use such an approach Brown and Brignall (2007)
justify their use of mixed methodology by proposing the use of Critical Realism as a
philosophical framework within which to bridge the gaps between paradigms. Having
Chapter Five: Research Methodology and Data Collection
133
considered these arguments, we constructed a research design to investigate the relationship
between corporate governance mechanisms and earnings management in Jordan, which has
four stages:
First stage
The researcher use three earnings management models: the Jones Model (Jones 1991); the
Modified Jones Model (Dechow et al, 1995), and the Margin Model (Peasnell et al, 2000) to
estimate earnings management values for Jordanian firms. These models used financial data
extracted from Jordanian industrial firms’ annual reports, which are available from
DATASTREAM, the Amman Stock Market (ASM), and Jordan Securities Commission
(JSC). Each of these models uses a different way to calculate the accruals, which are detailed
in chapter three.
Second stage
The researcher use published annual financial reports from the Amman Stock Exchange
website to collect information on internal control and corporate governance, such as: board of
directors’ characteristics (e.g. board size, board meetings, board independence, board
outsiders); audit committee characteristics (e.g. audit committee size, audit committee
meetings, audit committee independence and audit committee expertise); external audit
factors (e.g. external auditor reputation, external auditor tenure, external auditor opinion and
external auditor change), and ownership structure (e.g. managerial ownership, family
ownership, blockholder ownership, individual ownership, institutional ownership and state
ownership). These variables, as suggested by previous studies, examine the relationship
between internal control and corporate governance mechanisms and the earnings
management estimates from the accruals models, by using quantitative method.
Third stage
On the basis of the results from the quantitative analysis and knowledge of the firms’
positions on the Amman stock market, 12 firms were selected as the subjects for interviews.

Chapter Five: Research Methodology and Data Collection
134
These semi-structured interviews, conducted with general managers, financial managers and
internal auditors. To complete the qualitative analysis, the data from these interviews are
combined with the models of accruals, analysis of the firms’ published financial statements,
review of published Amman stock market information, reviews of corporate governance
statements in each firm, and reviews of internal documentation.
Fourth stage
At this stage, the researcher considers the extent to which the results of the quantitative and
qualitative analysis could be combined in order to produce a contribution to knowledge in the
area that reflected both different approaches and types of results. In general, when using dual
methodologies, thought needs to be given to which methodology is going to be allowed to
predominate. The two can be combined by: (1) applying the qualitative method before the
quantitative method to enable the researcher to develop and present a suitable conceptual
framework, hypothesis, or necessary tools for the quantitative study, or (2) applying the
qualitative method after the quantitative method to clear up any confusion in the quantitative
findings and to support an interpretation, which means that merging the results of the
quantitative and qualitative methods will provide a more exact overall picture of the research
problem (Srnka and Koeszegi, 2007).
Existing literature suggests three typical reasons for using mixed methods (Caracelli and
Greene 1997), and these are: (1) testing the agreement of findings obtained from different
measuring instruments, (2) clarifying and building on the results of one method with another
method, and (3) demonstrating how the results from one method can impact subsequent
methods or inferences drawn from the results.
Steckler, et al (1992) discuss how qualitative and quantitative methods can be integrated and
present the results. Their approach suggests that while the qualitative and quantitative
paradigms separately have some weaknesses, which can be attenuated by combining the two.
Furthermore, they indicate that the quantitative method produces accurate, consistent results
that are usually generalisable to a larger population. They also state that the qualitative

Chapter Five: Research Methodology and Data Collection
135
method generates rich, in-depth, suitable results that usually support the more complex issues
that the researchers cannot measure in numeric ways (i.e. using quantitative methods).
Accordingly, they provided four models, as shown in below Figure (5.2) that explain possible
integrated relationships between quantitative and qualitative methods.
Figure 5-3 Integrated Quantitative and Qualitative Method
Brown et al (2007) identify three ways in which the choices made during the process of
designing a dual-methodology research project can affect the way in which the results can be
combined. They suggest that the results could complement each other, challenge each other,
or talk past each other.
Model (1): Qualitative methods are used to help developing quantitative measures and instruments.
Model (2): Qualitative methods are used to help explain quantitative findings.
Model (3): Quantitative methods are used to establish a primarily qualitative study.
Model (4): Quantitative and Qualitative methods are used equally and parallel.
Source: Steckler et al (1992)
Qualitative Quantitative Result
Quantitative Result
Qualitative
Qualitative
Quantitative
Result
Qualitative Qualitative Result

Chapter Five: Research Methodology and Data Collection
136
5.4.1 Quantitative and Qualitative Methods Complementing Each Other
This section discusses the quantitative and qualitative methods as complementary
approaches. Several researchers in prior literature have argued that if quantitative and
qualitative analyses could be designed to complement each other, this will lead to producing a
unified body of knowledge, e.g. Brown et al (2007), and this in turn will lead to a better fit
and understanding between research objectives and their problems (e.g. Brown et al 2007;
Burgess 2002). Furthermore, Johnson, Onwuegbuzie and Turner (2007) state that different
methods can be based on different strategies and methods of collecting data, in ways that
reflect complementary strengths and non-overlapping weaknesses.
Cupchik (2001) suggests that the notion of a qualitative-quantitative sequence could be
replaced altogether by using a complementary approach. Often quantitative research yields
statistically significant results, but not a full explanation of the underlying relationship
powerful enough for the results to be generalised. Therefore, if the research is designed well
enough, qualitative research can provide a rich source of data, that can clarify the unclear
results produced by the quantitative methods and uncover the process by which the results are
produced. Therefore, if qualitative and quantitative methods are deemed to be
complementary, this means that the richness of information from both methods can enhance
the quality of research results, since the in-depth information from the qualitative method will
support the results of the quantitative method. Also, the large amounts of descriptive data
produced by qualitative research can shape the choice of variables in quantitative research
and provide a contextual explanation for the quantitative findings.
Existing studies have presented several advantages of using quantitative and qualitative
together as complementary approaches, and Philip (1998) summarises these advantages in
three points:
• The use of more than one method of gathering evidence helps to minimise the risk of
generating erroneous findings.
• Qualitative research may be carried out in order to establish research questions which
will subsequently be addressed by means of quantitative methods; or a quantitative
study may suggest questions suitable for further investigation by means of in-depth
qualitative methods.

Chapter Five: Research Methodology and Data Collection
137
• The combination of methods may allow a broader range of issues to be addressed
during the course of conducting a research project than would be possible if exclusive
use of either quantitative or qualitative methods had been made.
5.4.2 Quantitative and Qualitative Methods Challenging Each Other
Despite the existence of many similarities between qualitative and quantitative research
methods, there are some measures and procedures that are extremely different under these
two methods, due to both their natures and assumptions regarding the data and questions to
be answered, which can lead to a challenge between these methods’ results (Malterud 2001).
Johnson et al (2007) argue that the adoption of mixed methods is an unsuitable way to
present results, since the quantitative and qualitative methods study different aspect of the
phenomenon under investigation.
From a research point of view, prior studies have argued that a combination of the results of
quantitative and qualitative methods might lead the researchers into reaching the wrong
conclusions. In this regard, Brown and Brignall (2007) state that when quantitative and
qualitative results contradict each other: “the combination of the results of quantitative and
qualitative methods will be, at best, misguided and, at worst, misleading.”
5.4.3 Quantitative and Qualitative Methods “Talk Past Each Other”
In this context, “talk past each other” means that the researcher thinks that since each of the
two methods are studying the same subject, they will support each other, but in fact while
each of them produces results that are credible, they are so different in nature that they cannot
be combined in any reasonable way.
Barkin (2010) documents that there are two reasons which can lead to “talking past each
other”. The first reason concerns the nature of the paradigmatic debate, which results in
different researchers approaching their research with different mindsets and thus conducting
their studies in different ways. The second reason Barkin (2010) describes as “simple
terminological confusion, which results from different interpretations of important words,
caused partly because scholars redefine terms and different authors use them in different
ways.
In the context of a research in Anthropology Metge (1978) points out that “talking past each
other” is often based on the anthropological definition of culture, which is familiar to some
researchers but new or strange for others. Accordingly, “talking past each other” is one of the

Chapter Five: Research Methodology and Data Collection
138
challenges of mixed methodology research approaches, which derives from paradigm
incommensurability.
5.5 Hypothesis Development and Measurement of Variables
Chapter three discusses accrual based earnings management models developed in prior
literature, providing critiques for each of them, and explaining how each one of them
measures earnings management. Our own empirical research uses three of these earnings
management models, the Jones Model (Jones, 1991); the Modified Jones Model (Dechow et
al, 1995) and the Margin Model (Peasnell et al, 2000)
Observation of the distribution of the earnings management variables in our sample shows
that binary split is a poor description of the variable (see figure 5.3 below as an example).
Figure 5-4 Earnings Management Values Carve for Modified Jones Model
A significant proportion of the observations are clustered around zero value, indicating no (or
very low) earnings management. The left tail of the distribution shows a group of firms with
high negative earnings management and the right tail a group with high positive earnings
management. In fact, 25% of the observations were found in each tail, and 50% of them were
in the near-zero category.
Classifying a distribution like this as binary variable would not adequately capture the
information content of earnings management. Here, the opposite of positive earnings
management is not negative earnings management but zero earnings management. The
-4.00
-3.00
-2.00
-1.00
0.00
1.00
2.00
3.00
EM E
stim
ate
Axis Title
EM Estimates for the MJ Model

Chapter Five: Research Methodology and Data Collection
139
effects on accounting variables, of the high positive and high negative earnings management
firms would also tend to work in different directions making the relationships harder to
predict, less easy to measure and less suitable for parametric techniques. We therefore
classify the firms into three earnings management groups as follows:
Group (i): High positive earnings management (HI+veEM). This group includes 68
observations for the SJ sample, 68 for the MJ sample, and 136 for the PPY sample).
Group (ii): High negative earnings management (HI-veEM). This group includes 68
observations for the SJ sample, 67 for the MJ sample, and 134 for the PPY sample.
Group (iii): Low earnings management (Low EM). This group includes 95 observations for
the SJ sample, 95 for the MJ sample, and 190 for the PPY sample.
Several outlying observations are excluded from the SJ, MJ, and PPY samples as follows:
• For the SJ sample, we exclude one HI+veEM observation. This is found in one of the
chemical industries firms with standard prediction error value (15.34) for 2012, and
this firm has losses for 3 consecutive years respectively; resulting in it dropping to the
third market and ultimately becoming unlisted.
• For the MJ sample, we exclude two HI-veEM and three HI+veEM observations.
These observations are found in several industries (1 paper and cardboard, 1 mining, 2
chemical and 1 food) between 2007 and 2012.
The two chemical firms are both in the second market and have standard prediction
error values; 6.9 for 2012 and 4.72 for 2009, which are unusual for their sizes but no
company-specific explanation is able to support this.
The paper and cardboard firms have a standard prediction error value of – 5.2 for
2008 and the food firm had a standard prediction error value – 3.3 for 2007 reported
both of these large losses comparing with years before.
Finally, the mining firm has a standard prediction error value 5.13 for 2008 and can be
explained by the unusual nature of the industry, which is a duopoly with a high level
of government involvement.

Chapter Five: Research Methodology and Data Collection
140
• For the PPY sample, we exclude six HI-veEM and six HI+veEM observations. These
observations are found in several industries (5 mining, 2 electrical, 1 tobacco, 2
pharmaceutical and 2 foods).
Considering these negative values, we exclude 6 observations. This includes two
mining firms with 3 observations, one pharmaceutical firm with 1 observation, one
Tobacco firm with 1 observation and one electrical firm with 1 observation. The
reasons for excluding these observations are:
• Decreasing firm sales which would play an important role in the PPY model
that could result from the financial crisis for the mining firms that have
estimated values 4.35 and 4.03 for 2009 and 2010 respectively.
• Changing board of directors is likely to be the reason for the second mining
firm unusual estimate (-7.1 for 2010), and for the pharmaceutical firm
observation with value -3.8 for 2012.
• The Tobacco firm and electrical firm also report losses and examination of
their accounts show high level of several type of expenses such as, provision
for doubtful debts and loss from outside branch in 2010. This creates the
potential for downward manipulation of profits sometimes known as firms
talking a big bath, which would explain the high negative EM measure.
As for positive values, we exclude 6 observations and they are two mining firms, one food
firm, one pharmaceutical firm and one electrical firm. As for the mining firms, the unusual
nature of the mining industry was mentioned earlier. No specific events were identified for
the other observations.
We now consider each of the corporate governance and internal control variables in turn and
explain the methods used to measure them. The analysis consists of five groups of variables:
(1) board of directors’ characteristics; (2) audit committee characteristics; (3) external audit;
(4) internal control components, and (5) control variables. We extract these variables for
seven years (2005-2012).
5.5.1 Board of Directors’ Characteristics
This group contains the variables, board size, board meetings, board outsiders and board
independence:

Chapter Five: Research Methodology and Data Collection
141
Most studies measure board size (BSIZE) by using the total number of board members as
presented in the annual report at the end of each financial year (e.g. Alves 2011; Jouber et al
2010; Xie et al 2003; Yermack 1996). From an agency theory perspective, the larger board
size is an indicator for reducing agency problems (e.g. Alves, 2011; Ghosh et al 2010; and
Ahmed et al, 2006), and a larger number of educated and experienced directors means the
board can do more monitoring and assessing management actions.
Larger boards would lead to mitigating the CFO’s domination of the board which results in
fewer opportunities to use discretion and more protection of shareholders’ interests (Raheja,
2005). Several existing studies state that larger boards are related with high reporting quality,
such as, Xie, et al (2003); Klein, (2002). On the other hand, larger board size could lead to
obstacles in independent directors performing their monitoring duties because of bureaucracy
and more potential for conflicting interests and views (Habbash, 2010).
Overall, the existing literature reveals that larger boards are related with less earnings
management (e.g. Ghosh et al 2010; Habbash, 2010; Ahmed et al 2006). According to Watts
and Zimmerman’s (1986) political costs hypothesis, they state that larger firms are likely to
have larger boards and these firms will be more politically visible. We expect board size to be
negatively related to earnings management.
The board of directors has to attend a specified number of meetings per year (BMEETING)
as stipulated by the Corporate Governance Code in each country (Ronen and Yaari 2008). A
higher frequency of board meetings would benefit shareholders, since it implies that the
board would have opportunities to be more responsive and to monitor and control the firm
more effectively (Vefeas, 1999). Lipton and Lorsch (1992) and Conger, Finegold and Lawler
(1998) assume that frequency of board meeting is related with high board effectiveness. The
regular board meeting gives directors the opportunity to address important issues and
problems that could arise in the firms (Rohaida, 2011).
Existing literature provides mixed empirical results (i.e. identifying positive, negative or no
significant relationship) regarding board meetings and earnings management, but most
studies found that more board meetings tend to mitigate earnings management (e.g. Anglin et
al 2013; Xie et al 2003).
Our research measures this variable by the frequency of board meetings per annum following
most existing literatures such as Anglin et al (2013), and Vafeas (1999).

Chapter Five: Research Methodology and Data Collection
142
Consistent with the agency theory, several studies hypothesise that the existence of outsiders
(BOUTSIDE) (non-executives)1 in the board is more likely to improve the quality of
information and decisions, which could enhance firm performance (e.g. Bikki et al 2009;
Zahra and Pearce, 1989). Fama (1980) states that the existence of a high portion of insiders in
the board is related to more issue with personal-monitoring, which could lead to weaker
monitoring of the firm performance.
The presence of the outside directors could lead to better monitoring in the firm than the
inside directors (Byrd et al 1992). Several studies have examined the relationship between
board outsiders and earnings management, and most of their results indicate that outsiders are
more likely to mitigate earnings management in the firm (e.g. Bikki et al 2009; Cornett et al
2008; Mather et al 2006; Beasley 1996; Dechow et al 1996). Most of these studies measured
the outsiders variable as a proportion of the total number of board members.
From the perspective of agency theory, Abdul Rahman and Ali (2006) assume that for
effective governance, the CEO and the chair of the board have to be independent, which
means that no-one can hold both positions at the same time. Abdul Rahman and Ali (2006)
also state that the CEO with more power could easily engage in earnings management to
achieve personal incentives. The Jordanian Corporate Governance Code (2012) stipulates that
no duality should exist between the roles of CEO and board chairman in the firm. The
separation between CEO and board chairman (BINDEPEND) is likely to lead to a decrease in
the chance for both of them to engage in earnings management. In this regard, existing
literature shows that the separation of the roles of CEO and board chairman is negatively
related to earnings management level (e.g. Wang et al 2012; Marraa et al 2011; Jouber et al
2010; and Peasnell et al 2000. Based on prior findings and agency theory, our research
hypothesises a negative relationship between board independence and earnings management.
We propose the following hypotheses based on board directors’ characteristics according to
the aforementioned discussions:
H1: There is a negative relationship between board size and earnings management level in
Jordanian industrial firms.
1 Prior literature has defined board outsiders (non-executives) as the employees who are not occupied in any position in the firm (e.g. Brickley et al 1994; Byrd et al 1992).
Chapter Five: Research Methodology and Data Collection
143
H2: There is a negative relationship between number of board meetings and earnings
management level in Jordanian industrial firms.
H3: There is a negative relationship between a high portion of board outsiders and earnings
management level in Jordanian industrial firms.
H4: There is a negative relationship between board independence and earnings management
level in Jordanian industrial firms.
5.5.2 Audit Committee Characteristics
Jordan’s Corporate Governance Code (2012) stipulates that the main aim of audit committees
is to review the effectiveness of internal auditing, and make recommendations on the
selection, appointment, reappointment and removal of the head of the internal audit
department. Following this line of enquiries, this research uses audit committees’
characteristics as instruments to measure the effect of corporate governance factors in
constraining earnings management. This group contains the following variables, audit
committee size, audit committee meetings, audit committee independence, and audit
committee expertise:
Existing literature reveals that to be effective, the audit committee has to be large enough to
include a range of members that have professional education and experience, and that this
committee must allocate sufficient resources to deal with the complicated accounting and
financial issues that could face them (Xie et al 2003 and Braiotta, 2000). Yermack (1996) and
Bedard et al (2004) hypothesize that a larger audit committee is more likely to identify and
avoid possible problems that could occur during the financial reporting process, where the
monitoring of the financial reporting process is considered the main responsibility of this
committee.
Habbash (2010) also states that smaller audit committees which include one or two members
may be weak, since the management could exploit the small size of this committee to put
more pressure on it to gain its support, particularly to help them in dispute with external
auditor. Jordan’s Corporate Governance Code (2012) specifies that each firm has to have an
audit committee with a minimum of three non-executive members, and indicates that the
bigger the audit committee, without the inclusion of executive members, the more likely
increase in the committee’s performance. Consistent with previous studies, our study

Chapter Five: Research Methodology and Data Collection
144
measured audit committee size (ACSIZE) as the number of audit committee members
reported in the firm’s annual financial reports.
The effect of audit committee size on earnings management is a debatable issue, since prior
literature has presented mixed results. For example, some have found a positive relationship
(e.g. Alhaddad et al 2011, et al 2007 and Abdul Rahman et al 2006), while others have found
to have either a negative relationship (e.g. Lin et al 2006) or no relationship (e.g. Bedard et al
2004, Xie et al 2003, and Baxter 2009). To be consistent with existing literature, our study
hypothesises that a larger size of audit committee is associated with less earnings
management.
The main aim of establishing an audit committee is to keep regular communication between
this committee and internal and external auditors, to evaluate audit processes, financial
reporting processes, and the internal control system (Rohaida, 2011; Habbash, 2010). Klein
(2002) also states that more frequent audit committee meetings held yearly is considered an
indicator for an active audit committee, which will act to identify and correct and potential
problems.
The variable ACMEETING is measured by using the number of meetings that the audit
committee attends each year. Several studies have found a negative relationship between
earnings management and the frequency of audit committee meetings (e.g. Thoopsamut et al
2009; Baxter et al 2009; Davidson et al 2005; Abbott et al 2004; Bedard et al 2004; and Xie
et al 2003). Consequently, our study hypothesises that the relationship between earnings
management and audit committee meetings is negative.
Audit committee independence (ACINDEPEND) is another issue that affects monitoring
processes in the firms. Vicknair Hickman and Cames (1993) argue that the audit committee
should be independent from management in order to achieve effective monitoring, as this
separation is more likely to lead the internal and external auditors to be less pressurised by
the firm executives. Consistent with this argument, Bradbury (2006) documents that high
earnings quality is related with the existence of audit committee independence in the firms.
Therefore, our study hypothesises that the existence of strong, independent audit committees
can mitigate earnings management in the firms. This approach is in line with most of the
prior literature findings, which found a negative relationship between audit committee
independence and earnings management such as, Puat et al (2013), Bedard et al (2004), and
Abdul Rahman and Ali (2006).

Chapter Five: Research Methodology and Data Collection
145
Experience in the accounting and finance field is important for audit committee members,
where responsibility is to ensure the integrity of financial reports. This experience enhances
audit committee members’ knowledge, which enables them to understand and identify all the
potential issues that could affect the firms’ performance (Rohaida, 2011). Independent audit
committee members that have a background in corporate finance are likely to be more aware
of potential problems that could arise from different forms of earnings managements (Xie, et
al 2003).
The financial expert is defined as someone who holds necessary qualifications, professional
certificates, skills, and experience in the accounting and finance fields (The Jordanian
Corporate Governance Code, 2012). The existence of financial experts on the audit
committee is more likely to be related to high quality in the financial reports (Abbott, Parker
and Peters, 2004). Several studies have found that audit committee expertise is negatively
related to earnings management (e.g. Puat et al, 2013; Hamdan et al, 2013; and Bedard et al,
2004). Our study measures this variable (ACEXPERTISE) by using a dummy variable, which
takes the value of 1 if all audit committee members are qualified (holding an undergraduate
degree in accounting or finance) and at least one of them has an accounting professional
qualification (as specified in the corporate governance code for Jordan), and 0 otherwise. We
hypothesise that the existence of audit committee expertise is related negatively with earnings
management.
According to the forgoing discussion, the following hypotheses in relation to audit committee
characteristics are formulated:
H5: There is a negative relationship between audit committee size and earnings management
level in Jordanian industrial firms.
H6: There is a negative relationship between the number of audit committee meetings and
earnings management level in Jordanian industrial firms.
H7: There is a negative relationship between audit committee independence and earnings
management level in Jordanian industrial firms.
H8: There is a negative relationship between the level of audit committee expertise and
earnings management level in Jordanian industrial firms.

Chapter Five: Research Methodology and Data Collection
146
5.5.3 External Auditor Factors
Agency theory describes how the relationship between the agent (manager) and principal
(owner) results in agency problems associated with the measurement of performance and its
relation with agent incentives. Watts and Zimmerman (1983) state that an audit by someone
that does not have a relationship with the manager is more likely to reduce the potential for
incentive related problems that arise when the manager does not get sufficient compensation
from the firm. Jensen and Meckling (1976) posit that the external audit is considered one of
the most important tools for monitoring activities that increase the value of the firm.
The Institute of Chartered Accountants in England and Wales (2005) states “if, as simple
agency theory implies, principals do not trust agents to provide them with reliable and
relevant information, then they will hire in external experts, who are independent of these
agents. This, however, introduces the concept of auditors as agents of principals, which leads
to new concerns about trust, threats to objectivity and independence” (page 10). Accordingly,
numerous measures are available to evaluate the quality of external audit. Therefore, this
section discusses four external auditor factors; external auditor reputation (EXAREPUT),
external auditor tenure (EXATENURE), external auditor opinion (EXAOPIN), and external
auditor change (EXACHANGE).
DeAngelo (1981) argues that the auditor reputation is deemed a better proxy to detect and
identify any error or misstatement in the firm’s financial statements, since the big 5 audit
firms (now the big 4) have several common characteristics (e.g. they have higher expertise,
higher independence) that enable them to protect the shareholders from any error or
misstatement. Kanagaretnam, Lim and Lobo (2010) and Alves (2013) document that higher
audit quality is found in big 4 firms. Existing literature measures external auditor reputation
with reference to whether the external audit firm is a big firm or not (DeAgelo, 1981; Alves,
2013; Kanagaretnam (2006).
External audit tenure is measured by considering the period that the partner engages with the
client firm (see Gul et al 2007; Myers et al 2003). In our study we give a dummy variable
(EXATENURE) the value of 1 if the partner stays more than 4 years and 0 otherwise, based
on the terms of the Jordanian Corporate Governance Code. The characteristics of the external
audit opinion are measured by using a dummy variable with a value of 1 for firms that had
received going-concern modified opinion, and 0 otherwise, since this factor is a particular
issue in Jordan (Butler et al 2004; Chen et al 2001; Bartov et al 2000). Finally, prior literature

Chapter Five: Research Methodology and Data Collection
147
measures external audit change by considering the length of the period that the audit firm
engages with the client firm (e.g. Bukit et al, 2009; Hackenbrack et al, 2002; Gaver et al,
2001) and in our study we give a dummy variable the value of 1 if the external audit firm
stays for more than one year, and zero otherwise, based on the terms of the Jordanian
Corporate Governance Code.
Most existing literature reveals mixed results for the relationship between external audit
factors and earning management. However, most of the studies indicate that the external audit
quality factors result in less earnings management and pressures on the firm such as modified
audit opinions and long tenure result in more earnings management. The hypotheses below
are consistent with these ideas and the tenets of Agency Theory:
H9: There is a negative relationship between the external auditor’s reputation and earnings
management level in Jordanian industrial firms.
H10: There is a positive relationship between the tenure of the external auditor and earnings
management level in Jordanian industrial firms.
H11: There is a positive relationship between the issuing of modified audit opinions and
earnings management level in Jordanian industrial firms.
H12: There is a negative relationship between the external audit firm staying for more than
one year and earnings management level in Jordanian industrial firms.
5.5.4 Ownership Structure
From the perspective of agency theory, Jensen and Meckling (1976) state that higher
ownership concentration could reduce agency problems, by mitigating agency costs by
reducing the imbalance between principals’ (owners) interests and agents’ (managers)
interests. In this section, we include six types of ownership structure, which are not mutually
exclusive; family ownership, individual ownership, state ownership, managerial ownership,
institutional ownership, and block-holder ownership.
Pornuptham (2006) suggests agency theory as an appropriate model in developing countries
to help explain the agency problem in firms that have high concentration of family
ownership. Schulze, Lubatkin, Dino and Buchholtz (2001) conclude that, by application of
Jensen's and Meckling's model of 1976, that there are three reasons for family ownership to
reduce agency costs, and these are “[f]irst, owner management should reduce agency costs

Chapter Five: Research Methodology and Data Collection
148
because it naturally aligns the owner-managers' interests about growth opportunities and
risk … Second, private ownership should reduce agency costs because property rights are
largely restricted to internal decision agents …Finally, family management should further
reduce agency costs because shares tend to be held by agents “(pages 99-100). Several prior
studies presented an argument about individual ownership that is similar to the argument
about family ownership (Lunati, 1997; Bergstrom, 1995). Most preceding studies of the
relationship between individual ownership, family ownership and earnings management
found that a higher proportion of these ownerships is related with less earnings management
(e.g. Prencipe et al 2011; Jara and López 2011; Block 2010; Yang 2010; Jaggi et al 2009; Fan
et al 2002; Heard et al 1987). These studies measure these types of ownership as follows;
family ownership (FAMOWN) by using the percentage of total shares owned by family
investors; local individual ownership (INDOWNL) by using the percentage of total shares
owned by local investors; and foreign individual ownership (INDOWNF) by using
percentage of total shares owned by foreign investors. In our study we expect a negative
relationship between both of these types of ownership and earnings management.
Several researchers have noted that if the state were to own a large portion in the firm, then
this motivates the government to increase its monitoring of managers, which mitigates the
agency costs and increases firms’ profitability (Ding et al 2007; Shleifer et al 1997; Bos,
1991). Dominating state ownership in a firm is seen as encouraging the managers to mitigate
their personal incentives and use accounting choices to develop the firm’s performance
(Aljifri and Moustafa, 2007). From the perspective of transaction cost theory, Pan, Teng,
Supapol, Lu, Huang and Wang (2014) suggest that state ownership could affect firms’
performance through the following devices: (1) firms dominated by government ownership
have better access to resources compared with firms that have other ownership types. (2)
Firms with a higher portion of government ownership are more likely to receive more support
from the government. Thus, our research measures this variable by using the percentage of
total shares owned by the Jordanian government, and assumed that the relationship between
earnings management and state ownership is negative.
To align interests with shareholders' interests, Agency theory suggests that the way to
mitigate agency costs is to adjust managers’ incentives (Jensen and Meckling, 1976). This
leads them to argue that a higher portion of managerial ownership makes managers less likely
to modify firm earnings in the short term. Economic theory identifies two conflicting points
that might lead to managerial ownership affecting managers' incentives in firms, and these are

Chapter Five: Research Methodology and Data Collection
149
the incentive alignment effect1, and the management entrenchment effect2 (Teshima et al
2008). However, Jensen (1994) suggests that the "self-control" problem created by desirable
incentives can cause owners to take actions which "harm themselves as well as those around
them" (page 43).
Accordingly, managerial ownership is not a straight-forward issue. Despite the hypothesised
negative relationship, most studies provide empirical results that indicate a positive
relationship between earnings management and managerial ownership in line with the ideas
of Jensen (e.g. Alfayoumi et al 2010; Yang et al 2008; Sanchez-Ballesta et al 2007; Yeo et al
2002). Most of these studies measure ownership (MANOWN) by using the cumulative
percentage of total shares owned by the directors of the firm and this measure is also adopted
in our study. In line with agency theory, we hypothesise that a higher portion of managerial
ownership is likely to be related with less earnings management, although we note that
published empirical results tend to contradict this.
Crutchley, Jensen, Jahera and Raymond (1999) state that institutional ownership is likely
related to mitigate agency costs via increased monitoring of the firms. Carleton, Nelson, and
Weisbach (1998) and Black et al (1994) argue that the higher portion of institutional
ownership increases the possibilities for monitoring and the effectiveness of owners in
controlling the firms, which means that this type of ownership is deemed to be an important
controlling mechanism to monitor managers’ behaviour in detail. A few existing studies have
discussed the effect of institutional ownership, whether foreign (IOWNFOR) or local
(IOWNLOC), on earnings management. These studies found the proportion of institutional
ownership to be negatively related with level of earnings management. Consistent with most
of the prior literature, our research measures this type of ownership as a percentage of total
shares in issue. We hypothesise that greater institutional ownership is related to less earnings
management.
In accordance with agency theory, Jensen and Meckling (1976) suggested that when a firm
has block ownership, the blockholders’ monitoring can considered to an active device to
mitigate agency costs. Holderness (2003) documents that there are two factors motivating
blockholders to increase their monitoring of the firms’ managers, the benefit of increasing
stock returns and the private benefit of control. Thus, a larger proportion of blockholders in 1 The effect that could arise by making alignment between owners and managers incentives. 2 The effect that could occur when the greater ownership would provide managers with deeper entrenchment and, therefore, greater scope for opportunistic behaviour.

Chapter Five: Research Methodology and Data Collection
150
the firm ownership structure means that they can exercise their strong voting power to
decrease managers’ incentives. (Persons, 2006).
Furthermore, several studies also state that blockholders have more motivations to control
managers’ activities in the firms than small external shareholders (e.g. Shleifer et al 1997;
Dechow et al 1996; Jensen et al 1976), and they argue that a high proportion of blockholder
ownership is more likely to decrease earnings management practices. Based on this literature,
we measure blockholders’ ownership (BLOCKOWN) by giving a dummy variable the value
of 1 if the firm has external stockholder ownership of 5% or more of the outstanding shares.
We hypothesise a negative relationship between high blockholder ownership and earnings
management in our study. Hence, following hypotheses were presumed with respect to
ownership structure:
H13: There is a negative relationship between high proportions of family ownership and
earnings management level in Jordanian industrial firms.
H14: There is a positive relationship between high proportions of foreign individual
ownership and earnings management level in Jordanian industrial firms.
H15: There is a positive relationship between high proportions of local individual ownership
and earnings management level in Jordanian industrial firms.
H16: There is a negative relationship between a high proportion of state (government)
ownership and earnings management level in Jordanian industrial firms.
H17: There is a negative relationship between a high proportion of managerial ownership
and earnings management level in Jordanian industrial firms.
H18: There is a negative relationship between high proportions of foreign institutional
ownership and earnings management level in Jordanian industrial firms.
H19: There is a negative relationship between high proportions of local institutional
ownership and earnings management level in Jordanian industrial firms.
H20: There is a negative relationship between blockholder ownership of 5% or more and
earnings management level in Jordanian industrial firms.

Chapter Five: Research Methodology and Data Collection
151
5.5.5 Measuring Control Variables
Existing literature argues that measuring the relationship between earnings management and
corporate governance factors without control variables (e.g. firm performance, firm size and
whether a firm has subsidiaries) are more likely to lead to heteroscedasticity and mis-
specification problems in the earnings management models (e.g. Habbash, Lijuan, Salama
and Dixon, 2014; Jaggi et al, 2009; Kothari , Lcone and Wasley, 2005).
Accordingly, this research uses four control variables in addition to the independent variables
that have been discussed in the previous sections. Several studies have documented that
control variables, such as firm leverage, cash flow from operating activities, firm subsidiaries
and firm performance are important in ensuring that the tests concentrate more precisely on
the differences created by variations in corporate governance measures (e.g. Habbash et al
2014, Alghamdi 2012; Rohaida 2011; Dechow et al 1995). Our research uses four control
variables to proxy for firm performance, cash flow, leverage and whether a firm has
subsidiaries.
Firm Performance (ROA):
In common with prior studies, we use Return on assets (ROA) as proxy for firm performance.
ROA is calculated using the following formula:
𝐏𝐏𝐃𝐃𝐭𝐭𝐑𝐑𝐆𝐆𝐢𝐢 𝐆𝐆𝐢𝐢 𝐃𝐃𝐛𝐛𝐛𝐛𝐃𝐃𝐭𝐭𝐛𝐛 (𝐏𝐏𝐂𝐂𝐃𝐃) =𝐍𝐍𝐃𝐃𝐭𝐭 𝐍𝐍𝐢𝐢𝐜𝐜𝐆𝐆𝐈𝐈𝐃𝐃
𝐏𝐏𝐆𝐆𝐭𝐭𝐛𝐛𝐓𝐓 𝐃𝐃𝐛𝐛𝐛𝐛𝐃𝐃𝐭𝐭𝐛𝐛 𝐛𝐛𝐭𝐭 𝐘𝐘𝐃𝐃𝐛𝐛𝐆𝐆 𝐍𝐍𝐢𝐢𝐄𝐄
Cash Flow from Operating Activities (CFOA):
Numerous studies reveal that high cash flow from operating activities (CFOA) is likely to be
associated with managers to engage in earnings management (e.g. Graham et al, 2005;
Dechow et al 1995). CFOA is calculated based on, for examples, Alghamdi 2012; Rohaida
2011; Habbash 2010) as follows:
(𝐖𝐖𝐂𝐂𝐂𝐂𝐃𝐃) =𝐖𝐖𝐛𝐛𝐛𝐛𝐂𝐂 𝐂𝐂𝐓𝐓𝐆𝐆𝐅𝐅 𝐃𝐃𝐆𝐆𝐆𝐆𝐈𝐈 𝐂𝐂𝐎𝐎𝐃𝐃𝐆𝐆𝐛𝐛𝐭𝐭𝐢𝐢𝐢𝐢𝐎𝐎 𝐃𝐃𝐜𝐜𝐭𝐭𝐢𝐢𝐑𝐑𝐢𝐢𝐭𝐭𝐢𝐢𝐃𝐃𝐛𝐛
𝐏𝐏𝐆𝐆𝐭𝐭𝐛𝐛𝐓𝐓 𝐃𝐃𝐛𝐛𝐛𝐛𝐃𝐃𝐭𝐭 𝐛𝐛𝐭𝐭 𝐘𝐘𝐃𝐃𝐛𝐛𝐆𝐆 𝐂𝐂𝐃𝐃𝐎𝐎𝐢𝐢𝐢𝐢𝐢𝐢𝐢𝐢𝐢𝐢𝐎𝐎
Financial Leverage (FLVE):
FLVE is measured by dividing long-term debt by total assets at the beginning of the year.
𝐂𝐂𝐢𝐢𝐢𝐢𝐛𝐛𝐢𝐢𝐜𝐜𝐢𝐢𝐛𝐛𝐓𝐓 𝐋𝐋𝐃𝐃𝐑𝐑𝐃𝐃𝐆𝐆𝐛𝐛𝐎𝐎𝐃𝐃 =𝐋𝐋𝐆𝐆𝐢𝐢𝐎𝐎 𝐏𝐏𝐃𝐃𝐆𝐆𝐈𝐈 𝐃𝐃𝐃𝐃𝐛𝐛𝐭𝐭 𝐛𝐛𝐭𝐭
𝐏𝐏𝐆𝐆𝐭𝐭𝐛𝐛𝐓𝐓 𝐃𝐃𝐛𝐛𝐛𝐛𝐃𝐃𝐭𝐭 𝐛𝐛𝐭𝐭 𝐘𝐘𝐃𝐃𝐛𝐛𝐆𝐆 𝐂𝐂𝐃𝐃𝐎𝐎𝐢𝐢𝐢𝐢𝐢𝐢𝐢𝐢𝐢𝐢𝐎𝐎

Chapter Five: Research Methodology and Data Collection
152
Firm Subsidiary (FSUB):
Some existing studies document that firms with subsidiaries in countries that have weak
regulations and corporate governance are more likely to engage in earnings management than
those with subsidiaries in countries that have strong regulations and corporate governance
(Tang and Tikoo 1999; Dyreng, Hanlon and Maydew 2012). Accordingly, we expect that the
firms in our study with subsidiaries have a greater incentive to engage in earnings
management, since most of their subsidiary firms exist in developing countries with weak
regulations and corporate governance (e.g. Sudan, Libya, and Algeria). This variable is
measured by a dummy variable, which we give the value of one if the firm had subsidiary
firms in countries with weak regulations and corporate governance. Finally, firm size,
whether small or large, was not found to be related to earnings management level in the prior
literature particularly in developing countries; Jordan is not isolated from these countries,
where Abed et al., (2012) and Alfayoumi et al., (2010) documented that the firm size as
control variable does not have an effect on earnings management level in Jordanian firms
since all Jordanian firms in Jordan are considered to be small in size compared to the size of
firms in other countries whether developing or developed. Accordingly, this thesis omitted
this variable. The industry variable is also omitted from the control variables as this thesis
focuses on one industry sector (industrial sectors). Much of the prior literature used the
industry variable as a control variable when it includes industrial, financial and services
sectors in their studies (Abed et al., 2012). Table (5.5) lists the research variables used in this
PhD study.
Table 5-5 Summary of Research Variables and Their Measurements
Variable Label Definition and Measurement Dependent Variables Accruals Standard Jones Model
ACCSJ This variable was measured by using standard prediction errors from the standard Jones Model
Accruals Modified Jones Model
ACCMJ This variable was measured by using standard prediction errors from the modified Jones Model
Working Capital Accruals WAPPY This variable was measured by using standard prediction errors from the Margin Model
Independent variables Board Of Directors Characteristics Board of Directors Size BSIZE The number of board members that are in the annual
report at the end of each year. Number of Board of Directors Meetings
BMEETING The number of annual meetings the board holds per annum
Board of Directors Outsiders BOUTSIDE The number of non-executives on the board divided by total number of board members

Chapter Five: Research Methodology and Data Collection
153
Board of Directors Independence
BINDEPEND A dummy variable given value of 1 if CEO and Chairman of Board positions were conducted by the same person, 0 otherwise.
Audit Committee Characteristics Audit Committee Size ACSIZE The number of members on the committee Number of Audit Committee Meetings
ACMEETING The number of meetings the committee holds per annum.
Audit Committee Independence
ACINDEPEND A dummy variable given the value 1 if the committee totally comprises non-executive members, 0 otherwise1.
Variable Label Definition and Measurement Audit Committee Expertise ACEXPERTIE A dummy variable given the value 1 if all audit committee
members were qualified and at least one of them has an accounting professional certificate (based on the corporate governance code for Jordan), 0 otherwise.
External Auditors Factors External Auditor Reputation EXAREPUT A dummy variable given the value 1 if the firm is uses a big-
four auditor, 0 otherwise. External Audit Tenure2 EXATENURE3 A dummy variable given the value 1 if audit partner has been
engaged by the client firm for more than 4 years, and 0 otherwise.
External Audit Opinion4 EXAOPIN5 A dummy variable given the value 0 if firm receives a going-concern modified opinion, and 1 otherwise.
External Audit Change EXACHANG6 A dummy variable given the value 1 if firm has changed external auditor before one year, and 0 otherwise.
Ownership Structure Variables Managerial Shareholders MANOWN The percentage of total shares owned by the directors of the
firm. Foreign Institutional ownership
IOWNFOR The percentage of total shares owned by foreign institutions.
local Institutional ownership IOWNLOC The percentage of total shares owned by local institutions. Foreign Individual ownership INDOWNF The percentage of total shares owned by foreign investors. Local Individual ownership INDOWNL The percentage of total shares owned by local investors. Family Ownership FAMOWN The cumulative percentage of total shares owned by family. Blockholders Ownership7 BLOCKOWN A dummy variable given the value 1 if the firm has external
1 The measure of non-executive members on the audit committee is proxied by a dummy variable rather than as proportion similar to the measure of non-executive in the board, because the total number of audit committee members is often very small. 2 Peter Carey and Roger Simnett, Audit Partner Tenure and Audit Quality (The Accounting Review, May 2006). 3 A according to the external auditors (firm and partner) the Jordan corporate governance code (2012) stipulated in section (4) that “The external auditor shall exercise his duties for one year renewable… and the renewal for the partner at the external auditor may not be for more than four consecutive years, and the re-election may not take place before a minimum of two years”. 4 In our opinion, the financial statements referred to above present fairly, in all material respects, the financial position of the firm as of December 31st, and the results of its operations and cash flows for the years then ended, in conformity with accounting principles generally accepted and IFRS. 5 The going concern principle states that if an auditor issues an unmodified audit report then they believe that the firm will continue to exist and operate in its current form for at least the next 12 months. If this is not the case, for example if the firm is about to be closed down, then the auditor issues an audit report with a going concern modification. 6 See not (2) above. 7 Dechow et al 1996.

Chapter Five: Research Methodology and Data Collection
154
stockholder ownership of 5% or more of the outstanding shares.
State Ownership STATOWN The percentage of total shares owned by the Jordanian government
Control Variables Firm Subsidiary
FSUB A dummy variable given the value 1 if the firm had a subsidiary and 0 otherwise.
Financial Leverage FLVE Long-term debt divided by total assets at year-end. Firm Performance ROA Net income divided by total assets at the beginning of a year
(return on assets) Cash Flow from Operating Activities
CFOA Cash flow from operating activities divided by total assets at the beginning of a year.
5.6 DATA Collection
We gather the data for this research from two sources: (1) the financial data and internal
control and corporate governance variables are obtained from the annual financial reports of
Jordanian industrial firms listed on the Amman Stock Market during the period 2005-2012.
(2) Semi-structured interviews are constructed to obtain internal control and corporate
governance-related from 12 Jordanian industrial firms (the selection of which is detailed
earlier).
5.6.1 Earnings Management Models Sample
According to the Amman Stock Market, the industrial sector consists of 11 types. These 11
types of industries have a total of 73 firms, which represent the total sample used in this PhD
study:
• Pharmaceutical and Medical Industries, which include 6 firms.
• Chemical Industries, which include 10 firms.
• Paper and Cardboard Industries, which include 3 firms.
• Printing and Packaging Industries, which include 2 firms.
• Food and Beverages Industries, which include 11 firms.
• Tobacco and Cigarettes Industries, which include 2 firms.
• Mining and Extraction Industries, which include 17 firms.
• Engineering and Construction Industries, which include 9 firms.
• Electrical Industries, which include 5 firms.
• Textiles, Leathers and Clothing Industries, which include 6 firms.

Chapter Five: Research Methodology and Data Collection
155
• Class and Ceramic Industries, which include two firms.
There are several values missing from DATASTREAM and the Amman Stock Market
regarding our models variables. In relation to the margin model, 17 firms are excluded from
the total sample, for three reasons which are: (1) the firms have missing values for several
variables from 2005 to 2012; (2) the firms started trading on the stock market after 2005, and
(3) the firms use the fiscal financial year instead of the financial calendar year (i.e. the year
did not start by 01/01/XX). The reason for excluding firms established after 2005 (rather than
2006 since our study pertains to the period of 2006 to 2012) is that there are several variables
which we would need the previous year’s data to calculate the 2006 value for, such as change
in account receivable and change in account payable. Therefore, only 56 firms are used in the
final sample. Table (5.6) presents the breakdown of the firms into industry type. We also list
down the number of firms that are omitted and the final numbers of firms used in the
research.
Table 5-6 Breakdown of firms used in the Sample Margin Model (PPY Model)
Descriptions
Pharmaceutical and
Medical Industries
Chem
ical Industries
Paper and Cardboard
Industries
Printing and Packaging
Food and Beverages
Tobacco and Cigarettes
Mining and E
xtraction Industries
Engineering and C
onstruction
Electrical Industries
Textiles, Leathers and
Clothing
Glass and C
eramic
Industries
Total
Total numbers of firms
6 10 3 2 11 2 17 9 5 6 2 73
Missing data for 2012 and 2005
0 1 0 0 1 0 3 1 1 1 1 9
Firms started after 2005
0 0 0 0 1 0 5 1 1 0 0 8
Total number of firms omitted from sample
0 (1) 0 0 (2) 0 (8) (2) (2) (1) (1) (17)
Total firms included in the sample
6 9 3 2 9 2 9 7 3 5 1 56

Chapter Five: Research Methodology and Data Collection
156
Furthermore, because of missing gross (PPE) values for some firms on DATASTREAM and
the Amman Stock Market, 17 firms are excluded from the sample for the SJ and MJ models;
this means that the final sample is 39 firms for both of them. See Table (5.7).
Table 5-7 Breakdown of firms used in the Sample Jones and Modified Jones Models
Descriptions
Pharmaceutical and
Medical Industries
Chem
ical Industries
Paper and Cardboard
Industries
Printing and Packaging
Food and Beverages
Tobacco and Cigarettes
Mining and E
xtraction Industries
Engineering and C
onstruction
Electrical Industries
Textiles, Leathers and
Clothing
Glass and C
eramic
Industries
Total
Total numbers of firms
6 9 3 2 9 2 9 7 3 5 1 56
Firms with missing data for (Gross PPE) during 2006 to 2012
1 3 1 1 3 1 3 3 0 1 0 17
Total number of firms omitted from sample
(1) (3) (1) (1) (3) (1) (3) (3) 0 (1) 0 (17)
Total firms included in the sample
5 6 2 1 6 1 6 4 3 4 1 39
Table (5.8) provides information about the industries of the firms included in each model
sample.
Table 5-8 Industry Distribution of firms used in all models
Industry Type SJ Model MJ Model PPY Model Pharmaceutical and Medical Industries 5 5 6 Chemical Industries 6 6 9 Paper and Cardboard Industries 2 2 3 Printing and Packaging 1 1 2 Food and Beverages 6 6 9 Tobacco and Cigarettes 1 1 2 Mining and Extraction Industries 6 6 9 Engineering and Construction 4 4 7 Electrical Industries 3 3 3 Textiles, Leathers and Clothing 4 4 5 Glass and Ceramic Industries 1 1 1 Total 39 39 56

Chapter Five: Research Methodology and Data Collection
157
5.6.2 Semi-structured Interview Sample
The semi-structured interview was conducted with a sample of 16 managers from a total of
12 firms (i.e. general managers, financial managers and internal audit managers). They were
selected based on three factors: (1) the empirical results from the accrual models, (2)
movements in the firm’s Amman stock market classification (i.e. first, second and third
markets) and (3) the preliminary results from pilot interviews conducted with one firm. We
evaluated the results from the pilot interview and refine the interview questions since it is a
long established large firm whose financial manager has many years of experience. Based on
the standardised prediction error results for each group according to earnings management
models (SJ, MJ and PPY), firms were chosen to represent the categories of earnings
management (high positive earnings management, low earnings management and high
negative earnings management) and also to represent firms that had moved between the
different stock markets as this have previously been identified as a factor associated with
earnings management. The firms for interviews analysis are selected based on the followings:
• Two firms that have high positive earnings management values in all three accruals models.
• Two firms that have high negative earnings management values in all three accruals models.
• Two firms that have low positive earnings management values (close to zero) in all three accruals models.
• Two firms that have low negative earnings management values (close to zero) in all three accruals models.
• One firm that has recently moved from the first market to second market.
• One firm that has recently moved from second market to first market.
• One firm that has always been in the first market.
• A sample of one firm that moved down from the first market to the second market after the application of IFRS.
5.7 Analytical Procedures
This section discusses the process the researcher undergoes to analyse the data.
5.7.1 The Processes of Secondary Data Analysis (Quantitative Methods)
At this stage, we analyse the secondary data by using T-Tests (comparing means) and
discriminant analysis rather than OLS and GLS regressions based on several reasons: (1) the
Chapter Five: Research Methodology and Data Collection
158
analysis of the covariance matrices show no clear relationship between our variables, when
the earnings management (dependent) variable was treated as continuous rather than
categorical (2) the existence of multicollinearity and heteroskedasticity problems among the
variables (see appendix 4), (3) the lack of statistical significance in the GLS results (see
appendix 4), and (4) the fact that our sample size is small for this kind of technique (see
Tables 5.7 and 5.8).
5.7.1.1 T-Test (Comparing Means)
Here, we use the t-tests (comparing means) to investigate the relationship between our
dependent and explanatory variables. We made the comparisons between the variables based
on the three categories of earnings management we observed (high negative EM, low EM and
high positive EM). Since we found a significant proportion of the EM observations are
clustered around zero value which implies low earnings management, a group the firms
display high positive earnings management, and a group of the firms display high negative
earnings management (see appendix 3). In fact, 25% of the observations were found in each
of the high EM categories, and 50% of them were in the near-zero category. T-tests were
conducted for each of the corporate governance variables to test whether the means for each
variable were significantly different for the group of firms belonging to each EM category.
5.7.1.2 Quadratic Discriminant Analysis (Multivariate Analyses)
Since the OLS/GLS regressions were poorly specified and yielded weak results, in this
section, we used quadratic discriminant analysis to predict which of the three EM categories
each firm belonged to, on the basis of their corporate governance characteristics. This
technique is computationally equivalent to regression analysis (Bramhandkar, 2011) to
predict the relationship between corporate governance mechanisms and earnings management
level in our sample firms. Linear discriminant analysis (LDA) and quadratic discriminant
analysis (QDA) are the main two types that are available in discriminant analysis (Smith,
1947). This research used the QDA type since the relationships are not linear and this is also
one of the main reasons for the misspecification of the regression models (see section 6.5.2).
The quadratic discriminant analysis was used in different ways to analyse the research
variables: first, we analysed all the variables together based on the three categories of EM (to
Chapter Five: Research Methodology and Data Collection
159
High +ve EM, Low EM, and High –ve EM)1 and the three different accruals models (Jones,
Modified Jones and PPY); second, based on the first results, we found that the Modified
Jones EM estimates produced more significant QDA results, therefore used the MJ earnings
estimates to separately analyse corporate governance factors (board characteristics, audit
committee characteristics, external audit and ownership structure) in order to discover which
corporate governance factors were the best in identifying high positive, low or high-negative
earnings management.
Finally, the sample size of the research that utilised QDA to explain the relationship between
two or more variables should include five observations for each variable; the small sample
size is not considered problematic in QDA (Lu, Plataniotis and Venetsanopoulos, 2003).
5.7.2 Interviews Analysis
The next stage is to use the interview approach to produce in-depth information on the
processes of internal control and corporate governance mechanisms, and their relationship
with earnings management practices. The semi-structured interviews conducted with
managers, the findings from the models of accruals, the firms’ published financial statements,
reviewing of published Amman stock market information, reviewing corporate governance
statements in each firm and review of internal documentation provided as a result of the
interviews. In order to refine the interview questions, one pilot interview was conducted with
a well-qualified financial manager with a great deal of experience. Based on the results from
this pilot study and advice from three academic professors at Jordanian universities
experienced in research on corporate governance and earnings management, these final
interview questions are refined to make more relevant to our research objectives.
The interviews are recorded using audio-tape and subsequently transcribed. After
consultation, the managers of 11 firms agreed to be recorded as long as there is no obligation
to answer any question, especially those which may have implications on their positions in
the firms. Due to the sensitivity of the subject matter (earnings management) we have made
the firms anonymous throughout this thesis. Only one manager was unwilling for it to be
recorded due to the firm's policy. Each semi-structured interview lasts between one and two-
and-a-quarter hours.
1 The technique of dividing EM into categories is used first time in such topic, as most existing literatures tend to combine both high positive or high negative and analysed them together (Alghamdi, 2012; Rhohaida, 2011; Habbash, 2010).

Chapter Five: Research Methodology and Data Collection
160
The interviews provide in-depth information which might be of assistance to financial
statement users (e.g. suppliers, the government and investors) in understanding how internal
control components and corporate governance mechanisms affect earnings management.
The interviews are used to explore several in-depth issues (see section 7.1). The resulting
research instrument and an outline list of suggested questions used during the interviews are
attached in appendixes 1 and 2.
5.8 Summary
This chapter begins by discussing research methodology and paradigms. The analysis
supports the decision that this research should adopt a mixed methodology. We adopt this
methodology to help with understanding the nature of the relationships among internal
control, corporate governance mechanisms and earnings management practices and the
empirical results draw on data deriving from both quantitative and qualitative research
methods.
Combination of the results of quantitative methods and qualitative methods has been
discussed by various researchers who believe that this combination can lead to one of these
three possibilities; (1) they can complement each other; (2) they can challenge each other, or
(3) they talk past each other (e.g. Brown et al 2007). In chapter seven, we discuss these three
possibilities in relation to our own results and the contribution to new knowledge this
research makes.
This chapter also discusses the use of variables, their proxies and measurements, in the
quantitative analysis. Additionally, this chapter discusses the procedures for both methods
(secondary data and interviews).

Chapter Six: Secondary Data Analysis, Findings and Discussions
161
6. Chapter Six: Secondary Data Analysis, Findings and Discussions
6.1 Introduction
This chapter presents the results and analysis of secondary data with reference to the role of
internal control and corporate governance mechanisms in constraining earnings management
in Jordanian industrial firms.
As described in the methodology chapter, three earnings management models, the Standard
Jones model, Modified Jones model and the Peasnell, Pope and Young model (SJ, MJ, and
PPY respectively) were adapted to construct earnings management measures (i.e.
discretionary accruals for SJ and MJ, and working capital accruals for PPY) as dependant
variables, in order to determine to what extent internal control and corporate governance
mechanisms affect earnings management in Jordanian industrial firms. The explanatory
variables include board of directors’ characteristics, audit committee characteristics, external
audit factors and ownership structure. The other variables include firm subsidiaries, financial
leverage, firm performance and cash flow from operating activities as control variables. See
figure 6.1.
Figure 6-1 the Relationship between Internal Control, Corporate Governance Mechanisms
and Earnings Management.

Chapter Six: Secondary Data Analysis, Findings and Discussions
162
This chapter is divided as follows; Section 6.2 presents and discusses the descriptive statistics
and univariate analysis. Section 6.3 presents and discusses covariance among variables.
Section 6.4 presents and discusses the results of testing the hypotheses through using t-test
(comparing means) and quadratic discriminant analysis. Section 6.5 provides chapter
summary.
6.2 Measuring Accruals Models
The standard way for evaluating earnings management begins from measuring accruals. This
thesis considers three models to measures accruals (SJ, MJ, and PPY), which were discussed
in chapter three. This section presents the empirical evidence that determined the most
suitable model to detect earnings management in Jordanian firms.
Table 6.1 shows that the regression results for the Standard Jones model has an F-statistic
(15.70), significant at the 1% level however the model R2 is low, (with a value of 15% which
suggests that the model is weak and does not satisfactorily explain the variation in the values
of the dependent variable in SJ model sample (total accruals).
The results in Table 6.2, show a positive estimated coefficient of 0.16 on the change in
revenue variable, which is significant at the 10% level, and with a negative coefficient (-
0.13) for PPE, which is significant at 5%. This indicates, as in the original Jones (1991)
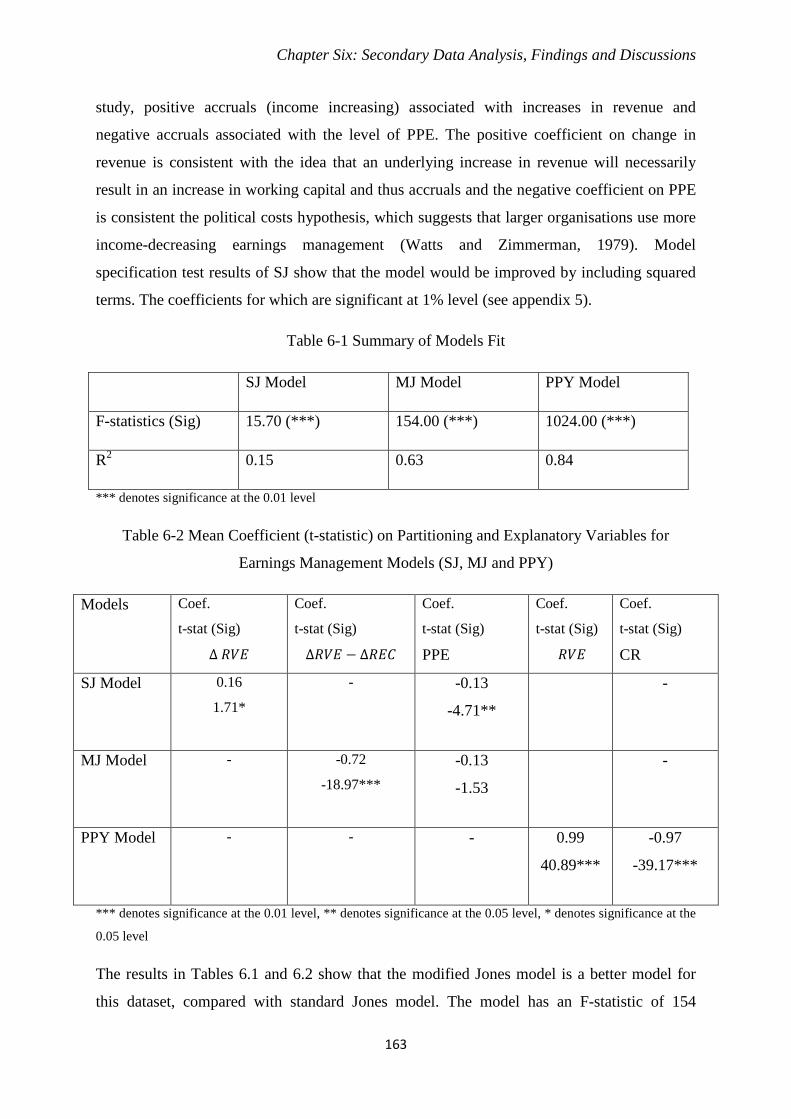
Chapter Six: Secondary Data Analysis, Findings and Discussions
163
study, positive accruals (income increasing) associated with increases in revenue and
negative accruals associated with the level of PPE. The positive coefficient on change in
revenue is consistent with the idea that an underlying increase in revenue will necessarily
result in an increase in working capital and thus accruals and the negative coefficient on PPE
is consistent the political costs hypothesis, which suggests that larger organisations use more
income-decreasing earnings management (Watts and Zimmerman, 1979). Model
specification test results of SJ show that the model would be improved by including squared
terms. The coefficients for which are significant at 1% level (see appendix 5).
Table 6-1 Summary of Models Fit
SJ Model MJ Model PPY Model
F-statistics (Sig) 15.70 (***) 154.00 (***) 1024.00 (***)
R2 0.15 0.63 0.84
*** denotes significance at the 0.01 level
Table 6-2 Mean Coefficient (t-statistic) on Partitioning and Explanatory Variables for
Earnings Management Models (SJ, MJ and PPY)
Models Coef.
t-stat (Sig)
∆ 𝑅𝑅𝑅𝑅𝐸𝐸
Coef.
t-stat (Sig)
∆𝑅𝑅𝑅𝑅𝐸𝐸 − ∆𝑅𝑅𝐸𝐸𝐴𝐴
Coef.
t-stat (Sig)
PPE
Coef.
t-stat (Sig)
𝑅𝑅𝑅𝑅𝐸𝐸
Coef.
t-stat (Sig)
CR
SJ Model 0.16
1.71*
- -0.13
-4.71**
-
MJ Model - -0.72
-18.97*** -0.13
-1.53
-
PPY Model - - - 0.99
40.89***
-0.97
-39.17***
*** denotes significance at the 0.01 level, ** denotes significance at the 0.05 level, * denotes significance at the
0.05 level
The results in Tables 6.1 and 6.2 show that the modified Jones model is a better model for
this dataset, compared with standard Jones model. The model has an F-statistic of 154

Chapter Six: Secondary Data Analysis, Findings and Discussions
164
(significant at 1%) and an R2 of 0.63%. The estimated coefficients are -0.72 on the change in
revenue less change in account receivables variable (significant at 1%) and -0.13 (not
significant) for PPE. This result shows the importance of accounting policies relating to
accounts receivable in Jordanian firms since the inclusion of this variable significantly
improves the model fit and the significance of the coefficients. Model specification test
results of MJ show that the model would be improved by including squared terms. The
coefficients for which are significant at 1% level (see appendix 5).
PPY model shows the best results for model fit (Tables 6.1 and 6.2). Table 6.1 reveals that
the PPY model has an F-statistic of 1024 (significant at 1%) and an R2 value of 0.84. With
respect to the coefficients for the PPY model, the total sales variable has a coefficient of 0.99
(significant 1%) and the total sales minus the change in trade debtors variable has a
coefficient of -0.97 (significant at 1%). The signs of these coefficients are consistent with
those reported in the original PPY study. The results suggest that the factors in the PPY
model, which are based around sales margins and working capital items are more appropriate
to explain the observed pattern of accruals in Jordanian firms. Model specification test results
of PPY show that the model is not improved by including squared terms. The coefficients for
which are not significant (see appendix 5).
Furthermore, and based on Stubben’s (2010) study which found that discretionary revenue
models are better than accrual models, this thesis measured the power of the discretionary
revenue models, particularly the model related to gross accounts receivable, (using fit model
and model specification test) where both of them showed weak results in the context of
Jordanian industrial firms compared with accrual model results (See Appendix 5).
Appendix 5 shows that the regression results for the discretionary revenue model (gross
accounts receivable) has an F-statistic (36), significant at the 1% level. However, the model
R2 is low, (with a value of 25% which suggests that the model is weak and does not
satisfactorily explain the variation in the values of the dependent variable in the discretionary
revenue model (gross accounts receivable) sample.
The results in Appendix 5, show an estimated positive coefficient of 0.09 on the change in
sales variable, which is significant at the 1% level, and with a positive coefficient (0.04) for
PPE, which is significant at 1%. The model specification test results of the discretionary

Chapter Six: Secondary Data Analysis, Findings and Discussions
165
revenue model (gross accounts receivable) show that the model would be improved by
including squared terms. The coefficients are significant at 1% level (see appendix 5).
Overall, the PPY model is the most suitable model of accruals for Jordanian firms. These
results are consistent with several prior papers that indicated that Standard Jones and
Modified Jones models are not effective models to detect earnings management in the
developing countries, such as Islam, et al (2011) and Yoon, et al (2006).
6.3 Descriptive Statistics and Univariate Analysis
This section presents the descriptive statistics and univariate analysis results for the variables
used in the extended earnings management models, discretionary accruals for Standard Jones,
1991 (DACSJ), discretionary accruals for Modified Jones (DACMJ), working capital
accruals for Peasnell, Pope and Young (WCPPY). In addition, we present descriptive
measures for explanatory variables and control variables (detailed in the previous chapter).
The descriptive statistics and univariate tests for SJ and MJ observations are shown together,
and descriptive statistics and univariate tests for PPY are shown separately. The reason for
this is that SJ and MJ models use the same sample of 39 Jordanian industrial firms over the
period of 2006 to 2012, whereas for the PPY model, the sample includes 56 Jordanian
industrial firms over the same period.
6.3.1 Dependent Variable (Earnings Management)
Earnings Management Variable
As showed in Tables (6.3 and 6.4) the mean values of DACSJ, DACMJ, and WCPPY are all
around zero, implying the accruals models to fit the data fairly well. These findings are
consistent with those reported by Klein (2002) in the US and Bhuiyan, Roudaki and Clark
(2013) who found the mean values of four earnings models (Jones model, modified Jones
model, performance matched model and performance matched free cash flow model) in
Australia to be zero. Other findings as reported by, for example, Xie, et al (2003) reveal the
mean value for discretionary accruals to be around 0.10 implying a poorer fit of the model.
Also, Abed, et al (2012) found the absolute mean value for discretionary accruals using the
modified Jones model in Jordanian industrial firms to be 0.08. Their findings may differ from
Chapter Six: Secondary Data Analysis, Findings and Discussions
166
ours due to the different period of studies they use, which is from 2006 to 2009. This implies
that the period they used does not consider important factors that could potentially lead to
non-zero values when applying the discretionary accruals model, such as the more recent
financial crisis and the Middle East Revolutions (e.g., Syria, Libya and Egypt). As for this
current study, it covers the period over 2006 to 2012, which includes some unique economics
and political circumstances such as, Middle East revolutions, volatile oil prices, and
significant fluctuation in tax rates.
The Construction of the Earnings Management Variable for Discriminant Analysis
The error terms from the Accruals Models generate an estimate of earnings management that
does not have upper or lower bounds and whose distribution is usually considered to be
sufficiently close to a normal distribution for these variables to be modelling using ordinary
least squares regression (see for example Alghamdi, 2012; Rhohaida, 2011 and Habbash,
2010). One significant limitation of this approach is that it results in companies with negative
earnings management and companies with positive earnings management being included in
the same analysis and this has three effects on the regression coefficients. First, the
coefficients for any given independent variable may be of opposite signs for these two groups
(positive and negative EM) and combining them is likely to result in lower coefficients,
which are less likely to prove significant than if they were analysed separately. Second,
because the data contains opposing effects it can be difficult to interpret the signs of the
resulting regression coefficients. Finally, the standard approach fails to allow for the
possibility that there may be different motivations underlying the two types of earnings
management behaviour. In many respects this problem is similar to samples containing both
loss-making and profit-making firms, which has long been recognised as an issue in positive
accounting research (for example see Ball and Brown, 1968).

Chapter Six: Secondary Data Analysis, Findings and Discussions
167
In papers where discriminant analysis has been used to model accounting variables, the usual
approach has been to construct a binary variable, the classic example being Altman’s (1968)
work classifying bankrupt/non bankrupt firms. Similar approaches appear in more current
analyses such as Ahmad and Shahsavari (2016) and in studies which classify firms as loss-
making/profit making such as Bonini et al (2010). However, given an understanding of the
practices of earnings management and the motivations that underlie it (see section 3.4) it is
evident that a binary classification is not a good description of the EM variable. The variable
captures three different kinds of management behaviour: firms in which there is little or no
EM; firms in which there is significant income-increasing EM and firms in which there is
significant income-decreasing EM, the last to groups each being driven by different
motivations. See Figure (6.2) that presented earnings management estimates in SJ model
sample.
Figure 6-2 EM Estimates for the SJ Model
Figure (6.2) is evident in the plots of the EM estimates included in Appendix 3 (above),
which show around 50% of firms with EM estimates close to zero, 25% with high positive
EM and 25% with high negative EM.
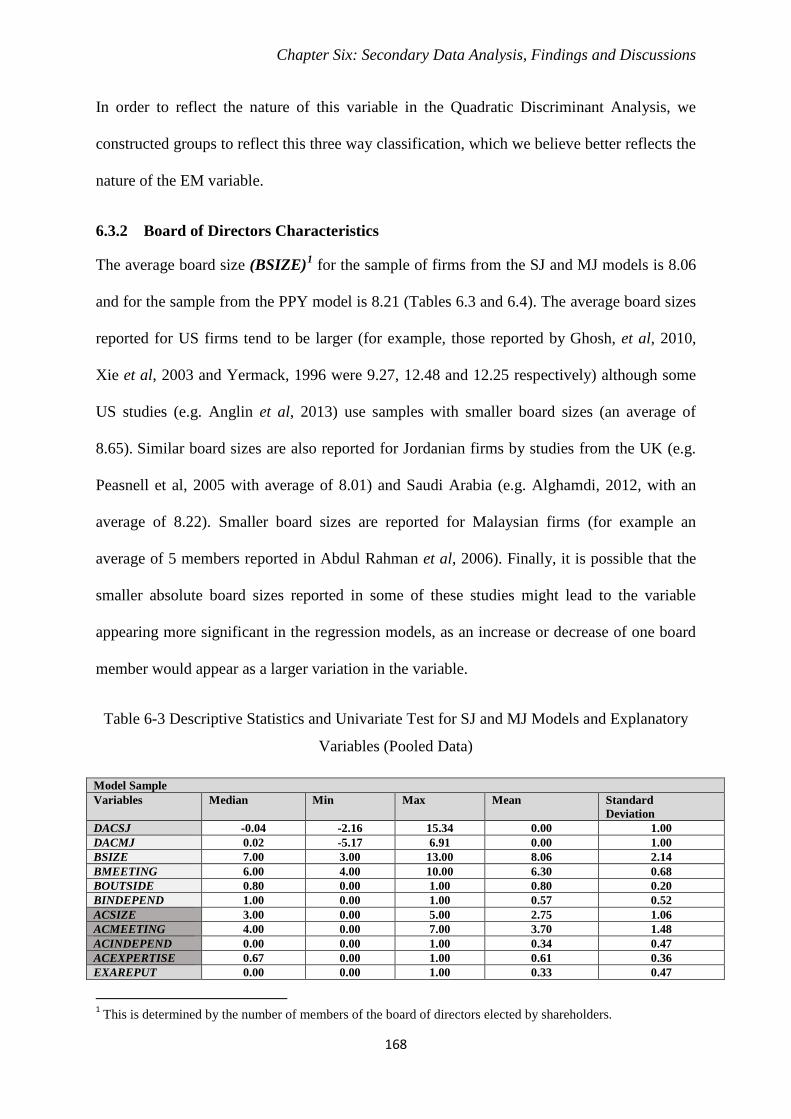
Chapter Six: Secondary Data Analysis, Findings and Discussions
168
In order to reflect the nature of this variable in the Quadratic Discriminant Analysis, we
constructed groups to reflect this three way classification, which we believe better reflects the
nature of the EM variable.
6.3.2 Board of Directors Characteristics
The average board size (BSIZE)1 for the sample of firms from the SJ and MJ models is 8.06
and for the sample from the PPY model is 8.21 (Tables 6.3 and 6.4). The average board sizes
reported for US firms tend to be larger (for example, those reported by Ghosh, et al, 2010,
Xie et al, 2003 and Yermack, 1996 were 9.27, 12.48 and 12.25 respectively) although some
US studies (e.g. Anglin et al, 2013) use samples with smaller board sizes (an average of
8.65). Similar board sizes are also reported for Jordanian firms by studies from the UK (e.g.
Peasnell et al, 2005 with average of 8.01) and Saudi Arabia (e.g. Alghamdi, 2012, with an
average of 8.22). Smaller board sizes are reported for Malaysian firms (for example an
average of 5 members reported in Abdul Rahman et al, 2006). Finally, it is possible that the
smaller absolute board sizes reported in some of these studies might lead to the variable
appearing more significant in the regression models, as an increase or decrease of one board
member would appear as a larger variation in the variable.
Table 6-3 Descriptive Statistics and Univariate Test for SJ and MJ Models and Explanatory
Variables (Pooled Data)
Model Sample Variables Median Min Max Mean Standard
Deviation DACSJ -0.04 -2.16 15.34 0.00 1.00 DACMJ 0.02 -5.17 6.91 0.00 1.00 BSIZE 7.00 3.00 13.00 8.06 2.14 BMEETING 6.00 4.00 10.00 6.30 0.68 BOUTSIDE 0.80 0.00 1.00 0.80 0.20 BINDEPEND 1.00 0.00 1.00 0.57 0.52 ACSIZE 3.00 0.00 5.00 2.75 1.06 ACMEETING 4.00 0.00 7.00 3.70 1.48 ACINDEPEND 0.00 0.00 1.00 0.34 0.47 ACEXPERTISE 0.67 0.00 1.00 0.61 0.36 EXAREPUT 0.00 0.00 1.00 0.33 0.47
1 This is determined by the number of members of the board of directors elected by shareholders.

Chapter Six: Secondary Data Analysis, Findings and Discussions
169
EXATENURE 0.00 0.00 1.00 0.22 0.41 EXAOPIN 1.00 0.00 1.00 0.84 0.37 EXACHANG 0.00 0.00 1.00 0.13 0.33 MANOWN 0.51 0.00 0.99 0.52 0.25 IOWNFOR 0.00 0.00 0.99 0.15 0.23 IOWNLOC 0.31 0.00 9.50 0.47 1.13 INDOWNF 0.00 0.00 0.92 0.04 0.12 INDOWNL 0.15 0.00 0.82 0.51 4.97 FAMOWN 0.12 0.00 0.95 0.19 0.21 BLOCKOWN 1.00 0.00 1.00 0.85 0.36 STATOWN 0.00 0.00 0.50 0.06 0.11 ROA 0.03 -0.34 5.17 0.05 0.33 CFOA 0.03 -6.03 0.61 0.01 0.39 FLVE 0.00 0.00 0.56 0.05 0.09 FSUB 0.00 0.00 1.00 0.27 0.44 ACCSJ is Discretionary Accruals (Standard Jones Model), ACCMJ is Discretionary Accruals (Modified Jones Model), WAPPY is Working Capital Accruals, BSIZE is Board of Director Size, BMEETING is Number of the Board of Directors, BOUTSIDE is Board of Director Outsiders, and BINDEPEND is Board of Director Independence. ACSIZE is Audit Committee Size, ACMEETING is Number of Audit Committee Meetings, ACINDEPEND is Audit Committee Independence, and ACEXPERTISE is Audit Committee Expertise. EXAREPUT is External Auditor Reputation, EXATENURE is External Audit Tenure, EXAOPIN is External Audit Opinion, and EXACHANG is External Audit Change. MANOWN is Managerial Shareholders, IOWNFOR is Institutional Shareholders Foreign, IOWNLOC is Institutional Shareholders Local, INDOWNF is Individual Foreign, INDOWNL is Individual Local, FAMOWN is Family Ownership, BLOCKOWN is Blockholder Ownership, and STATOWN is State Ownership. FSUB is Firm Subsidiary, FLVE is Financial Leverage, ROA is Firm Performance, and CFOA is Cash Flow from Operating Activities.
Table 6-4 Descriptive Statistics and Univariate Test for PPY Model and Explanatory
Variables (Pooled Data)
Model Sample Variables Median Min Max Mean Standard
Deviation WCPPY 0.05 -7.05 6.94 0.00 1.00 BSIZE 9.00 3.00 13.00 8.21 2.13 BMEETING 6.00 4.00 10.00 6.27 0.64 BOUTSIDE 0.82 0.00 1.00 0.82 0.18 BINDEPEND 1.00 0.00 1.00 0.65 0.50 ACSIZE 3.00 0.00 5.00 2.69 1.07 ACMEETING 4.00 0.00 7.00 3.65 1.51 ACINDEPEND 0.00 0.00 1.00 0.32 0.47 ACEXPERTISE 0.67 0.00 1.00 0.66 0.37 EXAREPUT 0.00 0.00 1.00 0.30 0.46 EXATENURE 0.00 0.00 1.00 0.22 0.41 EXAOPIN 1.00 0.00 1.00 0.88 0.33 EXACHANG 0.00 0.00 1.00 0.11 0.31 MANOWN 0.46 0.00 0.99 0.49 0.25 IOWNFOR 0.00 0.00 0.99 0.13 0.22 IOWNLOC 0.31 0.00 9.50 0.43 0.95 INDOWNF 0.00 0.00 0.92 0.04 0.11 INDOWNL 0.15 0.00 0.82 0.43 4.15 FAMOWN 0.13 0.00 0.95 0.20 0.22 BLOCKOWN 1.00 0.00 1.00 0.87 0.34 STATOWN 0.00 0.00 0.50 0.05 0.09 ROA 0.03 -0.34 5.17 0.05 0.28 CFOA 0.04 -6.03 0.61 0.02 0.33 FLVE 0.00 0.00 0.56 0.04 0.08 FSUB 0.00 0.00 1.00 0.20 0.40
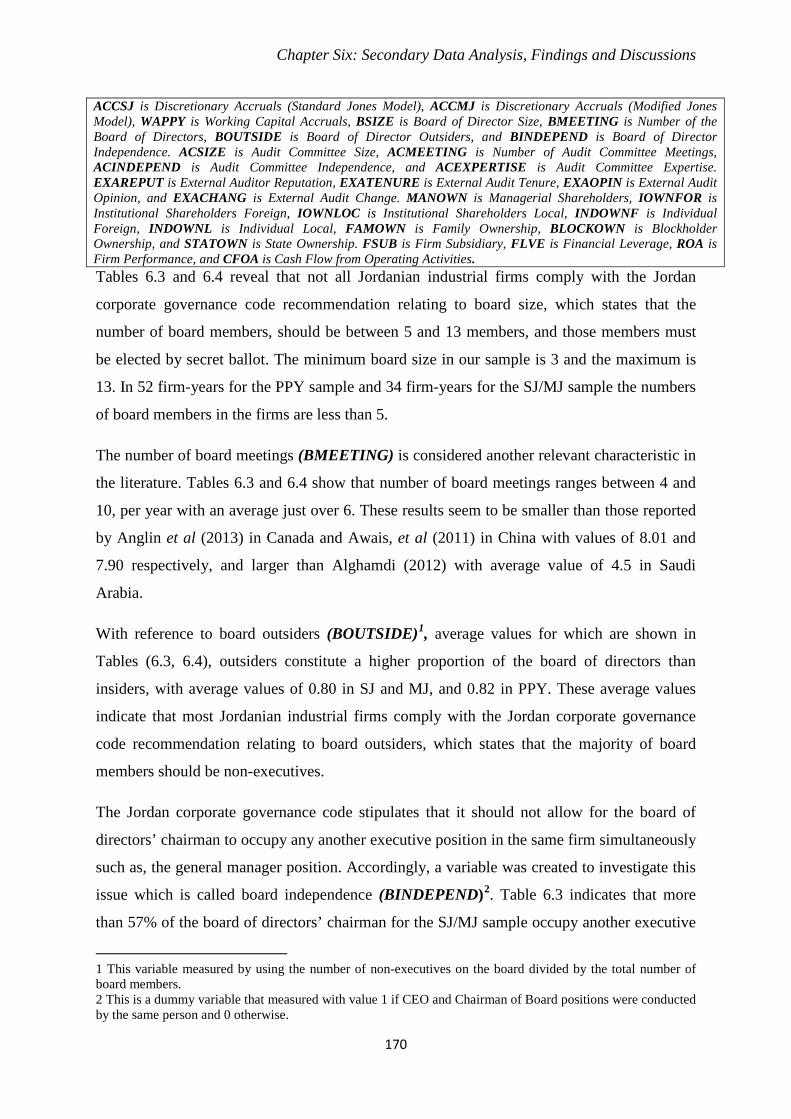
Chapter Six: Secondary Data Analysis, Findings and Discussions
170
ACCSJ is Discretionary Accruals (Standard Jones Model), ACCMJ is Discretionary Accruals (Modified Jones Model), WAPPY is Working Capital Accruals, BSIZE is Board of Director Size, BMEETING is Number of the Board of Directors, BOUTSIDE is Board of Director Outsiders, and BINDEPEND is Board of Director Independence. ACSIZE is Audit Committee Size, ACMEETING is Number of Audit Committee Meetings, ACINDEPEND is Audit Committee Independence, and ACEXPERTISE is Audit Committee Expertise. EXAREPUT is External Auditor Reputation, EXATENURE is External Audit Tenure, EXAOPIN is External Audit Opinion, and EXACHANG is External Audit Change. MANOWN is Managerial Shareholders, IOWNFOR is Institutional Shareholders Foreign, IOWNLOC is Institutional Shareholders Local, INDOWNF is Individual Foreign, INDOWNL is Individual Local, FAMOWN is Family Ownership, BLOCKOWN is Blockholder Ownership, and STATOWN is State Ownership. FSUB is Firm Subsidiary, FLVE is Financial Leverage, ROA is Firm Performance, and CFOA is Cash Flow from Operating Activities. Tables 6.3 and 6.4 reveal that not all Jordanian industrial firms comply with the Jordan
corporate governance code recommendation relating to board size, which states that the
number of board members, should be between 5 and 13 members, and those members must
be elected by secret ballot. The minimum board size in our sample is 3 and the maximum is
13. In 52 firm-years for the PPY sample and 34 firm-years for the SJ/MJ sample the numbers
of board members in the firms are less than 5.
The number of board meetings (BMEETING) is considered another relevant characteristic in
the literature. Tables 6.3 and 6.4 show that number of board meetings ranges between 4 and
10, per year with an average just over 6. These results seem to be smaller than those reported
by Anglin et al (2013) in Canada and Awais, et al (2011) in China with values of 8.01 and
7.90 respectively, and larger than Alghamdi (2012) with average value of 4.5 in Saudi
Arabia.
With reference to board outsiders (BOUTSIDE)1, average values for which are shown in
Tables (6.3, 6.4), outsiders constitute a higher proportion of the board of directors than
insiders, with average values of 0.80 in SJ and MJ, and 0.82 in PPY. These average values
indicate that most Jordanian industrial firms comply with the Jordan corporate governance
code recommendation relating to board outsiders, which states that the majority of board
members should be non-executives.
The Jordan corporate governance code stipulates that it should not allow for the board of
directors’ chairman to occupy any another executive position in the same firm simultaneously
such as, the general manager position. Accordingly, a variable was created to investigate this
issue which is called board independence (BINDEPEND)2. Table 6.3 indicates that more
than 57% of the board of directors’ chairman for the SJ/MJ sample occupy another executive
1 This variable measured by using the number of non-executives on the board divided by the total number of board members. 2 This is a dummy variable that measured with value 1 if CEO and Chairman of Board positions were conducted by the same person and 0 otherwise.

Chapter Six: Secondary Data Analysis, Findings and Discussions
171
position in the firm, the comparable figure for the PPY sample is 65% (see Table 6.4). This
could lead to an increase in the probability of firms engaging in earnings management
(Davidson et al, 2005; Peasnell et al, 2000). Studies by Alghamdi, (2012) (for Saudi Arabia),
Prencipe, et al (2011) (for Italy) and Chtourou, et al (2001) (for Canada) have also suggested
that high board independence could also lead to decrease in earnings management level.
6.3.3 Audit Committee Characteristics
The results in Tables 6.3 and 6.4 indicate that several Jordan industrial firms do not have
audit committees despite this being a requirement of the Jordan Corporate Governance Code.
Because of this the subsequent averages and estimations are adjusted to reflect only those
firms with a committee.
The Jordan corporate governance code stipulates that the minimum number of audit
committee members has to be no less than three. In fact, based on the information presented
in Tables 6.3 and 6.4, we found that the average audit committee size (ACSIZE) for all
models is less than 3 (the average for SJ/ MJ is 2.75 and for PPY is 2.69). These numbers
indicate that most Jordanian industrial firms do not comply with Jordan corporate governance
code recommendation according to the minimum audit committee members. Accordingly,
these are consistent with several prior studies such as; Hamdan et al, 2013 who found
minimum audit committee members to be 3 in Jordan firms. In addition, Baxter (2009),
Bedard, et al (2004), and Xie, et al (2003), also found the minimum audit committee
members less than 3.5.
By comparing audit committee size in Jordanian industrial firms with other countries, we
found Jordanian industrial firms audit committee size to be smaller than audit committee size
in USA (e.g. Xie et al, 2003 found mean value 4.53), and Saudi Arabia (e.g. Alghamdi, 2012;
Habbash, 2010, who found mean values of 3.12, 3.58 respectively).
The frequency of audit committee meeting (ACMEETING)1 per year is another issue that
has received interest in this research area. On average, Tables 6.3 and 6.4 show that the
frequency of audit committee meetings in Jordan is less than the frequency stipulated by the
Jordan corporate governance code (average frequency for firms used in the SJ and MJ
samples is 3.7 and for those in the PPY sample is 3.65), which states that each audit
committee has to meet at least four times per year. These results are inconsistent with prior
1 This variable is estimated by the number of annual meetings the committee holds.

Chapter Six: Secondary Data Analysis, Findings and Discussions
172
studies results (e.g. Saleh et al, 2007; Abdul Rahman; Baxter, et al, 2009; Bedard, et al,
2004).
Tables 6.3 and 6.4 show that audit committee independence (ACINDEPEND)1 absolute
average values are low, which is 0.34 for SJ/MJ and 0.32 for PPY), which means this
increase the opportunity for the managers to engage in earnings management practices, these
results are supported by prior literature such as, Saleh et al, (2007) and Abbott et al, (2000).
Tables 6.3 and 6.4 present that the average for audit committee expertise (ACEXPERTISE)2
to be more than 0.60 in all models samples. These results are consistent with several studies
results such as, Puat et al (2013), Lo et al (2004) and Bedard et al (2004). Furthermore, firms
in our samples are compliant with corporate governance rules which state that “most of the
audit committee have to have expertise in accounting and finance fields”. The average value
of this variable as estimated in the different models is greater than 0.5 (0.61 for the SJ/MJ
sample, and 0.66 for the PPY sample), and therefore implying a tendency to mitigate earnings
management practices (Bedard et al, 2004).
Finally, the absence of audit committees in some Jordanian industrial firms could be the
potential reason for weak regression results relating to audit committee characteristics in
Jordanian industrial firms comparing with other countries. The Jordanian corporate
governance code stipulates that each firm should have audit committee. In case of firm does
not comply with this stipulation, this will not exclude this firm from being listed on the
Amman stock market but will cause the firm to go down from the first market to the second
market. (Amman Stock Market, 2015).
6.3.4 External Auditors Factors
Most of prior literature suggests that compliance with external auditor requirements
contained in corporate governance codes is likely lead to reduction in earnings management
practices (e.g. Mariani et al, 2010; Alhayale et al, 2005).
1 This is a dummy variable that measured with value 1 if the committee totally comprises from non-executive members is given, and 0 otherwise. 2 This variable is estimated by giving a value of 1 if all audit committee members were qualified and at least one of them has an accounting professional certificate (based on the corporate governance code for Jordan) and 0 otherwise.

Chapter Six: Secondary Data Analysis, Findings and Discussions
173
The external auditor’s reputation is reflected in the variable (EXAREPUT)1. Tables 6.3 and
6.4 show that most Jordanian industrial firms do not deal with big-4 audit firms since the
average value of external auditor reputation is 0.33 for the SJ/MJ sample and 0.30 for the
PPY sample. The main reason for this is probably due to the cost of Big-4 audit fees
(Ettredge et al, 2007).
Previous studies, such as Davis et al (2009), have found that short term audit tenure can lead
to reductions in earnings management. The Jordanian corporate governance code
recommends that external audit partners are rotated every 4 years. We construct the variable
(EXATENURE)2 to represent external auditor tenure. The variable takes the value of one if
the governance code conditions are met and zero otherwise. Table 6.3 and 6.4 reveals that
0.78 of Jordanian industrial firms comply with the code and change external auditor partner
every 4 years.
Furthermore, We also need a point in the discussion of the figures in Table 6.3 that explains
that a mean of 0.84 for the (EXAOPIN)3 variable implies that 16% of the firms have a going
concern modification in their audit report and that this is due primarily to the incidence of
large and very old debts in the balance sheet and that we pick up this issue for discussion in
the interviews in section 7.5.11
Finally, Tables 6.3 and 6.4 indicate averages of 0.13 (SJ/MJ sample) and 0.11 (PPY sample)
for the variable representing external auditor change or rotation (EXACHANG)4. This
implies that, more than 87% of Jordanian industrial firms do not comply with the part of the
corporate governance code, which states that external auditors are hired by shareholders for
one year and rotated year-by-year. This clearly provides Jordanian industrial firms with more
opportunities to engage in earnings management, given the long lasting and established
relationship between external auditor and firm employees (e.g. internal auditor, general
manager and financial manager) which does not give any incentive for auditors to question
managers’ judgement. This result is supported by Gaver et al (2001) and Hackenbrack et al
1 This is a dummy variable that measured with value 1 if the firm is using big-four and 0 otherwise. 2 This is a dummy variable that measured with value 1 if audit partner has been engaged by the client firm for more than 4 years and 0 otherwise. 3 This variable is estimated by giving a dummy variable of value 0 if firm receives a going-concern modified opinion and 1 otherwise. 4 This variable is estimated by giving a dummy variable of value 1 if firm has changed external auditor before one year and 0 otherwise.

Chapter Six: Secondary Data Analysis, Findings and Discussions
174
(2002), who suggest that changing external auditors each year may mitigate earnings
management practices.
6.3.5 Ownership Structure
As illustrated in Tables 6.3 and 6.4, ownership concentration represented by the variable
blockholder ownership (BLOCKOWN)1 is high in Jordanian industrial firms, (the SJ/MJ
sample has 85% of firms with block ownership and the PPY sample 87%). Managerial
ownership (MANOWN)2 is the second type of ownership that is relevant to Jordanian
industrial firms (Tables 6.3 and 6.4), where the average values are 0.52 (SJ/MJ sample) and
0.49 (PPY sample).
The average values in Tables 6.3 and 6.4 show that local individual ownership (INDOWNL)3
and local institutional ownership (IOWNLOC)4 are higher than foreign individual ownership
(INDOWNF)5 and foreign institutional ownership (IOWNFOR)6 in both samples. These
could be due to several reasons: the weakness of existing law to protect foreign investors,
higher registration fees for new investment, and increased taxation rates in Jordan compared
to other emerging economies in the same area such as, Egypt, Libya and Iraq.
Previous studies suggest that a higher proportion of family ownership will lead to less
earnings management because firms are less accountable to external investors. In our study,
family ownership (FAMOWN)7 is 0.19 in the SJ/MJ sample and 0.20 in the PPY sample.
Despite the OECD (2004) suggestion that increased state-ownership in firms is likely to lead
to economic expansion; Jordan is relatively unusual among developing countries in relation
to the lower level of governmental ownership among firms. The results in Tables 6.3 and 6.4
show that average values for state ownership (STATOWN)8 are 0.06 in the SJ/MJ sample and
0.05 in the PPY sample, and these results are consistent with several other studies (e.g.
Alfaraih et al, 2012; Wang et al, 2011; Omran et al, 2008) with average values for state
ownership 0.03, 0.05, and 0.06 respectively, and where they found no relationship between
earnings management and state ownership. 1This variable is estimated by giving a dummy variable of value 1 if the firm has external stockholder ownership of 5% or more of the outstanding shares and zero, otherwise. 2 This variable is estimated by the cumulative percentage of total shares owned by the directors of the firm. 3 This variable is estimated by the cumulative percentage of total shares owned by local people. 4 This variable is estimated by the cumulative percentage of total shares owned by local institutions. 5 This variable is estimated by the cumulative percentage of total shares owned by foreign people. 6 This variable is estimated by the cumulative percentage of total shares owned by foreign institutions. 7 This variable is estimated by the cumulative percentage of total shares owned by family. 8 This variable is estimated by the cumulative percentage of government ownership of the firm.

Chapter Six: Secondary Data Analysis, Findings and Discussions
175
6.3.6 Control Variables
In this section control variables for all models are discussed. The Return on Assets (ROA)
for both samples range from -0.34 to 5.17, with a mean of 0.05. Similar distributions of ROA
can be seen in other studies of firms in developing economies such as Alghamdi (2012) in
Saudi Arabia, and Abdul Rahman et al (2006) in Malaysia.
The average value for cash flow from operating activities (CFOA) is 0.01 (JD, million) in the
SJ/MJ sample and 0.02 (JD, million) in the PPY sample, with maximums of 0.61 and a
minimums of -6.03. Furthermore, Tables 6.3 and 6.4 indicate firms leverage (FLEV) average
values for this variable are 0.05 for SJ/ MJ sample models, and 0.04 for PPY sample model,
with maximum of 0.56 and a minimum of 0 respectively.
Finally, the average firm subsidiaries (FSUB) for the SJ/MJ samples are 0.27 and 0.20 for the
PPY model sample, with maximum of 1 and a minimum of 0 for all of them.
6.4 Correlation Matrix
In this section, we discuss the Pearson correlation coefficients which reveal the association
between earnings management, board of directors’ characteristics, audit committee
characteristics, external audit factors, ownership structures, and control variables (Table 6.5).
Prior literature has documented that a higher degree of correlation between variables may
lead to a multicolinearity problem, particularly when the correlation coefficients are more
than ± 0.8 (e.g. Alghamdi 2012; Hair et al 2010; Habbash 2010; Abdul Rahman et al 2006).
Accordingly, this multicolinearity problem may bias the findings when using the regression
models affects the ability to use regression to detect the relationship between dependent and
independent variables.
Table 6.5 shows that for the SJ/MJ sample, the variables that have the highest degree of
correlation with EM measures (ACCSJ/ ACCMJ) are return on assets (ROA), cash flow from
operating activities (CFOA) and individual local ownership (INDOWNL). None of the other
variables are highly correlated with EM measures from the PPY model (Table 6.6).
Among the other variables, audit committee characteristics (ACSIZE, ACEXPERTISE and
ACMEETING) are positively related to each other, which is not surprising, as committees of
a larger size might be expected to contain members with more expertise and to meet more
regularly.

Chapter Six: Secondary Data Analysis, Findings and Discussions
176
Additionally, the correlation matrix in Table 6.5 also reveals that there is a significant, high
negative association between firm performance (ROA) and cash flow (CFOA). In accounting
terms, this may imply the presence of EM, as reported profit is showing a high difference
from cash flow, suggesting the use of accruals. Furthermore, a significant high negative
association between individual local ownership (INDOWNL) and cash flow from operations
(CFOA), and also imply the reliance of Jordanian industrial firms on long term borrowing.
Also, a significant high positive association between individual local ownership
(INDOWNL) and firm performance (ROA) and this results could be because of several
Jordanian firms have small amount of assets, which means that these firms could be having a
smaller amount of return on assets.

Chapter Six: Secondary Data Analysis, Findings and Discussions
177
Table 6-5 Pearson Correlation for Firms in the SJ/MJ Sample
ACCSJ/ACCMJ
BSIZE BMEETING
BOUTSIDE BINDEPEND
ACSIZE ACMEETING
ACINDEPEND
ACEXPERTISE
EXAREPUT
EXATENURE
EXAOPIN
EXACHANG
ACCSJ/ACCMJ 1.00 BSIZE -0.06 1.00 BMEETING -0.02 .28** 1.00 BOUTSIDE -0.04 .18** 0.01 1.00 BINDEPEND -0.07 -0.11 -0.10 -.20** 1.00 ACSIZE 0.04 0.10 .26** .13* -.31** 1.00 ACMEETING 0.05 .15* .29** .19** -.30** .88** 1.00 ACINDEPEND 0.09 .13* 0.11 0.04 -0.08 .26** .19** 1.00 ACEXPERTISE 0.09 .28** 0.11 .20** -0.12 .57** .64** 0.11 1.00 EXAREPUT -0.02 .25** .19** -0.05 -.32** .22** .19** .16** 0.02 1.00 EXATENURE -0.02 -0.01 -0.06 0.00 -0.01 -0.04 -0.04 -0.02 -0.02 0.03 1.00 EXAOPIN 0.07 .16** 0.10 .12* 0.04 .12* .12* 0.10 0.10 .16** -0.04 1.00 EXACHANG -0.03 -.13* 0.11 -0.12 0.01 0.02 0.03 -0.08 -0.07 0.04 -0.12 0.01 1.00 MANOWN -0.03 0.02 0.03 -0.05 -0.02 0.10 .12* -.22** 0.11 .15* 0.04 0.08 0.04 IOWNFOR -0.02 .16** 0.11 0.09 -0.02 .21** .26** 0.02 0.06 .49** 0.09 0.11 -0.11 IOWNLOC -0.06 -.24** -.20** -.21** 0.04 -.21** -.20** -0.05 -0.09 -0.10 0.01 -.21** -0.05 INDOWNF -0.05 -.21** -.15* -0.09 0.07 -.15* -.17** -0.02 -.12* -.20** -0.05 -.18** -0.03 INDOWNL 0.93** -0.10 -0.03 -0.08 -0.06 0.01 0.01 0.09 0.06 -0.05 -0.03 0.03 -0.02 FAMOWN 0.08 -.36** -.18** -.22** 0.10 -0.08 -.13* -0.09 0.01 -.26** -0.03 0.08 0.06 BLOCKOWN 0.06 .22** -.13* .17** -.28** .33** .34** 0.11 .34** 0.10 0.08 0.01 -.20** STATOWN -0.03 .25** .16** .19** -.32** .13* .25** 0.00 .18** .27** -0.04 0.07 0.00 ROA 0.90** -0.01 0.03 -0.08 -0.08 0.07 0.08 0.08 .12* 0.02 -0.03 0.10 -0.01 CFOA -0.89** .17** 0.07 0.05 0.01 0.05 0.06 -0.07 0.01 .13* 0.03 0.03 0.00 FLVE 0.00 -0.01 0.02 .13* -.16** .13* 0.07 .16** 0.04 0.02 0.03 -.26** -0.03 FSUB -0.03 0.00 .39** -0.04 0.10 -0.05 0.02 -.20** -0.05 0.10 0.00 -0.07 0.07

Chapter Six: Secondary Data Analysis, Findings and Discussions
178
Continuation …..Table 6-5 Pearson Correlation for Firms in the SJ/MJ Sample
MANOWN IOWNFOR
IOWNLOC INDOWNF INDOWNL FAMOWN
BLOCKOWN
STATOWN
ROA CFOA FLVE FSUB
MANOWN 1.00 IOWNFOR .40** 1.00 IOWNLOC -.14* -.15* 1.00 INDOWNF 0.00 -0.05 -0.07 1.00 INDOWNL -0.05 -0.06 -0.02 -0.02 1.00 FAMOWN 0.06 -.39** .27** 0.09 .157** 1.00 BLOCKOWN .19** .27** -.23** -0.06 0.02 -.21** 1.00 STATOWN .13* 0.06 -0.02 -0.09 -0.04 -.18** 0.12 1.00 ROA 0.05 0.05 -0.06 -0.05 .94** 0.08 0.06 0.00 1.00 CFOA 0.10 0.09 -0.01 -0.03 -.95** -.17** 0.02 0.08 -.84** 1.00 FLVE .14* 0.09 -0.03 0.07 -0.04 -.20** .14* -0.01 -0.07 0.04 1.00 FSUB -0.02 0.11 -0.09 0.00 -0.04 -.22** -.25** 0.06 0.06 0.08 -0.03 1.00 ACCSJ is Discretionary Accruals (Standard Jones Model), ACCMJ is Discretionary Accruals (Modified Jones Model), WAPPY is Working Capital Accruals, BSIZE is Board of Director Size, BMEETING is Number of the Board of Directors, BOUTSIDE is Board of Director Outsiders, and BINDEPEND is Board of Director Independence. ACSIZE is Audit Committee Size, ACMEETING is Number of Audit Committee Meetings, ACINDEPEND is Audit Committee Independence, and ACEXPERTISE is Audit Committee Expertise. EXAREPUT is External Auditor Reputation, EXATENURE is External Audit Tenure, EXAOPIN is External Audit Opinion, and EXACHANG is External Audit Change. MANOWN is Managerial Shareholders, IOWNFOR is Institutional Shareholders Foreign, IOWNLOC is Institutional Shareholders Local, INDOWNF is Individual Foreign, INDOWNL is Individual Local, FAMOWN is Family Ownership, BLOCKOWN is Blockholder Ownership, and STATOWN is State Ownership. FSUB is Firm Subsidiary, FLVE is Financial Leverage, ROA is Firm Performance, and CFOA is Cash Flow from Operating Activities.
** denotes significance at the 0.01 level, * denotes significance at the 0.05 level.

Chapter Six: Secondary Data Analysis, Findings and Discussions
179
Table 6-6 Pearson Correlation for Firms in the PPY Sample
WAPPY BSIZE BMEETING
BOUTSIDE BINDEPEND
ACSIZE ACMEETING
ACINDEPEND
ACEXPERTISE
EXAREPUT
EXATENURE
EXAOPIN
EXACHANG
WAPPY 1.00 BSIZE -0.06 1.00 BMEETING -0.04 .21** 1.00 BOUTSIDE -0.03 .23** 0.05 1.00 BINDEPEND 0.06 -0.03 -.17** -.21** 1.00 ACSIZE -0.07 .10* .24** .13* -.29** 1.00 ACMEETING -0.08 .16** .30** .19** -.30** .91** 1.00 ACINDEPEND 0.02 .13* 0.09 0.07 -0.09 .27** .19** 1.00 ACEXPERTISE -0.04 .29** .11* .25** -0.10 .63** .70** 0.10 1.00 EXAREPUT -0.06 .20** .112* -0.08 -.22** .21** .20** .16** 0.07 1.00 EXATENURE 0.03 -0.03 -0.06 0.01 -0.01 -0.04 -0.05 0.00 -0.02 0.00 1.00 EXAOPIN -0.02 .14** 0.07 .15** 0.06 0.07 0.07 0.09 .11* .11* -0.03 1.00 EXACHANG 0.05 -.14** 0.09 -.13** 0.01 0.05 0.04 -0.07 -0.05 0.06 -.10* -0.03 1.00 MANOWN 0.08 -.16** -0.01 -0.09 -.12* 0.06 0.06 -.17** 0.03 .14** 0.03 0.06 0.04 IOWNFOR 0.02 0.03 .12* -0.02 -0.04 .21** .25** 0.00 0.03 .43** 0.04 0.07 -0.05 IOWNLOC 0.01 -.22** -.19** -.19** 0.00 -.16** -.16** -0.04 -0.06 -0.07 0.02 -.20** -0.04 INDOWNF -0.01 -.20** -.13* -.10* 0.02 -.121* -.14** -0.01 -.11* -.16** -0.05 -.20** 0.01 INDOWNL 0.00 -0.08 -0.02 -0.08 -0.06 0.01 0.00 0.08 0.04 -0.04 -0.03 0.02 -0.01 FAMOWN 0.03 -.25** -0.09 -.17** .13** -0.09 -.12* 0.04 -0.05 -.20** -0.02 0.07 0.02 BLOCKOWN 0.00 .20** -0.09 .18** -.22** .35** .36** .12* .39** .11* 0.04 0.06 -.16** STATOWN -0.06 .21** .17** .14** -.32** .12* .22** 0.00 .100* .25** -0.04 0.02 0.01 ROA 0.01 -0.01 0.01 -0.08 -0.05 0.05 0.05 0.07 0.09 0.01 -0.03 0.09 0.00 CFOA -0.08 .14** 0.03 0.05 0.04 0.04 0.05 -0.06 0.02 0.09 0.01 0.04 -0.01 FLVE -0.10 -0.01 0.03 0.07 -.14** .12* 0.06 .10* 0.02 0.00 0.02 -.25** -0.03 FSUB -0.07 0.02 .33** -0.09 0.04 0.00 0.04 -.17** -0.05 0.08 0.01 -.10* 0.08
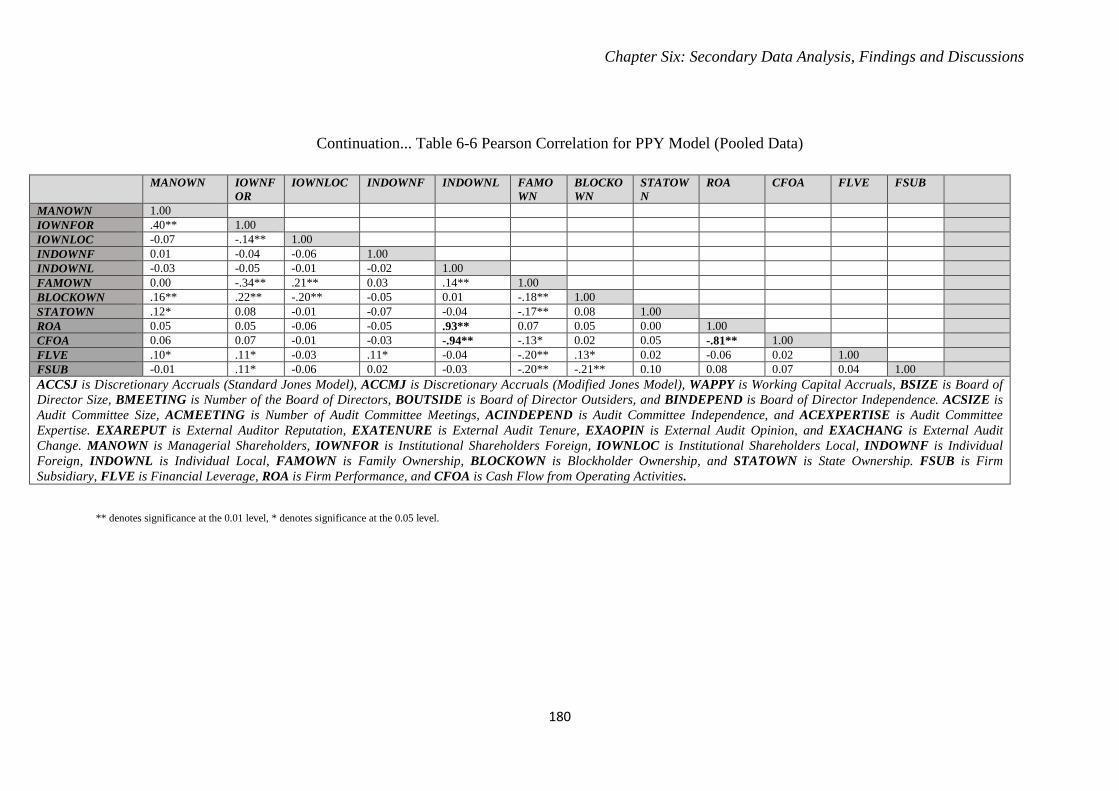
Chapter Six: Secondary Data Analysis, Findings and Discussions
180
Continuation... Table 6-6 Pearson Correlation for PPY Model (Pooled Data)
MANOWN IOWNFOR
IOWNLOC INDOWNF INDOWNL FAMOWN
BLOCKOWN
STATOWN
ROA CFOA FLVE FSUB
MANOWN 1.00 IOWNFOR .40** 1.00 IOWNLOC -0.07 -.14** 1.00 INDOWNF 0.01 -0.04 -0.06 1.00 INDOWNL -0.03 -0.05 -0.01 -0.02 1.00 FAMOWN 0.00 -.34** .21** 0.03 .14** 1.00 BLOCKOWN .16** .22** -.20** -0.05 0.01 -.18** 1.00 STATOWN .12* 0.08 -0.01 -0.07 -0.04 -.17** 0.08 1.00 ROA 0.05 0.05 -0.06 -0.05 .93** 0.07 0.05 0.00 1.00 CFOA 0.06 0.07 -0.01 -0.03 -.94** -.13* 0.02 0.05 -.81** 1.00 FLVE .10* .11* -0.03 .11* -0.04 -.20** .13* 0.02 -0.06 0.02 1.00 FSUB -0.01 .11* -0.06 0.02 -0.03 -.20** -.21** 0.10 0.08 0.07 0.04 1.00 ACCSJ is Discretionary Accruals (Standard Jones Model), ACCMJ is Discretionary Accruals (Modified Jones Model), WAPPY is Working Capital Accruals, BSIZE is Board of Director Size, BMEETING is Number of the Board of Directors, BOUTSIDE is Board of Director Outsiders, and BINDEPEND is Board of Director Independence. ACSIZE is Audit Committee Size, ACMEETING is Number of Audit Committee Meetings, ACINDEPEND is Audit Committee Independence, and ACEXPERTISE is Audit Committee Expertise. EXAREPUT is External Auditor Reputation, EXATENURE is External Audit Tenure, EXAOPIN is External Audit Opinion, and EXACHANG is External Audit Change. MANOWN is Managerial Shareholders, IOWNFOR is Institutional Shareholders Foreign, IOWNLOC is Institutional Shareholders Local, INDOWNF is Individual Foreign, INDOWNL is Individual Local, FAMOWN is Family Ownership, BLOCKOWN is Blockholder Ownership, and STATOWN is State Ownership. FSUB is Firm Subsidiary, FLVE is Financial Leverage, ROA is Firm Performance, and CFOA is Cash Flow from Operating Activities.
** denotes significance at the 0.01 level, * denotes significance at the 0.05 level.

Chapter Six: Secondary Data Analysis, Findings and Discussions
181
6.5 Hypotheses Tests (T-test and Multivariate Analyses)
Analysis of the covariance matrices for our variables lead us to the conclusion that the
relationships between them were not clear enough and the size of sample not large enough to
support the use of OLS and GLS regressions, results of GLS regression included in
(appendix, 4). We therefore conduct empirical analysis of the relationship between the
variables by comparing the means of the different groups of firms, classified based on
earnings management groups (discussed in next section), by using t-tests and we use
quadratic discriminant analysis to predict the level of earnings management underlying our
sample firms.
Quadratic discriminant analysis is a technique used to categorise research observations into
two or more known groups according to one or more categorical variables. This
categorisation can be completed by both parametric and nonparametric methods. A
parametric method is considered a proper method assuming the research variables follow a
normal distribution, and a non-parametric method is where there is no assumption of
normality underlying the research variables' distributions (Silverman, 1986).
This research adopted quadratic discriminant analysis for examining the effect of internal
control and corporate governance characteristics on earnings management, rather than
parametric testing (OLS regression), because most of the OLS regression prerequisites are
not met by the data. In particular, Multicolinearity is one of the issues that led the researcher
to use discriminant regression instead of OLS regression. Correlation matrix tests, as shown
in Tables 6.5 and 6.6, indicated the presence of multicolinearity since some of the
independent variables are correlated to each other by more than ± 0.8 (see earlier). In addition
we found that a heteroskedasticity problem exists in the data which would make the use of
OLS estimation less efficient. Regression results and diagnostics are included in Appendix 4
for completeness but the results are not considered strong enough to present here.
6.5.1 T-Test (Comparing Means)
This section analyses the relationship between internal controls, corporate governance
mechanisms and earnings management by using t-tests to compare the means of variables
representing the characteristics of firms in different earnings management groups. Prior
literature has investigated this relationship by partitioning the earnings management variables
into two groups representing positive and negative earnings management. See for example,
Habbash, et al (2014), Alghamdi (2012), Rohaida (2011), and Habbash (2010).

Chapter Six: Secondary Data Analysis, Findings and Discussions
182
T-tests were conducted for the EM variables and for each of the internal control, corporate
governance and control variables to identify whether there is a significant difference between
the mean in the following groups:
• High positive earnings management/ high negative earnings management (HI+veEM/ HI-veEM).
• High positive earnings management/ low earnings management (HI+veEM/ low EM).
• High negative earnings management/ low earnings management (HI-veEM/ low EM).
• High positive and negative earnings management/ / low earnings management (HI±veEM/ low EM).
6.5.1.1 Control Variables
There are several variables identified by the literature that are known to be related to earnings
management but which do not form part of our hypotheses. They include: return on assets
(ROA), cash flow from operating activities (CFOA), financial leverage (FLVE), and firm
subsidiary (FSUB).
Tables 6.7 and 6.8 show that there is a significant difference between the means of ROA for
firms in all comparisons except for the comparison of the HI+veEM and Low EM groups
used in the SJ/MJ samples. This implies that firms with higher ROA are using less income-
reducing earnings management. Table 6.8 also shows a significant positive t-statistic for the
comparison of HI+veEM and Low EM firms, but this measure for the SJ model is
insignificant. The difference between the SJ and MJ models lies in the treatment of accounts
receivable, which is a factor in the MJ model but not in the SJ Model. The significant positive
coefficient observed for firms with high positive earnings management suggest that these
firms manipulate earnings upward.

Chapter Six: Secondary Data Analysis, Findings and Discussions
183
Table 6-7 T-Test (Comparing Means) for Standard Jones Model (SJ)
High Negative High Positive LOW HI+ve AND HI-ve HI+ve AND LOW
HI-veAND LOW
HI±ve AND LOW
Mean S.D Mean S.D Mean S.D T-TEST T-TEST T-TEST T-TEST BSIZE 7.91 2.36 8.06 2.09 7.90 1.94 -0.38 -0.34 -0.78 -0.68 BMEETING 6.24 0.81 6.21 0.41 6.26 0.61 0.27 -1.80* -1.25 -1.87* BOUTSIDE 6.38 2.65 6.56 2.57 6.12 2.54 -0.39 0.02 -0.44 -0.26 BINDEPEND 0.60 0.49 0.53 0.50 0.56 0.50 0.86 -0.40 0.60 0.12 ACSIZE 2.74 1.23 2.66 1.07 2.84 0.96 0.37 -0.94 -0.42 -0.80 ACMEETING 3.56 1.60 3.62 1.53 3.81 1.40 -0.22 -0.89 -1.15 -1.23 ACINDEPEND 0.35 0.48 0.34 0.48 0.29 0.46 0.18 0.21 0.42 0.38 ACEXPERTISE 0.58 0.37 0.61 0.37 0.62 0.35 -0.52 -0.28 -0.90 -0.71 EXAREPUT 0.32 0.47 0.37 0.49 0.32 0.47 -0.60 0.91 0.21 0.69 EXATENURE 0.24 0.43 0.24 0.43 0.25 0.44 0.00 0.60 0.60 0.73 EXAOPIN 0.75 0.44 0.81 0.40 0.93 0.26 -0.82 -1.76* -2.80*** -2.66*** EXACHANG 0.19 0.40 0.10 0.31 0.10 0.31 1.45 0.00 1.76* 1.10 MANOWN 0.51 0.23 0.52 0.26 0.52 0.25 -0.14 -0.26 -0.43 -0.42 IOWNFOR 0.16 0.21 0.19 0.26 0.15 0.25 -0.79 1.69* 0.86 1.57 IOWNLOC 0.57 1.57 0.50 1.14 0.45 1.15 0.27 0.73 0.99 0.98 INDOWNF 0.07 0.17 0.06 0.14 0.02 0.05 0.54 2.25** 2.87*** 2.74*** INDOWNL 0.21 0.19 0.15 0.18 0.24 0.21 2.05** -3.28*** -1.13 -2.75*** FAMOWN 0.20 0.22 0.14 0.21 0.18 0.19 1.79* -1.96* 0.24 -1.02 BLOCKOWN 0.84 0.37 0.91 0.29 0.84 0.37 -1.29 1.80* 0.39 1.34 STATOWN 0.06 0.10 0.07 0.11 0.05 0.09 -0.49 0.34 -0.21 0.08 ROA -0.01 0.11 0.04 0.16 0.07 0.09 -2.26** -0.82 -4.93*** -2.93*** CFOA 0.02 0.11 0.01 0.16 0.05 0.10 0.43 -1.69* -1.35 -1.78* FLVE 0.05 0.09 0.08 0.12 0.02 0.05 -1.75* 4.69*** 2.46*** 3.94*** FSUB 0.22 0.42 0.29 0.46 0.29 0.46 -0.98 0.22 -0.90 -0.41 BSIZE is Board of Director Size, BMEETING is Number of the Board of Directors, BOUTSIDE is Board of Director Outsiders, and BINDEPEND is Board of Director Independence. ACSIZE is Audit Committee Size, ACMEETING is Number of Audit Committee Meetings, ACINDEPEND is Audit Committee Independence, and ACEXPERTISE is Audit Committee Expertise. EXAREPUT is External Auditor Reputation, EXATENURE is External Audit Tenure, EXAOPIN is External Audit Opinion, and EXACHANG is External Audit Change. MANOWN is Managerial Shareholders, IOWNFOR is Institutional Shareholders Foreign, IOWNLOC is Institutional Shareholders Local, INDOWNF is Individual Foreign, INDOWNL is Individual Local, FAMOWN is Family Ownership, BLOCKOWN is Blockholder Ownership, and STATOWN is State Ownership. FSUB is Firm Subsidiary, FLVE is Financial Leverage, ROA is Firm Performance, and CFOA is Cash Flow from Operating Activities. Notes: significance is indicated at *** 0.001, ** 0.05, * 0.10

Chapter Six: Secondary Data Analysis, Findings and Discussions
184
by using bad debt provisions. We therefore investigate the use of this policy during the
interviews with managers. ROA proved to be insignificant for firms classified using margin
model (Table 6.9).
According to Tables (6.7, 6.8. and 6.9) CFOA is largely insignificant, but significantly
positive when showing the difference for the HI+ve/HI-ve comparison in the SJ/MH model
and the PPY model respectively. The potential reason for that is the focus of the PPY model
on working capital items and its close relationship with cash flow.
FLVE proves to be significant for firms in the SJ and PPY models samples, and have positive
t-statistics in all comparisons, which means that the higher leverage is associated with high
positive EM and lower leverage associated with high negative EM (see Tables 6.7 and 6.9).
Finally, FSUB is significant only for the PPY model sample; the sign of this result is difficult
to interpret, because the coefficient FSUB is constructed as a binary variable (1, 0) but results
seem to indicate that firms with subsidiaries use earnings management.
6.5.1.2 Explanatory variables
Board of Directors Characteristics
H1 assumes a negative relationship between board size and earnings management in
Jordanian industrial firms, based on the t-test findings, table 6.7 and 6.8 reports showing the
relationship between board size (BSIZE) and earnings management in the SJ/MJ samples is
insignificant. In contrast, the t-tests in Table 6.9 show the existence of differences in the
mean values between the HI+veEM/ low EM, HI-veEM/ low EM, HI±veEM and low EM
groups and that they are all significantly positive at 1%. These results are consistent with
those of Rahman (2006) who also reports a significant positive relationship between board
size and earnings management level using regression analysis, revealing that firms with
larger boards are consuming more income increasing and income decreasing. Board size may
well proxy for firm size in this context. These differences in findings are not surprising, since
a number of empirical studies have documented that a large board (more than seven
members) leads to lower efficiency, which leads the CFO to control the board members, and
in addition leads to the board members having less accountability, since each of them relies
on the others (e.g. Core and Guay 1999; Jensen 1993). This research found the average board
size of the samples was more than eight. (See Table 6.4).

Chapter Six: Secondary Data Analysis, Findings and Discussions
185
The t-tests results for the number of board meetings (BMEETING) in the MJ model sample
is negatively significant at 10% (see Table 6.8). The t-test for the SJ model is significantly
negative at 1% for the HI±veEM/ low EM group and significantly negative at 10% for the
HI+veEM/ low EM group (see Table 6.7). These results indicate that a higher number of
meetings could lead to a decrease in earnings management. These results are consistent with
H2 which states that “there is a negative relationship between the number of board meetings
and earnings management in Jordanian industrial firms”.
The results of this research are consistent with those of Habbash (2010), who found no
relationship between board meetings and earnings management practices in the UK. He gave
two reasons for this result: first, the weakness of corporate governance in terms of the low
numbers of board meetings during the year, which is fewer than the numbers that have been
established in the corporate governance code. This explanation is supported by Vafeas
(1999). Second, there is a lack of education and experience on the part of the board members
themselves.
Accordingly, the results of this research might be an indication of the lack of board members’
education and experience. However, they cannot be attributed to the low number of board
meetings, since the results in Tables 6.3 and 6.4 indicate that the average number of board
meetings in Jordanian industrial firms is consistent with Jordan’s corporate governance code
which states that “each firm has to meet at least six times per year”. Furthermore, these
results are consistent with other studies that have reached similar conclusions (e.g. Anglin et
al., 2013; Awais et al., 2011; and Xie et al., 2003). On the other hand, BMEETING is not
significant for the PPY sample model.
Considering the negative relationship between board outsiders (BOUTSIDE) and earnings
management that is assumed in H3, Tables 6.7 and 6.8 show that the relationship between
both of them is negative but insignificant for the SJ/MJ models. These findings are similar to
those of many studies that have been carried out in countries such as Malaysia (Yang et al.,
2009), Spain (Osma et al., 2007), and the USA (Klein 2002).
In contrast, the t-test in Table 6.9 shows the mean differences between the groups of HI+
veEM/ low EM, HI-veEM/ low EM, HI±veEM and low EM for the PPY model which are
positive and significant at 1% level. These results are consistent with Rahman (2006), who
found a significant positive relationship between board outside and earnings management

Chapter Six: Secondary Data Analysis, Findings and Discussions
186
level in Malaysian firms, which implies that a higher proportion of outsiders on the board
increase earnings management.
In this respect there appears to be a difference between developed and developing economies.
Corporate governance literature suggests that in developed economies, external members on
the board should improve the corporate governance system and reduce earnings management.
However, the empirical evidence from developing economies reveals that the opposite seems
to be true which may be due to the influence on board decisions from powerful individuals
such as politicians, wealthy individuals or leaders of powerful social groups in board
decisions. This theme is further explored in the case studies and should be discussed in the
next chapter.
Finally, the t-tests show that there is no difference between the mean values for board
independence in all of the groups compared, which means there is no relationship between
board independence and earnings management in Jordanian industrial firms. This result is not
consistent with H4, which states that there is a negative relationship between board
independence and earnings management in Jordanian industrial firms. This result is in line
with the earlier findings of Precipe et al., (2011) who documented that there is no association
between board independence and earnings management in family-controlled firms,
particularly if the CEO is one of the members or the chairman of the board of directors.

Chapter Six: Secondary Data Analysis, Findings and Discussions
187
Table 6-8 T-Test (Comparing Means) for Modified Jones Model (MJ)
High Negative High Positive LOW HI+ve AND HI-ve HI+ve AND LOW
HI-veAND LOW
HI±ve AND LOW
Mean S.D Mean S.D Mean S.D T-TEST T-TEST T-TEST T-TEST BSIZE 7.78 2.14 8.07 2.11 8.27 2.14 -0.81 -0.61 -1.54 -1.32 BMEETING 6.19 0.66 6.19 0.43 6.41 0.79 0.00 -2.09** -1.94** -2.60*** BOUTSIDE 6.57 2.42 6.33 2.79 6.62 2.54 0.53 -0.74 -0.14 -0.55 BINDEPEND 0.54 0.50 0.57 0.50 0.56 0.50 -0.35 0.10 -0.30 -0.12 ACSIZE 2.69 1.20 2.90 0.78 2.72 1.10 -1.20 1.14 -0.22 0.52 ACMEETING 3.60 1.61 3.93 1.22 3.66 1.52 -1.33 1.22 -0.29 0.54 ACINDEPEND 0.27 0.45 0.31 0.47 0.37 0.49 -0.57 -0.83 -1.48 -1.43 ACEXPERTISE 0.62 0.35 0.64 0.37 0.59 0.35 -0.41 0.91 0.44 0.83 EXAREPUT 0.42 0.50 0.39 0.49 0.25 0.44 0.35 1.97** 2.40** 2.63*** EXATENURE 0.21 0.41 0.16 0.37 0.25 0.43 0.66 -1.33 -0.59 -1.19 EXAOPIN 0.78 0.42 0.87 0.34 0.85 0.36 -1.35 0.28 -1.31 -0.66 EXACHANG 0.12 0.33 0.10 0.31 0.13 0.34 0.27 -0.60 -0.30 -0.56 MANOWN 0.49 0.23 0.56 0.25 0.52 0.26 -1.50 0.82 -0.85 0.00 IOWNFOR 0.15 0.21 0.22 0.28 0.11 0.21 -1.61 3.05*** 1.28 2.64*** IOWNLOC 0.58 1.58 0.32 0.27 0.49 1.14 1.37 -1.22 0.49 -0.27 INDOWNF 0.06 0.16 0.06 0.15 0.03 0.07 0.12 1.92* 2.00** 2.14** INDOWNL 0.19 0.17 0.19 0.21 0.24 0.21 -0.02 -1.67* -1.77* -2.15** FAMOWN 0.19 0.23 0.18 0.23 0.19 0.19 0.40 -0.32 0.19 -0.08 BLOCKOWN 0.82 0.39 0.90 0.31 0.84 0.37 -1.24 1.13 -0.26 0.51 STATOWN 0.08 0.12 0.05 0.11 0.06 0.10 1.72* -0.93 1.25 0.22 ROA -0.02 0.11 0.09 0.11 0.03 0.08 -5.67*** 3.89*** -4.31*** -0.19 CFOA 0.03 0.11 0.03 0.15 0.03 0.09 -0.15 0.13 -0.08 0.04 FLVE 0.05 0.11 0.05 0.09 0.04 0.06 -0.33 1.33 0.75 1.17 FSUB 0.28 0.45 0.30 0.46 0.25 0.43 -0.19 0.79 0.57 0.82 BSIZE is Board of Director Size, BMEETING is Number of the Board of Directors, BOUTSIDE is Board of Director Outsiders, and BINDEPEND is Board of Director Independence. ACSIZE is Audit Committee Size, ACMEETING is Number of Audit Committee Meetings, ACINDEPEND is Audit Committee Independence, and ACEXPERTISE is Audit Committee Expertise. EXAREPUT is External Auditor Reputation, EXATENURE is External Audit Tenure, EXAOPIN is External Audit Opinion, and EXACHANG is External Audit Change. MANOWN is Managerial Shareholders, IOWNFOR is Institutional Shareholders Foreign, IOWNLOC is Institutional Shareholders Local, INDOWNF is Individual Foreign, INDOWNL is Individual Local, FAMOWN is Family Ownership, BLOCKOWN is Blockholder Ownership, and STATOWN is State Ownership. FSUB is Firm Subsidiary, FLVE is Financial Leverage, ROA is Firm Performance, and CFOA is Cash Flow from Operating Activities. Notes: significance is indicated at *** 0.001, ** 0.05, * 0.1

Chapter Six: Secondary Data Analysis, Findings and Discussions
188
Table 6-9 T-Test (Compare Means) for Margin Model (PPY)
High Negative High Positive LOW HI+ve AND HI-ve HI+ve AND LOW
HI-veAND LOW
HI±ve AND LOW
Mean S.D Mean S.D Mean S.D T-TEST T-TEST T-TEST T-TEST BSIZE 8.71 1.98 8.48 2.05 7.81 2.20 0.76 2.51*** 3.36*** 3.65*** BMEETING 6.33 0.74 6.26 0.53 6.23 0.61 0.68 0.50 1.22 1.07 BOUTSIDE 7.26 2.01 7.21 2.23 6.32 2.77 0.17 2.72*** 2.95*** 3.63*** BINDEPEND 0.64 0.48 0.67 0.47 0.63 0.48 -0.46 0.70 0.17 0.53 ACSIZE 2.93 0.85 2.72 0.95 2.52 1.20 1.60 1.42 2.98*** 2.80*** ACMEETING 3.95 1.15 3.71 1.42 3.42 1.69 1.29 1.43 2.76*** 2.65*** ACINDEPEND 0.26 0.44 0.36 0.48 0.32 0.47 -1.41 0.71 -0.91 -0.11 ACEXPERTISE 0.72 0.34 0.66 0.38 0.63 0.37 1.20 0.74 2.15** 1.76* EXAREPUT 0.37 0.48 0.28 0.45 0.25 0.43 1.24 0.67 2.14** 1.70* EXATENURE 0.16 0.37 0.27 0.45 0.22 0.41 -1.95** 1.08 -1.16 0.00 EXAOPIN 0.85 0.36 0.87 0.33 0.88 0.32 -0.42 -0.26 -0.75 -0.62 EXACHANG 0.09 0.29 0.11 0.31 0.11 0.31 -0.24 -0.13 -0.41 -0.33 MANOWN 0.46 0.24 0.49 0.24 0.50 0.26 -1.04 -0.41 -1.55 -1.21 IOWNFOR 0.14 0.22 0.16 0.24 0.08 0.17 -0.42 3.05*** 2.61** 3.30*** IOWNLOC 0.37 0.24 0.36 0.26 0.51 1.34 0.25 -1.13 -1.07 -1.55 INDOWNF 0.03 0.06 0.05 0.13 0.04 0.11 -1.45 0.61 -0.97 -0.14 INDOWNL 0.14 0.15 0.15 0.16 0.73 5.95 -0.12 -0.96 -0.96 -1.36 FAMOWN 0.13 0.18 0.15 0.21 0.26 0.22 -1.05 -4.06*** -5.31*** -5.84*** BLOCKOWN 0.89 0.31 0.89 0.31 0.84 0.37 0.00 1.20 1.20 1.52 STATOWN 0.04 0.08 0.05 0.09 0.05 0.10 -0.74 -0.12 -0.90 -0.64 ROA 0.03 0.13 0.05 0.11 0.05 0.38 -1.39 0.04 -0.55 -0.36 CFOA 0.07 0.12 -0.01 0.13 0.01 0.45 4.11*** -0.31 1.29 0.68 FLVE 0.05 0.09 0.05 0.07 0.03 0.07 0.15 2.02** 2.03** 2.45*** FSUB 0.25 0.44 0.25 0.44 0.13 0.33 0.00 2.71*** 2.71*** 3.17*** BSIZE is Board of Director Size, BMEETING is Number of the Board of Directors, BOUTSIDE is Board of Director Outsiders, and BINDEPEND is Board of Director Independence. ACSIZE is Audit Committee Size, ACMEETING is Number of Audit Committee Meetings, ACINDEPEND is Audit Committee Independence, and ACEXPERTISE is Audit Committee Expertise. EXAREPUT is External Auditor Reputation, EXATENURE is External Audit Tenure, EXAOPIN is External Audit Opinion, and EXACHANG is External Audit Change. MANOWN is Managerial Shareholders, IOWNFOR is Institutional Shareholders Foreign, IOWNLOC is Institutional Shareholders Local, INDOWNF is Individual Foreign, INDOWNL is Individual Local, FAMOWN is Family Ownership, BLOCKOWN is Blockholder Ownership, and STATOWN is State Ownership. FSUB is Firm Subsidiary, FLVE is Financial Leverage, ROA is Firm Performance, and CFOA is Cash Flow from Operating Activities. Notes: significance is indicated at *** 0.001, ** 0.05, * 0.10

Chapter Six: Secondary Data Analysis, Findings and Discussions
189
Audit Committee Characteristics
The means of the variables for all audit committee variables were insignificantly different for
all groups compared in the SJ/MJ models (see Tables 6.7. and 6.8). Table 6.9, however,
demonstrates that for the PPY model, audit committee characteristics are associated with
firms using negative EM.
This is in accordance with H5 that predicts “audit committee size is negatively associated
with levels of earnings management in Jordanian industrial firms”. The t-tests for the HI-
veEM/ low EM and HI±veEM/ low EM groups in the PPY model show that the audit
committee size is different in their mean values, which are significantly positive at 1% (see
Table 6.9). In the context of Jordan, this result is consistent with the results of Alhaddad et
al., (2011), who found a positive relationship between audit committee size and earnings
management in Jordanian firms. On the other hand, SJ/MJ model samples do not support H5.
These results are consistent with several prior studies, such as Bedard et al., (2004), Xie et
al., (2003), and Baxter (2009), who all documented that there is no association between
earnings management and audit committee size. They stated that their results might refer to
the weakness of the number of audit committee members’ education and experiences, since a
strong argument in the agency theory states that the larger the size of the audit committee the
more likely it will lead to a mitigation of earnings management level.
The tests of H6, which suggested a negative relationship between the number of audit
committee meetings and earnings management in Jordanian industrial firms is not supported.
The t-tests for the HI-veEM/ low EM and HI±veEM/ low EM groups in the PPY model also
show that the number of audit committee meetings are different in their mean values, which
are significantly positive at 1% (see Table 6.9). This result is consistent with the work of
Saleh et al., (2007) and Abdul Rahman et al., (2006), who found that the number of audit
committee members is positively related to earnings management levels in Malaysia. As
discussed, the main reason for their results may be the classification of their country -
Malaysia is considered a developing country.
With regard to the SJ/MJ model samples, Tables 6.7 and 6.8 show that the number of audit
committee meetings has no significant relationship, which means that audit committee
meetings do not have a serious effect on discretionary accruals in Jordanian industrial firms.
The possible reason for these results could be the low level of audit committee independence.
This explanation was supported by the suggestion of Abbott et al., (2000), who stated that the

Chapter Six: Secondary Data Analysis, Findings and Discussions
190
full independence of audit committee members mitigates earnings management in firms. In
accordance with this, Table 6.3 indicates a low level of independence among audit committee
members in Jordanian industrial firms, where the average independence of audit committees
according to the SJ model sample is 0.34, which means that this could be the main cause of
the positive result.
Audit committee independence is another issue that was given attention in this research; H7
assumes a negative relationship between the independence of audit committees and levels of
earnings management in Jordanian industrial firms. No statistically significant relationship
was detected between the independence of audit committees and earnings management, as
shown in Tables 6.7, 6.8 and 6.9. These results are consistent with those of Abdul Rahman et
al., (2006), who conducted their study in Malaysia with 97 firms and found insignificant
evidence of a relationship between audit committee independence and earnings management.
Based on this result, the insignificant relationship between audit committee independence and
earnings management in Jordanian industrial firms in all models may be explained by two
possibilities: (1) lack of audit committee independence in Jordanian industrial firms (Tables
6.1 and 6.2 show low averages for audit committee independence in all model samples,
SJ/MJ 0.34, and PPY 0.32). This possible reason is supported by Klein (2000) and Abbott et
al., (2000), who obtained different results from those produced by this research, and (2) small
sample size, as supported by Rahman et al., (2006) who found results similar to ours. Their
sample size was small compared with other studies that have investigated the association
between audit committee independence and earnings management. For example, Abbott et
al., (2000) surveyed 244 USA firms.
According to the t-test results in Tables 6.7, 6.8 and 6.9, this research does not supported H8,
which states that there is a negative relationship between the existence of audit committee
expertise and earnings management in Jordanian industrial firms. The SJ/MJ model samples
do not show any significant relationship, and the PPY model sample presents a positive
relationship between audit committee expertise and earnings management in the HI-
veEM/Low EM and HI±veEM/Low EM groups.
Finally, the signs on the t-tests for these variables are the opposite to what might be expected
in developed economies, as they are for those for the board characteristics discussed earlier.
These results are, however, consistent with prior studies based on developing economies such
Chapter Six: Secondary Data Analysis, Findings and Discussions
191
as Saleh et al., (2007) and Abdul Rahman et al (2006) who conducted similar studies on
Malaysian firms.
External Auditors Factors
As mentioned previously, this research addresses H9 to determine whether there is a negative
relationship between the external auditor’s reputation and earnings management in Jordanian
industrial firms. The results of t-tests show that the external audit reputation (EXAREPUT) is
significant in the MJ/PPY models and the t-tests show a positive relationship between
external audit reputation and EM (see Tables 6.8 and 6.9), which contradicts prior findings.
As a result, we investigated other explanations for EM behaviour in our semi-structured
interviews.
Furthermore, H10 which assumes that “there is a positive relationship between the tenure of
the external auditor and earnings management level in Jordanian industrial firms” is not
supported where all the results of t-tests in Tables 6.7, 6.8 and 6.9 show no relationship
between external auditor tenure and earnings management.
Hypothesis 11 of this research suggested that there is a negative relationship between the
issuing of going-concern modified opinions and earnings management in Jordanian industrial
firms. The results of t-tests show that external auditor opinion (EXAOPIN) is significant only
for the SJ model where it shows a negative relationship between EXAOPIN and EM (see
Table 6.7), implying a clean audit opinion is associated with a lower EM. Findings from
Chen et al., (2001) also reveal that receiving a modified audit opinion (EXAOPIN) was
associated downward with earnings management in China. With regard to the MJ/PPY model
samples, the t-test results in Tables 6.8 and 6.9 indicate that there is no relationship between
external auditor opinion and earnings management in Jordanian industrial firms. These results
are consistent with Butler et al., (2004), who found no association between external auditor
opinion and earnings management in the USA.
Agency theory states that the change of external auditor based on corporate governance law is
more likely to increase earnings quality, which means less earnings management in firms
(Bukit et al., 2009; Hackenbrack et al., 2002; Gaver et al., 2001). Accordingly, H12
suggested that there is a negative relationship between the external auditors remaining with a
firm for more than a year and earnings management in Jordanian industrial firms. T-test
results reveal that the external audit change (EXACHANG) however, is not a strong

Chapter Six: Secondary Data Analysis, Findings and Discussions
192
explanatory variable for the existence of earnings management in Jordanian firms as they are
all insignificant for all our models. These results are not surprising, since there are two
factors that might lead to them: (1) the nature of management culture, since most managers
prefer to stay with the same external auditor because he/she knows the firm’s circumstances,
and (2) low levels of compliance with corporate governance mechanisms, since this code has
only recently been adopted in Jordan. However, these results are consistent with several
studies, such as one carried out in Saudi Arabia (Aghamidi, 2012) which also found that there
is no relationship between external auditor change and earnings management. They refer to
several potential reasons for this: (1) weakness of audit quality, which could lead to poor
evaluations for the firms; (2) the methods used to evaluate Big 4 audit firms in Saudi Arabia
are of lower quality than the methods used in developed countries; (3) most developing
countries have weaknesses in their corporate governance mechanism, and (4) the nature of
culture in Saudi Arabia, which might be considered another possible reason for this result.
Bradshaw et al., (2001) also presented empirical evidence that showed that there is no
relationship between external auditor change and earnings management practices in the USA,
and they attribute this to the ineffective application of corporate governance roles in the
sample firms.
Ownership Structure
Almost all comparisons of the mean values between groups show that the t-statistics for
foreign institutional ownership (IOWNFOR) are significantly positive for all the models
while foreign individual ownership (INDOWNF) is significantly positive for the SJ/ MJ
models. This means that higher foreign ownership appears to be associated with more
earnings management. These results are consistent with prior findings such as Siregar et al.,
(2008) and Koh (2003). These results could be because foreign investors care less about the
interests of the home country, which means more pressure on firms with foreign investors to
report results that meet their requirements. According to these results, it can be concluded
that H14 is supported in this research, which states that there is a positive relationship
between high proportions of foreign individual ownership and earnings management level in
Jordanian industrial firms. H18 is not supported, which assumes that there is a negative
relationship between high proportions of foreign institutional ownership and earnings
management level in Jordanian industrial firms.

Chapter Six: Secondary Data Analysis, Findings and Discussions
193
As for H15 “there is a positive relationship between high proportions of local individual
ownership and earnings management in Jordanian industrial firms”. Tables 6.7 and 6.8 show
that there are significantly negative results for firms in the SJ/ MJ model, which means that
more INDOWNL is associated with less EM. This result is inconsistent with Ali et al.,
(2008), and may be due to the influence of powerful individuals over the board of directors as
discussed earlier.
H19 states that there is a negative relationship between high proportions of local institutional
ownership and earnings management. None of the results (presented for all models in Tables
6.7, 6.8 and 6.9) show a significant relationship, which means H19 is not supported. These
results are not surprising since Peasnell et al., (2005), in their study conducted in the UK, also
showed no relationship between institutional ownership and earnings management. The cause
of this could be the fact that Jordanian industrial firms suffer from constant change in
institutional investors, whether foreign or local, particularly after financial crises and
revolutions in the Middle East area. This explanation is supported by Koh’s studies in 2003
and 2007.
This research suggests in H13 that there is a negative relationship between the high
proportion of family ownership and earnings management in Jordanian industrial firms. Table
6.7 shows that family ownership (FAMOWN) has a significantly negative, but weak effect on
the SJ model, but highly negative and significant effect on the PPY model which means that
greater family ownership is associated with low earnings management. The possible reasons
for these results are: (1) the desire of family owners to maintain their reputations, and (2)
family ownership implies less need to be accountable to external shareholders. These results
are consistent with prior literature (e.g. Yang 2010; Wang 2006), who found that a high
percentage of family ownership mitigates earnings management.
H17 states that there is a negative relationship between a high proportion of managerial
ownership and earnings management in Jordanian industrial firms, and H20 assumes that
there is a negative relationship between blockholder ownership of 5% or more and earnings
management level in Jordanian industrial firms. The results in Tables 6.7, 6.8 and 6.9 show
that blockholder ownership (BLOCKOWN) and managerial ownership (MANOWN) are
insignificant in all of our models. These variables, however, have been found to be significant
in other studies such as Dechow et al., (1996) for BLOCKOWN, and Yang et al., (2008) for
MANOWN.

Chapter Six: Secondary Data Analysis, Findings and Discussions
194
As mentioned earlier, state ownership (government ownership) is the smallest ownership
concentration in Jordanian industrial firms (Tables 6.3 and 6.4 show that the average state
ownership is less than 7%). Most prior studies have found that high proportions of state
ownership relate negatively to earnings management practices. For example, Wang et al.,
(2011) documented that state ownership negatively affected earnings management practices
in China. Jones and Modified Jones’ models have been used to measure earnings
management, following the approach of Francis et al., (1999). The empirical results for this
study showed a reduction in the level of earnings management in state-owned firms. They
also indicated that the protection of state-owned firms might lead to reducing managers’
discretion in managing firms’ earnings. Accordingly, H16 assumes that there is a negative
relationship between high proportions of state (government) ownership and earnings
management in Jordanian industrial firms. The results in Tables 6.7, 6.8 and 6.9 show that the
relationship between state ownership (STATOWN) and EM is also insignificant in all of our
models. These results are consistent with those from Alfaraih et al., 2012, Wang et al., 2011
and Omran et al., 2008, who also found no relationship between earnings management and
state ownership.
Overall, we found that the PPY model has more powerful results when comparing for the
difference in means among different EM groups in our case. This conclusion may not be
surprising since the PPY model was developed in the UK and the Jones model in the US.
There are similarities in the financial systems of Jordan and UK as Jordan was under UK
mandate until the middle of the last century and followed the British financial system until
1973.

Chapter Six: Secondary Data Analysis, Findings and Discussions
195
6.5.2 Discriminant Analysis (Multivariate Analyses)
In this section the discriminant analysis is used to test the relationships between internal
control, corporate governance mechanisms and earnings management across the groups
detailed earlier. Discriminate analysis is defined in the literature as a regression used
statistical technique to classify a categorical outcome variable in a group or particular
classification based on its characteristics (Pardoe, Yin and Cook, 2007).
Huberty (1984) stated that there are problems related to determining which type of
discriminant analysis should be used; these are variables separation and classification.
Huberty (1984) documented several issues that are associated with the use and interpretation
of discriminant analysis:
• Distinguishing between a linear discriminant function and a linear classification
function.
• Misusing stepwise discriminant analysis programs.
• Ordering variables and selecting variable subsets.
• Choosing a classification rule.
• Estimating true classification hit rates.
• Assessing classification accuracy.
• Examining and using classification results.
Quadratic discriminant analysis (QDA) is considered one type of discriminant analysis type,
since there are two main types of discriminant analysis available: linear discriminant analysis
(LDA) and quadratic discriminant analysis (QDA). Quadratic discriminant analysis (QDA) is
a generalisation of linear discriminant analysis (LDA) that was introduced by Smith in 1947.
“Quadratic discriminant analysis (QDA) extends LDA by allowing the intraclass covariance
matrices to differ between classes, so that discrimination is based on quadratic rather than on
linear functions of X. With QDA, however, there are no natural canonical variates and no
general methods for displaying the analysis graphically. When there are just two feature
variables, it is possible to visualize the quadratic classification regions in a scatterplot, but
there is no clear extension to analyses with three or more features” (Pardoe et al., 2007) (page
172).
The main assumption underlying both LDA and QDA is that the observations come from a
multivariate normal distribution. However, whereas LDA suggests that the groups have equal

Chapter Six: Secondary Data Analysis, Findings and Discussions
196
covariance matrices (EM residual values), QDA relaxes this assumption, allowing the groups
to have different covariance matrices (STATA 13, 2014). Accordingly, based on our
observation of the research data of EM residual values (See appendix 3), the QDA method
was adopted to test the hypotheses of this research.
A typical method to manage classification problems is QDA, which represents the probability
of each class as a Gaussian distribution, then uses the subsequent distributions to assess the
class for a given test point (Friedman, Hastie and Tibshirani, 2001).
In this research, quadratic discriminant analysis is used to define the differences between
several known groups and utilises those differences to classify research observations in those
groups. The group centroid is reached by comparing the distribution of the discriminant
scores for the HI+veEM, HI-veEM, and Low EM groups. If the overlap in the distribution of
these groups is small, the discriminant function splits the groups well. However, if the
overlap in these groups is large, then the discriminant function is a poor discriminator
between the groups (Joseph, Rolph, Ronald and William, 1995). The discriminant function is
listed as follows:
Likelihood of belonging to group 1, 2 or 3 = 𝑓𝑓 {BSIZE, BMEETING, BOUTSIDE, BINDEPEND,
ACSIZE, ACMEETING, ACINDEPEND, ACEXPERTISE, EXAREPUT, EXATENURE, EXAOPIN, EXACHANG,
MANOWN, IOWNFOR, IOWNLOC, INDOWNF, INDOWNL, FAMOWN, BLOCKOWN, STATOWN, FSUB, FLVE,
ROA, CFOA}.
Where
Group 1 = firms with low EM
Group 2 = firms with high negative EM
Group 3 = firms with high positive EM
BSIZE = Board of Director Size,
BMEETING = Number of the Board of Directors,
BOUTSIDE = Board of Director Outsiders,
BINDEPEND = Board of Director Independence.
ACSIZE = Audit Committee Size,
ACMEETING = Number of Audit Committee Meetings,
ACINDEPEND = Audit Committee Independence,
ACEXPERTISE = Audit Committee Expertise.

Chapter Six: Secondary Data Analysis, Findings and Discussions
197
EXAREPUT = External Auditor Reputation,
EXATENURE = External Audit Tenure,
EXAOPIN = External Audit Opinion,
EXACHANG = External Audit Change.
MANOWN = Managerial Shareholders,
IOWNFOR = Institutional Shareholders Foreign,
IOWNLOC = Institutional Shareholders Local,
INDOWNF = Individual Foreign,
INDOWNL = Individual Local,
FAMOWN is Family Ownership,
BLOCKOWN = Blockholder Ownership,
STATOWN = State Ownership.
FSUB = Firm Subsidiary,
FLVE = Financial Leverage,
ROA = Firm Performance,
CFOA = Cash Flow from Operating Activities.
The results for the quadratic discriminant analysis applied to the SJ model are presented in
Table 6.10; results for the MJ model are presented in Table 6.11, and Table 6.12 shows the
results for the PPY model. Prior probabilities established for the EM groups are as follows,
Low, 50%; HI+veEM, 25% and HI-veEM 25%, based on observation of the distribution of
the EM variables (see appendix 3). Table 6.10 shows that classification accuracy is high,
especially in the Low EM (86.03%) and HI+veEM (75%) groups, and the overlap between
these two groups is small, which means that the model discriminates well between these
groups. The classification accuracy for all groups is higher than would be expected by
chance. These results are consistent with the t-test results for the SJ model, shown in Table
6.7, which show that the differences in the means between groups HI+veEM/Low EM and
HI±veEM/Low EM are more significant than the differences in means between the HI-veEM
and Low EM groups.
As for the MJ model, Table 6.11 demonstrates that classification accuracy is high in all
groups (78.36% in Low EM, 71.64% in HI-veEM and 86.07% in HI+veEM) and significantly
greater than would arise by chance. These results are supported by the t-test results for the MJ
model shown in table 6.8. Furthermore, results for the MJ model reported in Chapter three

Chapter Six: Secondary Data Analysis, Findings and Discussions
198
also show the MJ model to be a better fit for the companies than the SJ model. Table 6.12
also shows that classification accuracy is higher for firms in the PPY model than SJ/MJ
model, in the HI-veEM (82.11%) and HI+veEM (78.95%) groups, and the overlap between
these two groups is small. These results are also consistent with the t-test results for the PPY
model (in Table 6.9). On the other hand, the Low EM group’s results for the PPY model
reveals that the classification accuracy is below that which could be expected by chance
(41.58%), which means that this group overlaps the other two groups (the model classifies
35% of the Low EM firms as HI-veEM and 24% of the Low EM firms as HI+veEM).
Table 6-10 Quadratic Discriminant Analysis SJ Model Sample
Model Classification EM Group Low H-EM H+EM Total
Low 117 86.03%
7 5.15%
12 8.82%
136 100%
H-EM 25 36.76%
35 51.47%
8 11.76%
68 100%
H+EM 17 25.00%
0 0.00%
51 75.00%
68 100%
Total 159 58.46%
42 15.44%
71 26.10%
272 100%
Priors 50% 25% 25% Table 6-11 Quadratic Discriminant Analysis MJ Model Sample
Model Classification EM Group Low H-EM H+EM Total
Low 105 78.36%
10 7.46%
19 14.18%
134 100%
H-EM 10 14.93%
48 71.64%
9 13.43%
67 100%
H+EM 8 11.94%
2 2.99%
57 86.07%
67 100%
Total 123 45.90%
60 22.39%
85 31.72%
268 100%
Priors 50% 25% 25% Table 6-12 Quadratic Discriminant Analysis PPY Model Sample
Model Classification EM Group Low H-EM H+EM Total
Low 79 41.58%
66 34.74%
45 23.68%
190 100%
H-EM 1 1.05%
78 82.11%
16 16.84%
95 100%
H+EM 2 2.11%
18 18.95%
75 78.95%
95 100%

Chapter Six: Secondary Data Analysis, Findings and Discussions
199
Total 82 21.58%
162 42.63%
136 35.79%
380 100%
Priors 50% 25% 25%
Overall, based on the results of Tables 6.10, 6.11 and 6.12, we found that the MJ model
sample results had the best classification accuracy in all groups; Low EM, HI-veEM and
HI+veEM.
We compare the results from the quadratic discriminant analysis on the four types of
variables used in the MJ sample model, each analysed separately; [(1) board of directors’
characteristics, (2) audit committee characteristics, (3) external auditor factors, and (4)
ownership structures] to show which of these has the most effect on earnings management
levels.
According to the results in Table 6.13 (Panel D), ownership structures have the most effect
on earnings management in Jordanian industrial firms, and the classification accuracy is high
for HI+veEM group (73.13%) and Low EM (68.66%). In contrast, Table 6.13 (Panel D)
shows that ownership structures are less powerful in identifying HI-veEM since the
classification accuracy for HI-veEM is 38.81%.
The classification accuracy results in Table 6.13 (Panel A) show that board of directors’
characteristics are less effective in identifying the EM groups and tend to under estimate the
level of EM in the sample. This means that the classification accuracy for Low EM firms is
high (78.36%). This result is consistent with Table 6.8 results which documents that board of
director characteristics are associated with Low EM firms on the basis of t-tests.
A similar pattern is also found in the audit committee characteristics and external auditor
factors. Table 6.13 (Panel B and Panel C) indicate that these variables also tend to under
estimate the level of EM and classifies too many firms in the Low EM group. These findings
are also consistent with the t-test results in Table 6.8. Finally, the results show that ownership
structure has a greater effect on EM than the other categorised variables.

Chapter Six: Secondary Data Analysis, Findings and Discussions
200
Table 6-13 Quadratic Discriminant Analysis Board of Directors Characteristics, Audit Committee Characteristics, External Auditor Factors and Ownership Structures (MJ Model Sample)
Board of Directors Characteristics (Panel A) Audit Committee Characteristics (Panel B) Model Classification Model Classification
EM Group Low H-EM H+EM Total EM Group Low H-EM H+EM Total Low 105
78.36% 14
10.45% 15
11.19% 134
100% Low 112
83.58% 6
4.48% 16
11.94% 134
100% H-EM 33
49.25% 32
47.76% 2
2.99% 67
100% H-EM 36
53.73% 25
37.31% 6
8.96% 67
100% H+EM 33
49.25% 10
14.93% 24
35.82% 67
100% H+EM 38
56.72% 4
14.93% 25
37.31% 67
100% Total 171
63.81% 56
20.90% 41
15.30% 268
100% Total 186
69.40% 35
13.06% 47
17.54% 268
100% Priors 50% 25% 25% Priors 50% 25% 25%
External Audit Factors (Panel C) Ownership Structures (Panel D) Model Classification Model Classification
EM Group Low H-EM H+EM Total EM Group Low H-EM H+EM Total Low 112
83.58% 7
5.22% 15
11.19% 134
100% Low 92
68.66% 8
5.97% 34
25.37% 134
100% H-EM 34
50.75% 26
38.81% 7
10.45% 67
100% H-EM 20
29.85% 26
38.81% 21
31.34% 67
100% H+EM 40
59.70% 5
7.46% 22
32.84% 67
100% H+EM 17
25.37% 1
1.49% 49
73.13% 67
100% Total 186
69.40% 38
14.18% 44
16.42% 268
100% Total 129
48.13% 35
13.06% 104
38.81% 268
100% Priors 50% 25% 25% Priors 50% 25% 25%

Chapter Six: Secondary Data Analysis, Findings and Discussions
201
Overall, the significant findings and high levels of classification accuracy in the Quadratic
Discriminant Analysis support the approach taken in constructing the Earnings Management
variable as a three-way classification to represent firms with virtually no EM, firms with
significant income-increasing EM and firms with significant income-decreasing EM. The
expected proportions of 50% in the first category and 25% in each of the latter two categories
also appears to hold true for all of the EM estimates generated by the Modified Jones,
Standard Jones and PPY models, which give us more confidence that the approach is
appropriate.
6.6 Chapter Summary
The main aim of this chapter is to examine the effect of internal control and corporate
governance mechanisms on earnings management levels in Jordanian industrial firms.
However, the relatively smaller sample size implies limitations in the modelling process. One
implication is that any potential outlier would result in a disproportionate effect on the
empirical findings. Furthermore, analysis of the data reveals multicollinearity between
variables, and heteroskedasticity in OLS error terms (see appendix 4), implying that OLS
regression may not be an appropriate model to apply for empirical analysis.
There are several weaknesses in empirical results in our study such as, the fact that the
samples are small, which means that outlying observations may have a disproportionate
effect on the results and that samples are less likely to be representative. In addition, analysis
of the variables indicated the presence of multicollinearity between variables, and
heteroskedasticity in OLS error terms (see appendix 4), which meant that OLS regression was
not an appropriate technique to analyse this data. In addition, the results from the accruals
models were not particularly strong. Previous studies have tended to classify the EM
variables in a dichotomous way, representing firms with income-increasing and income-
decreasing EM. Examination of the EM estimates from our models indicated that this would
be a poor description of the variables (see section 6.2) and so we used a three-way
classification (high positive earnings management, high negative earnings management and
low earnings management) to represent the distribution of this variable. Therefore, we have
decided to use a three-way classification (high positive earnings management, high negative
earnings management and low earnings management) to represent the distribution of this
variable. Doing so has also enabled us to employ t-tests and discriminant analysis to
investigate the relationship between the variables by using the internal control and corporate

Chapter Six: Secondary Data Analysis, Findings and Discussions
202
governance variables to predict the effect they have on the different earnings management
groups.
Of all the models tested, the PPY model is better in capturing the relationship of earning
management with the relevant explanatory firms’ characteristics variables. For example,
board size and numbers of outsiders of the board are all significantly and positively related
with earnings management, particularly in groups H+EM/Low EM, H-EM/Low EM and
H±EM/Low EM (see Tables 6.7 and 6.8). Audit committee characteristics (audit committee
size, number of audit committee meeting and audit committee expertise) are also positively
related with earnings management groups (See Table 6.9).
Our research also found external auditor opinion to be a reason for the prevalence of earning
management practices. This is revealed by the SJ model, showing external auditor opinion to
be significantly and negatively related with earning management. As for the MJ/PPY models,
external auditor opinion is shown to have a significantly positive relationship with earning
management.
Several types of ownership structure were found to be significant explanatory variables for
the different earning management groups. These are the managerial ownership, local
individual ownership and family ownership. The other types of ownership structure do not
present significant relationships with earnings management. A plausible explanation for these
results could be the weakness of investment regulations, which do not ensure protection for
the investors where firms may be less focused on external equity market investors. Another
reason may be that the corporate governance code in Jordan has only recently been adopted,
which means there are still some weaknesses in this code. Finally, problematic nature of
earnings management models for calculating earnings management values could be another
potential reason.
In the quadratic discriminate analysis (QDA), we found that ownership structure affected
earnings management more than board of directors’ characteristics, audit committee
characteristics and external auditor factors. Firm characteristics are better at classifying EM
estimates from MJ model then those from the other models. These results combined with
strong results for MJ model reported in chapter five suggest that the MJ model is strong to
represent the nature of EM in Jordanian industrial firms.
For the PPY model, the classifications using firm characteristics tend to overestimate the

Chapter Six: Secondary Data Analysis, Findings and Discussions
203
amount of EM and the QDA classifies too few firm-years in the Low EM category.
However, the PPY estimates are more clearly related to firm characteristics when looking at
each variable in isolation (in the t-tests), but when variables are all combined together and
interaction is allowed, the firms’ characteristics classify the MJ estimates of EM more
accurately.
The next chapter discusses findings from the interviews conducted with the companies
underlying the sample. Many of the issues identified in the secondary data analysis in this
chapter were identified for further exploration in the interviews, which are reported in the
next chapter.

Chapter Seven: Analysis of Interviews
204
7. Chapter Seven: Analysis of Semi-structured Interviews
7.1 Introduction
The analysis in the previous chapter was based on secondary data (financial data) focusing on
measurable variables to explore the association between corporate governance mechanisms in
constraining earnings management in Jordanian industrial firms.
This chapter concentrates on factors that are less easy to measure by presenting the analysis
of semi-structured interviews. These interviews were used to acquire in-depth information in
order to explore several components of internal control and corporate governance issues that
were not covered in the empirical chapter such as, the effect of legal and taxation systems on
earnings management. In addition this chapter explains some subtle and complex issues that
affect firms in the Jordanian context.
The semi-structured interviews were conducted with general managers, financial managers
and internal audit managers in the firms. Interview questions explored with them the
following areas:
- The nature of their roles and the suitability for them.
- The structure of internal controls and corporate governance in their firms.
- Relationship between senior managers.
- The “ financial school of thought” adopted in the firm (See section 6.5.9 for an
explanation of this area)
- Relationship with shareholders and external auditors.
- The ownership structure.
- Attitude towards earnings management.
- Specific accounting policies applied to achieve earnings management.
- The effects of contextual factors such as, the legal and taxation system and the effect
of financial crisis.

Chapter Seven: Analysis of Interviews
205
- The effect of cultural factors such as, tribal system; the influence of powerful
families.
The analysis of semi-structured interviews enable us to answer some questions and explain in
more depth a number of issues that arose in the quantitative analysis presented in chapter
five. In addition, the semi-structured interviews provided contextual explanations within
which to interpret the quantitative results. The interview firms were selected with reference to
the EM estimates from the accruals models in chapter five to provide firms that were
representative of a range of different EM estimates, including those with high positive EM,
high negative EM and Low EM.
This chapter is divided as follows; section 7.2 provides descriptive statistics about the
interviewees. Section 7.3 presents detailed analysis of the semi-structured interviews and
discussion. Section 7.4 shows the limitations that faced the researchers while conducting the
semi-structured interviews. Finally, section 7.5 presents a chapter summary.
7.2 Descriptive Statistics Based on Interviewees’ Information The semi-structured interviews were conducted with managers from 12 Jordanian industrial
firms (a total of 16 interviewees, since four firms insisted the two interviewees) the firms
were selected based on factors which suggested the level of EM (the standardized prediction
errors from the accruals models) and Amman stock market classification (first market, second
market or third market) as shown in the methodology chapter. The length of these interviews
ranged between 60 and 150 minutes. Table (7.1) provides the interviewees’ characteristics,
e.g. qualifications, years of experience in the sample firm and years of prior experience. The
12 firms constituted 31% of the SJ/ MJ model sample and 21% of the PPY model sample.
The most interviews were conducted with interviewees who occupied the position of
financial manager (44%), financial and administrative manager (19%) and internal audit
manager (19%). Furthermore, most of the interviewees held bachelors and masters degrees in
accounting (56% and 38% respectively). Five interviewees held Jordanian Certified Public
Accounting qualifications (JCPAs), and one interviewee held an American CPA
qualification, which equated to 31% and 6% respectively.

Chapter Seven: Analysis of Interviews
206
Table 7-1 Interviewees Information
NO Firm Reason for Inclusion Interviewee Position Qualification Professional Certificate
Interviewees’ Experiences Firm
Prior Experiences
1
JPM High Positive EM Financial Manager B.A in Accounting JCPA 5 years 11 years
JWI High Positive EM Financial and Administrative Manager
B.A in Accounting N/A 20 Years 15 Years
2
AAI High Negative EM Financial Manager B.A in Accounting N/A 1.5 years 22 years
JIR High Negative EM Financial and Administrative Manager
MSc in Accounting N/A 10 Years 11 Years
3A
GMC Low EM Financial Manager B.A in Accounting N/A 12 years 10 years
GMC Low EM Internal Auditor Manager
MSc in Accounting JCPA 10 Years 20 Years
3B
P&C Low EM Financial Manager MSc in Accounting N/A 3 years 6 years
P&C Low EM Internal Auditor Manager
MSc in International Financial Business
N/A 1 Years 11 Years
4
UAI Low EM Financial Manager B.A in Accounting N/A 7 years 3 years
TRA Low EM Financial and Administrative Manager
B.A in Accounting N/A 10 Years 1 Years
5 MID Moved Down from First Market to Second Market
Financial Management Manager
MSc in Accounting N/A 8 Years 25 Years

Chapter Seven: Analysis of Interviews
207
NO Firm Reason for Inclusion Interviewee Position Qualification Professional Certificate
Interviewees’ Experiences Firm
Prior Experiences
6
JWM Moved Up from Second Market to First Market
General Manager B.A in Accounting N/A 25 Years 24 Years
JWM Moved Up Down from Second Market to First Market
Financial Manager B.A in Accounting JCPA 22 Years 20 Years
7 PHO Firm always in the First Market Executive Financial Manager
MSc in Accounting JCPA 30 Years 10 Years
8
POT Moved Down from First Market to Second Market after IFRS Adoption
Internal Auditor Manager
B.A in Accounting CPA 3 Years 15 Years
POT Moved Down from First Market to Second Market after IFRS Adoption
Financial Manager MSc in Accounting JCPA 5 Years 10 Years
Regarding interviewees work experience, more than half of the interviewees had long periods of work experience in their current positions; 25%
had 10–15 years, and 25% had 16 years or more. More than 80% of interviewees had had long periods of experience in their previous positions -
50% had 10 – 15 years, and 31% had 16 years or more. These findings suggest that interviewees were well qualified to provide appropriate
information to the interviewees since more than 90% of them held accounting degrees and more than 50% of them had high levels of experience.

Chapter Seven: Analysis of Interviews
208
7.3 Semi-structured Interviews: Analysis and Discussion
The semi-structured interviews were selected to represent the different groups identified by
the accruals models (high positive EM, high negative EM and Low EM) and the firms’
positions in Amman stock market, since previous research suggested that movement between
markets could be associated with EM. The semi-structured interviews therefore cover firms
moving between markets and firms that remained in one market throughout our study.
• Two firms have high positive EM results.
• Two firms have high Negative EM results.
• Four firms have Low EM.
• One firm moved down from first market to second market
• One firm moved up from second market to first market.
• One firm always in the first market.
• One firm moved down from first market to second market after IFRS adoption.
The information gathered from the semi-structured interviews was then analysed to determine
whether there were differences between firms with different level of EM, movement up and
down markets, and IFRS adoption. In case of market status and IFRS adoption firms, this
research studied them from qualitative perspective.
The following sections analyse specific characteristics of the semi-structured interviews
including the financial objectives, corporate governance structure, corporate governance and
internal control mechanisms (including board characteristics, audit processes, management
structure, business operations, financial accounting process), managers incentives to manage
profit, cultural factors, financial crises, different approach to accounting system, taxation
system, bad debt provisions, external and internal auditors, and ownership structure.
7.3.1 Interviewees Primary Financial Objectives
Jordanian industrial firms, like any other firms, were all established to achieve certain
financial objectives; however, there was some debate amongst our interviewees about the
main financial objectives of these firms. Accordingly, we found that these firms have several
financial objectives they are attempting to achieve, and these are:

Chapter Seven: Analysis of Interviews
209
• Staying in the first market or moving up to the high market.
• Achieving more profit growth.
• Retaining shares in the Jordanian market.
“Our main objective is achieving more profit to increase shareholders’
growth, and keeping our shares in Jordan’s market and trying more and more
to increase ….. Our share prices, which brings in more investors, and this is
another one of our targets: to attract more investors.” (Financial manager,
Firms 1)
• Provide financial advice to the firm as a whole.
• Controlling all financial transactions.
• Applying all financial policies as received from upper management.
• Avoiding any conflict with government regulation.
“The financial objectives of this firm are to make sure that people are clear
on the fact that we are here not to achieve profit and avoid loss, but to work as
financial advisors for the firm. The main aim in my firm is to carry out any
work, and my personal policy is to oversee the work. There is a common
misapprehension that people believe about us, which is that our aim is to
achieve profit and avoid the loss.” (Financial manager, Firm 2)
• Increasing firms’ capitalisation by increases by equity or debt.
• Increasing the firm’s assets by attracting investment.
“In terms of increasing our capitalisation, one of our most important
objectives is to be the best firm on the market (I mean Amman, and foreign
markets such as Egypt, since Egypt has a strong industrial sector). Another
objective is increasing Jordan’s economy by attracting more investors, which
means more money in Jordan.” (Financial and administrative manager, Firm
1)
• Contributing to Jordan’s economic growth.

Chapter Seven: Analysis of Interviews
210
• Decreasing the unemployment rate.
• Hiring and supporting members of local society, this in turn leading to more growth
for Jordan’s economy by decreasing the unemployment rate. For example, making
donations to the council of the town in which the firm is situated, and hiring some
local people (e.g. as security guards).
• Increasing employees’ salaries to encourage productivity.
• Reaching break-even point.
“Another aim is to reach the point of breaking even.” (Financial Management
Manager, Firm 5).
• Paying less interest on loans in according to principle of Islamic finance.
“We did not pay any loan interest from 2007 to 2011 [because we did not take
any loans]. This is the main objective; to remain free from (REBA1)”.
(Financial and Administrative Manager, Firm 4)
Accordingly, financial objectives could be a motivation for the managers to manipulate their
earnings management to achieve their desirable incentives, which corresponds with previous
studies (see chapter 3, section 3.4). For example, Healy (1985) found that the managers
engage in earnings management to increase a firm’s profit to increase their compensation and
bonuses. In another example, Louis (2004) showed that the firms’ managers increased their
earnings in the period preceding a stock swap announcement to attract more investors.
Based on the in-depth interviews, several obstacles seem to be faced by the upper
management in these firms in trying to achieve their financial objectives. These obstacles
may result in managers using EM techniques to achieve their financial objectives (see e.g.
Chen et al 2009; Laux and Laux, 2009).
“I think there is no way to avoid these obstacles, since all of them are out of
our hands. I suppose that there is one way to avoid these obstacles, which is
by managing firms’ accounts. (Financial Manager, Firm 1)
1 In Islam, any banking interest is considered REBA, which refers to interest and is prohibited.
Chapter Seven: Analysis of Interviews
211
The most commonly cited obstacles were documented in our interviews, economic
circumstances such as increases in the prices of raw materials, increasing petrol prices,
increasing minimum wages for employees (although this last point was contradicted by the
interviewee from firm 1). Political circumstances (e.g. revolutions) in the area that affect
these firms’ work and profits, such as the Syrian, Egyptian, Libyan and Yemeni revolutions.
Government legislations such as increasing tax rates over time and increasing customs fees
and financial crises, such as in 2008. In this regard, the statement below was provided to
explain these obstacles.
“ ….. Increasing several utilities expenses, political circumstances, financial
crisis in 2008, and government regulations affected our business negatively,
by more than 70%. For example, our government creates new roles daily
[They do not have obvious objectives, and every government employee works
as it suits him/her.” (Financial Manager, Firm 6), (Executive Financial
Manager, Firm 7)
Other difficulties mentioned by interviewees include explanations which are economic,
regulatory or cultural:
1 Delays and obstacles in issuing production licences (e.g. mining licence).
“We spent a long time waiting to get the licence from the government to start
our work, and this led most of the investors to leave to other countries”.
(Financial manager, Firm 3A)
2 Increasing corporate tax rates.
“…. a lot of firms have started thinking about leaving this country to invest
in other countries that offer them lower tax rates and more services.”
(Financial and Administrative Manager, Firm 1)
3 The tribal system in Jordan.
“The most important problem is the tribal system in Jordan, since we are
working in XXX area [and the Sheikh of this area, from time to time, asks us
to promote someone from his tribe to a high position in our firm, and if we do
not listen to him]… I think the effects this will eventually have on our

Chapter Seven: Analysis of Interviews
212
manufacturing will eventually be disastrous.” (Executive Financial Manager,
Firm 7)
Perceived favouritism in recruitment decisions is an issue considered one of the
biggest obstacles that affect Jordanian industrial firms (referred to by the interviewee
below as nepotism)
“Nepotism is considered a disastrous issue that affects our financial
objectives… I hate it! Sometimes we hire people that are not qualified, just
because they are related to someone who has a high position in our country
or our firm.” (Financial manager, Firm 2)
4 Inappropriate barriers to competition between firms including bribery and corruption
described by interviewee below as “Wasta”
“There are several firms that are similar in production, however, in fact we
are the only firm who’s records are fully transparent to the trade ministry,
while other firms have Wasta1 and avoid having their records inspected by the
trade ministry.” (Financial and Administrative Manager, Firm 4)
During our discussions with interviewees, we found that some managers manipulated their
accounts to avoid these obstacles - these results are consistent with several previous studies
that found firms engaged in earnings management to avoid obstacles that prevented them
from achieving their financial objectives, such as: Louis et al (2005), DeAngelo (1988), and
Healy (1985). The statements below provide support for these results and demonstrate that
EM is institutionalised in Jordanian firms and openly acknowledged as fact of life.
“Come on, you are accountant and we know that every accountant has
experience of avoiding these obstacles, for example by using loopholes in the
tax system. For example, some of our products are excluded from tax, so
while that is in effect we stop making other products and concentrate on this
type of product. There is more I could tell you.” (Financial Management
Manager, Firm 5), similar statements also were provided by (Executive
Financial Manager, Firm 7) and (Financial and Administrative Manager, Firm
4)
1 Wasta is nepotism or favouritism.

Chapter Seven: Analysis of Interviews
213
Based on these comments, we concluded that managers in Jordan engage in earnings
management in order to avoid several obstacles that might prevent them from achieving their
objectives and that such behaviour is widely accepted and normalised within Jordanian firms.
7.3.2 Corporate Governance Structure In this section, we discuss the nature of corporate governance in Jordan based on the analysis
of the interviews. First and foremost, some of the interviewees defined the corporate
governance structure as the relationship between shareholders, the board of directors, and the
firm’s managers.
“The corporate governance structure is the relationship between
shareholders, the board of directors and other stakeholders, and involves
controlling the firm in a way that allows it to achieve the desired objectives,
such as increasing shareholders’ wealth and being the best firm amongst our
competitors.” (Financial Manager, Firm 1)
This definition is consistent with the definitions found in the literature, which means that the
managers in Jordanian firms understood the corporate governance structure and its roles in
the same way as those in other areas. Sternberg (2004) defined corporate governance as the
methods firms use to achieve the objectives of shareholders by directing the corporation’s
transactions, agents and assets. A strong corporate governance structure must organise and
consider the relationship between the firm environment and its employees, and ensure that the
relationship between past and present employees, as well as those between the firms and its
customers and suppliers, are good, in addition to which they must ensure all these
relationships comply with the legal system and government regulations. One of the
interviewees identified two dimensions of corporate governance as follows;
“There are two types of relationship, and these are:
• The relationship between shareholders and top management used to
deal with financial transactions, e.g. controlling all financial
transactions within the firm based on accounting standards (IFRS).
• The other relationship is also between shareholders and top
management and deals with authority and disclosure issues, since both
of them have to comply with Jordanian corporate governance law.”
(Financial Manager, Group Firm 1)

Chapter Seven: Analysis of Interviews
214
The firms followed two types of policies for organising the relationships between
shareholders and top management and complying with regulations.
“Every manager in our firm is responsible for organising the relationship
between the managers and shareholders and complying with firm policies,
based on two groups of policies: (1) general policies for the firm that have
been established by the board of directors, and (2) policies created by
government bodies, such as Jordan’s food and drugs administration policies
(JFDA). (Financial Manager, Firm 1)
According to the 1997 Company Law (and mandates of 2002) and Khoury’s 2003 study,
corporate governance structures in Jordanian firms consist of six areas: disclosure and
accounting standards, legislative framework and government oversight, transparency in
privatisation, the capital market, effective supervision of the board of directors, preservation
of property rights and protection of minority rights. During the interviews, most of the
managers stated that they are compliant with all corporate governance policies. One stated his
firm was compliant in these six specific areas.
“In general, corporate governance in Jordan is a new phenomenon… And
the Jordan securities commission has issued guidance for organising
corporate governance in Jordan BUT this guidance does not make it
compulsory for Jordanian industrial firms to apply all corporate governance
roles… Jordanian industrial firms have to disclose in their annual financial
reports everything that they do not comply with. Our firm is committed to all
corporate governance roles that have been issued since the financial crisis in
2008 in cooperation with IFC (International Financial Committees in
developed countries). This in turn leads to an increase in the financial
statements’ transparency and credibility… And still these corporate
governance roles, as I understand it, are changeable.” (Internal Audit
Manager, Firm 8)
In contrast, the rest of our interviewees just described the basic overview of corporate
governance structure: shareholders, board of directors, general manager, and department

Chapter Seven: Analysis of Interviews
215
managers. Figure (7.1) below shows corporate governance structure based on the
interviewees’ information.
Figure 7-1 Corporate Governance Chart for Jordanian industrial firms
We also found out that one firm does not have an internal audit department (this issue
discussed in section 7.5.4.1). Furthermore, there are some firms that do not have audit
committees or nomination committees even though these are the requirements according to
the corporate governance code.
• “We do not have an audit committee or a nomination committee… Do
not ask me why!” (Financial and administrative manager, Firm 2)
Consequently, the absence of an audit committee in the firm is considered a huge opportunity
for the managers to manipulate their earnings to reach their incentives and this is supported in
the prior literature (e.g. Abbott et al., 2000; Baxter et al., 2009; Bedard, et al., 2004;
Davidson et al., 2005; Xie et al., 2003) which states that the weaknesses in audit committee
responsibilities are related to high earnings management.
On the other hand, we noticed that two of the twelve firms do have the properly constituted
committees as stipulated in the Jordanian corporate governance code.
“We have financial and administration committees, and also we have an audit
committee, selected by the board of directors, and I am the one who presents
all the financial reports to the audit committee directly. Administratively, I
Shareholders
General Manager
Department managers such as; • Financial Manager • Administration Manager • Technical Manager • Sales and marketing Manager
• Nomination Committee
• Audit Committee
Board of directors

Chapter Seven: Analysis of Interviews
216
have a direct relationship with the general manager.” (Internal Audit
Manager, Firm 8) and (Financial manager, Firm 2)
The presence of a more complicated corporate governance structure may be due to the size of
these two originations. These two large firms belong in the mining industries, which are the
flagship industries of the Jordanian economy.
7.3.3 Corporate Governance Mechanisms This section discusses several characteristics of corporate governance from the point of view
of financial managers and internal audit managers. The purpose of this section is to increase
the understanding of the main characteristics of a board of directors that are likely to practice
earnings management.
7.3.3.1 Boards of Directors
Characteristics of the Boards of Directors
Based on our semi-structured interviews analysis, we observed that the members of boards of
directors are qualified in some firms, and unqualified in others. Our analysis classified the
board into two groups on the basis of the qualification.
Group (A) includes firms whose boards of directors were qualified. In this group, most of the
managers stated that the board members were specialists and elected in according to
corporate governance law.
“Our board of directors consists of specialists in accounting, economics and
pharmacy. And this board is considered the top level of management
structure, so no decision will be taken until it is approved by them. For
example, our chairman of the board is an accountant and graduated in 1967”
(Financial manager, Firm 1), other two managers have the similar statements;
(Internal audit manager, Firm 8) and (Financial and administrative manager,
Firm 2)
Group (B) includes boards of directors whose members are unqualified. In this group, most of
the managers stated that the board members were elected because they are shareholders or
because they have personal connections with other board members.
“Our board of directors is elected by the shareholders, and it is considered
the highest level in the management structure, behind only the shareholders.

Chapter Seven: Analysis of Interviews
217
You know, more than 75% of the board of directors of our firm are
shareholders and some of them unqualified.” (Financial manager, Firm 3)
and (Financial and administrative manager, Firm 1)
It does not always follow that unqualified directors have industrial or management experience
to compensate for their lack of qualifications, although this is sometimes the case. In other
instances directors are appointed with neither relevant qualifications nor experience. This
result is supported in the prior literature (e.g. Xie et al., 2003; Vafeas, 1999) that found the
weaknesses in the board of directors’ characteristics are more likely related to high earnings
management level (see chapter 4, section 4.6.1)
Board of Directors’ Roles
In this section, we summarise all the roles of boards of directors as perceived by the
interviewees in our interviews, which are as follows:
• Establishing financial and operational policies and procedures for the firm.
• Directing all the firm’s projects.
• Hiring and terminating the contract of the members of the audit committee and
executive committee, general managers and internal auditors.
• Controlling all financial, administrative and operational transactions and reporting to
shareholders.
• Reviewing and approving the firm’s annual estimated budget.
• Reviewing and approving the firm’s annual financial reports.
• Controlling the employee payroll.
• Arranging Annual General Meetings with shareholders.
7.3.3.2 Audit Committees Characteristics
A lot of earlier literature has indicated that the audit committee is considered the most
important committee that is put together by the board of directors, because of its role in the
firm (e.g. Saleh et al 2007, Mak et al 2006) as a policing function and to provide checks and
balances over management behaviour. In analysing our semi-structured interviews we

Chapter Seven: Analysis of Interviews
218
noticed that the audit committees in Jordanian industrial firms are often considered second
only to the boards of directors, and all of their members are qualified specialists in the fields
of accounting and finance. For example,
Statement (1)
“This committee is considered a strong committee in the firm, where it has
the right to manage the firm on behalf of the board of directors, particularly
when some of the board members are busy and cannot attend regular
meetings, and this committee is established by the board of directors.”
(Financial manager, Firm 1, similar statement has provided by (Financial
manager, Firm 3B)
Audit committees in Jordanian industrial firms play big roles in conducting the firms’
financial and operational work. Therefore we summarised all audit committee roles as
understood by the interviewees in our semi-structured interviews, and these are as follows:
• Preparing their audit plans based on International Audit Standards to mitigate any risk
that could arise in the future.
• Controlling and monitoring all financial and administrative transactions in the firm.
• Ensuring that the internal auditor is independent from the external auditor and there is
no relationship between them, since if there is any such relationship it may lead to
them dealing with each other in a manner that could affect the firm’s financial
position, e.g. by presenting inaccurate information.
• Preparing financial reports based on the International Accounting Standards.
• Allowing internal and external auditors to work together as efficiently as possible.
• Reviewing the internal control reports.
• Ensuring that the top management applies and follows through with all their
responsibilities.
• Establishing all strategies for the firm and presenting them to the board of directors.
• Preparing the sales and purchase planning.

Chapter Seven: Analysis of Interviews
219
• Determining which investment to make each year.
• Bringing in outside technical and/or financial specialists if required.
7.3.3.3 CFOs and CEOs Roles
Prior literature used the CFOs’ and CEOs’ incentives to explore the effect CFOs and CEOs
roles on earnings management. In 2002, as a results of the Enron crisis, the Securities and
Exchange Commission (SEC) stipulated that “the CEOs and CFOs in big public firms have to
certify the transparency of financial statements”; based on this Jiang et al (2010) and Caixing
et al (2008) documented that earnings management is lower in firms with better certified and
qualified CFOs and CEOs.
According to our research, the CFOs and CEOs in our sample firms are well qualified and
have substantial experience with nine of the sixteen interviewees having more than 20 years’
experiences. The following sections explore the main roles of each of them, as suggested by
the interviewees.
The Roles of CFO
• Applying financial policies that have been established by the board of directors.
• Ensuring the reliability and visibility of financial recourses.
• Preparing and reviewing financial reports and presenting them to the board of
directors.
• Providing financial advice to the board of directors, the internal auditor and the audit
committee.
The Roles of CEO
• Directing all the firm’s projects according to the policies and procedures that have
been established by the board of directors.
• Reporting to the board of directors and the audit committee.
• Attending Annual General Meetings.
• Controlling and monitoring all employees’ performance, and hiring and terminating a
contract of the employees.

Chapter Seven: Analysis of Interviews
220
In the context of CEO/CFO incentives, Bergstresser et al (2006) found that firms’ top
management and CEO compensation is related to stock value more than to earnings
management. Jouber et al (2010) found that CEOs in Canada and France who own stocks in
their firms have more incentive to manage their earnings downward. Furthermore, Fenga, Ge,
Luo and Shevlin (2011) documented that CFOs and CEOs do engage in managing their
firms’ earnings, but also that CFOs do this not for their personal benefits, but to achieve the
incentives of CEOs, since they are at the level that will allow them more power. Therefore,
the strong relationship between CFO and CEO is a condition that could potentially lead
financial managers to engage in earnings management.
“We are working together to achieve the firm’s objectives… I never ever say
no to the CEO, I always provide anything he needs.” (Financial and
administrative manager, Firm 4. Other three managers stated the same
statements (e.g. Financial manager, Firm 2; Financial and administrative
manager, Firm 2; Executive financial manager, Firm 7)
These quotations suggest that the roles of CEO and CFO are frequently not independent,
which increases the likelihood of EM occurring. This result is partially supported in our
secondary data analysis (QDA) (see section 6.5.2, Table 6.13). Furthermore, Table 6.3 and
6.4 indicate that more than 57% of those who chair the board of directors for the SJ, MJ, and
PPY samples occupy another executive position in the firm, and this might lead to an increase
in the probability of firms engaging in earnings management (Davidson et al., 2005; Peasnell
et al., 2000).
7.3.4 Characteristics of Internal Control System
Internal control and corporate governance mechanisms are considered to be one of the most
important issues that has an effect on earnings management practices in a firm (Xie et al
2003; Klein 2002; Dechow et al, 1996; Beasley 1996).
A firm’s financial resources can be protected from loss, fraud, waste and theft through
developing its internal control system to ensure that its financial data process is reliable. The
main purpose of internal control is to prevent any potential errors, mistakes or fraud that
might occur during the process of transactions and the preparation of financial statements,
which means that strong internal controls are more likely to increase the extent to which the
financial statements faithfully represent the business (Altamuro et al 2010; Gupta 2008;
Chapter Seven: Analysis of Interviews
221
Doyle et al 2007). Accordingly, our research paid attention to exploring internal control
systems in Jordanian industrial firms.
7.3.4.1 The Existence of Internal Audit Department
The existence of the internal audit departments of firms is considered one of the most
important corporate governance structures in Jordan, and the corporate governance code
stipulates that every firm has to have a separate internal audit department. The importance of
this department arises from the fact that it provides a large number of important services and
a great deal of information to its firm’s management, such as: evaluating and monitoring the
internal control system; ensuring that the firm is complying with its own policies and
government regulations, and detecting and preventing any deliberate falsification or errors.
Statement (1)
“There are several roles that are carried out by the audit department, such as
(1) matching the actual with the estimated budget and (2) determining the
deviation of all items in financial reports, such as sales, expenses and other
deviation… (3) Preparing SWOT analysis to determine if the firm is doing
things the right way, as established by top management… Finally, (4) if there
is a problem with any of the previous three points, we send a warning report
to top management that indicates the weakness that we are facing in order to
remedy them as soon as possible by using plan B.” (Financial manager, Firm
1), similar statements were provided by the financial and administrative
manager,( Firm 2) and Internal audit manager, (Firm 8)
The top management encourages the rest of the firm to consider the internal audit department
an important juncture which connects and organises all transactions and the separate parts of
the firm.
“Yes, we have a separate internal audit department in this firm, and we
consider this department a hub for all our transactions, whether financial or
operational, since it organises all our transactions and connects all of them
together.” (Executive Financial Manager, Firm 7)
Eleven out of twelve of the firms that took part in our research have separate internal audit
departments, and while the existence of an internal audit department in a firm is an indication

Chapter Seven: Analysis of Interviews
222
that this firm is complying with the corporate governance code, it does not necessarily follow
that this department is doing its job perfectly, for several reasons:
• Four of the internal audit departments in our interviews consist of just one auditor
who has to conduct and monitor all the firm’s transactions and ensure the efficient
operation of the whole system of internal controls.
“Yes, we have internal audit department and my colleague (xx) is the
manager and the only one in his department… He was only appointed
recently and before he came I was conducting my work as financial manager
in addition to internal audit manager work… This period was very hard since
I was in charge of two big departments in this firm.” (Financial manager,
Firm 3B)
• Weakness on the part of the internal auditor manager, caused by his not having a
relevant background and/ or not having sufficient experience of internal audit. The
interviewee below explained their internal auditor failed to provide sufficient
information for management decision making purposes.
Statement (1)
“…Unfortunately the internal auditor does not have to do that [I do not know
why]… I think this is for two reasons; our internal auditor’s background and
maturity… Sometimes the internal auditor makes his decision rather
arbitrarily.” (Financial manager, Firm 2) and (Financial manager, Firm 2)
• If there is no internal audit department in the firm this might lead firm managers to
use their discretion to achieve their incentives.
“At this moment we do not have an internal audit department… and we use
external office to do internal audit department work, and to be honest with
you this office does not understand the basic roles of auditing, BUT in the end
this is our board’s choice [we cannot go against them]… However, we (as top
management) do not allow this office to report to the board until we verify its
report to see if all our transactions are okay. [Sometimes we break some rules
to achieve what we are attempting to achieve in terms of the firm’s objectives.
For example, hiring and terminating employee contract without the board of

Chapter Seven: Analysis of Interviews
223
directors’ authorisation to reduce expenses and increase profit].” (Financial
and Administrative Manager, Firm 4)
These comments seem to suggest that in a number of firms the internal audit process is not
particularly effective in controlling the risk of managers pursing their own objectives.
7.3.4.2 The Main Reasons for Changing Internal Control Systems
Most of our sample firms had undergone a period of changing and developing their internal
control system in the recent past. This section documents the extensive debates that were
conducted in order to determine the main reasons that had led them to these changes. These
reasons are as follows:
• The adoption of IFRS can lead to improving a firm’s earnings quality. Based on a
sample of 353 French listed firms over the period of 2003 to 2006, Zéghal, Chtourou
and Sellami (2011) documented that the adoption of IFRS led to reductions in
earnings management particularly in firms that had good corporate governance.
“We changed our internal control system in the second half of 2007. The
main reason for this change was the adoption of IFRS.” (Internal Audit
Manager, Firm 8)
• The financial crisis in 2008 led several firms to change their internal control system
to avoid problems that might affect their financial positions. Habib et al (2013) found
that several firms managed their earnings downward during financial crises, and
particularly when they make losses. In addition, the financial crisis period
encouraged managers to manipulate earnings downward because they realised that
there would be no bonus for them and therefore they might as well bank the profit for
future years.
“….. After the financial crisis that occurred in 2008 we started to think deeply
about the benefits that internal control and internal audit systems would
achieve for our financial position.” (Financial manager, Firm 2), (Financial
and administrative manager, Firm 2), (Financial and administrative manager,
Firm 1), and (General Manager, Firm 6)
• Hiring a new internal auditor. One of the firms in our study did not have an internal
auditor, which meant it changed its internal control system by hiring one.

Chapter Seven: Analysis of Interviews
224
“We changed our internal control system recently because we hired a new
internal auditor.” (Financial manager, Firm 4)
Although the financial crises were a difficult time for the firms with respect to their
operations, the ensuing refection and self-examination by firms appears to have resulted in
positive changes to internal control system and improved the governance of the firms’
system.
7.3.4.3 Business Operations Controls
Operational controls in firms provide analysis of actual operations compared to the original
plans, budgets and corporate objectives. In addition, operational controls ensure that the
transactions have been carried out using the appropriate internal control policies. This in turn
leads to improvement in the performance for the firms (Cendrowski and Martin 2003).
According to our semi-structured interviews results, Jordanian industrial firms control their
operations by comparing actual and estimated business operations (e.g. productions) and they
use several strategies to do this comparison, which are as follows:
• Efficiency analysis.
“We are using efficiency analysis,1 which helps us to know where the exact
problem is that we might face during our work, and then we report to the
technical committee so they can fix this problem. In addition, this analysis is
considered very important for the production department, since it provides
this department with information such as when they should increase or
decrease their products. After we get the results from this analysis, we discuss
the results with the general manager and internal auditor, then report it to the
external auditor; finally, we submit our reports to the audit committee so they
can take their decision, and the audit committee always takes a positive
decision [The audit committee agrees with our report except if there is any
issue related to bad debt provision, in which case they investigate the
problem].” (Financial manager, Firm 2)
• Annual internal control plans.
1 Comparing the actual and estimated production levels of the firm

Chapter Seven: Analysis of Interviews
225
“We control our operational transactions based on annual internal control
plans for operating issues that are prepared according to international
auditing standards to avoid any risks that we might face. According to these
plans, we start to follow up every single item and determine if it has been
achieved as we planned. Based on these procedures, we start classifying risk
areas to avoid them in the future. In addition, we have a yearly
comprehensive internal control plan for all operational transactions.”
(Internal audit manager, Firm 8)
• Employees’ passwords and signatures.
“We can control each manager and employee’s work by using their password
and signature.” (Financial and administrative manager, Firm 1)
• Quality control (QC) and quality assurance (QA) departments.
“We have two departments to control operations business in this firm; (1) the
quality control (QC) department, which is in control of all technical issues
related to operational transactions, and also the quality assurance (QA)
department, which is responsible for documenting all operational files so they
can be referred back to if needed in the future.” Financial management
manager, Firm 5)
These quotations demonstrate several roles played by the controls systems: first, in providing
connections between the different functions of the firm such as, the technical and production
departments, and internal and external audit functions. Second, the operational controls are
seen to contribute to the analysis and the management of operational risks. Finally, the
systems mitigate losses and inefficiencies in the production process. Research suggests that
firms with strong systems of internal control and corporate governance overall are less likely
to engage in earnings management (e.g. Leventis et al, 2012; Clarke, 2007; Vafeas, 2005).
In general, the interviewees suggested that there are four main steps to ensure control of their
operations:
• Ensuring that all departments have good managers, who can guide the firm to
achieve its objectives.
• Ensuring that each employee does his/her work based on his/her job description.

Chapter Seven: Analysis of Interviews
226
• Carrying out weekly reviews of each department to ensure that all transactions in
each department are recorded correctly.
• Maintaining control over all aspects of the firm, both major and minor.
7.3.4.4 Financial Accounting Process Controls
The earnings management issue has always been important in considering the trustworthiness
of accounting reports. In addition, internal control systems are considered an important issue,
which allows the firms to provide greater assurance regarding their financial reporting
process, and to direct all the firm’s transactions in the manner established by the board of
directors (COSO 1994). Accordingly, the financial reporting process control has received
considerable attention from academic researchers, who have studied how internal control
affects the process by using internal audit standards (e.g. Ewert, et al 2013; Prawitt, Smith
and Wood, 2009; Davidson, et al 2005) and International Financial Reporting Standards
(IFRS) (e.g. Wang, et al 2012a; Liu, et al 2011). Assessing and controlling the financial
reporting process involves the judgment of managers, which create the opportunity to manage
reported earnings in order to achieve their desired objectives. For example, managers manage
earnings to achieve bonus plan goals (Healy, 1985), or to reduce political costs (Jones, 1991).
Based on our semi-structured interviews, we found that Jordanian industrial firms have
different methods for controlling and assessing their financial reporting processes:
• The existence of specialist committees related to financial transactions. One financial
manager suggested this method, which is used in his firm.
“According to our control financial report process, we use more than one
type, and this is decided based on the report type and size, and these types are:
(1) committees that are specialists in financial transactions, such as
purchases, sales, audit, development and research, and strategic executive
committees, and each one of these committees has different duties and the
authorisation to control financial transactions….. Then there is (2), the board
of directors, which controls all these committees’ work by asking them to send
monthly reports through the audit committee and the internal control
department.” (Financial manager, Firm 1)

Chapter Seven: Analysis of Interviews
227
• Horizontal financial and efficiency analysis and analysis of variances. Another
financial manager stated that his firm used these methods to control all financial
reporting transactions.
“… We use two types of analysis to make a comparison between our
accounts:
(1) Horizontal analysis every 12 months; for example, comparing the revenue
account in February with the revenue account in January of the same
year and then comparing that with last year.
(2) Also, we use a more depth analysis and called “efficiency analysis”, which
is focused on the balance between product quantity, quality and
production cost.” (Financial manager, Firm 1)
• Using daily reports to evaluate the firm’s financial position in relation to sales,
purchases, expenses and so on. In this regard, five managers told us that their firm
used this strategy to control its financial reporting process.
“… At this stage, we are using the best accounting system (ERP from
Microsoft). In a nutshell, we control all our financial reporting processes by
using this program. For example, at the end of each day we get reports that
show all our sales, purchases and expenses accounts” (Financial and
administrative manager, Firm 1)
• Using employees’ signatures and passwords to control the financial accounting
process. Several examples were presented during the in-depth interviews that support
this method.
“We are attempting to control the financial reporting process from inside the
financial system…how? We create for each employee in the financial
department a password and signature, so if he/she carries out any transaction,
right away this transaction will be signed with his/her name. Accordingly, in
case of error or mistake, our system will tell us which exact employee made
this error or mistake.” (Financial management manager, Firm 5) and
(Financial and administrative manager, Firm 1)
• Comparing the estimated plans of the board of directors with what has been achieved.

Chapter Seven: Analysis of Interviews
228
“We monitor our financial transactions as follows:
We have policies that have been established by the board of directors, and we
have our estimated budget, thus at the end of each month we go back and
review all our financial transactions and see if these transactions were
predicted based on board policies, comply with IFRS and achieve the
financial target. If yes, that is great, but if not, we go back again and review
all our transactions step by step to find out where the problem is and solve it.
For example, our sales go onto cash sales or account receivable, and then we
follow up on our account receivable by using aging reports and so on.”
(Internal audit manager, Firm 3B)
Given the importance of the financial accounting process, we discussed three types of
accounts (revenue, expenses and account receivable accounts) with interviewees, as examples
for the financial accounting process. These accounts are considered the most likely vehicles
of earnings management (Jones, 1991). Accordingly, we have revealed the ways in which
firms deal with each account.
First, revenues accounts: based on the analysis of our semi-structured Interviews we found
that Jordanian industrial firms control and monitor revenue accounts using two strategies:
(1) The most common method involves comparing between estimated revenues
and actual revenues to determine the deviation, whether positive or
negative.
“We control this account by comparing between actual revenues and
estimated revenues budget in each quarter. If we have achieved our estimates
that means we are on the correct path. But if we did not achieve our estimated
sales, we start reviewing all our transactions related to the revenues account,
such as sales and all operational expenses, to find the main reason for this
problem.” (Financial manager, Firm 3A), the same statement has provided by
(Financial manager, Firm 1)
(2) Maintaining statements of agreed prices for each customer. This strategy
particularly is used in the mining sector where there is a complicated pricing
structure.

Chapter Seven: Analysis of Interviews
229
“For this account we are using a way that is different from other firms by
focusing on price statements for each customer. Each customer of our firm
has a price statement that we have agreed based on global material prices…
We adjust these prices statements monthly based on [the London metal stock
market, not the USA metal stock market] and this is the main step in
controlling our revenues account.” (Financial manager, Firm 2)
With regard to the two aforementioned strategies, two of the managers in our interviews
(General Manager, Firm 6; and Financial and administrative manager, Firm 4) described
several steps that the firm has to follow to control the revenue account:
• Matching sales invoices with shipping documents
• Control over shipping and billing documents
• Clerical accuracy checks on invoices
• Segregation of duties, i.e. sales and collections
• Ensuring credit approval for sales transactions
• Carrying out weekly reconciliation of bank accounts
• Controlling the listing of cash receipts
• Using budgets and analysis of variances
• Using authorised credit memos
• Using account charts to review revenue account codes, and ensuring
that all codes are right, showing that all transactions have been
recorded in the right place
• Mailing monthly statements to customers.
Overall, the managers identified several current problems in controlling their revenue
accounts: (1) economic and political circumstances in the Middle East, resulting in difficult
relationships with customers and a higher incidence of bad debts; (2) incorrect forecasts of
sales, due to uncertainty and risk factors; (3) producing products of a poor quality, in order to
reduce costs; (4) delays in getting licenses to sales of certain products (particularly in
Chapter Seven: Analysis of Interviews
230
pharmaceutical and mining firms), since this sometimes takes more than two years, and (5)
delays of supplies, since suppliers sometimes do not have the raw materials, and in Jordan
there are only a few suppliers. All of these factors may contribute to incentives for earnings
management.
Second, expenses accounts: the interviews identified just one strategy with which firms
control and monitor expenses accounts, that is, the analysis of the differences between
budgeted and actual expenses.
“In our firm we have a committee to follow up all our expenses. And this
committee has several roles, such as ensuring that the firm claims their
expenses based on the budgets that were established for them in the beginning
of each year… These budgets are established in a meeting between all
department managers and our top management [general manager and board
of directors], so each manager presents his/her department’s expenses for the
year based on the expenses for previous years.” (Executive Management
Manager, Firm 7), the similar statement made by (Financial and administrative
manager, Firm 1)
It appears from the discussion and analysis in our case studies that the managers in Jordanian
industrial firms prefer to talk further about the expenses problem in their firms. In this regard,
financial managers provided the following statement.
“ … I do not think that I can discuss any more problems related to our
expenses since I need to ask my manager about them before I provide
any information about our expenses” (Financial and administrative
manager, Firm 4)
Third, accounts receivable: all the managers interviewed for our interviews said that there
were two strategies for controlling and monitoring accounts receivable in their firms:
(1) Using account receivable aged reports.
“We control this account by using aging reports to see our account
receivable collection date. Also, if we have any problems with a customer
(i.e. a customer does not pay us) we go back and deduct his/her payment
from what he/she has deposited as a guarantee for his/her debt.”

Chapter Seven: Analysis of Interviews
231
(Financial manager, Firm 3A), the same statement provided by (Internal
audit manager, Firm 8)
The age reports provided during the interviews identified the presence of some very large and
old receivables balances. For example, one interviewee reported that they still have a debtor
that was first recorded 36 years ago, which had not been written off as bad debt. This caused
the researcher to identify bad debts policy as a potential tool of earnings management in these
firms and so the issue was explored in more depth with interviewees.
(2) Using bank credit reports and debt factoring. For example:
“From early 2010 we started using a new strategy, which involves taking all
our customers’ payments to us through bank credit… We made agreements
with these banks to collect the payments from our customers, and each one of
our customers has to sign a contract to the effect that he/she is happy with
this strategy. By using this strategy we control all our customers and reduce
the risk that might show up in the future.” (Financial manager, Firm 1)
There were several reasons identified by the managers that may lead to problems in
controlling accounts receivable amounts, as follows:
• Customers’ death.
• Firms’ bankruptcy.
• Difficult trading circumstances facing Jordanian firms.
• Financial crises, such as in 2008.
• Banks failing to operate the system of credit checks and debt collection effectively.
7.3.5 Managers’ Incentives to Manage Profit
In chapter (3), section (3.4) it was shown that the literature classified earnings management
incentives into two groups: opportunistic earnings management and beneficial earnings
management. Opportunistic incentives involving the pursuit of personal interests such as
management remuneration and bonuses and beneficial incentives involve adding value to the
financial reporting process, for example to disclose information additional to IFRS
disclosures. Accordingly, our case studies found that Jordanian managers are more likely to

Chapter Seven: Analysis of Interviews
232
engage in opportunistic earnings management than beneficial earnings management. None of
the interviewees offered any explanations for beneficial earnings management. The following
sections explain managers’ incentives identified in the case studies’ analysis:
In this group, there are four incentives:
• Avoiding customs fees: custom Law No. 20, article 10 (from the year 1998), states that
“the duties of the customs tariff shall be either ad valorem (a percentage of the value of
goods) or qualitative (a lump sum for each unit of the commodity). The tariff fees can be
both ad valorem and qualitative for the same kind of goods.”
“Managing our accounts sometimes arises suddenly, particularly after unfair
government regulations… For example, new customs fees that have increased
suddenly” (Financial and administrative manager, Firm 1)
• Avoiding high tax rates: most of the interviewees mentioned that they believe that the tax
rate for Jordanian industrial firms is unfair, particularly since it has recently increased
several times.
“Managing profit is very easy… For example, decrease the expenses or
hiding some revenue, particularly deferred revenue, to pay the government
less tax.”
“I am under pressure to manage the profits of this firm to avoid certain
issues, for example, increasing the firm’s expenses to avoid high tax rates,
particularly in 2011 when the government increased the tax rate for industrial
firms.” (Financial manager, Firm 2), similar statements were made by
(Financial manager, Firm 1), (Financial and administrative manager, Firm 2),
(Financial management manager, Firm 8), and (Financial manager, Firm 4)
• Increasing management bonuses: prior studies that have investigated earnings
management issues have found numerous incentives for opportunistic earnings
management, such as compensation and bonuses for managers; Healy (1985) indicated
that managers engaged in earnings management to increase their compensation and
bonuses. His findings showed that their bonus contracts related to account reporting and
the adoption of bonus plans.

Chapter Seven: Analysis of Interviews
233
“…. I remember one manager was reducing his department expenses to
increase the department’s profitability and get a bigger bonus, even though he
was spending more than any other manager.” (General Manager, Firm 6)
• Attracting more investors.
“….. the mangers might increase the firm’s profit to attract more investors,
but at the same time they might decrease profit to avoid tax.” (Financial
manager, Firm 4)
• Increasing share price: A few studies have found that firms’ managers tend to use stock
splits to increase stock price, which in turn increases their earnings; e.g. Guo Liu, and
Song (2008).
“To be honest with you, sometimes the government regulations push us to use
all the gaps in the law to decrease or increase our profit. … We sometimes
increase our profit to increase share prices, which means more customers,
and our sales prices will increase and we will be among the firms that
achieved the highest profits for the year.” (Financial and administrative
manager, Firm 4)
• Increasing management stock options: Regarding this issue, prior studies have found that
firm managers engage in earnings management in order to increase their stock options
(Veenman et al 2011).
“Increasing profits to get more stock options and to satisfy our
shareholders… This is the most usual way that the managers use to manage
their profits.” (Financial manager, Firm 3B)
Based on the quoted discussions, we noticed that most of the firms, regardless of their size,
industry, and earnings management group appear to engage in opportunistic earnings
management and to admit to this openly in discussion. On the other hand, we found that
Jordanian firms do not tend to engage in beneficial earnings management.
7.3.6 Does the Adoption of International Financial Reporting Standards (IFRS) affect earnings management?
Prior studies that have examined the impact of the adoption of IFRS on earnings management
levels have shown that the adoption of IFRS is likely to lead to a reduction in earnings

Chapter Seven: Analysis of Interviews
234
management practices, whether in developed or developing counties. For example, based on
the context in China, Wang and Campbell (2012a) found that IFRS is more likely to reduce
earnings management than Chinese GAAP. Liu et al (2011) focus their attention on
investigating the relationship between IFRS, accounting quality and earnings management in
non- English speaking countries, which they started by examining the influence of IFRS on
accounting quality in China. Their empirical results show that the adoption of IFRS reduced
earnings management, and increased accounting quality.
In another study that was conducted based on India's context, Rudra and Bhattacharjee (2012)
attempted to investigate whether the adoption of IFRS is limiting earnings management in
developing countries more or less than in developed countries. They found that the adoption
of IFRS in India during 2010 led to mitigation of opportunistic earnings management more
than the firms that do not adopt IFRS in emerging economy. Zéghal, et al (2011) claimed
that the adoption of IFRS also led to mitigation of earnings management in French firms, and
their empirical findings supported this argument.
In a recent study, Karampinis and Hevas (2013) used a sample of firms listed on the Athens
Stock Exchange and looked at the five fiscal years before and the six fiscal years after IFRS
adoption. They found a significant negative relationship between tax incentives and
discretionary accruals before the adoption of IFRS, and no relationship between them after
IFRS adoption.
In the context of developed countries, several studies have discussed this matter; for example,
Jeanjean and Stolowy (2011) found decreasing earnings management in firms that have
adopted IFRS in the UK and Australia, and increasing earnings management in France.
Furthermore, Callao and Jarne (2010) examined to what extent the adoption of IFRS will lead
to mitigation of discretionary accruals in 11 countries from the European Union, where they
explored the fact that IFRS adoption causes more variation in earnings management, which
means that there is more room to manipulate earnings within IFRS than local standards. In
contrast, Van Tendeloo and Vanstraelen (2005), based on a sample of 636 firm-year
observations over 1999 – 2001 in Germany, found that the adoption of IRFS did not affect
levels of earnings management. In other words, no difference was made to earnings
management levels under German GAAP by the adoption of IFRS.
In deference to the importance of this issue, our research paid close attention to exploring the
relationship between earnings management and the adoption of IFRS. Under the Companies

Chapter Seven: Analysis of Interviews
235
Law 22/1997 and its amendments, companies operating in Jordan are required to maintain
annually audited financial statements. This is applicable to all public listed companies,
general partnerships, limited partnerships, limited liability companies, private shareholding
companies and foreign companies. The Companies Law also stipulates that all registered
companies should maintain sound accounting records and present annual audited financial
statements in accordance with International Financial Reporting Standards (IFRS). The
market regulator, the Jordanian Securities Commission (JSC), requires all listed companies to
apply IFRS (Ernst and Young 2011).
Through our semi-structured Interviews analysis, this research has explored the adoption of
IFRS as a potential factor affecting Jordanian industrial firms’ performance, positively or
negatively. The majority of interviewees (10 out of 12 firms) believed that the adoption of
IFRS has a positive effect on their firm. Interviewees of one of the other firms suggested that
the adoption of IFRS had adversely affected the firm and just one firm reported no effect was
found.
The following quotations were from respondents who suggested that the adoption of IFRS led
to an increase in their firms’ performance. Several interviewees expressed the opinion that the
adoption of IFRS and the audit processes associated with it created a structure within which
firms were able to reorganise and restructure all of their accounting processes and
management practices.
• Increased the transparency of financial reports.
“Absolutely the adoption of IFRS led us to present our financial reports in
an excellent way that allows us to compare our work with that of firms in
developed countries, since we now apply the same standards.” (Financial
manager, Firm 2), similar statements were provided by several managers such
as; (Financial management manager, Firm 5), (Financial manager, Firm 1)
• Helping the firm’s employees to segregate their duties based on job descriptions.
“The adoption of IFRS leads to segregating employees’ duties based on their
job descriptions, not like the prior system that allowed each employee to do
other employees work.” (Financial manager, Firm 1), and similar comment
was also made by the (Financial and administrative manager, Firm 2)

Chapter Seven: Analysis of Interviews
236
• Improving firms' reputations which helped them move from the lower to higher
markets in the Amman Stock Exchange.
“Also, I can say that since adopting IFRS, our market position has changed
from second market to first market.” (Financial manager, Firm 1), and
similar comment was also made by the (Financial and administrative manager,
Firm 1)
• Improving firms’ policies and performance.
“We adopted IFRS in early 2007. And this adoption affected our firm’s
performance positively. For example, we started to be able to compare our
financial data with firms in the developed countries, which in turn led to us
improving many of our policies based on this comparison.” (Executive
financial manager, Firm 7)
In the firms where the interviewees reported negative effects from IFRS adoption it was
suggested that the adoption of IFRS led to a decrease in these firms’ performance by moving
some firms to lower markets in Amman Stock Exchange.
“The adoption of IFRS led us to move down from the first market to the
second market, since this adoption caused some confusion to our employees
when dealing with our financial transactions; this in turn led us to providing
the Amman stock market with our financial reports late (one condition of
staying in the first market is to provide the Amman stock market with
financial reports on time).” (Internal audit manager, Firm 3A)
Finally, one firm that had recently adopted IFRS reported no significant effect so far.
“Our firm adopted IFRS in early 2013. So far, nothing has happened but I
think in the near future it may.” (Financial and administrative manager, Firm
4)
Overall, the adoption of IFRS was thought to have contributed to improvement in the system
of the internal control and corporate governance in most of the firms and this is expected to
reduce the level of earnings management for these firms. Subsequent exploration of the
earnings management practices of these firms in the semi-structured Interviews was
consistent with this idea.

Chapter Seven: Analysis of Interviews
237
7.3.7 Cultural factors and Earnings Management
Desender et al., (2011) documented that cultural factors are considered among the most
important issues that can affect earnings management. Often, cultural factors are hidden
under different names and concepts, which make it difficult to explore these factors.
However, ignoring or failing to understand these factors could lead firms to more problems
with their performance. For example, failing to understand the level of education of
employees could lead to a poor ability to compete with other firms in the same industry,
particularly if they have more educated employees (Purcarea and Danalache, 2008). This
section discusses in depth, the cultural factors that can affect Jordanian industrial firms and
their effect on earnings management levels and firm performance.
Consistent with results from prior literature (chapter 3, section 6), several of the interviewees
identified culture as a dominant force in the governance and performance of Jordanian firms.
“This is our main issue, since it affects every single thing in our environment…
Also, it is considered the main factor that keeps us as a developing country.”
(Financial manager, Firm 4), similar statement made by (Financial management
manager, Firm 5), (Financial manager, Firm 6) and (Financial and administrative
manager, Firm 4)
Proceeding from the importance of cultural factors and their potential to affect firms’
governance (see chapter 2, section 9), it was concluded that there are five cultural
factors that have a strong effect on Jordanian firms’ performances.
7.3.7.1 The Tribal System
The tribal system is conducted by the tribal Sheikhs, and still applies in Jordanian life - the
business aspect of life is not isolated from it. Rowland et al (2009) stated: “The tribal law is
still used in Jordan officially to smooth things over, and unofficially just as a form of social
identification. In rural areas of Jordan, the tribal system is much more palpable and plays a
larger part in people’s lives than it does in the urban centres”.
The tribal system can potentially affect all aspects of life, including access to jobs, economic
opportunities and schools and social privileges. It has been suggested by Alon (2005) that the
tribes should work to provide support to the government in achieving equality of access and
social fairness but the reality of the tribal system can result in the opposite effect.
Statement (1)

Chapter Seven: Analysis of Interviews
238
“Some of our managers were hired because of their connections and their
tribes’ power, which in turn led to weaknesses in our internal control system.
Some of them do not have enough qualifications, since they graduated from
bad universities [and you know from where - XXX country. I know for a fact
that one of them just paid money to get his degree]. [… This country will
never be free from the tribal system since the whole country was built based
on it].” (Financial manager, Firm 6), and similar comment also made by the
(Financial manager, Firm 3A), (Financial manager, Firm 3), and (Internal
audit manager, Firm 8)
Statement (2)
“The other disaster factor is the tribal system, because of which we have to
hire people who are not qualified for positions just because his/her tribe is big
or because they are from the area that the factory is in and we have to hire
mostly from this area to satisfy this area’s tribe… You know, 60% to 70% of
our employees are from XXX region of Jordan, and most of them are not
qualified.” (Internal audit manager, Firm 8)
According to these quotations, Jordanian industrial firms have different characteristics that
defer them from other countries whether developing and developed. Thus, this PhD study
found that the tribal system is a factor that effects the relationship between corporate
governance mechanisms and the earnings management issue in Jordanian industrial firms as
shown in the quotes above, where these results cannot be provided by using secondary data
such as regressions models.
7.3.7.2 Favouritism (Wasta) in Recruitment and Other Business Decisions
In addition to the tribal system factor, there is another factor that can affect Jordanian firms’
performance, which is favouritism or nepotism (Wasta). Some Jordanian firms use Wasta to
drive their businesses since they have good relationships with the government and can
therefore negotiate favour treatment in decisions such as the granting the licences for trading
and building. This may lead to positive benefits on an individual firm level but negatively
affect the country’s economy. The Jordanian anti-corruption department has confirmed that
nepotism and favouritism are at the top of their list of corruption factors (Amman Stock
Market, 2015).

Chapter Seven: Analysis of Interviews
239
Several of interviewees identified Wasta as a barrier to effective internal control and
corporate governance system.
“Our society’s culture (e.g. nepotism) is causing us big problems all the time,
since we have to hire people who are unqualified).” (Financial manager, Firm
3A), similar comments also made by (Financial and administrative manager,
Firm 2) and (Executive financial manager, Firm 7)
One of the managers also raised the issue of nepotism in government and the effect this
has on overall management in the economy.
“The problem is not in our economy but in our economists, so in my opinion,
to increase our country’s economic growth, we have to fire some economists,
those who do not have even the basic necessary experience [and just get hired
because of Wasta]… So we end up telling them to stay home and take their
salary without working – better that than making wrong decisions]. To deal
with nepotism and tribal system would take more than 10 years. Therefore, I
can say we are a developing country with low culture.” (Financial manager,
Firm 3B)
As stated in the aforementioned quotes, it was noticed that there is a relationship
between Wasta and the tribal system, since the tribal system is considered as a tool to
achieve the Wasta by hiring unqualified employees. As a result, it was found that most
of the interviewees stated that the Wasta is considered a disaster factor that effects the
level of earnings management through employing unqualified people from the
managers to achieve their desirable goals particularly to increase their bonuses and
compensation. This result is supported in the prior literature (see section 3.6.1, Healy,
1985).
7.3.7.3 Educational Attainment of Employees
Doms, Lewis and Robb (2010) found that the level of education of employees is strongly
related to a firm’s performance, and higher level of education means fewer errors and
mistakes, especially for college graduates compared to university graduate. Educational
factors can affect the organisational environment in any firm (Barro, 1991; Maitah, 2013),
and the response of interviewees illustrates the importance they attach to this issue.

Chapter Seven: Analysis of Interviews
240
“Employees’ education is an issue, since most of our universities nowadays
use traditional systems to teach their students. For example, we are
accountants [both the interviewee and the researcher] and we finished our
bachelor’s degrees in accounting without any training in actual firms. See, in
the UK, where you studied, they give their students one year of work as
employees to enable them to take on responsibilities.” (Financial and
administrative manager, Firm 1), similar comments also made by (Financial
and administrative manager, Firm 2), (Financial manager, Firm 1) and
(Financial manager, Firm 6)
Although the literature suggests companies with graduate employees are likely to have better
systems of internal control, our interviewees contradicted this idea on the ground that
degrees obtained from Jordanian universities are not sufficiently rigorous to render them
useful in practice. Accordingly, the existence of a good internal control system is more likely
to relate to low earnings management in the firms, where the strong internal control system
constitutes a huge obstacle for the managers to manipulate their earnings to achieve any of
their desirable incentives (Klein 2002; Beasley 1996).
7.3.7.4 Employees’ Mentalities and Maturities
The effective operations of the firm can be affected by the personal characteristics of those
employees operating key system. Wijewardena, Nanayakkara and De Zoysa (2008)
documented that employees’ mentalities (personal characteristics) have a strong, significant
relationship with firms’ performance, and different mentalities have different effects. For
example, they showed that having 42.5% of employees with an organised mentality lead to a
small increase in sales, and at the same time they found that having 69.3% of employees with
entrepreneurial mentalities lead to a similar increase in sales. Four of the managers we
interviewed referred the personal characteristics of their employees to the integrity of the
business systems in which they worked.
Statement (2)
“Of our employees, only about 30% can be described as mature. Therefore,
our employees are not responsible about their work, they think that they are
‘working in their home’, and this leads to more problems that affect our
firm’s performance.” (General Manager, Firm 6), similar statements provided

Chapter Seven: Analysis of Interviews
241
by (Financial manager, Firm 1), (Financial manager, Firm 3A) and (Executive
financial manager, Firm 7)
Few studies investigated the effect of employees’ mentality and maturity on firms’
performance in general, and therefore this study paid more attention to the effect of
employees’ mentality and maturity on earnings management in specific. Its appears from our
case study analysis that these two factors effect the level of earnings management and this
could be as a result of using the managers to manipulate their earnings and achieve their
incentives without any controlling board since all the employees had shortages in their
responsibilities.
7.3.7.5 Dialect and Language Factors
Failure to master the host language or understand the language used in the firm environment
causes problems in the workplace. For example, speaking in different languages (e.g.
different dialects, slang etc.) can lead to problems in communication (Martinez-Calimano
2006). Our in-depth interviews showed that this factor can indeed cause some problems in
firms which impact upon their performance (Maitah 2013). Two of the managers identified
dialect as an issue in the management of Jordanian firms, likely to affect internal control.
Statement (1)
“Our language is sometimes considered one of the cultural factors that affect
our work; the dialects of villages are different from the language used in
cities.” (Financial manager, Firm 4)
Statement (2)
“Sometime we face language related problems, since we have here in Jordan
different dialectical languages, which have affected our firm’s work,
particularly earnings quality.” (Financial management manager, Firm 4)
Overall, based on interview data which explored cultural factors that could affect earnings
management levels in Jordan, we concluded that all the managers we interviewed, regardless
of their groups, were in agreement that the tribal system and nepotism are considered the
main factors that can lead to weak internal control systems and low earnings quality, which

Chapter Seven: Analysis of Interviews
242
means that there is a chance that any manager might engage in earnings management to
achieve his/her desired incentives. In addition, interviewees identified three other cultural
factors (employee education levels, employee mentality, and language) affect firms’
governance, although not to the same extent as the tribal system or Wasta.
7.3.8 Financial Crises and Earnings Management
The Global Financial Crisis is considered to be the main issue that currently affects firms’
performance; therefore, large numbers of researchers pay attention to studying the effects of
the financial crisis, especially with regard to the earnings management issue. On this subject,
Habib, Bhuiyan and Islam (2013) claimed that the results of prior literature investigating
these effects are not decisive. They suggested that the financial crisis might lead to more
earnings manipulation, carried out in order to achieve several goals, such as (1) decreasing
firms’ earnings by reducing their pricing to dispose of slow-moving inventories, and (2)
increasing their earnings via acquisitions to attract more investors, and thus creating more
opportunities for earnings management. For example, Rosner (2003) found that firms that
become more likely to manipulate their earnings upward after financial crisis and Barth and
Landsman (2010), Laux and Leuz (2010) found evidence of firms managing assets values
downwards using fair value accounting. Other studies also found evidence of earnings
management in the banking sector following the global financial crisis (e.g. Huizinga and
Laeven, 2012; Fiechter and Meyer, 2011).
In the context of Jordan, a study by Alzoubi and Selamat (2012) claims that the Asian
Financial Crisis in 1997/1998 and the Global Financial Crisis of 2008 prompted the
implementation of better corporate governance structures throughout the country.
Generally, the interviewees perceived that the 2008 crisis had negative effects on Jordanian
firms, which are as follows:
• Encouraging firms’ managers to engage in earnings management.
(1) The financial crisis in 2008 led some firms to manage their profit downward to avoid high
taxes.
“In general it was a disaster for this firm since the managers at the time
attempted to manage the profit, upward or downward. For example, I did that
in my previous firm: I have managed profit downward to avoid taxation.”
(Financial manager, Firm 1)

Chapter Seven: Analysis of Interviews
243
(2) The manager manages their earnings downward since they understood that there would be
no bonus for them in the short term and therefore they might as well bank the profit for
future years.
“….. In according to my prior experiences, I found that the managers during
the financial crisis in 2008 keep their earnings in the low level at that time to
give their self the opportunities increase their earnings afterward to achieve
more bonuses …… as you know if they increase the profit in the time of crisis
they will not get more bonuses to cover the losses that achieve in according to
this crisis.” (Financial manager, Firm 3)
(3) On the other hand, this crisis led other firms to manage their profit upward to attract more
investors and increase their firms’ capital.
“In other firms I am sure 100% they manage their profit (upward) to be
attractive to more investors and bolster their capital, otherwise they would be
out of business.” (Financial manager, Firm 1)
“In my opinion, the financial crisis in 2008 was the main factor that leads us,
and most industrial firms, to make more losses, this in turn lead to a decrease
in our reputation our foreign investors.” (Internal audit manager, Firm 8)
• Terminating large number of employee contracts to reduce expenses.
“The financial crisis caused several problems for us, such as decreasing our
sales and foreign customers, and having to fire more than 50 employees since
our profit had gone down and we could not cover all these employees’
salaries.” (Financial manager, Firm 2)
• Leading the Jordanian government to increase tax rates for the industrial sector, this
led some firms to manage their profits to avoid the new high rate (as mentioned
above).
“Absolutely, the financial crisis affected our firm’s internal controls and all
other systems. It led the government to increase taxes, which led us to export
most of our products to foreign countries since our local customers were no
longer ordering products (they were also affected by the financial crisis). This
in turn led to a decrease of our revenues.” (Financial manager, Firm 3A),

Chapter Seven: Analysis of Interviews
244
(Financial and administrative manager, Firm 2) and (Financial manager, Firm
4)
• Decreasing the customer base, whether foreign or local.
“The financial crisis affected our firm by reducing our customers, which
meant less sales and less profit, and also limited the export of our products to
large numbers of countries.” (Financial and administrative manager, Firm 1)
• Decreasing firms’ share prices.
“This crisis happened in 2008, and affected our firm’s performance badly.
For example, our sales quantities decreased, our share prices decreased and
most of our investors left us.” (Financial management manager, Firm 5)
• Most of the banks began to lack confidence in the credibility of Jordanian industrial
firms because of lateness in paying back their loans payments.
“From what I have seen from our firm’s financial annual reports… The
financial crisis affected our financial position. For example, it decreased our
credibility in the eyes of our creditors, and there are several banks here in
Jordan which now refuse to lend us long-term loans, which has led to a
decrease in our liquidity which means less production, then less sales, then
more losses.” (Financial manager, Firm 3B)
Based on these comments it is clear that the financial crisis led to pressures on the firms and
created more incentives for them to engage in earnings management, although the direction
of the management, either increasing or decreasing, varied according to the firm’s individual
circumstances. These results are supported in prior studies such as Habib et al., (2013).
7.3.9 Different Approaches to Accounting Systems in Jordan
During the pilot study interview, the financial manager in (firm 3) identified two existing
school of thought in relation to the accounting system and financial conduct of Jordanian
firms, which he associated with internal controls and corporate governance system of the
firms.
“Actually, there are two types of financial school, and the differences
between them are based on two points which are: (1) the reporting stage,

Chapter Seven: Analysis of Interviews
245
which is considered the main important matter related to the different
techniques we have to adopt in our firm, and (2) financial direction, since we
guide all financial transactions and relate all of them together (e.g. reporting,
posting, budgeting and transferring).” (Financial manager, Firm 1)
Further exploration of these “schools” led to the explanation that the differences between
them lie primarily in the way in which IT is used in the accounting system and the adoption
of IFRS and international auditing standards. The firm belonging to the “traditional school”
employ paper based systems or IT systems that are not connected throughout the business and
have not fully engaged with IFRS and IAS. Those in the “modern financial school” have
adopted ERP system that encompass all parts of the internal control system and have fully
adopted both IFRS and IAS, including internal control recommendations such as segregation
duties. The idea of the two “schools of thought” identified by the financial manager in firm 3
was suggested subsequently to all other interviewees in order to assess whether they saw this
as reasonable explanation for differences between the firms in Jordan.
“I think the main issues that determine the financial school that we follow
are these two points: (1) following IFRS and international auditing standards,
and (2) using technology to record our financial transactions. Accordingly, I
can say that we are 80% following the new financial school and 20% the
traditional school, since we follow IFRS and auditing standards, but also we
are still using the paper system to record our transactions in accordance
government requirements for things like taxes.” (Financial manager, Firm 3B)
The managers aspired to the “modern financial school” for a number of reasons:
• To be amongst the strongest firms in the industrial sector.
“Of course, we are following the new, modern school, which allows us to
follow developed countries’ standards, not like the traditional one that always
pushes us to follow shareholders’ and board members’ objective.” (Financial
manager, Firm 4)
• Using new internal control systems to improve firms’ governance and performance.
“We are following the new financial school in order to replace our old
internal control system with a new one. For example, all our transactions are

Chapter Seven: Analysis of Interviews
246
signed by computer, all our managers accept or refuse the work done in this
firm by using computer system (Oracle)… No more paper for our firm!”
(Financial and administrative manager, Firm 2)
• Increasing financial report transparency in Jordanian industrial firms.
“I think 95% of the time we are following the new financial school… It leads
to more transparency in our financial reports and even our financial
transactions.” (Financial and administrative manager, Firm 1), similar
statement also made by (Financial management manager, Firm 5)
Managers in firms following the “traditional financial school” suggested that there is no
chance of separating top management’s and employees’ duties in their firms and, as they are
not independent, all of them have to work with each other whilst respecting their different
levels. They also suggest that paper documentation should be the core of their work since the
Jordanian government does not accept e-invoices or other electronic documents to support
their work (e.g. the taxation department needs the original documents to support their allowed
expenses).
“But we are still using the paper system to satisfy the government regulations
that require us to provide paper documentation… And these papers have to be
signed by hand to be accepted by Jordan tax department.” (Financial and
administrative manager, Firm 1) and (Internal audit manager, Firm 8)
The “traditional financial school” was also seen to allow ineffective management where it
was easier for powerful individuals to circumvent internal control process. Managers also
expressed the concern that the government rules that lead Jordanian firms to follow the
traditional financial school thought will also lead these firms into problems in dealing with
the firms from developed countries that are following the “modern financial school of
thought”.
“When it comes to financial schools we are still facing some problems,
especially when we ship our products to developed countries. For example,
when I was working with TNT in Jordan, our general manager asked us to
keep all our accounting entries in files but at the headquarters of TNT in the
Netherlands they did not ask us to do that since they are using the e-system.”

Chapter Seven: Analysis of Interviews
247
(Internal audit manager, Firm 3B), similar comment also made by (Financial
manager, Firm 1)
Finally, there was general agreement that following the “traditional financial school of
thought” could encourage firms’ managers to engage in earnings management. Whereas, the
“modern financial school of thought” was believed to lead to a decrease in managers’
opportunities to engage in earning management, whether upward or downward.
“Listen, up until now we have been following the traditional financial school,
since we are still filling all our documents to assist the government,
particularly with tax. And I can see that this school is allowing for too many
errors, since any employee can do the work of another. Also, some managers
can mess around with their accounts if they have errors in their department,
to show the general manager and board of directors that they are the best, so
deserve to get more incentives.” (Financial manager, Firm 6) and (Financial
and administrative manager, Firm 4)
In those firms committed to modernising their accounting systems are forced to retain paper
records for the government purposes.
“… I could say that we are using both schools BUT we are more closed to the
new school since all of our transactions follow international standards (e.g.
IFRS, IAS, and ISO 9001). And we still use paper copies to meet government
regulations, particularly on tax issue.” (Financial manager, Firm 1)
7.3.10 The Effect of the Taxation System
In a context such as Jordan where corporate taxation is based on reported profit, taxation
issues are an important matter to firms since any error or mistake might lead to extra tax
expenses. That is, without a strong financial manager assessing and evaluating the effect of
changing accounting policies, a firm might end up with higher profit figures which mean
more tax.
This creates clear incentives for income-decreasing earnings management. For instance,
Cook, Huston and Omer (2008) investigated the impact of effective tax rates as an earnings
management incentive on firms’ earnings in third and fourth quarters in US. Their findings
showed that the tax rate is considered an incentive to manage their earnings downward to pay
less tax.
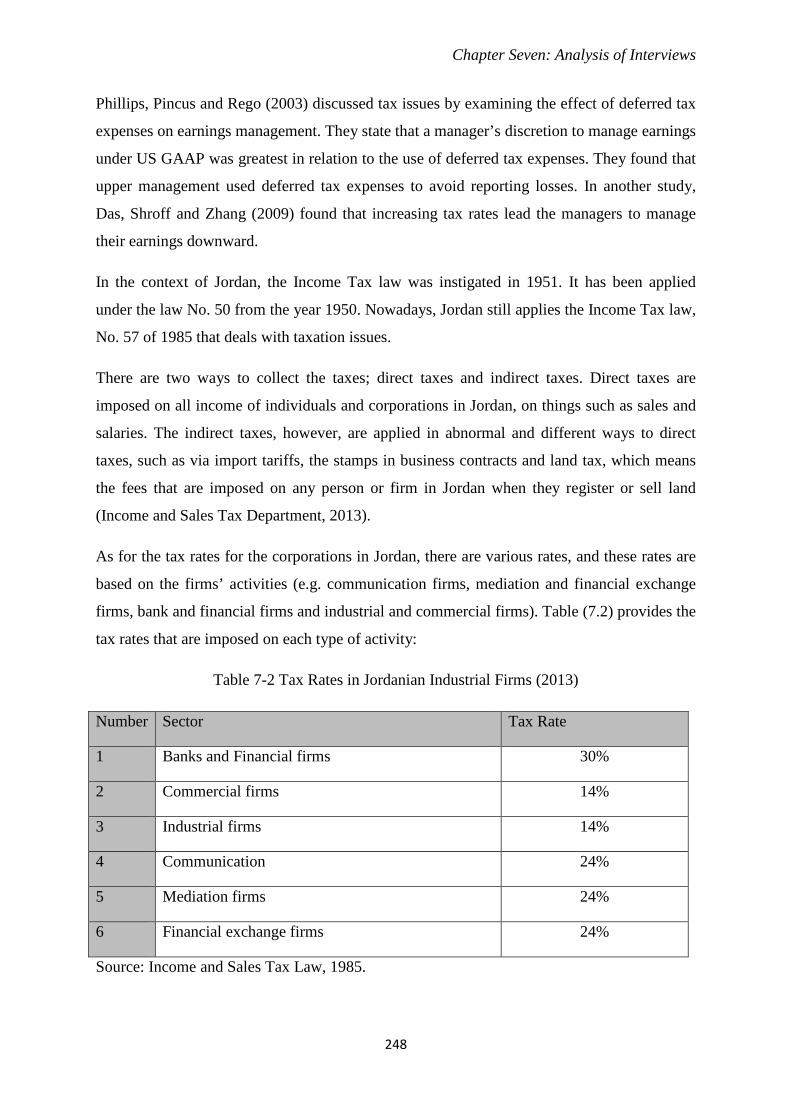
Chapter Seven: Analysis of Interviews
248
Phillips, Pincus and Rego (2003) discussed tax issues by examining the effect of deferred tax
expenses on earnings management. They state that a manager’s discretion to manage earnings
under US GAAP was greatest in relation to the use of deferred tax expenses. They found that
upper management used deferred tax expenses to avoid reporting losses. In another study,
Das, Shroff and Zhang (2009) found that increasing tax rates lead the managers to manage
their earnings downward.
In the context of Jordan, the Income Tax law was instigated in 1951. It has been applied
under the law No. 50 from the year 1950. Nowadays, Jordan still applies the Income Tax law,
No. 57 of 1985 that deals with taxation issues.
There are two ways to collect the taxes; direct taxes and indirect taxes. Direct taxes are
imposed on all income of individuals and corporations in Jordan, on things such as sales and
salaries. The indirect taxes, however, are applied in abnormal and different ways to direct
taxes, such as via import tariffs, the stamps in business contracts and land tax, which means
the fees that are imposed on any person or firm in Jordan when they register or sell land
(Income and Sales Tax Department, 2013).
As for the tax rates for the corporations in Jordan, there are various rates, and these rates are
based on the firms’ activities (e.g. communication firms, mediation and financial exchange
firms, bank and financial firms and industrial and commercial firms). Table (7.2) provides the
tax rates that are imposed on each type of activity:
Table 7-2 Tax Rates in Jordanian Industrial Firms (2013)
Number Sector Tax Rate
1 Banks and Financial firms 30%
2 Commercial firms 14%
3 Industrial firms 14%
4 Communication 24%
5 Mediation firms 24%
6 Financial exchange firms 24%
Source: Income and Sales Tax Law, 1985.

Chapter Seven: Analysis of Interviews
249
The incorporated firms in Jordan are interested in the treatment of depreciation in their
accounts since it allows them a tax deduction. Furthermore, the income and sales tax law
(1985) allows the firms to deduct several expenses from their income for the purpose of
taxable net income, which in turn might lead the managers manipulating these expenses to
increase or decrease firm income based on their personal incentives (Healy, et al 1999).
The taxation system in Jordan has changed several times based on economic and political
circumstances. This in turn significantly affected after tax profit levels in Jordanian industrial
firms. The managers expressed a variety of opinions, with respect to the fairness of the tax
system:
Some saw the taxation system as an unfair system (ten managers out of twelve fall in this
group). They stated that this system could lead to several problems, such as: decreasing
foreign investments, leading firms to manipulate their expenses accounts to reduce the tax
amount that they have to pay and sales tax leading to decreases in both foreign and local
customers. Several interviewees also commented on the competence of the government
taxation department.
“Jordan tax department still works in the Stone Age. Also, I am not going to
say much more than “it’s an unfair system” since all Jordan tax department
employees are unqualified, and each day they create a new tax type to show
off. Therefore, this is bad for our industrial sector, and almost 90% of present
Jordanian tax department employees were hired through nepotism.”
(Financial manager, Firm 2), similar statements were provided by (Financial
manager, Firm 1)
“I think this system is unfair since it’s subject to change when the chairman
of the tax Jordan is changed, but in general we are here paying a fixed rate
yearly (14%), and the disastrous issue is that I have heard this rate will go up
to 25% on 1/1/2014. If this rate is applied we will lose our foreign investors,
since all of these investors came to Jordan because of the low tax rate… most
Jordanian industrial firms will be out of business soon if the tax rate
increases to 25%.” (Internal audit manager, Firm 8)

Chapter Seven: Analysis of Interviews
250
Furthermore, one of the interviewees called this system a “personal system”, meaning that
there is no uniform standard for government tax inspectors to follow. In this regard, he
commented:
“I am an internal audit manager, and I consider this system to be unclear,
since each person can interpret this system based on personal attitude. For
example, each tax assessor has a different level of experience and will assess
a firm’s tax differently to another one. So, I suggest that the government
establish fixed standards for all tax assessors. Finally, if you give two tax
assessors the same financial data each one of them will give you a different
tax amount. Our tax system in Jordan is personal, and is subject to change
based on personal characteristics.” (Internal audit manager, Firm 3B)
According to this quote, earnings management could appear in the firms that understand the
taxation system to be based on a personal system since the managers start believing that the
government is not dealing with firms equally and they start engaging in earnings management
to achieve their aims. In contrast, there are two financial managers who believed the
Jordanian tax system to be a fair system.
“I can say this system is fair to a limit, for example 15% [the current tax rate]
is fair, but if they apply the new tax rate which will be 25%, this one will be a
disaster”. (Financial manager, Firm 3A), similar statement was also made by
(Executive financial manager, Firm 7)
Based on prior literature results (e.g. Das et al, 2009; Cook et al, 2008) that stated “the tax
issue could be an incentive for the managers to engage in downward earnings management”,
the taxation issue was raised with our interviewees who responded as follows:
Statement (1)
“We always try to find any gap in the tax system to decrease the tax amount
that we have to pay to the government, and our external auditor helps us with
that.” (Internal audit manager, Firm 8), and similar comment was also made by
the (Financial management manager, Firm 5) and (Financial manager, Firm 1)
Statement (2)

Chapter Seven: Analysis of Interviews
251
“Some of the financial managers in industrial firms are increasing top
management expenses to reduce their profits in order to pay less tax.”
(Financial and administrative manager, Firm 2), (Financial and administrative
manager, Firm 1) and (Financial and administrative manager, Frim 4)
Statement (3)
“Absolutely, there is no problem facing us regarding bad debt provision since
we will get our money back, like I said, whether we get our actual money back
or get it deducted from our taxes.” (Financial manager, Firm 3A)
It appears that most of the firms will openly manipulate earnings in order to reduce tax paid
and the main instruments used to achieve this aim is the use of bad debt provision, increased
management expenses and managing other expenses. These results are consistent with prior
literature which found that increasing the expenses is used as tool to manipulate earnings
management (See Jones, 1991).
7.3.11 Bad Debt Provisions and Earnings Management
Several previous studies attempted to explore the relationship between bad debt provision and
earnings management, such as McNichols et al (1988) who conducted their study in the USA.
This study investigated whether bad debt provision is deemed to be an earnings management
tool. In this regard, they argued that “the discretionary component of the provision for bad
debts is income-decreasing for firms whose earnings are unusually high or low.” Empirical
results showed that most firms manage their earnings by using bad debt provisions when they
have high earnings, and there is no evidence showing that the firms with low earnings
manage their earnings by using bad debt provision.
Based on 106 firms from three sectors (publishing, business services and nondurable
wholesalers) in the USA, DeAngelo (1988) concluded that “firms manage their earnings by
choosing income-decreasing accruals when income is extreme.” She determined her sample
based on two factors: (1) the firms with high income to their accounts compared to their total
assets, and (2) the firms with high bad debt provision compared to their net income.
Empirical results indicated that the firms used bad debt provision to manage their earnings
particularly when they had a high income (this result is compatible with McNichols et al
(1988)). In a recent study, Jackson and Liu (2010) examined the relationship between bad

Chapter Seven: Analysis of Interviews
252
debt expenses and earnings management, where they found that the firms they studied
managed their earnings downward by using bad debt expenses.
In the context of Jordan, firms also appear to use bad debt provisions as tool to manage their
earnings downward.
“…my friend. If we do not get back our debit from our customers, for sure
we will get it as bad debt. The court will issue its decision to consider this debit
as bad debt, and then we will be able, by law, to deduct this amount from our
total tax amount for next 5 years. Therefore, we keep transferring this
amount from one year to another […] and all of that is based on the financial
manager’s experience that enables the saving of every penny for this firm.”
(Financial manager, Firm 3A), similar comment was also made by (Financial
manager, Firm 3B)
The collectability of accounts receivable is a matter that is determined ultimately by the
Jordanian court. Companies will apply to the court to take a final decision about whether
balances can be classified as bad debt and thus treated as tax deductible. The process is
therefore one of negotiation between the firm, the external auditor and the government.
Statement (3)
“We used this amount to deduct from our tax, and this issue is more
complicated since it takes a long time in the court to clarify. … The financial
department always try to increase the profit in order to avoid any problems
with the government. For example, the external auditor always demands that
we present bad debt provisions worth more than our profit (external auditors
refer to this issue as HANBALEH1), which means if we do not comply with
the external auditor’s recommendation, then this will lead to a reduction of
our stock price or it will stop our stocks in the Amman stock market.
Therefore, this point will start the strife between the firm (the audit
committee, general manager and internal control) and the external auditor …
so we do not have many ‘account receivables’ since we let our customers hold
75% from any real estate that they have under our account in the bank as a
1 HANBALEH: Meaning “something that you have to do without any discussion”.
Chapter Seven: Analysis of Interviews
253
guarantee.” (Financial manager, Firm 1) and (Financial and administrative
manager, Firm 2)
Furthermore, we found that the bad debt provision issue can become a problem for some
firms as obtaining the final decision from the court can be a lengthy process.
Statement (1)
“Our problem with bad debt is that the government need a final decision from
a local court, so we have customers from outside Jordan who we cannot judge
in Jordan, and in this case we start fighting with the government to consider
this debt and allow us to deduct it from our tax amount. Unfortunately, we do
not always get this money, and is the most common reason that prevents us
from exporting our product outside Jordan.” (Financial manager, Firm 1)
Statement (2)
“I can say that the bad debt issue is considered an important issue since it
might lead us to problems such as: decreasing our liquidity; reducing our
shareholders’ profit in the short term, since this provision has to go through
long procedures in the court to reach a decision; and decreasing our numbers
of new investors.” (Financial management manager, Firm 5), similar
statements were provided by (Financial manager, Firm 2) and (Financial and
administrative manager, Firm 1)
Accordingly, we conclude that our results are consistent with the results that have been
documented in the literature such as McNichols et al., (1988) and DeAngelo (1988), where
they found that the bad debt provision used to manage EM was particularly income-
decreasing. However, based on the previous quotations, this study found that the court
procedure is considered as an obstacle for delaying the firm to manage their earnings in the
short term by using bad debt provision which means that the bad debt provision could be
considered as a strong tool for Jordanian firms to manage their earnings in the long term.
In general, the process of applying to the court to ratify bad debt expenses for tax purposes
places Jordanian firms under more pressure which makes earnings management more likely.
The problems can result in earnings management being spread over multiple years and also

Chapter Seven: Analysis of Interviews
254
extend into other areas in business such as the volume of foreign customers, all of which will
increase the pressure to manage earnings.
7.3.12 Issues Related to External Auditors
Prior literature suggested several factors that could affect the external auditor’s ability to
decrease earnings management practices. These included; an external auditor’s reputation,
external auditors’ tenure, industry specialism, external auditor opinion, and external auditor
change (see: Mariani et al, 2010; Alkhabash et al, 2008; Piol et al, 2007; Alhayale et al,
2005).
Interviewees identified several roles of external auditors in achieving effective corporate
governance and more reliable financial reports. These included:
• Reviewing all firms’ financial transactions and reports according to international
accounting and auditing standards.
• Reporting their final financial reports to shareholders.
• Defending their reports in the annual general meeting.
The big argument in previous studies on this subject concerns whether complying with
corporate governance law that stipulate each firm has to change its external auditor yearly
(the audit partner rather than firm) leads to mitigation of earnings management practices (e.g.
Alghamidi, 2012; Chan et al, 2011; Chung et al, 2005). Standard setters for Account Audit
have suggested that in the long-term, external auditors might carry out audits less
independently within the firm, since they have built a strong personal relationship with firms'
shareholders and management resulting in external auditors taking less care, and also taking
auditing accounts as another routine work (Piol et al, 2007). Some studies have supported
this, such as Davis et al (2009) and Gul et al (2007). On the other hand, Myers et al (2003)
study the mandatory auditor rotation, and proposed that “the longer audit tenure reduces
earnings quality”. In fact, their empirical findings show the opposite result, where long
auditor tenure led to increased earnings quality, because longer tenure led to auditors being
able to place more constraints over extreme management decisions.
The corporate governance code in Jordan specifies that firms should change their audit
partner each year and the firm of external auditors every four years. Most of our interviewees
indicated that their firms did not change their external auditors (whether from ‘big four’ or

Chapter Seven: Analysis of Interviews
255
non-‘big four’ firms) for 4 years, but they change the partner from the same firm. This could
strengthen the relationship between external auditors and firms’ managers, which could
encourage firms’ managers to engage in earnings management.
“We do not change the audit firm, but we change the partner from within
this firm, just to follow Jordanian corporate law. Also I have a good
relationship with the external auditor, since we know each other from a long
time ago.” (Internal audit manager, Firm 8), and similar comments were also
made by the (Financial and administrative manager, Firm 2), (Financial
management manager, Firm 5), (Financial manager, Firm 2), (Financial
manager, Firm 1) and (Financial manager, Firm 6)
The reasons offered for non-compliance with corporate governance code consist mainly of
practicalities such as the cost and inconvenience of changing of auditors and the comfort
factors such as familiarity and a good relationship between auditor and manager.
On the other hand, one interviewee has documented that his firm changes its external auditor
every year to comply with the corporate governance law.
“Yes, we did change our external auditor last year to comply with corporate
governance law, where it stipulated that each firm has to change its external
auditor yearly. This will also lead to a reduction in the chances of a
relationship forming between external auditors and our employees, which
helps to avoid any account manipulation.” (Executive financial manager, Firm
7)
Jordanian corporate governance code has stipulated that each external auditor has to be
independent and must not have any relationship with any employee in the firm or firms that
he or she is auditing. External auditors are not and should not be expected to have a good
relationship with firms’ employees, particularly internal audit department employees (Davis
et al, 2009). Also, they are not expected to provide any firm with advice on accounting
policies or disclosure. In this regard, we found in most of our semi-structured Interviews that
managers received several types of advice from external auditors thanks to their long and
close relationship with them. These are advices such as, ways of avoiding government
regulations and listing regulations. For example:
Statement (1)

Chapter Seven: Analysis of Interviews
256
“We have good relationship with our external auditor, so he always warns us
of anything that might affect our performance in the AGM. For example, one
time he told us that our shareholders were focused on reducing costs, so we
should be careful and focus on this area and try to provide them with a good
plan for that, otherwise they might change our top management team.”
(Financial and administrative manager, Firm 4), similar statement were
provided by (Executive financial manager, Firm 7), (Financial manager, Firm
4)
Statement (2)
“Yes… the external auditor warns us if we are doing something in the wrong
way that might lead our shareholders to change the top management team.
We have always had a good relationship with our external auditor. Also, he
tells us about any new regulations that the government is planning to issue,
and how we can deal with them (e.g. tax gaps and investment gaps).”
(Financial management manager, Firm 5), similar comments were also made
by (Financial manager, Firm 3A) and (Financial manager, Firm 2)
These comments indicate a lack of independence of the external auditors in Jordan and also
their relationship with the firms’ managers, to the extent that the auditor appears to be acting
in the interest of manager rather than the interest of shareholders. External auditors also
seemed to be advising the clients how to avoid government regulation.
The Jordanian managers suggested several factors that could lead to shareholders choosing a
certain external auditor, and these are:
• The external auditor’s reputation, which includes information about his reliability,
independence and credibility.
• The external auditor’s education, experience, and professional auditing certifications
such as CPAs and CIAs.
• The external auditor's knowledge of government regulations.
• The external auditor's fees.
• The existence of a good relationship between shareholders and the external auditor.

Chapter Seven: Analysis of Interviews
257
• Ensuring that the external auditor does not hold any shares in the firm that he/she is
auditing.
7.3.13 Internal Auditors and Earnings Management
Internal auditors are responsible for evaluating firms’ work as related to financial reporting
processes, in particular the systems of internal control. In general, auditing standards and
company audit reports recognise that the existence of significant financial incentives based on
financial results leads to increases in the risk of accounting misstatements, which in turn lead
the auditors to exercise a sensible degree of professional scepticism in conducting the audit
(Hirst 1994). A few prior studies have investigated the relationship between internal auditing
standards and earnings management. Prawitt et al (2009) used components of the Statement
of Auditing Standards (SAS) No. 65 (the knowledge, skill, training, professional certification,
experience and objectivity of internal auditors) as measures of internal auditing quality and
showed that the quality of the internal audit affects earnings management. Davidson,
Goodwin-Stewart and Kent (2005) examined the impact of internal and external audit
functions on earnings management: their results showed that quality internal audit functions
decrease earnings management. Also, Van de Poel and Vanstraelen (2011) and Ewert and
Wagenhofer (2005) found that higher accounting and auditing standards decrease earnings
management.
During our interviews, we noticed that most of the interviewees suggested the internal
auditors in their firms are not sufficiently independent of the firm’s managers or the external
auditors. Reynolds and Francis (2001) documented that internal auditors’ levels of
independence varies from firms to firms, and having a strong, independent auditor in the firm
is likely to decrease the likelihood of managers engaging in earnings management. In this
regard, several managers stated:
Statement (2)
“Based on a long period of acquaintance, our internal auditor has a very
good relationship with our external auditor, and sometime we make trips and
enjoy our time, and let them accept certain expenses (e.g. hangers for
employees, hosting since we have large number of visitors). Also, he warns us
if there is any problem that we might soon be facing from the government.”
(Financial manager, Firm 3A), and similar comment was also made by the
Chapter Seven: Analysis of Interviews
258
(Financial manager, Firm 3B), (Financial and administrative manager, Firm 1)
and (Financial manager, Firm 1)
The managers indicated that there are several factors that may quality with respect to an
internal auditor, and these are:
• The internal auditor’s experience.
• The internal auditor’s education.
• The internal auditor's professional certifications such as the CIA, JCPA, or CPA.
• The internal auditor’s personal attitude.
• Ensuring that the internal auditor does not have a criminal record.
• The internal auditor’s reputation.
On the other hand, some managers suggested that their internal auditors were ineffective and
lacked the qualities necessary for the role:
“As I know, any internal auditor has to be qualified and have experience…
But unfortunately, our internal auditor has neither… I do not know why he
still in this firm, I think he was hired by his relative.” (Financial manager,
Firm 3), and similar comment was also made by the (Financial and
administrative manager, Firm 1)
Addressing the problem of the lack of quality in internal auditors, one manager
(Financial manager, Firm 2) suggested several solutions, and these are: (1) arranging
monthly meetings with the Financial manager to observe the new policies that might
arise from government regulations and economic circumstances, (2) working fiscally
on jobs based in all financial department in order to understand the system from the
point of view of each job. For example, working for one week with an accounts
receivable accountant and for one week with an accounts payable accountant, and
reviewing the work monthly to make sure they are following the procedure, which is
meant to guide us according the modern financial school.
However, this approach is not likely to improve the independence of the internal audit
function who should be able to determine the areas of their investigations themselves

Chapter Seven: Analysis of Interviews
259
and be free to criticise the decisions and behaviour of the senior management of the
firm. If the internal auditor is viewed as inexperienced and inferior to the manager then
his scrutiny of management cannot be effective.
7.3.14 Ownership Structure and Earnings Management
Ownership structure is deemed another important element of corporate governance that has
influence on several accounting issues (e.g. earnings quality, audit quality, audit fees, firms’
performance and earnings management). Accordingly, a large number of studies have
examined the impact of ownership structure on earnings management. Hosseini et al (2012)
and Alves (2012) showed that the type of corporate ownership significantly affects earnings
management level.
In the context of Jordan, Alfayoumi et al (2010) examined the influence of various ownership
structures (e.g. managerial ownership, institutional ownership and block-ownership) on
earnings management by using a sample of industrial firms listed on the Amman Stock
Market in the period of 2001 – 2005. They found managerial ownership to be significantly
related to earnings management but no relationship between the other two types of ownership
structure and earnings management.
To understand the concentration of ownership in our semi-structured Interviews, Table 6.9
presents the percentages of the ownership types that were provided by interviewees, and these
percentages are consistent with those that have been published in the Amman Stock Market
and annual financial reports. Three types of ownerships have been explored in these semi-
structured Interviews: institutional ownership, family ownership and individual ownership.
Several managers discussed the relationship between earnings quality, ownership structure
and corporate governance:
Statement (1)
“Most of our shareholders are institutional (97%) and all of these
shareholders hold top management or board of directors’ positions. For
example, board chairman, board member, or general manager.” (Financial
manager, Firm 4) and (Financial and administrative manager, Firm 1)
Statement (2)

Chapter Seven: Analysis of Interviews
260
“We never ever manage our profits or other accounts, since our board of
directors are mostly shareholders and they have strong controls that do not
allow for any room to manage anything.” (Financial manager, Firm 1)
Table 7-3 Shareholder Concentration in Semi-structured Interviews
NO Firm Institutional Shareholders
Foreign %
Institutional Shareholders
Local %
Individual
Foreign%
Individual
Local%
Family
Ownership %
Small shareholders
%
1 JPM 41.0 26.5 12.0 6.30 - 14.2
JWI 46.0 18.1 - 24.2 10.9 0.80
2 AAI 2.90 30.4 - 32.0 17.5 17.2
JIR 3.40 26.4 - 29.5 - 40.7
3 GMC - 13.8 - 68.2 15.0 3.00
P&C 26.6 47.5 - 11.9 11.9 2.10
4 UAI - 37.4 15.7 36.0 10.0 0.90
TRA - 97.4 - - - 2.60
5 MID - 15.7 - 8.30 71.0 5.00
6 JWM 1.90 56.9 - 14.0 11.9 15.3
7 PHO 48.5 42.0 - - - 9.50
8 POT 66.0 32.0 - - - 12.0
Based on Table 7.3 we see that eight of the twelve firm’s high institutional ownership
concentration and the remaining four have higher family or individual ownership. Previous
studies have shown that in the short-term a high level of institutional investment tends to
reduce earnings management in comparison to higher levels of family or individual
ownership (Koh, 2003; Fan et al, 2002).
Furthermore, Table 4.3, (see page 112) presents the ownership concentration in Jordanian
industrial firms, where it shows that more than 27% of Jordanian industrial firms are firms
owned by individuals, whether foreign or local. Individual ownership sometimes reaches

Chapter Seven: Analysis of Interviews
261
more than 98% of share capital in Jordanian industrial firms as mentioned in the semi-
structured Interviews. In this regard, one of the financial managers stated:
“…… when I was in XXX firm as financial manager, I remember that two of
shareholders own 99% from this firm capital shares” (Financial manager,
Firm 2).
However, and according to the interview analysis, it could be said that individual ownership
does not have a serious effect in managing earnings management in Jordanian industrial
firms. This result is consistent with the literature documenting that firms with high family
ownership are more likely to avoid manipulating their earnings to maintain their reputation in
the market such as Ali et al., (2008). Accordingly, the statement below was provided from
one of the financial managers among our interviewees:
“……most of firms that dominated with individual or family ownership types
always try keeping to be away from managing their profit to keep their
reputation in the market”. (Financial manager, Firm 6).
Nevertheless, as has been revealed by the secondary data, firms with high individual
ownership have tendency to be away from managing their earnings or constrain their earnings
management to retain their reputations in the market (see page 181).
As for family ownership, Table (4.3) (see page 112) the firms with a high family ownership
have a tendency not to manage their earnings whether upward or downward to maintain their
reputations in the market (see page 181). In conclusion, and based on the Amman stock
market classification for ownership structure, family ownership is considered part of the
individual ownership type (Amman Stock Market, 2015).
However, the relationship between institutional investment and earnings management is less
clear in the longer term (Koh, 2003). The anecdotal evidence provided by our interviewees
suggested that the ownership structure of the firm plays a significant role in earnings
management. Firms with high levels of institutional ownership, foreign or local, all reported
that they are engaged in income-reducing strategies in order to reduce the tax paid. This was
not the case for family owned firms. In this regard, two statements have been provided by our
interviewees:

Chapter Seven: Analysis of Interviews
262
“There are some investors particularly institutional firms came to this
country because of the weakness of corporate governance roles to achieve
their target profit, since they have the opportunity to increase or decrease it
based on their incentives …… When I talk about this issue I could say that
the foreign institutional firms have this issue more than local institutional
firms since they don’t have the loyalty for this country”. (Financial manager,
Firm 1)
This type of ownership (institutional) in the secondary data analysis has a significant effect
on earnings management as shown in Tables 6.7 and 6.8. (Pages 181 and 185). This result is
consistent with our result in this section, where the high portion of institutional ownership in
the firm is more likely to be related to upward earnings management. Table 4.3. (See page
112) presents the ownership concentration in Jordanian industrial firms, where it shows that
12.7% is foreign institutional ownership and 36.3% is local institutional ownership. This
pattern is consistent with the idea that investing institutions exert pressure on firms to manage
earnings whereas in family-owned firms earnings management is less important because
there is less accountability to external investors.
7.3.15 Firms’ Changing Positions in the Amman Stock Market and Internal Control
Systems
In the context of Jordan, several external environmental factors might affect internal control
systems, such as the economy, politics, and culture, in particular the movement on the
Amman stock market from lower to higher markets or vice versa (Mashoka, 2010). The
responses from our interviewees seemed to suggest that if the change is from a lower market
to a higher market this associated with improvement in the internal control system and overall
business performance.
Statement (1)
“Sure, it affected our profit and capital, both of which increased.
Accordingly, our financial position is stable and we have received several
applications from foreign investors to invest in our firm, in addition to
increasing our efficiency in controlling all our transactions.” (Financial
manager, Firm 6, similar comment also made by (Financial and administrative
manager, Firm 1)

Chapter Seven: Analysis of Interviews
263
If the change is from a higher market to a lower market this may be associated with
more problems with the internal control system which could affect earnings quality
in the firms particularly if the reason for change is related to the existence of
unqualified employees that the managers use to manipulate their earnings to
achieve their incentives (see section 7.5.7.4)
Statement (1)
“Our market position has changed from first market to second market since
2012, and the main reason was most our investors moving their funds to other
countries because of the revolutions in the area. Also, this change has
affected our internal control system, since most of our experienced employees
have been fired to reduce expenses. Accordingly, we have felt the effects of
this change. For example, in the form of a decrease in our capital and sales,
this in turn leads to less profit.” (Financial management manager, Firm 5) and
(Financial manager, Firm 1)
The interviewees’ four main reasons that led their firms to move down the stock market, and
these were as follows:
• Achieving losses for three consecutive years.
• Economic circumstances such as the financial crisis in 2008.
• Political circumstances such as the recent revolutions in the Middle East.
• Investors moving to other countries to avoid government regulations such as the high
tax rate.
Statement (1)
“We have had two changes; the first one was in 2007, when we moved from
the second market to the first market [because we showed two years of high
profit]. The second one was in 2010, when we moved from the first market to
the second market [because we made three years of losses consecutively]…
The first change leads us to attract more investors and increase our share
prices; this in turn led to more profit that year. The second change leads us to
lose some investors and our share prices decreased. In addition, we lost our

Chapter Seven: Analysis of Interviews
264
reputation in the market, which caused some investors to invest in other
sectors.” (Financial and administrative manager, Firm 4)
Statement (2)
“Our market position has changed two times; in 2011 and 2013. We moved
down this year (2013) because of politics and economic circumstances that led
our investors to withdraw their money and move it to other countries to invest
there… When we moved down we lost our reputation and our bonuses
stopped, since there were no more sales. Also, our top management fired
some employees to reduce costs. But now we are working hard to move back
to the first market again.” (Financial and administrative manager, Firm 1)
Statement (3)
“Our market status changed in early 2010, and this was because of politics
and economic circumstances in the area. This change has affected our firms
as follows: (1) decreased our reputation, which means less investor and (2)
decreased our share prices.” (Financial manager, Firm 4)
Statement (4)
“It absolutely affected our firm, by decreasing our reputation in the market,
which led us to lose some of our investors, which means more losses… So
you can look at our financial reports and compare between them and see the
differences.” (Financial and administrative manager, Firm 2)
7.3.16 Government Regulations and Earnings Management
Political cost theory suggests that firms subject to government regulations will be likely to
resort to earnings management in order to achieve objectives such as reducing the amount of
government-imposed wealth transfers (Watts and Zimmerman 1983). Chen, Li, Liang, and
Wang (2011) documented that government regulations (high political costs) affected earnings
quality in China as Chinese firms engaged in earnings management to avoid the high political
costs of China’s economic transition.
Furthermore, Guenther (1994) presented empirical evidence that showed a decrease in
earnings management levels in the large firms in the USA that were given a reduction in tax
rates. All of the managers in our interview firms took a pessimistic view of government

Chapter Seven: Analysis of Interviews
265
regulations and considered regulation to be detrimental to their business and among the main
obstacles that the firm faces in achieving its objectives.
“The main problem that we are facing nowadays, in addition to economic and
political problems, is dealing with government regulations in different ways
from other industrial firms. We are a part of the Jordanian society, and we
comply with government decisions, but the government uses some incorrect
strategies nowadays. For example, the government suggests that we reduce
our product prices to increase our profit, but in fact this suggestion will affect
us badly since the raw materials have such high prices.” (Financial manager,
Firm 1)
“Government regulations are considered a disastrous issue, since these
regulations are subject to change based on the taxation department’s
chairman, and the person in that position changes from time to time. Each
one of these chairmen establishes these rules based on his/her personal
decisions, to show the others that they have done something that the previous
managers did not do. This has caused us to get into a cycle without a
beginning or ending.” (Internal audit manager, Firm 8), similar comments
were made by (Financial management manager, Firm 5), (Financial manager,
Firm 3A), and (Financial and administrative manager, Firm 2)
Based on the quotes above and the discussion in several previous sections (firms’ financial
objectives in section 7.5.1, taxation system in section 7.5.10, and ownership structure in
section 7.5.14), this study documented that the government regulations in Jordan is
considered as an important factor that affect the earnings management level. For example,
increasing the tax rate was seen to be a great incentive for the managers to increase their
earnings (downward) to increase their taxable profit.
The managers reported that their firms are utilising three strategies to avoid government
regulations, and these are as follows:
• Changing country, this means moving the firms’ activities to other countries that have
less complex government regulations.
• Changing the accounting systems or accounting policies used.
Chapter Seven: Analysis of Interviews
266
• Using the gaps in the government regulations to avoid the impact of any given
regulation often under the guidance of the external auditors.
It is clear from these responses that the use of EM to avoid government regulation is
institutionalised in the managers’ behaviour and openly acknowledged as a response to the
perceived unfairness of the regulations.
7.4 Summary
Twelve semi-structured Interviews of Jordanian firms were produced from a range of
sources, including analysis of the results of earnings management estimates from accruals
models; review of published accounts for each firm; analysis of information published by
Amman stock market such as ownership structures and board composition; review of internal
company documentation such as organisation charts and semi-structured interviews. An
initial pilot interview was conducted with one of the firms and used to refine the interview
questions before the other interviews took place. Interviewees included general managers,
financial managers and internal audit managers with whom we discussed the pressures caused
by external economic and social factors, internal control and corporate governance
mechanisms within their firms and how they related to earnings management practices.
The initial questions in the interview explored the contexts in which the firms operate; their
structures in terms of ownership, corporate governance and internal control; their general
business practices; their approach to modernisation of accounting systems, including the
adoption of IFRS, and the use of IT. Finally, this section explored the nature of the
relationship between external auditors, internal auditors, board of directors, CEO and CFO.
Our semi-structured Interviews analysis identified the fact that there are several obstacles to
Jordanian firms to achieve their financial objectives, such as: economic and politics
circumstances; government regulations, and financial crises such as occurred in 2008.
Interviewees stated that these obstacles could cause two effects: (1) encouraging investors,
both foreign and local, to leave for other countries that have less complex regulations or
better economic circumstances, (2) encouraging firms’ managers to engage in earnings
management to avoid these obstacles, particularly government regulations.
Consideration of the quality of corporate governance is a new phenomenon in Jordan, and we
noticed from our semi-structured Interviews that a large proportion of directors are
shareholders, which may cause a conflict of interest. The Jordanian Corporate Governance

Chapter Seven: Analysis of Interviews
267
Code requires that board members be appropriately qualified. In smaller firms many
shareholders are involved in operating decisions even though they are unqualified and lack
personal business experience. They are in these positions purely because of their wealth. On
the other hand, large firms tend to have more qualified and experienced board members, who
are independent of shareholders.
Furthermore, the holdings of the CEO and board chairman positions at the same time by one
person is another problem that affects Jordanian industrial firms, and several interviewees
indicated that their firms suffered from this problem, which sometimes leads the manager
who is holding these two positions to engage in earnings management to achieve personal
incentives such as increasing his/her bonuses and compensation.
Proceeding from the importance of internal audit functions that lead to improvement in firms’
performance and protect them from any fraud or manipulation, the Jordanian Corporate
Governance Code stipulates that each firm has to have an independent internal audit
department to examine all its transactions, and it is deemed as a hub connecting the board of
directors and the top management and external auditors. In our semi-structured Interviews
analysis we found that some firms do not have such as department, and this is usually for one
of these two reasons: (1) because of the costs of running an internal audit department, and (2)
to comply with the desire of the board of directors, who see the existence of the department
as unnecessary and believe the work of the external auditors to be sufficient.
As for external auditors, we noticed that most Jordanian firms do not comply with the
Corporate Governance Code that require the change of external auditor on an annual basis. In
addition, we found that most firms have a strong relationship with their external auditors,
which in turn may result in external auditors lacking the necessary levels of independence
and the auditors providing advice to firms on how to manage the earnings.
Prior studies’ cite agency theory, which states that the corporate governance mechanism,
including the board of directors’ and the audit committee’s characteristics play big roles in
enhancing firms’ performance and the quality of financial reports (Alghamdi, 2012).
Jordanian firms are attempting to improve their internal control systems in different ways, but
all interviewees indicated several problems that could prevent them from achieving this
objective, such as: the weakness of internal auditors’ qualifications, the lack of an internal
audit department in some firms and cultural factors which are outline below.

Chapter Seven: Analysis of Interviews
268
The middle section of the interview was devoted to exploring the reasons why the firms
engaged in earnings management and discussed various motivations for managers’ practices.
These drivers included the firm’s response to the economic environment in particular, the
recent economic crises; the firm’s ownership structure; changes in government regulations;
the firm’s position in the Amman stock market; and various social and culture factors.
We concluded that the most common ownership types in Jordanian industrial firms are
institutional ownership and family ownership, and numerous prior studies have documented
that high institutional ownership concentration is more likely to lead the firms’ managers to
engage in earnings management practices (e.g. Alves 2012; Alfayoumi et al 2010). This also
proved to be the case with our firms where those with institutional ownership admitted to
engaging in earnings management practices.
Several motivations for earnings management related government regulation were explored
in the semi-structured Interviews analysis and the managers’ perceptions of the fairness of
regulatory changes appeared as strong motive. The rapidly increasing tax rate was the most
important factor, and appears to lead Jordanian firms to manipulate their earnings downward
in order to pay lesser tax.
In the context of culture, most of the prior studies documented that cultural factors
significantly affect earnings management levels in firms (Desender et al 2011; Guan et al
2010). Most of the interviewees reported that cultural factors affected the quality of reported
earnings. The factors cited included the effect of the tribal system; favouritism in recruitment
decisions; the system of Wasta; the practice of hiring unqualified employees (particularly in
internal audit departments); the attitude and mentality of some employees and the effect that
different dialect have on communication. These factors are seen to result in situation where
firms’ managers engage in earnings management to achieve their incentives, since they
believed that there is no one who can stop them.
The final section of the semi-structured Interviews focuses on the means by which the
managers manipulate their earnings and they reported the main tools they used were
manipulation of the accounts receivable balances and overstatement of expenses in particular
bad debt provisions and management expenses.

Chapter Eight: Summary and Conclusions
269
8. Chapter Eight: Summary and Conclusions 8.1 Introduction
This thesis aims to investigate the effects of internal controls and corporate governance
mechanisms on earnings management practices in Jordanian industrial firms. With that in
mind, the main important research questions are:
“Is there a relationship between internal control, corporate governance mechanisms and earnings management in Jordanian industrial companies?”
“What are the characteristics of the relationships between these factors, the nature of the processes underlying them and the context in which they occur”
This chapter summarizes the research methodology and then provides a summary of the
results from both the quantitative analysis and from our semi-structured Interviews. We then
draw a number of conclusions and discuss the implications of our results in the context of our
review of the existing literature. Finally, the chapter presents a discussion of the contribution
made by this research, the limitations of our methodology and suggestions are made for
future research.
8.2 A Brief Summary of the Research Methodology
Our methodology was designed to investigate in what way internal control and corporate
governance mechanisms are related to earnings management in Jordanian industrial firms. To
do this, we explore the motivations that may lead Jordanian industrial firms’ managers to
engage in earnings management to achieve their desired incentives. We use three accruals-
based models, the Standard Jones Model (Jones, 1991); the Modified Jones Model (Dechow
et al, 1995); and the Margin Model (Peasnell et al, 2000) to generate earnings management
estimates for a sample of Jordanian industrial firms. This also gives the opportunity to
evaluate which of the models is most appropriate for identifying earnings management in this
context.
To address the questions of why the earnings management occurred and to examine in more
depth the processes by which it occurred, we investigate a number of the individual firms as
semi-structured Interviews. Accordingly, the final result is mixed-methods research in four
stages to analyse the research data:
• First stage: in this stage, we use earnings management models (SJ, MJ and PPY) to

Chapter Eight: Summary and Conclusions
270
estimate earnings management values using various measures of accruals as the
dependent variable and known predictors of accruals as independent variables, where
the earnings management estimates are the residuals (unexplained factors) from the
regression analysis. We use financial data from annual reports available from
DATASTREAM, the Amman Stock Market (ASM), and the Jordan Securities
Commission (JSC) to run these models.
• Second stage: the researcher uses published annual financial reports from the Amman
Stock Exchange website to collect data on measurable internal control and corporate
governance variables, such as the characteristics of boards of directors, audit
committee characteristics, external audit factors, and ownership.
• Third stage: we combine the second stage variables with the earnings management
estimates from the first stage regression to determine the extent in which they are
associated. Initially, statistical significance of findings from both OLS and GLS
regression models (see Appendix 4 for GLS regression models) are too low, arising
from the relatively small sample sizes and that the earning management variables are
not distributed normally and the causality of its relationships with the other variables
was unclear. Following that, we model the earnings management variable as a
categorical variable, with three categories, low EM, high positive EM and high
negative EM.
• Fourth stage: in this stage, we conduct 12 semi-structured Interviews with the main
element focuses on semi-structured interviews with 16 managers (general managers,
financial managers an internal audit managers) in order to collect in-depth
information about factors that are related to internal control and corporate governance
factors, such as the effect of the tax system; different approaches to the use IT in the
accounting system; the rights and responsibilities of the CFO/CEO; and cultural
factors that could be associated with earnings management in the context of Jordan.
These four stages of research help to provide important evidence depicting the
relationship between internal control and corporate governance mechanisms and earnings
management and the context in which these processes occur. The implications on research
outcomes of using the mixed methods are as follows:
• The combination between quantitative results and qualitative results may be complementary to the individual results of both methods.
• The combination between quantitative results and qualitative results may be challenging to the results of both methods.

Chapter Eight: Summary and Conclusions
271
• The combination between quantitative results and qualitative results may lead to the two methods “talking past” each other. (Brown and Brignall, 2007)
We discuss these three outcomes in relation to our research findings in section 8.4 below.
8.3 Summary of the research findings and Conclusion
8.3.1 Quantitative Findings
Accruals Models
Among the three models that are used to estimate earnings management for our sample (the
Standard Jones, Modified Jones and Margin models) the PPY model gives the best fit with
the most statistically significant and the best specified model. The R2 value for the PPY
model is 84% compared to 63% for the MJ model and 15% for the SJ model. Tests of model
specification also indicate that squared-terms would be significant if they were included in
the SJ and MJ models but not in the PPY model, indicating that PPY is better specified. This
result is interesting as the PPY model has not been widely used in research in Jordan or other
developing countries, and the Modified Jones model is usually preferred, even though the
results it produces are, at best, mixed. It is likely that the PPY model is a better description
for the Jordanian data as it focuses on working capital accruals and our analysis of annual
reports and interviews identify that bad debt provisions and the manipulation of expenses are
both likely to play a significant part in earnings management in Jordanian companies. The
PPY model is more likely to identify these factors than the Jones models.
Models including corporate governance and internal control variables
This section includes the results of t-tests and quadratic discriminant analysis to predict the
earnings management category into which each firm falls into (low EM/High positive
EM/High negative EM) based on the corporate governance and internal control variables.
T-Tests for the Difference between Means
These tests examined for each of the corporate governance variables differences between
means of groups based on the earnings management categories. In order to compare two EM
categories at a time, t-tests are carried out for the following groups for each corporate
governance variable:
• HI+EM compared to HI-EM.

Chapter Eight: Summary and Conclusions
272
• HI+EM compared to low EM.
• HI-EM compared to low EM.
• HI±EM compared to low EM.
As with the accruals models, the models using the PPY estimates of earnings management
has results that are more significant than those using the SJ and MJ models. In models that
used the SJ/MJ estimates, "the board of directors’ characteristics" variable is mostly
insignificant, with the exception of "the number of board meetings", which is significant for
the MJ model only. Similarly, the variables based on audit characteristics are generally not
significant in predicting earnings management estimates based on the SJ/MJ models. The
most significant factor in predicting the SJ/MJ estimates is one of the ownership structure
variables, which is "the proportion of individual ownership".
We found "external auditor opinion" significant and positive for PPY/MJ estimates and
negative for SJ estimates, this suggests that the "external auditor opinion" is a predictor of the
occurrence of earnings management in the Jordanian industrial firm, although the direction of
the relationship is not established clearly. With respect to earnings management estimates
from the PPY model, several explanatory variables, including board characteristics, audit
characteristics and ownership characteristics, are significant in predicting earnings
management groups. These are board size, numbers of outsiders of the board, audit
committee size, number of audit committee meetings, audit committee expertise, individual
equity ownership and family ownership.
Quadratic Discriminant Analysis (QDA)
In this section, the QDA classification accuracy for earnings management groups for all
models is found to be high and consistent with the t-tests results. The corporate governance
variables are used here to predict the firms’ membership of the different earnings
management categories: high positive EM, high negative EM and Low EM. The overlap
between the groups for the SJ earnings management estimates are small, which means that
the model discriminates well among these groups. The overlap between the groups using the
MJ estimates is smaller than SJ, which means the corporate governance variables predict the
MJ estimates more accurately. As for PPY estimates, we found the corporate governance
variables do not predict as well as for the PPY as for the MJ estimates.

Chapter Eight: Summary and Conclusions
273
We then investigate properties of the MJ estimates further and ran the quadratic discriminant
analysis for each group of corporate governance variables (board characteristics, audit
characteristics and ownership characteristics) in turn. The results indicate that ownership
structure is by far the most effective variable for predicting whether firms are engaging in
low, high positive (income increasing) or high negative (income decreasing) earnings
management practices.
The PPY estimates are more clearly related to firm characteristics when looking at each
variable in isolation (in the t-tests), but when variables are all combined together and
interaction is allowed, the firms’ characteristics classify the MJ estimates of EM more
accurately.
Overall, this research concludes that the PPY model works better for detecting earnings
management in the context of Jordan. This is likely to be because the PPY model is based on
working capital accruals and as identified from the data of our semi-structured Interviews, the
accounting policies that the firms used to manipulate earnings are primarily associated with
revenue, accounts receivable, bad debt provisions and management expenses. This
conclusion is important as previous studies of earnings management in Jordan and other
developing countries have used the Jones and Standard Jones models.
Unfortunately, in the context of the models using corporate governance and earnings
management variables, none of the models worked well, possibly this is because the
corporate governance mechanisms in Jordan are in an early stage of development.
8.3.2 Summary of Semi-structured Interviews Results and Conclusion
We conduct 12 twelve semi-structured interviews from the sixteen firm managers (general
managers, financial managers, and internal audit managers) as the main component. A
discussion of the results from the semi-structured Interviews is provided in chapter six, and a
summary is shown below.
Cultural Factors
The cultural factors identified by our interviewees, such as the Wasta and tribal systems,
apparently have negative effects on the firms in a number of ways. They cause problems in
the recruitment decisions, which result in people being appointed to roles for which they do
not have the qualifications or experience. This could result in mangers that are less likely to

Chapter Eight: Summary and Conclusions
274
question the board of directors and, in addition, may result in more errors in the financial
statements. The Wasta and tribal systems also affect the efficiency of business operations.
For example, in one of our firms, through delaying the issue, products' licenses in the
pharmaceutical sector, and can create barriers to competition. Therefore, we concluded that
the Wasta and tribal systems are likely to create weaknesses in corporate governance or
override internal control mechanisms and this creates conditions for earnings management to
thrive. In addition, the extra pressure on firm performance created by the inefficiencies may
increase managers’ motivations to use income increasing earnings management techniques. It
is not possible to understand the nature of earnings management in Jordan without
consideration of these cultural factors and prior literature on EM in Jordan has failed to do
this because of its focus on quantitative modeling and the Jones and Standard Jones models in
particular.
External Environmental Factors
The semi-structured Interviews identified a number of external economic factors affecting
internal control and corporate governance mechanisms in Jordan during the period of our
study, including the revolutions in the Middle East, the financial crisis of 2008, and the IFRS
adoption. The interviewees reported that they had responded to these external factors by
improving internal control and corporate governance systems in an attempt to mitigate the
risks that arose from them. These factors had also led some managers to follow different
approaches in their accounting systems and move away from more traditional, paper-based
systems to a more modern IT based system, with stronger internal controls. The changes also
give more flexibility to the firms’ managers to meet both government requirements and
accounting standards simultaneously. Accordingly, these benefits arising from the firm’s
responses to challenging external factors are likely act to constrain earnings management.
Motivations for Earnings Management
The semi-structured Interviews uncover a number of motivations for earnings management
that existed in the firms. These motivations include attempts to pay less customs fees to the
government, attempts to reduce the firm’s tax bill the belief that the firm would be able to
attract more investors, and managers trying to increase their own earnings-based bonuses and
compensation.

Chapter Eight: Summary and Conclusions
275
We are unable to relate the anecdotal evidence of earnings management used at the individual
firm level to the earnings management estimates generated for each firm by the accruals
models. The managers mainly reported motivations that might be associated with income-
decreasing accruals, particularly the requirement to reduce the firm’s taxation, but these firms
are not identified by the accruals models as having high negative accruals. Similarly, the
firms reporting income-increasing motives are also not identified by the accruals models as
having high positive accruals. This may be due to the weakness in the accruals models in
predicting EM in the context of Jordan or that the interviewees are possibly pessimistic in
their responses and resulting in them over-estimate the influence of the tax system on their
firm’s accounting policy choices.
Means of Earnings Management
The managers interviewed revealed details of several accounting policies that were used in
their firms for the purposes of earnings management. The common policies involved
recognition of revenue, and manipulation of the bad debt provision and management
expenses. Bad debt provisions proved to be a particular problem in Jordanian firms as their
aged debtor ledgers contained some large balances that were as old as 5 years and the figures
were therefore uncertain. Some of these debts arose from uncollected balances from
customers in countries that had been affected by the recent revolutions and this leads to a
high proportion of firms (17 %) receiving a going-concern qualification in their audit report.
The pressure on performance created by these bad debts may well result in firms using
earnings management to improve their reported earnings numbers and the bad debt provision
provided them with a tool to achieve this. Understanding the effects of bad and doubtful debts
on firms and their relationships with earnings management could be a motivation for the
court and auditors to reconsider the policies relating to bad and doubtful debts, where one of
the policies is for the firms to claim it for five years once they get a final decision from the
court to deduct it from tax paid.
Factors Facilitating Earnings Management
Several factors identified in the semi-structured Interviews could facilitate EM, and these are:
1) the lack of an effective internal audit system in some firms. Despite the Corporate
Governance Code in Jordan highlighting the importance the internal audit department in
firms. In our case, a number of firms in our sample did not have an internal audit department.

Chapter Eight: Summary and Conclusions
276
The absence of this department in the firms may lead to weakness in internal control system
and motivate firms’ managers to engage in earnings management to achieve their desired
incentives. 2) A long-term relationship with external auditors, especially those who have
continuously acted as external auditors for a long time, would imply a closer relationship
with top management, which means that auditors are less likely to challenge managers’
decisions, and this could potentially lead them to be involved in earnings management. 3)
CEO/chairman duality, where one person holds both roles, may cause a weakness in the
internal control system in the firm and this weakness allows the managers to engage in
earnings management.
A final conclusion from our semi-structured Interviews is that the stock market status of the
listed firm (e.g. first, second, and third markets) is not an important motivating factor for
earnings management in Jordan, despite the fact that existing literature has suggested that it is
important.
8.4 Combination of Quantitative and Qualitative Results
This section discusses the possibilities for combining the results of our quantitative and
qualitative analyses, in the light of the methodological issues that are discussed in chapter 4.
To do this we consider whether our quantitative analysis and semi-structured Interviews
complement each other, contradict each other, or whether they talk past each other. (Brown
and Brignall, 2007). In general, there are few instance in which the results of our two
approaches complement each other, although one instances is the specific accounting policies
managers disclosed as the instruments of earnings management.
Our semi-structured Interviews have identified several instruments that could lead the
managers to engage in EM including manipulation of the bad debt provision, management
expenses and revenue. These terms are related directly to the PPY model variables, and this
may be the reasons for the PPY model to stand out as a better model for detecting EM among
Jordanian firms.
There are far more instances where the results from both methods appear to challenge each
other. In particular, we did not see the earnings management described by the managers in the
firms to reflect in the estimates for individual firms from the accruals models. For example,
our semi-structured Interviews show that most of the firms’ managers engaged in income-
reducing earnings management in an attempt to pay less tax and less custom fees but our

Chapter Eight: Summary and Conclusions
277
quantitative findings do not show the same results. In addition the main corporate governance
factors seem to be related to earnings management in the quantitative analysis were not given
the same weight by interviewees.
It is possible that the views of the world underlying the quantitative analysis and the semi-
structured Interviews are so fundamentally different that the results show that both methods
are “talking past” each other. This would follow from the idea of paradigm
incommensurability. Our semi-structured Interviews identified several cultural and
environmental factors, which the interviewees believed are important in identifying EM in
Jordanian firms and such factors are not included in the empirical models. The accruals
models identify the relative size of abnormal accruals across the sample of companies and it
may be that interviewees only possess knowledge of earnings management in their own
company and have no idea about the size of their accruals relative to other firms. It is also
possible that the accruals models do not accurately identify the firms using earnings
management in Jordan. Overall, the semi-structured Interviews provide some significant
insights into the mechanisms and motivations of earnings management in Jordanian firms but
it is not possible to integrate the results of the semi-structured Interviews with the results of
the quantitative models to give any coherent analysis. Although both approaches are
investigating the same phenomenon, they clearly view it in fundamentally different ways.
8.5 Summary of Research Contributions
Several contributions are made by this research, which are summarized as follows:
• This research is one of the first studies to use mixed methods (quantitative and
qualitative) to investigate the association between earnings management and
corporate governance mechanisms; most prior studies that examine similar issues
have used only quantitative methods. This allows a richer study on the underlying
processes and mechanism by which earnings management occurs.
• This research presents its results by investigating the effects of a number of different
elements of internal control and corporate governance, including board
characteristics, audit committee characteristics, external audit factors, and ownership
structure. This differs from prior studies, which have considered only one aspect in
isolation and taken a less holistic approach to corporate governance.
• As far as we know, this research is also the first to use Margin Models to measure
earnings management in developing economies. The results of the accruals models

Chapter Eight: Summary and Conclusions
278
reveal that the Peasnell, Pope and Young model is better than the Standard Jones and
Modified Jones models in detecting earnings management in this context and this
information is likely to prove useful to other researchers wishing to study earnings
management outside the context of developed economies, where capital markets are
relatively more efficient and the corporate governance and accounting systems more
well developed.
• This research is also one of a few studies in the world to examine the effect of internal
control and corporate governance mechanisms on earnings management over a period
of more than five years. The majority of studies are conducted over shorter time
periods and therefore do not reflect change variables well, such as the movement of
the firms up and down the different stock markets classification in Jordan.
• To the best of our knowledge, this study is the first to have used a categorical variable
to reflect earnings management estimates. Existing studies use a binary classification
of earnings management such as low/high. However, the nature of earnings
management in practice is such that a binary classification does not reflect the
presence of income-increasing and income-decreasing earnings management policies
in the high category. This means that the direction of the relationship between the
earnings management variable and other variables is impossible to predict, since
income-increasing and income-decreasing policies work in opposite direction, which
will reduce the significance of regression results. We have therefore constructed a
variable to reflect three categories of earnings management high positive EM, high
negative EM and low EM, to help use make predictions about the direction of the
relationship between earnings management and the corporate governance factors.
• This research is also the first study in Middle East countries to explore the association
between cultural factors and earnings management.
• This PhD used a new quantitative method (quadratic discriminant analysis) to
investigate the relationship between earnings management and corporate governance
mechanisms.
8.6 Research Limitations
Jordan is one of the countries in the Middle East which faces several factors that might affect
the conduct of social studies research, relating to aspects of culture, religion, social life and
economic circumstances. Accordingly, the interview and secondary data of this research

Chapter Eight: Summary and Conclusions
279
faced some problems, which are described below:
Semi-structured Interviews Limitations
First, there are difficulties in transcribing Arabic idioms into English; as all of our interviews
were spoken, sometimes in colloquial Arabic, if we had translated everything literally then
the resulting translation may have been unrepresentative, so the semi-structured Interviews
had to be translated into language that preserved the idioms and these were not always easy to
convey accurately.
Second, most of the interviewees initially expressed reservations about engaging in this
research due to the sensitivity of the research subject; some of them commented that they
could lose their jobs if they revealed any information about their firms’ situations, whether
financial or operational in nature. Despite this the responses they ultimately gave appeared to
be frank and comprehensive, although given the subject matter there is still a possibility that
responses may not have been entirely honest. It is possible that interviewees could not give
bad impressions of their firms since they were scared of getting fired from their positions, so
their responses may have been biased towards giving good impressions of their firms.
Third, the exploration of observations in our study was limited to listed industrial firms, and
does not include financial and services firms which may have different characteristics from
industrial firms. This means that the results may not apply to other types of firms.
Fourth, this research is based on a small number of semi-structured Interviews (12 firms)
from the firms that are included in our quantitative method (56 firms), which means the
results of semi-structured Interviews may not be applicable to other firms. This is a normal
attribute of semi-structured Interviews research, which focuses on the depth of information
rather than generalisablity.
Finally, several semi-structured Interviews had more than one interviewee, which sometimes
led to conflict between them as each of them tried to present his/her own opinion as the right
one. This could be due to several reasons such as, 1) the differences between managers’
educational backgrounds, for example in one of these firms one manager who had accounting
expertise disagreed with the second manager who had a more general business background,
2) their culture, where some of them are from city and others from villages, in which case
those from villages might tend to defer to their city colleagues and 3) some of them may

Chapter Eight: Summary and Conclusions
280
have felt the need to maintain their reputation in the firm when speaking in front of their
colleagues. It may also be that the interviewees did not have the detailed knowledge of
earnings management in the firm and its effects, particularly those whose backgrounds are
not related to accounting.
Secondary Data Limitations
First, extracting the financial data for 2012 took a long time, since this data did not exist on
DataStream, where we usually collect data from the annual financial reports of Jordanian
industrial firms that are published on the Amman Stock Market. Instead, the researcher
referred to each firm’s annual report separately, which was a time-consuming process. In
addition, values for a large number of variables were missing from DataStream for different
years; this in turn meant the researcher had to extract these values from annual reports, which
was another time-consuming process. Many of the annual reports were not clear, which in
turn led the researcher to contact the Amman Stock Market research office, which requires
authorisation from the Amman Stock Market President, who was inaccessible.
Second, some variables were not available with net value on DataStream or the Amman
Stock Market, such as gross account receivable, which meant undertaking further work using
different formulae to get the net values for these variables, which was also a time-consuming
process.
Third, in the context of earnings management, there are several accruals models which can
detect earnings management practices, which means that there is no consensus in prior
literature about any particular earnings management model. This led to some conflict between
the results of the earnings management models that were used in this research (SJ, MJ and
PPY Models).
Finally, this research used four control variables (CFO, ROA, FLVE and FSUB), and some
control variables impacting earnings management and corporate governance mechanism may
not be included in experimental models, which means that there could be other variables
which might affect earnings management levels in Jordanian industrial firms that were not
investigated by this research since the main aim of this PhD thesis is not to examine causality,
but rather the relationship between earnings management and attributes of corporate
governance mechanisms.

Chapter Eight: Summary and Conclusions
281
8.7 Future Research and Recommendations
There are numerous areas that have not been covered by PhD research but which deserve
further consideration in future studies. Our research has demonstrated that Standard Jones
and Modified Jones models, which are models used by previous researchers, are not well-
specified and are not very effective in identifying earnings management in Jordanian firms.
The Peasnell, Pope and Young accruals model appears to be a better model in this context and
our recommendation is, therefore, that more studies should be undertaken in the Middle East
and possibly in other developing economies using the PPY model.
One of the findings of our detailed semi-structured Interviews is that it reveals a range of
external economic and cultural factors that are associated with earnings management in
Jordan. The semi-structured Interviews also uncovered a number of motivations for earnings
management and the specific accounting techniques used by managers to achieve earnings
management. This information would be particularly useful to the accounting profession,
auditors and regulators in Jordan who have an interest in understanding and trying to
constrain earnings management.
Furthermore, replication of this research methodology in developing economies is likely to
provide in-depth information that allows these countries to explore the strengths of their
corporate governance mechanisms and internal control systems in detecting earnings
management, which will also allow countries with weak corporate governance mechanisms
address these weaknesses and to, accordingly, reduce earnings management practices in their
firms.
The corporate governance code in Jordan is still in the development stage, and most of the
firms are still not complying with most of the rules. Future researchers could examine the
effect of these departures from the code in more depth and study the effect on earnings
management after the code has been fully developed and when more firms comply with it.
Finally, one other finding revealed from our interviews is that bad debt provision is an
important issue that can affect earnings management and earnings quality issues in Jordanian
industrial firms. This issue is important as it also leads to a high proportion of Jordanian firms
receiving a going-concern qualification in their audit report. This problem is significant not
only to earnings management but to accounting disclosure more generally and to firm
performance. This problem could be an opportunity for future researchers to explore in their

Chapter Eight: Summary and Conclusions
282
future research as a separate issue.

REFERENCES
283
9. REFERENCES
Abbott, L, Parker, S and Peters, G, 2004. Audit Committee Characteristics and Restatements. Auditing: A Journal of Practice and Theory, 23 (1), pp. 69-87.
Abbott, L. J. and Parker, S, 2000. Auditor selection and audit committee characteristics. Auditing: A Journal of Practice and Theory, 19 (2), pp. 47 – 66.
Abdullatif, M, 2006. The Effectiveness of Audit Committees in Jordanian Public Shareholding Companies and Potential Company Characteristics Affecting It: Perceptions from Auditors in Jordan. Dirasat, Administrative Sciences, 33 (2), pp. 450 – 468.
Abdul Rahman, R and Ali, F, 2006. Board, audit committee, culture and earnings management: Malaysian evidence. Managerial Auditing Journal, 21 (7), pp. 783 – 804.
Abed, S., Al-Attar, A and Suwaidan, M., 2012. Corporate governance and earnings management: Jordanian evidence. International Business Research. 5 (1), pp. 216 – 225.
Ahmed, K., Hossain, M and Adams, M, 2006. The Effects of Board Composition and Board Size on the Informativeness of Annual Accounting Earnings. Corporate Governance: An International Review, 14 (5), pp. 418 – 31.
Ahmad-Zaluki, N and Wan-Hussin, W, 2010. Corporate governance and earnings forecasts accuracy. Asian Review of Accounting, 18 (1), pp.50 - 67.
Ahmadpour, A and Shahsavari, M, 2016. Earnings Management and the Effect of Earnings Quality in Relation to Bankruptcy Level (Firms Listed at the Tehran Stock Exchange). Iranian Journal of Management Studies, 9 (1), pp. 77 – 99.
Agrawal, A and Knoeber, C, 1996. Firm Performance and Mechanisms to Control Agency Problems between Manager and Shareholders. Journal of Financial and Quantitative Analysis, 31 (3), pp. 377 – 397.
Aguilera, R and Jackson, G, 2010. Comparative and international corporate governance. The Academy of Management Annals, 4 (1), pp. 485 – 556.
Ajona, A, Dallo, L and Alegria, S, 2008. Discretionary accruals and auditor behaviour in code-law contexts: an application to failing Spanish firms. European Accounting Review, 17(4), pp. 641 – 666.
Alexander, D and Archer, S, 2003. On economic reality, representational faithfulness and the 'true and fair override. Accounting and Business Research, 33 (1), pp. 3 - 17.
Alfaraih, M, Alanezi1, F and Almujamed, H, 2012. The Influence of Institutional and Government Ownership on Firm Performance: Evidence from Kuwait. International Business Research, 5 (10), pp. 192 – 200.
Alfayoumi, N and Abuzayed, B, 2009. Ownership structure and corporate financing. Applied Financial Economics, 19 (1), PP. 1975 – 1986.
Alfayoumi, N, Abuzayed, B and Alexander, D, 2010. Ownership structure and earnings management in emerging markets: the case of Jordan. International Research Journal of Finance and Economics, 38 (4), pp. 29 – 47.
Alghamidi, S.A, 2012. Investigation into Earnings Management Practices and the Role of Corporate Governance and External Audit in Emerging Markets: Empirical Evidence from Saudi Listed Companies. (PhD thesis). (Accounting and Finance Department), Durham University.
Algharaibeh, M, Zurigat, Z and AlHarahsheh, K, 2013. The Effect of Ownership Structure on Dividends Policy in Jordanian Companies. Interdisciplinary Journal of Contemporary Research in Business, 4 (9), pp. 769 – 796.
Alhaddad, W, Alzurqan, S and AlSufy, F, 2011. The Effect of Corporate Governance on the Performance of Jordanian Industrial Companies: An empirical study on Amman Stock Exchange. International Journal of Humanities and Social Science, 1 (4), PP. 55 – 69.
Alhayale, T and Lan, G, 2005. The ethicalness of earnings management in the Middle East: a survey of managers and auditors in Jordanian companies. International Journal of Accounting, Auditing and Performance Evaluation, 2 (4), pp. 399 – 413.
Ali, S, Salleh, N and Hassan, M, 2008.Ownership Structure and Earnings Management in Malaysian Listed Companies: The Size Effect. Asian Journal of Business and Accounting, 1(2), pp. 89 -116.
Aljifri, K., & Moustafa, M. (2007). The Impact of Corporate Governance Mechanisms on the Performance of UAE Firms: An Empirical Analysis. Journal of Economic and Administrative Sciences, 23 (2), pp. 71 – 93.
Alkdai, H and Hanefah, M, 2012. Audit committee characteristics and earnings management in Malaysian Shariah-compliant companies. Business and Management Review, 2 (2), pp. 52 – 61.
Alkhabash, A and Althuneibat, A, 2008. Earnings management practices from the perspective of external and internal auditors: evidence from Jordan. Managerial Auditing Journal, 24, pp. 58 – 80.

REFERENCES
284
Almudehki, N and Zeitun, R, 2012. Ownership Structure and Corporate Performance: Evidence from Qatar. Available at SSRN 2154289.
Alon, Y, 2005. The Tribal System in the Face of the State-formation Process: Mandatory Transjordan, 1921 – 1946. International Journal of Middle East Studies, 37 (2), pp. 213 – 240.
Alsawalqa, F. and Qtish, A., 2012. Internal Control and Audit Program Effectiveness: Empirical Evidence from Jordan. International Business Research, 5 (9), pp. 128 – 137.
Alsufy, F, Almbaideen, H, Alabbadi, H and Makhlouf, M, 2013. Corporate Governance and Its Impact on the Quality of Accounting Information in the Industrial Community Shareholding Companies Listed in Amman Financial Market- Jordan. International Journal of Humanities and Social Science, 3 (5), pp. 184 – 195.
Altman, E, 1968. Financial ratios, discriminant analysis and the prediction of corporate bankruptcy. The journal of Finance, 23 (4), pp. 589 – 609.
Altamuro, J and Beatty, A, 2010. How does internal control regulation affect financial reporting? Journal of Accounting and Economics. 49, pp. 58 – 74.
Alves, S, 2013. The impact of audit committee existence and external audit on earnings management: Evidence from Portugal. Journal of Financial Reporting and Accounting, 11 (2), pp.143 – 165.
Alves, S., 2012. Ownership structure and earnings management: evidence from Portugal. Australasian Accounting Business and Finance Journal, 6 (1), pp. 57 – 74.
Alves, S., 2011. The effect of the board structure on earnings management: evidence from Portugal. Journal of Financial Reporting and Accounting, 9 (2), pp. 141 – 160.
Alzoubi, E and Selamat, M, 2012. Proposing Conceptual Framework for Reducing Earning Management Using Ownership Structure Mechanism: Jordanian Companies Perspective. Journal of Finance, Accounting and Management, 3(2), 58 – 78.
Amman Stock Exchange (ASE), 2013. [http://www.ase.com.jo/en/listing-securities-directives] Amudo, A and Inanga, E, 2009. Evaluation of Internal Control Systems: A Case Study from Uganda.
International Research Journal of Finance and Economics, 27, pp. 125 – 144. Anderson, A and Gupta, P, 2009. A cross-country comparison of corporate governance and firm performance:
Do financial structure and the legal system matter? Journal of Contemporary Accounting and Economics, 5 (2), pp. 61 – 79.
Anderson, R and Reeb, D, 2003. Founding-Family Ownership and Firm Performance: Evidence from the S&P 500. Journal of Finance, 58 (3), pp. 1301 - 1328.
Anglin, P, Edelstein, R, Geo, Y and Tsang, D, 2013. What is the Relationship between REIT Governance and Earnings Management. Journal of Real Estate Finance and Economics, 47 (3), pp. 538 – 563.
Applegate, D and Wills, T., 1999. Struggling to incorporate the COSO recommendations into your audit process? The Institute of Internal Auditor. Avialable at : http://www.coso.org/audit_shop.htm.
Armstrong, C, Guay, W and Weber, J, 2010. The role of information and financial reporting in corporate governance and debt contracting. Journal of Accounting and Economics, 50 (2-3), pp. 179 – 234.
Ashbaugh-Skaife, H, Collins, D, Kinney, W and LaFond, R, 2008. The effect of SOX internal control deficiencies and their remediation on accrual quality. The Accounting Review, 83 (1), pp. 217 - 250.
Atieh, A. and Hussain, S., 2012. Do UK firms manage earnings to meet dividend thresholds? Accounting and Business Research, 42 (1), pp. 77 – 94.
Apulu, I., and Latham, A., 2011. Drivers for information and communication technology adoption: A case study of Nigerian small and medium sized enterprises. International Journal of Business and Management, 6 (5), pp. 51 – 60.
Aram, J.D and Salipante, P.F, 2003. Bridging scholarship in management: Epistemological reflections. British Journal of Management, 14, pp. 189 – 205.
Archer, M, 2003. Structure, Agency and the Internal Conversation. 1 Edition, UK: Cambridge University Press Archer, M, Bhaskar, R, Collier, A, Lawson, T and Norrie, A, 1998. Critical Realism: Essential Readings. 1
Edition, London: Routledge. Arya, A., Glover, J., and Sunder, S., 2003. Are unmanaged earnings always better for shareholders? Accounting
Horizons, 17, PP. 111 - 116. Awais, G and Wang, Z, 2011. Corporate Governance Characteristics and Earnings Management: Empirical
Evidence from Chinese Listed Firms. International Journal of Accounting and Financial Reporting, 1 (1), pp. 133 – 151.
Baba, I, 2011. Corporate governance and financial reporting. International Journal of Governance, 1 (2), pp. 1 – 17.
Baber, W., Fairfield, P., and Haggard, J., 1991. The effect of concern about reported income on discretionary spending decisions: The case of research and development. The Accounting Review, 66 (4), pp. 818 - 829.

REFERENCES
285
Ball, R and Brown, P, 1968. An Empirical Evaluation of Accounting Income Numbers. Journal of Accounting Research, 6 (2), pp. 159 – 178.
Bange, M. and De Bondt, W., 1998. R&D budgets and corporate earnings targets. Journal of Corporate
Finance, 4, pp. 153 - 184. Barker, R and Imam, S, 2008. Analysts’ perceptions of earnings quality. Accounting and Business Research, 38
(4), pp. 313 – 329. Barkin, S, 2010. Realist Constructivism: Rethinking International Relations Theory. 1 Edition, UK: Cambridge
University Press. Bartov, E., Gul, F.A. and Tsui, J.S.L., 2000. Discretionary-accruals models and audit qualifications. Journal of
Accounting and Economics, 30 (3), pp. 421 – 452. Barth, M and Landsman, W, 2010. How did Financial Reporting Contribute to the Financial Crisis. European
Accounting Review, 9 (3), pp. 399 – 423. Basel Committee on Banking Supervision, 2001. Internal audit in banks and the supervisor's relationship with
auditors. Bank for International Settlements. Baxter, P and Cotter, J, 2009. Audit committees and earnings quality. Accounting and Finance, 49 (2), pp. 267 –
290. Beasley, M, 1996. An empirical analysis of the relation between the board of director composition and financial
statement fraud. The Accounting Review, 71 (4), pp. 443 – 465. Beasley, M and Salterio, S, 2001. The Relationship between Board Characteristics and Voluntary Improvements
in Audit Committee Composition and Experience. Contemporary Accounting Research, 18 (4), pp. 529 – 570.
Beatty, R, 1989. Auditor reputation and the pricing of initial public offerings. The Accounting Review, 64 (4), pp. 693 – 709.
Bédard, J, Coulombe, D and Courteau, L, 2008. Audit Committee, Underpricing of IPOs, and Accuracy of Management Earnings Forecasts. Corporate Governance: An International Review, 16 (6), pp. 519 - 535.
Bedard, J, Chtourou, S and Courteau, L, 2004. The effect of audit committee expertise, independence and activity on aggressive earnings management. Auditing: A Journal of Practice and Theory, 23 (2), pp. 13 – 35.
Bedard, J and Gendron, Y, 2010. Strengthening the financial reporting system: Can audit committees deliver? International Journal of Auditing, 14 (2), pp. 174 – 210.
Beaver, W.H and Engel, E.E, 1996. Discretionary behavior with respect to allowances for loan losses and the behavior of security prices. Journal of Accounting and Economics, 22 (1-3), pp. 177 - 206.
Beaver, W.H and McNichols, M.F, 1998. The characteristics and valuation of loss reserves of property casualty insurers. Review of Accounting Studies, 3 (1-2), pp. 73 - 95.
Barro, Robert J., 1991. Economic growth in a cross section of countries. Quarterly Journal of Economics, 106 (2), pp. 407 – 443.
Bedard, J.C., and Johnstone , K,M., 2004. Earnings manipulation risk, corporate governance risk, and auditors' planning and pricing decisions. The Accounting Review, 79 (2), pp. 277 – 304.
Becker, C, DeFond, M, Jiambalvo, J and Subramanyam, K, 1998. The effect of audit quality on earnings management. Contemporary Accounting Research, 15 (1), pp. 1 – 24.
Belcher, A, 1996. The Cadbury Code Compliance Report. Journal of Financial Regulation and Compliance, 4 (1), pp. 82 – 89.
Ben-Nasr, H, Boubakri, N, and Cosset, J, 2012. The political determinants of the cost of equity: Evidence from newly privatized firms. Journal of Accounting Research, 50 (3), pp. 605 – 646.
Beneish, M.D, 1997. Detecting GAAP violation: implications for assessing earnings management among firms with extreme financial performance. Journal of Accounting and Public Policy, 16 (3), pp. 271 - 309.
Bergstresser, D and Philippon, T, 2006. CEO incentives and earnings management. Journal of Financial Economics, 80 (3), pp. 511 – 529.
Bhasin, M, 2012. Audit committee mechanism to improve corporate governance: Evidence from a developing country. Modern Economy, 3 (07), pp. 856 – 872.
Bhat, G, Hope, O and Kang, T, 2006. Does corporate governance transparency affect the accuracy of analyst forecasts? Accounting and Finance, 46 (5), pp. 715 – 732.
Bhuiyan, M, Roudaki, J and Clark, M, 2013. Corporate Governance Compliance and Discretionary Accruals: New Zealand Evidence. Australasian Accounting Business and Finance Journal, 7(2), pp. 87 – 110.
Bianco, M. and Casavola, P, 1999. Italian corporate governance: Effects on financial structure and firm performance. European Economic Review, 43, (4), pp. 1057 – 1069.
Biger, N and Hoang, Q, 2008. Managerial ownership, firm size and earnings management. The International Journal of Finance, 20 (1), pp. 4629 – 4654.

REFERENCES
286
Bikki, J and Tsui, J, 2009. Insider Trading, Earnings Management and Corporate Governance: Empirical Evidence Based on Hong Kong Firms. Journal of International Financial management and Accounting, 18 (3), pp. 192 – 222.
Bisman, J, 2010. Postpositivism and accounting research: A (Personal) primer on critical realism. Australasian Accounting Business and Finance Journal, 4 (4), pp. 3 – 25.
Bissessur, S., 2008. Earnings quality and earnings management the roles of accounting accruals. 1 edition, Germany: VDM & Co. KG.
Black, B and Coffee, J, 1994. Hail Britannia?: Institutional investor behavior under limited regulation. Michigan Law Review, 92 (7), pp. 1997 – 2087.
Blackburn, S, 1996. Oxford dictionary of philosophy. First edition, Oxford: Oxford University Press. Blaikie, N, 2007. Approaches to Social Enquiry. Second edition, UK: Cambridge. Block, J, 2010. Family Management, Family Ownership, and Downsizing: Evidence from S&P 500 Firms.
Family Business Review, 23 (2), pp. 109 – 130. Bonini, S, Zanetti, L, Bianchini, R and Salvi, A, 2010. Target price accuracy in equity research. Journal of
Business Finance and Accounting, 37 (9‐10), pp.1177 – 1217. Bos, D, 1991. Privatization: A Theoretical Treatment. 1 edition, Oxford: Clarendon Press. Bradbury, M. Mak, Y and Tan, S, 2006. Board Characteristics, Audit Committee Characteristics and Abnormal
Accruals. Pacific Accounting Review, 18 (2), pp. 47 – 68. Bramhandkar, A, 2011. Discriminant Analysis: Applications in Finance. Journal of Applied Business Research,
5 (2), pp. 37 – 41. Brickley, J, Coles, J and Terry, R, 1994. Outside directors and the adoption of poison pills. Journal of Financial
Economics, 35 (3), pp. 371 – 390. Bronson, S, Carcello, J, Hollingsworth, C and Neal, T, 2009. Are Fully Independent Audit Committee
Necessary? Journal of Accounting and Public Policy, 28 (4), pp. 265 – 280. Brown, L, 1997. Analyst forecasting errors: Additional evidence. Financial Analysts Journal, 53 (6) 81 – 88. Brown, N, Pottb, C, and Wömpenerb, A, 2014. The effect of internal control regulation on earnings quality:
Evidence from German. Journal of Accounting and Public Policy, 33 (1), pp. 1 – 31. Brown, R. and Brignall, S. (2007). Reflections on the use of a dual-methodology research design to evaluate
accounting and management practice in UK university central administrative services. Management Accounting Research. 18 (1), pp. 32 – 48.
Bryman, A., 2008. Social research methods. 3th edition, Oxford: Oxford University Press. Buchalter, S and Yokomoto, K, (2003). Audit Committees' Responsibilities and Liability. The CPA Journal, 43
(1), pp. 1 – 7. Burgess, R, 2002. In the field: An introduction to field research. A copy of the original in 1984, UK: Routledge.
2002. Burgstahler, D. and Dichev, I., 1997. Earnings management to avoid earnings decreases and losses. Journal of
Accounting and Economics, 24 (1), pp. 99 - 126. Burgstahler, D., Hail, L., and Leuz, C., 2006. The Importance of Reporting Incentives: Earnings Management in
European Private and Public Firms. The Accounting Review, 81 (5), pp. 983 – 1016. Burrell, G. and Morgan, G., (1979). Sociological Paradigms and Organisational Analysis. 1 edition (reprinted,
2005), London: Ashgate Publishing Limited. Bushee BJ. The influence of institutional investors on myopic R&D investment behavior. Accounting Review,
73 (3), pp. 305 – 34. Bushman, R., Chen, Q, Engel, E and Smith, A, 2004. Financial Accounting Information, Organisational
Complexity and Corporate Governance Systems. Journal of Accounting and Economics, 37 (1), pp. 167 – 201.
Butler M, Leone, A and Willenborg, M, 2004. An Empirical Analysis of Auditor Reporting and Its Association with Abnormal Accruals. Journal of Accounting and Economics, 37 (2), pp 139 – 165.
Byrd, J, Hickman, K., 1992. Do outside directors monitor managers? Evidence from tender offer bids. Journal of Financial Economics, 32 (2), pp. 195 – 222.
Cadbury Report, 1992. Available at: http://www.ecgi.org/codes/documents/cadbury.pdf. Caixing, L and David, Y, 2008. The Effect of the CEO/CFO Certifications on Earnings Management. Journal of
Theoretical Accounting Research, 4 (1), pp. 83 – 105. Callao, S and Jarne, J, 2010. Have IFRS Affected Earnings Management in the European Union. Accounting in
Europe, 7 (2), pp. 159 – 189. Cascino, S, Pugliese, A, Mussolino, D and Sansone, C, 2010. The Influence of Family Ownership on the
Quality of Accounting Information. Family Business Review, 23 (3), pp. 246 – 265. Carleton, W, Nelson, J and Weisbach, M, 1998. The Influence of Institutions on Corporate Governance through
Private Negotiations: Evidence from TIAA‐CREF. The Journal of Finance, 53 (4), pp. 1335 – 1362.

REFERENCES
287
Caylor, M.L, 2010. Strategic revenue recognition to achieve earnings benchmarks. Journal of Accounting and Public Policy, 29 (1), pp. 82 – 95.
Cendrowski, H and Martin, J, 2003. The Impact of Internal Control Structures on Business Valuations. Available at: [http://www.cca-advisors.com/PDFs/cs_internal_controls.pdf].
Central Bank of Jordan, 2012. Available at: [http://www.cbj.gov.jo] Chapman, C, 1997. Hampel report released. Internal Auditor, 54 (5), pp. 1-3. Chambers, A., and Rand, G., 1997. The operational auditing handbook: auditing business processes. 1th
edition, England: Wiley. Chen, C, Chen, S and Su, X, 2001. Profitability Regulation, Earnings Management, and Modified Audit
Opinions: Evidences from China. Auditing: A Journal of Practice and Theory, 20 (2), pp. 9 – 30. Chen, C and Jaggi, B, 2000. Association between independent non-executive directors, family control and
financial disclosures in Hong Kong. Journal of Accounting and Public Policy, 19 (4, 5), pp. 285 – 310. Chen, D, Li, J, Liang, S and Wang, G, 2011. Macroeconomic control, political costs and earnings management:
Evidence from Chinese listed real estate companies. China Journal of Accounting Research, 4 (3), pp. 91 – 106.
Chen, S, Wang, Y and Zhao, Z, 2009. Regulatory Incentives for Earnings Management through Asset Impairment Reversals in China. Journal of Accounting, Auditing and Finance, 24 (4), pp. 589 – 620.
Chena, Z, Dub, J, Li, D and Ouyang, R, 2013. Does foreign institutional ownership increase return volatility? Evidence from China. Journal of Banking and Finance, 37 (2), pp. 660 – 669.
Cheng, S., 2004. R&D expenditures and CEO compensation. The Accounting Review, 79 (2), pp. 305 - 328. Chtourou, S, Bedard, J and Courteau, L, 2001. Corporate governance and earnings management, Working paper
(University of Laval, Quebec). Available at: [http://ssrn.com/abstract=275053]. Chung, R., Firth, M. and Kim, J., 2005. Earnings management, surplus free cash flow, and external monitoring.
Journal of Business Research, 58 (6), pp. 766 – 776. Clarke, T. 2004. Introduction: theories of governance – reconceptualising corporate governance theory after
the Enron experience, in T. Clarke (Ed.), Theories of Corporate Governance: the philosophical foundations of corporate governance, Abingdon: Routledge.
Clarke, T, 2007. International Corporate Governance: A Comparative Approach. 1 edition: UK, Routledge. Clegg, S.R and Bailey, J.R, 2007. International Encyclopedia of Organization Studies. 1 edition, UK: SAGE. Cohen, D.A., Zarowin, P., 2010. Accrual-based and real earnings management activities around seasoned equity
offerings. Journal of Accounting and Economics, 50 (1), pp. 2 - 19. Colombo, M, Croce, A and Murtinu, S, 2014. Ownership structure, horizontal agency costs and the performance
of high-tech entrepreneurial firms. Small Business Economics, 42 (2), pp. 265 - 282. Committee of the sponsoring organizations of the treadway commission (COSO), 2009. Internal Control —
Integrated Framework Guidance on Monitoring Internal Control Systems Office. Policy Analysis, pp.1-4. Committee of the sponsoring organizations of the treadway commission (COSO), 1994. Integrated Control–
Integrated Framework. New Jersey: American Institute of Certified Public Accountants, pp. 59-67. Conger, J.A., Finegold, D and Lawler, E, 1998. Appraising Boardroom Performance. Harvard Business Review,
76 (1), pp. 136 – 148. Cook, K, Huston, G.and Omer, T, 2008. Earnings Management through Effective Tax Rates: The Effects of
Tax-Planning Investment and the Sarbanes-Oxley Act of 2002. Contemporary Accounting Research, 25 (2), pp. 447 - 471.
Core, J and Guay, W, 1999.The use of equity grants to manage optimal equity incentive level. Journal of Accounting and Economics, 28 (2), pp. 151 – 184.
Cornett, M, Marcus, A and Tehranian, H, 2008. Corporate governance and pay-for performance: The impact of earnings management. Journal of Financial Economics, 87 (1), pp. 357 – 373.
Cornett, M, Marcus, A, Saunders, A and Tehranian, H, 2007. The impact of institutional ownership on corporate operating performance. Journal of Banking and Finance, 31 (6), pp. 1771 – 1794.
Corporate Governance Code for Shareholding Companies Listed on the Amman Stock Exchange, 2012. Craven, K and Wallace, W, 2001. A framework for determining the influence of the corporate board of directors
in accounting studies. Corporate Governance, 9 (1), pp. 2 – 23. Crutchley, C, Jensen, M, Jahera, J and Raymond, J, 1999. Agency problems and the simultaneity of financial
decision making: The role of institutional ownership. International review of financial analysis, 8 (2), pp. 177 – 197.
Cupchik, G, 2001. Constructivist Realism: An Ontology That Encompasses Positivist and Constructivist Approaches to the Social Sciences. Forum: Qualitative Social Research, 2 (1), pp. 1-7.
Dahya, J and McConnell, J, 2007. Board composition, corporate performance, and the Cadbury committee recommendation. Journal of Financial and Quantitative Analysis, 42 (3), pp. 535 – 564.
Das, S, Shroff, P and Zhang, H, 2009. Quarterly earnings patterns and earnings management. Contemporary Accounting Research, 26 (3), pp. 797 – 831.

REFERENCES
288
Datta, S, 2000. Corporate governance: role of audit committee. The Management Accountant, 35 (7), pp. 502 – 5 04.
Davidson, R, Goodwin-Stewar, J and Kent, P, 2005. Internal governance structures and earnings management. Accounting and Finance, 45 (2), pp. 241 - 267.
Davidson III, W, Jiraporn, P, Kim, Y and Nemec, C, 2004. Earnings management following duality-creating successions: ethonstatistics, impression management, and agency theory. Academy of Management Journal, 47, (2), pp. 267–275.
Davies, L, 2000. The Board of Directors: Composition, Structure, Duties and Powers. Organisation for Economic Co-operation and Development, 7-8 (December), PP. 1 – 29.
Davis, L, Soo, B and Trompeter, G, 2009. Auditor Tenure and the Ability to Meet or Beat Earnings Forecasts. Contemporary Accounting Research, 26 (2), pp. 517 – 548.
DeAngelo, L.E, 1986. Accounting numbers as market valuation substitutes: A study of management buyouts of public stockholders. The Accounting Review, 61 (3), pp. 400 - 420.
DeAngelo, L, 1981. Auditor size and auditor quality. Journal of Accounting and Economics, 3 (3), pp. 183 – 199.
DeAneglo, L.E., 1988. Managerial competition, information costs, and corporate governance: The use of accounting performance measures in proxy contests. Journal of Accounting and Economics, 10, pp. 3 - 36.
DeBoskey, D and Jiang, W, 2012. Earnings management and auditor specialization in the post-sox era: An examination of the banking industry. Journal of Banking and Finance, 36 (2), pp. 613 – 623.
Dichev, I, Graham, J, Harvey, C and Rajgopal, S, 2013. Earnings quality: Evidence from the field. Journal of Accounting and Economics, 56 (2-3), pp. 1 – 33.
Dechow, P and Dichev, I, 2002. The quality of accruals and earnings: The role of accrual estimation errors. The Accounting Review, 77 (Supplement), PP. 35 – 59.
Dechow, P, Hutton, A, Kim, J and Sloan, R, 2012. Detecting earnings management: A new approach. Journal of Accounting Research, 50 (2), pp. 275 – 334.
Dechow, P. and Schrand, C, 2004. Earnings Quality. Research Foundation Publications: The Research Foundation of CFA Institute, 2004 (3), pp. 1 - 151.
Dechow, P.M and Sloan, R.G, 1991. Executive incentives and the horizon problem: An empirical investigation. Journal of Accounting and Economics, 14 (1), pp. 51 - 89.
Dechow, P, Ge, W and Schrand, C, 2010. Understanding earnings quality: A review of the proxies, their determinants and their consequences. Journal of Accounting and Economics, 50 (2 - 3), pp. 344 – 401.
Dechow, P, Sloan, R and Sweeney, A, 1996. Causes and Consequences of Earnings Manipulation: An Analysis of Firms Subject to Enforcement Actions by the SEC. Contemporary Accounting Research, 13 (1), pp. 1 – 36.
Dechow, P, Sloan, R and Sweeney, A, 1995. Detecting earnings management. The Accounting Review, 70 (2), pp. 193 - 225.
Dedman, E, 2002. The Cadbury Committee Recommendations on Corporate Governance–A review of compliance and performance impacts. International Journal of Management Reviews, 4 (4), pp. 335 – 352.
Degeorge, F. and Patel, J., Zeckhauser, R., 1999. Earnings management to exceed thresholds. Journal of Business, 72 (1), pp, 1 - 33.
Demsetz, H and Lehn, K, 1985. The structure of corporate ownership: causes and consequences. Journal of Political Economy, 93, 1155 – 1177.
Demsetz, H and Villalonga, B, 2001. Ownership structure and corporate performance. Journal of Corporate Finance, 7 (3), pp. 209 – 233.
Demski, J and Feltham, G, 1978. Economic Incentives in Budgetary Control Systems. The Accounting Review, 53 (2), pp. 336 – 359.
Denisa, D and McConnella, J, 2003. International Corporate Governance. Journal of Financial and Quantitative Analysis, 38 (1), pp. 1 - 36.
Desender, K, Castro, C and Escamilla De Leon, S, 2011. Earnings management and cultural values. American Journal of Economics and Sociology, 70 (3), pp. 640 – 670.
Dewey, J, 2009. Between Pragmatism and Constructivism. Eds Larry A. Hickman, Stefan Neubert, and Kersten Reich, Fordham University Press.
DeZoort, F, 1997. An investigation of audit committees' oversight responsibilities. A Journal of Accounting, Finance and Business Studies, 33 (2), pp. 208 – 227.
DeZoort, F, and Salterio, S, 2001. The effects of corporate governance experience and financial-reporting and audit knowledge on audit committee members' judgements. Auditing: A Journal of Practice and Theory, 20 (2), pp. 31 – 47.

REFERENCES
289
Dhaliwal, D, Naiker, V and Navissi, F, 2010. The Association between Accrual Quality and the Characteristics of Accounting Experts and Mix of Expertise on Audit Committees. Contemporary Accounting Research, 27 (3), pp. 787 – 827.
Dianita, P.S & Rahmawati, 2011. Analysis of the effect of corporate social responsibility on financial performance with earnings management as a moderating variable. Journal of Modern Accounting and Auditing, 7 (10), pp. 1034 – 1045.
Dichev, I, Graham, J, Harvey, C and Rajgopal, S, 2013. Earnings quality: Evidence from the field. Journal of Accounting and Economics, 56 (1), pp. 1- 33.
Ding, Y, Zhang, H and Zhang, J, 2007. Private vs State Ownership and Earnings Management: evidence from Chinese listed companies. Corporate Governance: An International Review, 15 (2), pp. 223 – 238.
Djankov, S, 1999. Ownership Structure and Enterprise Restructuring in Six Newly Independent States. Comparative Economic Studies, 41 (1), PP. 75 – 95.
Doidge, C, Karolyi, G and Stulz, R, 2007. Why do countries matter so much for corporate governance? Journal of Financial Economics, 86 (1), pp. 1 – 39.
Doms, M, Lewis, E and Robb, A, 2010. Local labor force education, new business characteristics, and firm performance. Journal of Urban Economics, 67 (1), pp. 61 – 77.
Donaldson, L, 1990. The Ethereal Hand: Organisational Economics and Management Theory. Academy of Management, 15 (3), pp. 369 – 381.
Doupnik, T, 2008. Influence of Culture on Earnings Management: A Note. A Journal of Accounting, finance and business studies, 44 (3), pp. 317 – 340.
Doyle,J., Ge,W and McVa, S, 2007. Accruals Quality and Internal Control over Financial Reporting. The Accounting Review, 82 (5), pp. 1141 – 1170.
Dyreng, S, Hanlon, M and Maydew, E, 2012. Where do firms manage earnings? Review of Accounting Studies, 17 (3), pp. 649 – 687
Easterby-Smith, M, Thorpe, R and Lowe, A, 2002. Management Research: An Introduction. Second edition, London: Sage.
Easton, P. and Harris, T., 1991. Earnings as an explanatory variable for returns. Journal of Accounting Research, 29 (1), pp. 19 - 36.
Ebaid, I, 2011. Corporate governance practices and auditor's client acceptance decision: empirical evidence from Egypt. Corporate Governance: The international journal of business in society, 11(2), pp. 171 – 183.
Eisenhardt, K, 1989. Agency theory: An assessment and review. The Academy of Management Review, 14 (1), pp. 57 - 74.
Elder, R., Zhang, Y., Zhou, J., and Zhou, M., 2009. Internal control weaknesses and client risk management. Journal of Accounting, Auditing and Finance, 24 (4), pp. 543 - 579.
El-Rajabi, M and Gunasekaran, A, 2006. The accuracy of earnings forecasts disclosed in the prospectuses of newly formed public companies in Jordan. Managerial Auditing Journal, 21 (2), pp.117 – 131.
Eng, L and Margaret, S, 2001. The Implications of Long-Term Performance Plans and Institutional Ownership for Firms' Research and Development (R&D) Investments. Journal of Accounting, Auditing and Finance, 16 (2), pp. 117 – 139.
Erhardt, N, Werbel, J and Shrader, C, 2003. Board of Director Diversity and Firm Financial Performance. Corporate Governance: An International Review, 11 (2), pp. 102 – 111.
Ernst and Young, 2011. Doing Business in Jordan. Available at: [http://emergingmarkets.ey.com/wp-content/uploads/downloads/2012/05/Doing-Business-in-Jordan-2011.pdf].
Ettredge, M, Li, C, and Scholz, S, 2007. Audit fees and auditor dismissals in the Sarbanes-Oxley era. Accounting Horizons, 21 (4), pp. 371 – 386.
Ewert, R and Wagenhofer, A, 2013. Accounting Standards, Earnings Management, and Earnings Quality. Available at: http://ssrn.com/abstract=2068134.
Ewert, R. and Wagenhofer, A., 2005. Economic Effects of tightening accounting standards to restrict earnings management. The Accounting Review, 80 (4), pp. 1101 - 1124.
Fama, E., and Jensen, M, 1983. Agency problems and residual claims. Journal of Law and Economics, 26 (1), pp. 327 – 349.
Fama, E, 1980. Agency Problems and Theory of the Firm. Journal of Political Economy, 88 (2), pp. 88 – 107. Fan, J and Wong, T, 2005. Do external auditors perform a corporate governance role in emerging markets?
Evidence from East Asia. Journal of accounting research, 43 (1), pp. 35 – 72. Fan, J and Wong, T, 2002. Corporate ownership structure and the informativeness of accounting earnings in
East Asia. Journal of Accounting and Economics, 33 (3), pp. 401 – 425. Fazlzadeh, A, Hendi, A and Mahboubi, K, 2011. The examination of the effect of ownership structure on firm
performance in listed firms of Tehran stock exchange based on the type of industry. International Journal of Business and Management, 6 (3), pp. 249 – 266.

REFERENCES
290
Fenga, M, Ge, W, Luoc, S and Shevlin, T, 2011. Why do CFOs become involved in material accounting manipulations? Journal of Accounting and Economics, 51 (1, 2), pp. 21 – 36.
Fiador, V, 2013. Corporate governance and value relevance of financial information: evidence from the Ghana Stock Exchange. Corporate Governance, 13 (2), pp. 208 – 217.
Fiechter, P and Meyer, C, 2011. Discretionary Measurement of Financial Assets during the 2008 Financial Crisis. Available at [http://ssrn.com/abstract=1522122].
Field, A, 2013. Discovering Statistics Using IBM SPSS Statistics. 4, London: Sage. Financial Reporting Council, 2006, The UK approach to corporate governance. UK. Financial Reporting Council, 2010, The UK approach to corporate governance. UK. Financial Reporting Council, 2014. The UK Corporate Governance Code. UK. Flahive, A, Tanlar, D, Rahayu, W and Apduhan, B, 2011. Ontology expansion: appending with extracted sub-
ontology. Logic Journal of the IGPL, 19 (5), pp. 618 – 647. Francis, J and Krishnan, J, 1999. Accounting Accruals and Auditor Reporting Conservatism. Contemporary
Accounting Research, 16 (1), pp.135-165 Francis, J, LaFond, R, Olsson, M and Schipper, K, 2004. Costs of equity and earnings attributes. The
Accounting Review, 79 (4), pp. 967 – 1010. Frege, G. 1982. On sense and reference in translation from the philosophical writing of Gottlob Frege. Edit by
Peter Greach and Nax Black (1970), Oxford: Blackwell. Friedman, J, Hastie, T and Tibshirani, R, 2001. The elements of statistical learning. Edition 1, Springer, Berlin:
Springer series in statistics. Fung, S and Tsai, S, 2012. Institutional Ownership and Corporate Investment Performance. Canadian Journal
of Administrative Sciences, 29 (4), pp. 348 – 365. Furr, A and Alserhan, M, 2008. Tribal Customary Law in Jordan. South Carolina Journal of International Law
and Business, 4 (2), pp. 17 – 34. Gaver, J and Paterson, J, 2001. The Association between External Monitoring and Earnings Management in the
Property-Casualty Insurance Industry. Journal of Accounting Research, 39 (2), pp. 269 - 282. Ghazali, N, 2010. Ownership structure, corporate governance and corporate performance in
Malaysia. International Journal of Commerce and Management, 20 (2), pp. 109 – 119. Ghosh, A, Marra, A and Moon, D, 2010. Corporate Boards, Audit Committees, and Earnings Management: Pre-
and Post-SOX Evidence. Journal of Business Finance and Accounting, 37 (9, 10), pp. 1145 – 1176. Gkliatis, l, 2014. An Examination of Board Director’s Roles and the Impact of the External Environment and
Board Characteristics. (PhD thesis). (Brunel Business School), Brunel University. Goeij, P, Smedts, K, Campenhout, G and Verhestraeten, J, 2013. Analysts’ forecast accuracy and the reporting
quality of earnings. Available at: http://www.fma.org/Luxembourg/Papers/Analysts_Forecast_Accuracy.pdf.
Gomes, D, 2008. The interplay of conceptions of accounting and schools of thought in accounting history. Accounting History, 13 (4), pp. 479 – 509.
Gopalan, R and Jayaraman, S, 2012. Private Control Benefits and Earnings Management: Evidence from Insider Controlled Firms. Journal of Accounting Research, 50 (1), pp. 117 – 157.
Graham, R, Harvey, M, and Rajgopal, S, 2005. The economic implications of corporate financial reporting. Journal of Accounting and Economics, 40 (1-3), pp. 3 – 73.
Greco, G, 2011. Determinants of board and audit committee meeting frequency: Evidence from Italian companies. Managerial Auditing Journal, 26 (3), pp. 208 – 229.
Guan, L and Pourjalali, H, 2010. Effect of Cultural Environmental and Accounting Regulation on Earnings Management: A Multiple Year-Country Analysis. Asia-Pacific Journal of Accounting and Economics, 17 (2), pp. 99 – 127.
Guan L, Pourjalali, H, Sengupta, P and Teruya, J, 2005. Effect of cultural environment on earnings manipulation: A five Asia-Pacific country analysis. Multinational Business Review, 13 (2), pp. 23 – 41.
Guenther, D, 1994. Earnings management in response to corporate tax rate changes: Evidence from the 1986 Tax Reform Act. Accounting Review, 69 (1), pp. 230 - 243.
Gul, F, Jaggi, B and Krishnan, G, 2007. Auditor Independence: Evidence on the Joint Effects of Auditor Tenure and Nonaudit Fees. Auditing: A Journal of Practice and Theory, 26 (2). pp. 117 – 142.
Gurunlu, M and Gursoy, G, 2010. The influence of foreign ownership on capital structure of non-financial firms: evidence from Istanbul Stock Exchange. The IUP Journal of Corporate Governance, 9 (4), pp. 21 – 29.
Gulzar, A and Zongiun, W, 2011. Corporate Governance Characteristics and Earnings Management: Empirical Evidence from Chinese Listed Firms. International Journal of Accounting and Financial Reporting, 1 (1), pp. 133 – 151.
Guo, S., Liu, M., and Song, W., 2008. Stock splits as a manipulation tool: Evidence from mergers and acquisitions. Financial Management, 37 (4), pp. 695 - 712.

REFERENCES
291
Gupta, P.P, 2008. Management’s Evaluation of internal controls under Section 404 (a) using the COSO 1992 control framework: evidence from practice. International Journal of Disclosure and Governance, 5 (1), p.p. 48 – 68.
Habbash, M, 2010. The Effectiveness of Corporate Governance and External Audit on Constraining Earnings Management Practice in the UK. (PhD thesis). (Accounting and Finance Department), Durham University.
Habbash, M, Lijuan, X, Salama, A and Dixon, R, 2014. Are Independent Directors and Supervisory Directors Effective in Constraining Earnings Management? Journal of Finance, Accounting and Management, 5 (1), pp.125 – 160.
Habib, A. (2004). Impact of earnings management on value-relevance of accounting information: Empirical evidence from Japan. Managerial Finance, 30 (11), pp. 1 – 15.
Habib, A, Bhuiyan, M and Islam, A, 2013. Financial distress, earnings management and market pricing of accruals during the global financial crisis. Managerial Finance, 39 (2), pp. 155 – 180.
Hackenbrack, K and Hogan, C, 2002. Market response to earnings surprises conditional on reasons for an auditor change. Contemporary Accounting Research, 19 (2), pp. 195 – 223.
Hagerman, R. L. and Zmijewski, M. E, 1979. Some economic determinants of accounting policy choice. Journal of Accounting and Economics, 1 (2), pp.141 - 162
Hair, J, Black, W, Babin, B and Anderson, R, 2010. Multivariate Data Analysis. 7th Edition, London: Prentice Hall.
Halioui, k and Jerbi, A, 2012. The effect of Blockholders on Earnings Management: The Case Study Tunisian Listed Firms. International Journal of Multidisciplinary Research, 2 (2), pp. 37 – 49.
Hamdan, A, Sarea, A and Reyad, S, 2013. The Impact of Audit Committee Characteristics on the Performance: Evidence from Jordan. International Management Review Vol. 9 No. 1, pp. 32 – 42.
Hausman, J, 1978. Specification Tests in Econometrics. Econometrica Journal, 46 (6), pp. 1251 – 1271. Hayale, T.H., and Abu Khadra , H.A., 2006. Evaluation of the effectiveness of control systems in computerized
accounting information systems: an empirical research applied on Jordanian banking sector. Journal of Accounting, Business and Management, 13, pp. 39 – 68.
Hayes, R, Dassen, R, Schilder, A and Wallage, P, 2005. Principle of auditing: An introduction to international standards on auditing. 2th edition, England: Pearson Education Limited
Healy, P.M, 1983. The impact of bonus schemes on accounting choices. (PhD thesis), (Sloan School of Management), University of Rochester.
Healy, P.M, 1985. The effect of bonus schemes on accounting decisions. Journal of Accounting and Economics, 7, pp. 85 - 107.
Healy, P and Palepu, K, 2003. How the quest for efficiency corroded the market. Harvard Business Review, 81 (7), PP. 76 – 85.
Healy, P and Wahlen J, 1999. A review of the earnings management literature and its implications for standard setting. Accounting Horizons, 13 (4), pp. 365 - 383.
Heath, J, 2009. The uses and abuses of agency theory. Business Ethics Quarterly, 19 (4), pp. 497 – 528. Heard, J and Shepherd, H, 1987. Conflicts of interest in proxy voting system. Investor Responsibility Research
Center, Washington DC. Hempel, C.G, [1954]1965. A logical appraisal of operationism in Aspect of scientific explanation. 1 edition,
New York: Free Press. Herbohn, K and Ragunathan, V, 2008. Auditor reporting and earnings management: some additional evidence.
Accounting and Finance, 48 (4), pp. 575 - 601. Hirst, D, 1994. Auditor Sensitivity to Earnings Management. Contemporary Accounting Research, 11 (1), pp.
405 – 422. Hofstede G, 1983. National Cultures in Four Dimensions: A Research-Theory of Cultural Differences among
Nations. International Studies of Management and Organization, 13(1/2), pp. 46 – 74. Holderness, C, 2003. A survey of blockholders and corporate control. Economic policy review, 9 (1), pp. 51 –
63. Holthausen, R.W, 1981. Evidence on the effect of bond covenants and management compensation contracts on
the choice of accounting techniques: The case of the depreciation switch-back. Journal of Accounting and Economics, 3 (1), pp. 73 - 109.
Hopt, K, 2011. Comparative corporate governance: The state of the art and international regulation. The American journal of comparative law, 1, pp. 1 – 73.
Hosseini, S.H and Abdoli, M, 2012. Effect of family control and board structure on earnings management. International Research Journal of Finance and Economics, 82, pp. 25 - 32.
Hu, Y and Izumida, S, 2009. The relationship between ownership and performance: a review of theory and evidence. International Business Research, 1 (4), pp. 72 – 81.

REFERENCES
292
Huang, H, Chan, M, Chang, C and Wong, J, 2012. Is Corporate Governance Related to the Conservatism in Management Earnings Forecasts? Emerging Markets Finance and Trade, 48 (1), pp. 105 - 121.
Hughes, J, 1996. The Greenbury Report on directors' remuneration. International Journal of Manpower, 17 (1), pp. 4 – 9.
Huberty, C, 1984. Issues in the use and interpretation of discriminant analysis. Psychological Bulletin, 95 (1), pp. 156 – 171.
Huizinga, H and Laeven, L, 2012. Bank valuation and accounting discretion during a financial crisis. Journal of Financial Economics, 106 (3), pp. 614 - 634.
Hughes, J. and sharrock, W, 1997. The Philosophy of Social Research. Third edition. London: Longman. Hussain, S, 1997. The Impact of Segment Definition on the Accuracy of Analysts’ Earnings Forecasts.
Accounting and Business Research, 27 (2), pp. 145 - 156. Huselid, M. A., 1995. The impact of human resource management practices on turnover, productivity and
corporate financial performance. Academy of Management Journal, 38 (3), pp. 635 - 672 Hussey, J. and Hussey, R, 1997. Business Research. First edition, London: MacMillan Press Ltd. IASB Meeting London, 2007. Consequential Amendments to the Framework: Reliability of Measurement.
Agenda Paper 10. Ibrahim, S.S, 2005. An Alternative Measure to Detect Intentional Earnings Management through Discretionary
Accruals. (PhD thesis), (Department of Accounting and Information Assurance), University of Maryland. Igan, D and Pinheiro, M, 2012. Incentive to manipulate earnings and its connection to analysts' forecasts,
trading, and corporate governance. Journal of Economics and Finance. 36 (4), pp. 781 - 821. Isenmila, P and Elijah, A, 2012. Earnings Management and Ownership Structure: Evidence from Nigeria.
Research Journal of Finance and Accounting, 3 (7), pp. 24 – 36. Islam, A., Ali, R. and Ahmad, Z., 2011. Is modified Jones model effective in detecting earnings management?
Evidence from a developing economy. International Journal of Economics and Finance, 3 (2), pp. 116 – 125.
Jackson, B and Liu, K, 2010. The allowance for uncollectible accounts, conservatism, and earnings management. Journal of Accounting Research, 48 (3), pp. 565 – 601.
Jackson, N. and Carter, P, 1991. In defence of paradigm incommcnsurability. Organization Studies, 12 (1), pp. 109 - 127.
Jacob, J, Rock, S and Weber, D, 2008. Do Non-Investment Bank Analysts Make Better Earnings Forecasts? Journal of Accounting, Auditing and Finance, 23 (1), pp. 23 - 61.
Jaggi, B and Leung, S, 2007. Impact of family dominance on monitoring of earnings management by audit committees: Evidence from Hong Kong. Journal of International Accounting, Auditing and Taxation. 16 (1), pp. 27 – 50.
Jaggi, B, Leung, S and Gul, F, 2009. Family control, board independence and earnings management: Evidence based on Hong Kong firms. Journal of Account and Public Policy, 28 (4), pp. 281 – 300.
Jara, M and López, F, 2011. Earnings Management and Contests for Control: An Analysis of European Family Firms. Journal of CENTRUM Cathedra, 4 (1), pp. 100 – 120.
Jeanjean, T. and Stolowy, H., 2011. Do accounting standards matter? An exploratory analysis of earnings management before and after IFRS adoption. Journal of Accounting and Public Policy, pp. 480 - 494.
Jennings, M, 2002. Where was the audit committee? Internal Auditing, 17 (3), pp. 42 – 45. Jenny, S and Lois, M, 2007. The Impact of Audit Committee Existence and Audit Committee Meeting
Frequency on the External Audit: Perceptions of Australian Auditors. International Journal of Auditing, 11 (1), pp. 51 - 69.
Jensen, M, 1998. Foundations of Organizational Strategy. 1 edition: USA, Harvard University Press, 1998. Jensen, M, 1994. Self-interest, altruism, incentives, and agency. Journal of Applied Corporate Finance, 7 (2),
pp. 40 – 45. Jensen, M, 1993. The modern industrial revolution, exit, and the failure of internal control systems. Journal of
Finance, 48 (3), pp. 831 – 880. Jensen, M and Meckling, W, 1976. Theory of the Firm: Managerial Behavior, Agency Costs and Ownership
Structure. Journal of Financial Economics, 3 (4), pp. 305 – 360. Jiang, J, Petroni, K and Wang, I, 2010. CFOs and CEOs: Who have the most influence on earnings
management? Journal of Financial Economics, 96 (3), pp. 513 – 526. Jiraporn, P., Miller, G.A., Yoon, S.S., and Kim, Y.S., 2008. Is earnings management opportunistic or beneficial?
An agency theory perspective. International Review of Financial Analysis, 17, PP. 622 - 634. Joseph, H, Rolph, A, Ronald, T and William, B, 1995. Multivariate Data Analysis with Readings. Fourth
Edition, USA: Prentice Hall International Editions. Johnson, R, Onwuegbuzie, A and Turner, L, 2007. Toward a Definition of Mixed Methods Research. Journal of
Mixed Methods Research, 1 (1), pp.112 - 133.

REFERENCES
293
Jonas, G and Jeannot Blanchet, J, 2000. Assessing Quality of Financial Reporting. Accounting Horizons, 14 (3), pp. 353 - 363.
Jones, I and Pollitt, M, 2004. Understanding how issues in corporate governance develop: Cadbury report to Higgs review. Corporate Governance: An International Review, 12 (2), pp. 162 – 171.
Jones, J, 1991. Earnings management during import relief investigations. Journal of Accounting Research, 29 (2), pp. 1993 - 228.
Jordan Companies Control Department, 2008. Jordanian Corporate Governance, Code Private Shareholding Companies, Limited Liability Companies, Non -Listed Public Shareholding Companies. Available at: [http://ccd.gov.jo/english/index.php].
Jordan securities commission (JSC), 2012. Amman, Jordan. Jouber, H and Fakhfakh, H, 2012. Earnings management and board oversight: an international comparison.
Managerial Auditing Journal, 27 (1), pp. 66 – 86. Kan, S., and Sivaramarkrishnan, K., 1995. Issues in testing earnings management and an instrumental variable
approach. Journal of Accounting Research, 33 (2), PP. 353 – 367. Kanagaretnama, K, Lim, C and Lobo, G, 2010. Auditor reputation and earnings management: International
evidence from the banking industry. Journal of Banking and Finance, 34 (10), pp. 2318 – 2327. Karagiorgos, T, Drogalas, G, Gotzamanis, Ε and Tampakoudis, I, 2010. Internal auditing as an effective tool for
corporate governance. Journal of Business Management, 2 (1), pp. 16 - 23. Karampinis, N and Hevas, D, 2013. Effects of IFRS Adoption on Tax-induced Incentives for
Financial Earnings Management: Evidence from Greece. International Journal of Accounting, 48 (2), pp. 218 – 247.
Kaufman, R, 2013. Heteroscedasticity in Regression: Detection and Correction. 1 edition, USA: SAGE. Key, K., 1997 .Political cost incentives for earnings management in the cable television industry. Journal of
Accounting and Economics, 23, pp. 309 – 337. Kim, E., 2006 .The impact of family ownership and capital structures on productivity performance of Korean
manufacturing firms: Corporate governance and the “chaebol problem”. Journal of Japanese International Economics, 20 (1), pp. 209 - 233.
Klai, N and Omri, A, 2011. Corporate Governance and Financial Reporting Quality: The Case of Tunisian Firms. International Business Research, 4 (1), pp. 158 – 166.
Klein, A, 2002. Audit committee, board of director characteristics, and earnings management. Journal of Accounting and Economics, 33 (1), pp. 375 – 400.
Klein, A, 1998. Firm Performance and Board Committee Structure. Journal of Law and Economics, 41 (1), pp. 275 – 303.
Koh, P, 2007. Institutional investor type, earnings management and benchmark beaters. Journal of Accounting and Public Policy, 26 (3), pp. 267 – 299.
Koh, P, (2003). On the association between institutional ownership and aggressive corporate earnings management in Australia. The British Accounting Review, 35(2), pp. 105 – 128.
Kothari, S, Lcone, A and Wasley, C, 2005. Performance-Matched Discretionary Accruals. Journal of Accounting and Economics, 39 (1), pp. 163 – 197.
Kousenidis, D, Ladas, A and Negakis, C, 2013. The effects of the European debt crisis on earnings quality. International Review of Financial Analysis, 30 (1), pp. 351 – 362.
Kripke, S.A, 1972. Naming and necessity in semantic of nature language. 1 edition, Netherlands (Dordrecht): Reidel.
Kanagaretnam, K, Lim, C and Lobo, G, 2010. Auditor reputation and earnings management: International evidence from the banking industry. Journal of Banking and Finance, 34 (10), pp. 2318 – 2327.
Krishnamurthy, S, Zhou, J and Zhou, N, 2006. Auditor Reputation, Auditor Independence, and the Stock-Market Impact of Andersen’s Indictment on Its Client Firms. Contemporary Accounting Research, 23 (2), pp. 465 – 490.
Krishnan, G, 2003. Does Big 6 auditor industry expertise constrain earnings management. Accounting Horizons, 17 (1), pp. 1–16.
Kuhn, T. 1962. The Structure of Scientific Revolutions. First edition, USA: The University of Chicago Press. Kuhn, T. 1970. The Structure of Scientific Revolutions. Second edition, USA: The University of Chicago Press. Lang, M, Lins, K and Miller, D, 2004. Concentrated control, analyst following, and valuation: do analysts
matter most when investors are protected least? Journal of Accounting Research, 42 (3), pp. 589 – 624 Latour, B, 2005. Reassembling the Social. 1 Edition, Oxford University Press. Laux, C and Laux, V, 2009. Board committees, CEO compensation, and earnings management. The Accounting
Review, 84 (3), pp. 869 – 891. Laux, C and Leuz, C, 2010. Did Fair-Value Accounting Contribute to the Financial Crisis. Journal of Economic
Perspectives, 24 (1), pp. 93 – 118.

REFERENCES
294
Lazarides, T and Drimpetas, E, 2011. Evaluating corporate governance and identifying its formulating factors: the case of Greece. Corporate Governance: The International Journal of Business in Society, 11 (2), pp. 136 – 148.
La Porta, R., Lopez-de-Silanes, F., & Shleifer, A. (1999). Corporate Ownership around the World. The Journal of Finance, 54 (2), pp. 471 – 517.
Lee, H, Mande, V and Ortman, R, 2004. The Effect of Audit Committee and Board of Director Independence on Auditor Resignation. Auditing: A Journal of Practice and Theory, 23 (2), pp. 131 – 146.
Lee, K.W., Lev, B., Gillian, Y., 2007. Organizational Structure and Earnings Management. Journal of Accounting, Auditing and Finance, 22 (2), pp. 293 – 331.
Lee, T.A, 2006. Financial reporting and corporate governance. West Sussex: John Wiley and son Ltd. Lel, U, 2013. Can Institutional Investors Restrain Earnings Management Activities in Weak Investor Protection
Countries? The Role of Foreign and Domestic Institutional Investors. Virginia Polytechnic Institute and State University. Working Paper.
Leventis, S and Dimitropoulos, P, 2012. The role of corporate governance in earnings management: experience from US banks. Journal of Applied Accounting Research, 13 (2), pp. 161 – 177.
Liberty, S and Zimmerman, J, 1986. Labor union contract negotiations and accounting choice. The Accounting Review, 61 (4), pp. 692 - 712.
Lillis, A and Mundy, J, 2005. Cross-sectional field studies in management accounting research-closing the gaps between surveys and case studies. Journal of Management Accounting Research, 17 (1), pp. 119 – 141.
Lin, J.W and Hwang, M, 2010. Audit quality, corporate governance, and earnings management: A Meta-Analysis. International Journal of Auditing, 14, pp. 57 - 77.
Lin, J, Li, J and Yang, J, 2006. The effect of audit committee performance on earnings quality. Managerial Auditing Journal, 21 (9), pp. 921 – 933.
Lippitt, J and Mastracchio, N, 1995. Developing Capitalization Rates for Valuing a Business. The CPA Journal, 65 (11), pp. 24 - 28.
Lipton, M and Lorsch, J, 1992. A Modest Proposal for Improved Corporate Governance. Business Lawyer, 1 (1), pp. 59 – 77.
Liu, C, Yao, L, Hu, N and Liu, L, 2011. The Impact of IFRS on Accounting Quality in a Regulated Market: An Empirical Study of China. Journal of Accounting, Auditing and Finance, 26 (4), pp. 659 – 676.
Llukani, T, 2013. Earnings management and firm size: empirical analyze in Albanian market. European Scientific Journal, 9 (16), pp. 135 – 143.
Lo, A, Wong, R and Firth, M, 2010. Can corporate governance deter management from manipulating earnings? Evidence from related-party sales transactions in China. Journal of Corporate Finance, 16 (2), pp. 225 – 235.
Loewe, M, et al, 2007. The impact of favouritism on the business climate: A study on wasta in Jordan. German Development Institute. Available at: [http://www.die-gdi.de].
Lopez, B.M and Jara, I.F, 2007. Earnings management and internal control mechanisms: Evidence from Chilean firms. New Developing Accounting and Finance (Chapter Seven), pp. 159 – 178.
Louis, H., 2004. Earnings management and the market performance of acquiring firms. Journal of Financial Economics, 74 (1), pp. 121 - 148.
Lu, H., Richardson, G.D., and Salterio, S., 2011. Direct and indirect effects of internal control weaknesses on accrual quality: evidence from a unique Canadian regulatory setting. Contemporary Accounting Research, 28 (2), pp. 675 - 707.
Lu, J, Plataniotis, K and Venetsanopoulos, A, 2003. Regularized discriminant analysis for the small sample size problem in face recognition. Pattern Recognition Letters, 24 (16), pp. 3079 – 3087.
Madi, H, Ishak, Z and Manaf, N, 2014. The impact of audit committee characteristics on corporate voluntary disclosure. Procedia-Social and Behavioral Sciences, 164 (18-19), pp. 486 – 492.
Maines, L and Wahlen, J, 2006. The Nature of Accounting Information Reliability: Inferences from Archival and Experimental Research. Accounting Horizons, 20 (4), pp. 399 - 425.
Maitah, M, 2013. How Culture Affects your Business. Available at: [http://www.maitah.com/wp-content/How%20culture%20affects%20your%20business.pdf].
Makar, S, and Alam, P., 1998. Earnings management and antitrust investigations: Political costs over business cycles. Journal of Business Finance and Accounting, 25 (5-6), pp. 701–720.
Mallin, C, 2006. Corporate governance developments in the UK. Handbook on International Corporate Governance: Country Analyses. UK: Edward Elgar.
Man, C and Wong, B, 2013. Corporate governance and earnings management: A survey of literature. Journal of Applied Business Research, 29 (2), pp. 391 – 418. Malterud, K, 2001. Qualitative research: standards, challenges, and guidelines. The LANCET, 358 (9280), pp.
483 – 488.

REFERENCES
295
Mariani, L, Tettamanzi, P and Corno, F, 2010. External Auditing vs Statutory Committee Auditing: The Italian Evidence. International Journal of Auditing, 14 (1), pp. 25 – 40.
Marquardt, C., and Wiedman, C, 2004. How are earnings managed? An examination of specific accruals. Contemporary Accounting Research, 21 (2), PP. 461 – 491.
Marra, A., Mazzola, P., and Prencipe, A., 2011. Board monitoring and earnings management pre-IFRS and post-IFRS. International Journal of Accounting, 46 (2), pp. 205 - 230.
Martinez-Calimano, E, 2006. Culture as possible factor affecting the productivity of Hispanic employees working under the supervision of non-Hispanic American manager. International Metro Business Journal, 2 (1) pp. 12 – 38.
Mashoka, T, .2010. Earnings Management and Loss Reversal. (PhD Thesis). (Department of Economics and Finance), Brunel University.
Mather, P and Ramsay, A, 2006. The Effects of Board Characteristics on Earnings Management around Australian CEO Changes. Accounting Research Journal, 19 (2), pp.78 – 93.
Metge, J, 1978. Talking past each other: Problems of cross-cultural communication. 1 Edition, USA: Victoria University Press.
McMullen, D.A, Roghunandan, K. and Rama, D. V, 1996. Internal control reports and financial reporting problems. Accounting Horizons, 10 (4), pp. 67 – 75.
McNichols, M.F and Stubben, S.R., 2008. Does earnings management affect firms’ investment decisions? The Accounting Review, 83 (6), pp. 1571 – 1603.
McNichlos, M. F, 2000. Research design issues in earnings management studies. Journal of Accounting and Public Policy, 19, pp. 313 – 345.
McNichols, M. and Wilson, G.P., 1988. Evidence of earnings management from the provision for bad debts. Journal of Accounting Research, 26 (Supplement), pp. 1 - 31.
Ministry of Education, 2010. Available at: [http://www.moe.gov.jo/en]. Ministry of Industry and Trade, 2013. Available at: [http://www.mit.gov.jo]. Ministry of Tourism, 2011. Available at: [http://www.tourism.jo/en]. Moyer, S.E., 1990. Capital adequacy ratio regulations and accounting choices in commercial banks. Journal of
Accounting and Economics, 13 (2), pp. 123 - 154. Mulili, B and Wong, P, 2011. Corporate governance practices in developing countries: The case for
Kenya. International journal of business administration, 2 (1), pp. 14 – 27. Munro, L and Stewart, J, 2011. External auditors' reliance on internal auditing: further evidence. Managerial
Auditing Journal, 26 (6), pp. 464 – 481. Murdoch, B and Krause, P, 2010. Comparing LIFO and FIFO: An Empirical Test of Representational
Faithfulness. Feature Edition, 2010 (1), pp. 40 - 48. Myers, J, Myers, L and Omer, T, 2003. Exploring the term of the auditor–client relationship and the quality of
earnings: a case for mandatory auditor rotation? Accounting Review, 78 (3), pp. 779 – 799. Myers, J., Myers, L. and Skinner, D., 2007. Earnings momentum and earnings management. Journal of
Accounting, Auditing and Finance, 22 (2), pp. 249 - 284. Nabar, S and Boonlert-U-Thai, K, 2007. Earnings management, investor protection, and national culture.
Journal of International Accounting Research, 6 (2), pp. 35 - 54. Nicholson, G and Kiel, G, 2004. Breakthrough board performance: how to harness your board's intellectual
capital. Corporate Governance: The international journal of business in society, 4 (1), pp. 5 – 23. Nimer, K, Warrad, L and Khuraisat, O, 2012. The Effect of Audit Committee’s Effectiveness on Dividend
Payout Policy: Evidence from the Jordanian Firms. International Journal of Business and Management, 7 (7), PP. 172 – 179.
Nugroho, B and Eko, U, 2011. Board Characteristics and Earning Management. Journal of Administrative Science and Organization, 18 (1), pp. 1 – 10.
Nyberg, A, Fulmer, I, Gerhart, B. and Carpenter, M. 2010. Agency theory revisited: COE return and shareholder interest alignment. Academy of Management Journal, 53 (5), pp. 1029 – 1049.
Ohlson, J and Feltham, J, 1995. Valuation and clean surplus accounting for operating and financial activities. Contemporary Accounting Research, 11 (2), pp. 689 – 731.
Okab, R, 2013. The Expert Systems and Their Role in Developing External Auditor's Performance and Improving Audit Service's Quality in Information Technology Environment in Audit's Offices Located in the Hashemite Kingdom of Jordan. International Journal of Business and Management; Vol. 8, No. 17, pp. 129 – 141.
Omonuk, J., 2007. Rate regulation and earnings management: Evidence from the U.S electric utility industry. (PhD thesis), (Department of Accounting), Louisiana State University.
Okpala, K, 2012. Audit committee and integrity of financial statements: A Preventive Mechanism for Corporate Failure. Australian Journal of Business and Management Research, 2 (8), pp. 32 – 40.

REFERENCES
296
Omran, M, Bolbol, A and Fatheldin, A, 2008. Corporate governance and firm performance in Arab equity markets: Does ownership concentration matter. International Review of Law and Economics, 28 (1), pp. 32 – 45.
Oqab, R, 2012. The Role of the Audit Committee in Raising the Efficiency of the Internal Control System to Combat Money Laundering in Jordanian Banks. International Research Journal of Finance and Economics, 1 (88), pp. 102 – 117.
Osma, B and Noguer, B, 2007. The Effect of the Board Composition and its Monitoring Committees on Earnings Management: Evidence from Spain. Corporate Governance an International Review, 15 (6), pp. 1413 – 1428.
Page, M and Spira, L, 2004. The Turnbull report, internal control and risk management: The developing role of internal audit. Edinburgh: Institute of Chartered Accountants of Scotland.
Paik, D and Selby, D, 2011. The effect of audit committee independent on the distribution of earnings levels and changes. International Journal of Business Research, 11 (5), pp. 54 – 66.
Pan, Y, Teng, L, Supapol, A, Lu, X, Huang, D and Wang, Z, 2014. Firms’ FDI ownership: The influence of government ownership and legislative connections. Journal of International Business Studies, 45 (8), pp.1029–1043.
Pardoe, I, Yin, X and Cook, R, 2007. Graphical tools for quadratic discriminant analysis. Technometrics, 49 (2), 172 – 183.
Patell, J. M., 1976. Corporate Forecasts of Earnings per Share and Stock Price Behavior: Empirical Tests. Journal of Accounting Research, 14 (Autumn), pp. 246 - 276.
Peasnell, K, Pope, P and Young, S, 2005. Board Monitoring and Earnings Management: Do Outside Directors Influence Abnormal Accruals? Journal of Business Finance and Accounting, 32 (7, 8), pp. 1311 – 1346.
Peasnell, K Pope, P and Young, S, 2000. Detecting earnings management using cross-sectional abnormal accruals models. Accounting and Business Research, 30 (4), pp. 313 – 326.
Persons, O, 2006. Corporate Governance and Non-Financial Reporting Fraud. The Journal of Business and Economic Studies, 12 (1), pp. 27 – 40.
Petroni, K., 1992. Optimistic reporting in the property-casualty insurance industry. Journal of Accounting and Economics, 15 (4), pp. 485 - 508.
Ping, Z and Wing, C, 2011. Corporate Governance: A Summary Review on Different Theory Approaches. International Research Journal of Finance and Economics, 1 (68), pp. 7 – 13.
Piot, C and Janin, R, 2007. External Auditors, Audit Committees and Earnings Management in France. European Accounting Review, 16 (2), pp. 429 – 454.
Philip, L, 1998. Combining quantitative and qualitative approaches to social research in human geography-an impossible mixture? Environment and planning A, 30 (2), pp. 261 – 276.
Phillips, J, Pincus, M and Rego, S, 2003. Earnings management: new evidence based on deferred tax expenses. The Accounting Review, 78 (2), pp. 491 – 521.
Plummer, E., and Mest, D, 2001. Evidence on the management of earnings components. Journal of Accounting, Auditing and Finance, 16 (4), pp. 301 - 323.
Porter, J and Kraut, M, 2013. Do Analysts Removal Earnings Management when forecasting Earnings? Academy of Accounting and Financial Studies Journal, 17 (2), pp. 95 - 107.
Prawitt, D, Smith, J and Wood, D, 2009. Internal audit quality and earnings management. The Accounting Review, 84 (4), pp. 1255 – 1280.
Prencipe, A. and Bar-Yosef, S., 2011. Corporate governance and earnings management in family-controlled companies. Journal of Accounting, Auditing and Finance, 26 (2), pp. 199 - 227.
Pornupatham, S, 2006. An Empirical Examination of Earnings Management, Audit Quality and Corporate Governance in Thailand: Perceptions of Auditors and Audit Committee Members. (PhD thesis), (Accounting and Finance Section), Cardiff Business School.
Popper, K.R., 1972. Objective Knowledge. UK: Clarendon. Puat, N and Susela, D, 2013. Audit committee experts and earnings quality. Corporate Governance: The
International Journal of Effective Board Performance. 13 (4), pp. 335 - 351. Purcarea, A and Danalache, F, 2008. The effect of organizational culture on business. U.P.B. Sci. Bull., Series
D, 70 (1), pp. 24 – 32. Putnam, H, 1981. Reason, truth and history. 1 edition, UK: Cambridge University. Qi, B and Tian, G, 2012. The Impact of Audit Committees’ Personal Characteristics on Earnings Management:
Evidence from China. The Journal of Applied Business, 28 (6), pp. 1331 – 1344. Raheja, C, 2005. Determinants of board size and composition: A theory of corporate boards. Journal of
Financial and Quantitative Analysis, 40 (02), PP. 283 – 306. Ray, B., 2009. Market and political/regulatory perspectives on the recent accounting scandals. Journal of
Accounting Research, 47 (2), pp. 277 – 323.

REFERENCES
297
Reddy, K, Locke, S and Scrimgeour, F, 2010. The efficacy of principle-based corporate governance practices and firm financial performance: An empirical investigation. International Journal of Managerial Finance, 6 (3), pp. 190 – 219.
Rezaei, F., 2012. Efficient or opportunistic earnings management with regards to the role of firm size and corporate governance practices. Interdisciplinary Journal of Contemporary Research in Business, 3 (9), pp. 1312 – 1322
Rhee, S and Wang, J, 2009. Foreign institutional ownership and stock market liquidity: Evidence from Indonesia. Journal of Banking and Finance, 33 (7), pp. 1312 - 1324.
Roe, M, 1994. Strong Managers Weak Owners: The Political Roots of American Corporate Finance. 1 edition, UK: University Press.
Rohaida, B, 2011. The Relationship between Governance Practices, Audit Quality and Earnings Management: UK Evidence. (PhD thesis), (School of Business), Durham University.
Romney, M.B and Steinbart, P.H., 2003. Accounting information systems. 9th edition, USA: Prentice Hall. Ronen, J. and Yaari, V, 2008. Earnings management: Emerging insights in theory, practice, and research. 1th
edition, New York: springer. Rose, C. 2007. Can Institutional Investors Fix the Corporate Governance Problem? Some Danish Evidence.
Journal of Management and Governance, 11 (4), pp. 405 - 428. Rosner, B, 2006. Fundamentals of Biostatistics. 6th edition, London: Thomson. Rosner, R, 2003. Earnings manipulation in failing firms. Contemporary Accounting Research, 20 (2), pp. 361–
408. Rowland, J, Altabini, R and Almomani, M, 2009. Democracy and the Tribal System in Jordan: Tribalism as a
Vehicle for Social Change. SIT Study Abroad, available at: [http://digitalcollections.sit.edu/isp_collection/749].
Ruan, W, Tian, G and Ma, S, 2011. Managerial Ownership, Capital Structure and Firm Value: Evidence from China’s Civilian-run Firms. Australasian Accounting Business and Finance, 5 (3), pp. 73 – 92.
Rudra, T and Bhattacharjee, D, 2012. Does IFRs Influence Earnings Management? Evidence from India. Journal of Management Research, 4 (1), pp. 1 – 13.
Ryan, B, Scapens, R.W and Theobald, M, 2002. Research method and methodology in finance and accounting. 2th edition, London: Thomson.
Sadka, G., 2006. The Economic Consequences of Accounting Fraud in Product Markets: Theory and a Case from the U.S. Telecommunications Industry (WorldCom). American Law and Economics Review. 8 (3), pp. 439 - 475.
Saleh, N, Iskandar, T and Rahmat, M, 2007. Audit committee characteristics and earnings management: evidence from Malaysia. The Asian Review of Accounting, 15 (2), pp. 147-163.
Sanchez-Ballesta, J and Garcia-Meca, B, 2007. Ownership structure, discretionary accruals and the informativeness of earnings. Corporate Governance, 15 (4), pp. 677 – 691.
Sarkar, J, Sarkar, S and Sen, K. 2008. Board of Directors and Opportunistic Earnings Management: Evidence from India. Journal of Accounting, Auditing and Finance, 23 (4), pp. 517 – 551.
Saunders, M. and Lewis, P, 2003. Research Methods for Business Students. First edition, Essex: Pearson Education Limited.
Saunders, M, Lewise, P and Thornhill, A, 2007. Research Methods for Business Studies. London: Pitman Publishing.
Sayer, A, 1992. Method in Social Science: A Realist Approach. 2th Edition, UK: Routledge. Schipper, K, 1989. Earnings Management. Accounting Horizons, 3 (4), pp. 91 – 102. Schneider, A. and Church, B.K, 2008. The effect of auditors’ internal control opinions on loan decisions.
Journal of Accounting and Public Policy, 27, pp. 1 – 18. Schulze, W, Lubatkin, M, Dino, R and Buchholtz, A, 2001. Agency relationships in family firms: Theory and
evidence. Organization science, 12 (2), pp. 99 – 116. Schulze, W, Lubatkin, M and Dino, R, 2003. Toward a theory of agency and altruism in family firms. Journal
of Business Venturing, 18 (4), pp. 473 – 490. Shen, C and Chih, H, 2007. Earnings Management and Corporate Governance in Asia's Emerging Markets.
Corporate Governance: An International Review, 15 (5), pp. 999 – 1021. 23p. Shleifer, A and Vishny, R, 1997. A Survey of Corporate Governance. Journal of Finance, 52 (2), pp. 737 – 783. Shleifer, A and Vishny, R, 1986. Large shareholders and corporate control. Journal of Political Economy, 94
(3), pp. 461 – 488. Sheridan, L, Jones, E and Marston, C, 2006. Corporate governance codes and the supply of corporate
information in the UK. Corporate Governance: An International Review, 14 (5), pp. 497 – 503. Silverman, B, 1986. Density Estimation for Statistics and Data Analysis. First edition, New York: Chapman and
Hall.

REFERENCES
298
Siregar, S and Utama, S, 2008. Type of earnings management and the effect of ownership structure, firm size, and corporate-governance practices: Evidence from Indonesia. The International Journal of Accounting, 43 (1), pp. 1 – 27.
Sloan, R, 2001. Financial accounting and corporate governance: a discussion. Journal of Accounting and Economics, 32 (1-3), PP. 335 - 347.
Sloan, R, 1996. Do stock prices fully reflect information in accruals and cash flows about future earnings. The Accounting Review, 71 (3), pp. 289 – 315.
Smith, C., 1947. Some examples of discrimination. Annals of Eugenics, 13 (1), pp. 272 – 282. Smith, M.J, 1998. Social Science in Question. First edition, London: Sage. Smith, R, 2003. Audit committees combined code guidance. London: Financial Reporting Council. Song, J and Windram, B, (2004). Benchmarking Audit Committee Effectiveness in Financial Reporting.
International Journal of Auditing, 8 (3), pp.195 – 207. Spiceland, D, Sepe, J and Tomassini, L, 2007. Intermediate Accounting Fully Revised for SFAS (158). 4 Ed,
USA: Ohio State University. Srnka, K and Koeszegi, S, 2007. From words to numbers: how to transform qualitative data into meaningful
quantitative results. Schmalenbach Business Review, 59 (1), pp. 29 – 57. STATA 13, 2014. Discriminant analysis. Available at: http://www.stata.com/manuals13/mvdiscrim.pdf. Stapledon, G, 1998. The Hampel report on corporate governance. Company and Securities Law Journal, 16 (1),
pp. 408 – 413. Steckler, A, McLeroy, K, Goodman, R, Bird, S and McCormick, L, 1992. Toward integrating qualitative and
quantitative methods: an introduction. Health education quarterly, 19 (1), pp. 1 – 8. Stemberg, E, 2004. Corporate Governance: Accountability in the Marketplace. 2nd Edition, London: The
Institute of Economic Affairs. Stiles, P and Taylor, B, 1993. Maxwell–The failure of corporate governance. Corporate Governance: An
International Review, 1 (1), pp. 34 – 45. Stubben, S.R, 2010. Discretionary revenues as a measure of earnings management. The Accounting Review, 85
(2), pp. 695 - 717. Stubben, S.R, 2006. The use of discretionary revenues to meet earnings and revenues targets. (PhD thesis),
(Graduate School of Business), Stanford University. Suwaidan, M.S and Qasim, A, 2010. External auditors' reliance on internal auditors and its impact on audit fees:
An empirical investigation. Managerial Auditing Journal, 25 (6), pp. 509 – 525. Tang, C and Tikoo, S, 1999. Operational flexibility and market valuation of earnings. Strategic Management
Journal, 20 (8), pp. 749 – 761. Tashakkori, A and Teddlie, C, 1998. Mixed Methodology: Combining qualitative and quantitative
approaches. Thousand Oaks, CA: Sage. Taylor, P.C and Medina, M.D, 2013. Educational Research Paradigms: From Positivism to Multiparadigmatic.
Institute of Meaning Centered Education, 1, pp. 1- 4. Tendeloo, B and Vanstraelen, A, 2005. Earnings management under German GAAP versus IFRS. European
Accounting Review, 14 (1), pp. 155-180. Teshima, N and Shuto, A, 2008. Managerial Ownership and Earnings Management: Theory and Empirical
Evidence from Japan. Journal of International Financial Management and Accounting, 19 (2), pp.107 – 132.
The Institute of Chartered Accountants, 2005. Agency theory and the role of audit. Audit and Assurance Faculty, UK: England and Wales.
The Organization of Economic Cooperation and Development, 2004. OECD Principles of Corporate Governance. Available at: [http://www.oecd.org].
The Royal Jordanian Geographic Centre, 2012. Available at: [http://www.rjgc.gov.jo/default.aspx?lang=en]. The World Bank, 2013. Available at [http://www.worldbank.org/]. Thoopsamut, W and Jaikengkit, A, 2009. Audit Committee Characteristics, Audit Firm Size and Quarterly
Earnings Management in Thailand. Oxford Journal, 2009, 8 (1), pp. 3 – 12. Tricker R, 1994. International Corporate Governance, Text, Readings and Cases. 1 edition, New York: Prentice
Hall. Turley, S and Zaman, M, 2004. The corporate governance effects of audit committees. Journal of management
and governance, 8 (3), pp. 305 – 332. Turnbull, N, 2000. Internal Control: Guidance for Directors on the Combined Code (The Turnbull Report). Risk
Management, 2 (4), pp. 65-69. Turner, L, Williams, J, and Weirich, T, 2005. An inside look at auditor changes. The CPA Journal, November
(Innovations Supplement), pp. 12 – 21. Vafeas, N, 1999. Board meeting frequency and firm performance. Journal of Financial Economics, 53 (1), pp.
113 – 142.

REFERENCES
299
Vafeas, N, 2005. Audit committees, boards, and the quality of reported earnings. Contemporary Accounting Research, 22 (4), pp. 1093 – 1122.
Van de Poel, K. and Vanstraelen, A., 2011. Management reporting on internal control and accruals quality: Insights from a “Comply-or-Explain” internal control regime. Auditing: A Journal of Practice and Theory, 30 (3), pp. 181 – 209.
Veenman, D, Hodgson, A, Praag, B, and Zhang, W, 2011. Decomposing executive stock option exercises: Relative information and incentives to manage earnings. Journal of Business Finance and Accounting, 38 (5-6), pp. 536 – 573.
Velury, U, 2005. The Association between an Auditor Industry Specialization and Earnings Management. Research in Accounting Regulation, 16 (1), pp. 107 – 184.
Velury, U and Jenkins, D, 2006. Institutional ownership and the quality of earnings. Journal of Business Research, 59 (9), PP. 1043 – 1051.
Veprauskaite, E and Adams, M, 2013. Do powerful Chief Executive Influence the Financial Performance of UK firms? The British Accounting Review. 45 (3), pp. 230 – 241.
Verrecchia, R, 2001. Essays on Disclosure. Journal of Accounting and Economics, 32 (1-3), pp. 97 – 180. Vicknair, D, Hickman, K and Cames, K, 1993. A Note on Audit Committee Independence: Evidence from the
NYSE on Grey Area Directors. Accounting Horizons, 7 (1), pp. 53 – 57. Vlachos, I.P., 2009. The effects of human resource practices on firm growth. International Journal of Business
Science and Applied Management, 4 (2), pp. 18 – 34. Wang, D, 2006. Founding Family Ownership and Earnings Quality. Journal of Accounting Research, 44 (3), pp.
619 – 656. Wang, L and Yang, K, 2011. Do State Enterprises Manage Earnings More than Privately Owned Firms? The
Case of China. Journal of Business Finance and Accounting, 38 (7, 8), pp. 794 – 812. Wang, Q, Wong, T and Xie, L, 2008. State ownership, the institutional environment, and auditor choice:
Evidence from China. Journal of Accounting and Economics, 46 (1), pp. 112 – 134. Wang, Y and Campbell, M, 2012. Corporate governance, earnings management, and IFRS: Empirical evidence
from Chinese domestically listed companies. Advances in Accounting, incorporating Advances in International Accounting, 28, pp. 189 – 192.
Wang, Y and Campbell, M, 2012, a. Earnings Management Comparison: IFRS vs. China GAAP. International Management Review, 8 (1), pp. 5 – 11.
Warfield, T, Wild, J and Wild, K, 1995. Managerial ownership accounting choices, and informativeness of earnings. Journal of Accounting and Economics, 20 (1), pp. 61 – 91.
Watts, R and Zimmerman, J, 1983. Agency problems, auditing and the theory of the firm, some evidence. Journal of Law and Economics, 26 (3), pp. 613 – 633.
Watts, R and Zimmerman, J, 1978. Towards a positive theory of the determination of accounting standards. The Accounting Review, 53 (1), pp. 112 - 134.
Watts, R and Zimmerman, J, 1986. Positive accounting theory: a ten year perspective. The Accounting review, 65 (1), pp. 131 – 156.
Weaver, G.R and Gioia, D.A, 1994. Paradigms lost: Incommensurability vs structurationist inquiry. Organisation Studies, 15 (4), pp. 565 – 590.
Wiedman, C, 1996. The relevance of characteristics of the information environment in the selection of a proxy for the market’s expectations for earnings: an extension of Brown, Richardson and Schwager. Journal of Accounting Research, 34 (2), pp. 313 – 324.
Wiersma, W, 1995. Research methods in education: An introduction. 6th ed. Boston: Allyn and Bacon. Wijewardena, H, Nanayakkara, G and De Zoysa, A, 2008. The owner/manager's mentality and the financial
performance of SMEs. Journal of Small Business and Enterprise Development, 15 (1), pp.150 – 161. Wild, J, 1996. The Audit Committee and Earnings Quality. Journal of Accounting Auditing and Finance, 11 (2),
pp. 247 – 276. Woolf, E., 1997. Auditing today. 1th edition, Hertfordshire: Prentice Hall Europe. Wu, J. Liu, L., and Jones, F., 2011. Firm value and earning management after internal control weakness
remediation. International Journal of Business Research, 11, pp. 111 - 122. Xie, B, Davidson, W and DaDalt, P, 2003. Earnings Management and Corporate Governance: The Role of
Board and the Audit Committee. Journal of Corporate Finance, 9 (3), pp. 295 – 316. Yang, C, Lai, H and Tan, B, 2008. Managerial Ownership Structure and Earnings Management. Journal of
Financial Reporting and Accounting, 6 (1), pp. 35 - 53. Yang, J and Krishnan, J, 2005. Audit Committees and Quarterly Earnings Management. International Journal
of Auditing, 9 (3), pp. 201 – 19. Yang, M, 2010. The Impact of Controlling Families and Family CEOs on Earnings Management. Family
Business Review, 23 (3), pp. 266 – 279.

REFERENCES
300
Yang, W, Chun, L and Ramadili, S, 2009. The Effect of Board Structure and Institutional Ownership Structure on Earnings Management. International Journal of Economics and Management, 3 (2), pp. 332 – 353.
Yermack, D, 1996. Higher market evaluation of companies with a small board of directors, Journal of Financial Economics, 40 (2), pp. 185 – 211.
Yeo, G, Tan, P, Ho, K and Chen, S, 2002. Corporate Ownership Structure and the Informativeness of Earnings. Journal of Business Finance and Accounting, 29 (7, 8), pp. 1023 – 1046.
Yin, R, 2009. Case study research: design and methods. Fourth edition, USA: SAGE Publications. Yoon, S, Miller, G and Jiraporn, P, 2006. Earnings management vehicles for Korean firms. Journal of
International Financial Management and Accounting, 17 (2), pp. 85 – 109. Zahra, S and Pearce, J, 1989. Boards of Directors and Corporate Financial Performance: A Review and
Integrative Model. Journal of Management, 15 (2), pp. 291-334. Zéghal, D, Chtourou, S and Sellami, Y, 2011. An analysis of the effect of
mandatory adoption of IAS/IFRS on earnings management. Journal of International Accounting, Auditing and Taxation, 20 (2), pp. 61 – 72.
Zeitun, R, 2009. Ownership Structure, Corporate Performance and Failure: Evidence from Data Emerging Market the Case of Jordan. Corporate Ownership and Control, 6 (4), pp. 96 – 114.
Zéghal, D, Chtourou, S and Sellami, Y, 2011. An analysis of the effect of mandatory adoption of IAS/IFRS on earnings management. Journal of International Accounting, Auditing and Taxation, 20 (2), pp. 61 – 72.
Zhong, K, Gribbin, D and Zheng, X, 2007. The Effect of Monitoring by Outside Blockholders on Earnings Management. Quarterly Journal of Business and Economics, 46 (1), pp. 37 – 60.

Appendices
301
10. Appendices
10.1 Appendix (1) Semi-structured Interview Questions
Loughborough University
School of Business and Economics
Accounting and Finance Department
Semi-Structured Interview 2013/2014

Appendices
302
Dear Sir,
I am a PhD student in the Accounting and Finance Department of the School of Business
and Economics, Loughborough University, United Kingdom. I am currently examining the
relationship between internal control, corporate governance and accounting quality in
Jordanian Industrial Firms. Your answers to these interview questions will form an
important part of my PhD research.
The questions for the interview are included overleaf and contain firstly, some general
questions relating to your role in the company and secondly, questions related to internal
control and monitoring processes within your company.
The companies have been chosen to represent a cross-section of Jordanian industrial
companies. I would like to assure you that anything you say in these interviews will be
treated as confidential. The research will be written up for my PhD thesis and will not include
your name at any point. Any subsequent journal papers will include neither the names of
individuals nor the organisations for which they work. You are welcome to see a copy of my
thesis once it is written and I will also send you a copy of any articles, prior to submission to
a journal, for your approval.
I hope that you will allow me to record this interview since I might be forget some points that
will help me. The recordings will not be used by anyone other than me and will only be used
for the purpose of this research project. They will not be published or distributed in any way.
I will also produce an anonymised summary of the research findings for distribution to those
who were interviewed. In this way, I hope the findings may prove useful to you in evaluating
your internal control systems.
Adel Almasarwah
Email: [email protected]

Appendices
303
I am here to do interview with you regarding to my PhD work, Can I ask you several
questions?
Can I start by knowing what is your position and role in this firm?
How long have you been in this position?
What is your previous experience?
Your qualifications?
Do you have any professional qualification?
Could you please describe the governance structure in your firm
How do you control and monitor business operations and the financial reporting process? Can
you give some examples?
Why do you consider bad debt provision is an important issue? Do you think this issue leads
to a problem for you firm?
Do you have a separate internal audit department?
How does the audit committee operate?
Are you following USA internal audit standards or UK internal audit standards?
Could you please describe the management structure?
Who are the board of directors’ members? Can you give an example?
Could you please now tell me about the roles of board of directors?
Who is the CEO and what is their role?
Who is the CFO and what is their role?
Is your CEO and head of board of directors the same person?
Can you describe your organisation charts?
Who are your external auditors?
Do external auditors provide any services in addition to statutory audit?

Appendices
304
What are your company’s financial objectives?
What do you see as the main obstacles your company faces in achieving these objectives?
From your experience how do you avoid these obstacles?
How do government regulations affect your firm?
How does your company adapt its systems of management and control to changes in its
external environment? Can you give some examples?
How does your firm adapt with external environmental factors such as, economic
circumstances and government regulations?
Could you please explain how the firms might manage their profit?
Do the culture and religion affect your internal control system?
When did your company last change to a different stick market?
How does this change affect your company?
When did you last make any significant changes to your systems of control and monitoring?
What caused you to do this? What were they? How did they affect functional roles of
individuals within the organisation? Can you give some examples?
Do you suggest any points that might help to solve any problems facing your internal control
system?
Please explain in more detail the role of your audit committee in the governance of your
company. How often do they meet?
Who do they report to?
Who reports to them?
What is the nature of their work?
Does the audit committee have a lot of power in your firm?
Does your audit committee have an effect on external auditor decisions? Can you give
examples?

Appendices
305
Who decides areas of investigation/projects for the audit committee?
What are the roles of government here to protect the small shareholders from big
shareholders?
Please explain in more detail the role of the board of directors in the governance of your
company.
How often do they meet?
Who reports to them?
How does the board of directors ensure the integrity of the internal control system?
How would you characterise the relationship between general manager/CFO and the internal
audit function?
Do you have good relationship with the internal auditors?
What are the factors that you rely on to hire internal auditors?
Which financial school are you following (new school or traditional one)? Can you give
example?
Could you please explain the organisation of your finance department?
How do you monitor and control the revenue account in your firm?
Can you give some examples how you control revenue account?
How do you monitor and control ageing accounts receivable in your firm? Can you give
example?
What are the reasons that lead to more accounts receivable?
How do you monitor and control your expenses account in your firm? Can you give some
examples?
When did you start applying IFRS in your company?
Has the adoption of IFRS caused any changes to your internal control systems?

Appendices
306
Do you think that government regulation helps to improve your management system? Can
you give some examples?
In your experience, are there any ways in which your firm could improve its internal control
systems?
Can you describe the relationship between your internal control department and the external
auditors?
What are the factors that you are rely on to hire external auditor?
Have you changed your external auditor recently? And if so why?
Could you please describe the tax system in Jordan and how it affects your firm?
Could you please tell me about the ownership concentration in your firm?
Could you please tell me more about cultural factors that might affect your firm? (Such as,
tribal system, education, experience,).
Thank you very much for your interest

Appendices
307
10.2 Appendix (2) Interviewee’s Organisations Detail
The names of firms are hidden due to the sensitivity of this research subject, and we replace their names with pseudonyms (i.e. groups) according to the results of standard prediction error test according (Jones, 1991) and the classification of Amman stock markets.
Group (1): Semi-structured Interviews (A) This firm is a public firm, listed on Amman Stock Exchange early of 2000, operating within the Pharmaceutical and Medical Industries sector focusing on diversified manufacturing the human medicines, medical appliances and cosmetics manufacturing the human medicines, medical appliances and cosmetics. It was established 36 years ago. Shareholders Types Jordanian
Shareholders Arab Shareholders Foreign Shareholders
Individuals 1,529 56 2 Companies 15 4 0 Mutual Funds 2 0 0 Institutions 1 0 0 Joint 1 0 0 Organizations 0 0 1 Total
Respondent Information for this Firm Below Table provides all respondent personal information (e.g. qualification, experience, current position and previous position. Respondent Personal Information NO R. Position Qualification Professional
Certificate Holding
Previous Position Experience
1 Financial Manager
M.A Accounting
JCPA1 9
Firm (A) Classification in Amman stock Market from 2005 to 2013 interview firm market during 2005 to 2013 in Amman stock market
Year Firm Market Classification
2005 2 2006 2 2007 2 2008 1 2009 1 2010 1 2011 2
1 JCPA is Jordanian Certified Public Accountant.

Appendices
308
2012 1 2013 1
Group (1): Semi-structured Interviews study (B) This firm is a public firm, listed on Amman Stock Exchange early of 2003, operating within the consumer durables and apparel sector focusing on home furnishings. It was established 34 years ago. Shareholders Types Jordanian
Shareholders Arab Shareholders Foreign Shareholders
Individuals 256 2 2 Companies 9 6 1 Total 265 8 3
Respondent Information for (B) Firm Below Table provides all respondent personal information (e.g. qualification, experience, current position and previous position. Respondent Personal Information NO R. Position Qualification Previous
Experience
1 Financial and Administrative Manager. M.A Accounting 35 Firm (B) Classification in Amman stock Market from 2005 to 2013 Interview firm market during 2005 to 2013 in Amman stock market
Year Firm Market Classification
2005 1 2006 1 2007 2 2008 1 2009 2 2010 2 2011 2 2012 1 2013 2

Appendices
309
Group (2): Semi-structured Interviews (A) This firm is a public firm, listed on Amman Stock Exchange in 2003, operating within the materials sector. It was established 38 years ago. Shareholders Types Jordanian
Shareholders Arab Shareholders Foreign Shareholders
Individuals 1,729 146 17 Companies 8 0 0 Mutual Funds 1 0 0 Institutions 2 0 0 Joint 1 0 0 Organizations 3 0 0 Total 1744 146 17
Respondent Information for (A) Firm Below Table provides all respondent personal information (e.g. qualification, experience, current position and previous position. Respondent Personal Information
NO R. Position Qualification Previous Position Experience 1 Financial Manager B.A Commerce 22
Firm (A) Classification in Amman stock Market from 2005 to 2013 Interview firm market during 2005 to 2013 in Amman stock market
Year Firm Market Classification
2005 1 2006 1 2007 1 2008 1 2009 1 2010 1 2011 2 2012 1 2013 1
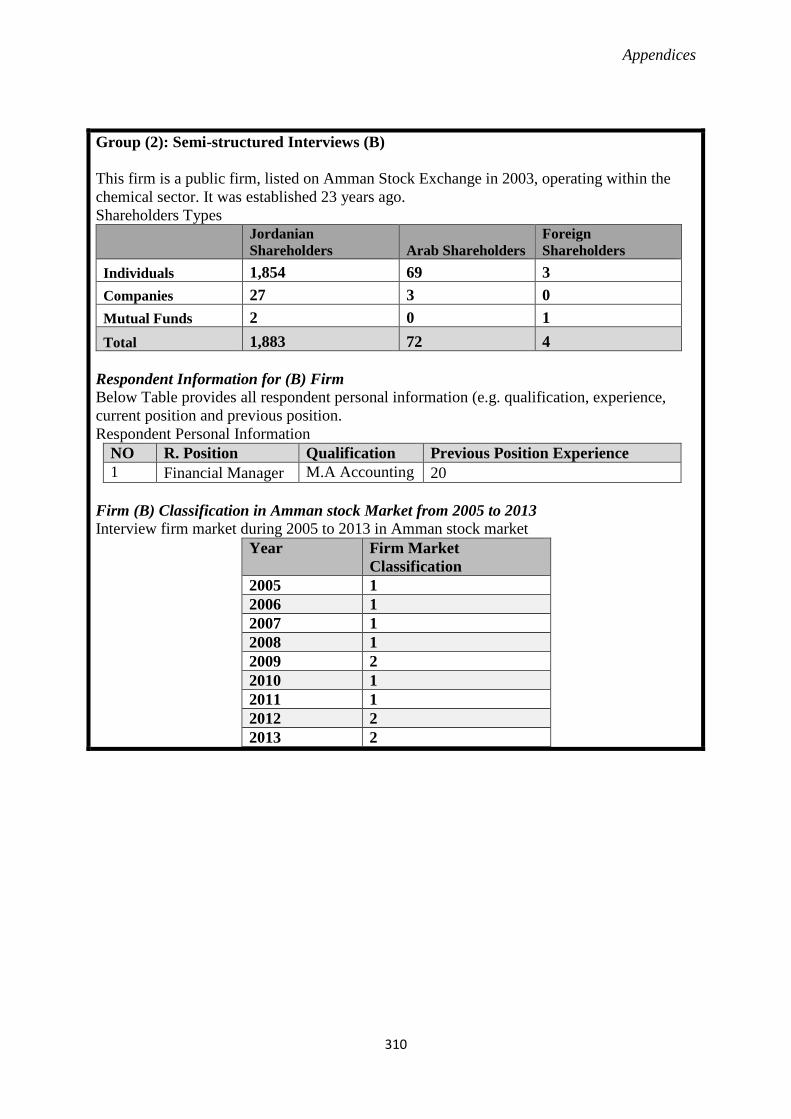
Appendices
310
Group (2): Semi-structured Interviews (B) This firm is a public firm, listed on Amman Stock Exchange in 2003, operating within the chemical sector. It was established 23 years ago. Shareholders Types Jordanian
Shareholders Arab Shareholders Foreign Shareholders
Individuals 1,854 69 3 Companies 27 3 0 Mutual Funds 2 0 1 Total 1,883 72 4
Respondent Information for (B) Firm Below Table provides all respondent personal information (e.g. qualification, experience, current position and previous position. Respondent Personal Information
NO R. Position Qualification Previous Position Experience 1 Financial Manager M.A Accounting 20
Firm (B) Classification in Amman stock Market from 2005 to 2013 Interview firm market during 2005 to 2013 in Amman stock market
Year Firm Market Classification
2005 1 2006 1 2007 1 2008 1 2009 2 2010 1 2011 1 2012 2 2013 2

Appendices
311
Group (3): Semi-structured Interviews (A) This firm is a public firm, listed on Amman Stock Exchange in 2003, operating within the materials sector focusing on diversified metals and mining. It was established 33 years ago. Shareholders Types Jordanian
Shareholders Arab Shareholders Foreign Shareholders
Individuals 679 40 8 Companies 12 0 0 Mutual Funds 1 0 0 Government 1 0 0 Total 693 40 8
Respondent Information for (A) Firm Below Table provides all respondent personal information (e.g. qualification, experience, current position and previous position. Respondent Personal Information Respondent Personal Information
NO R. Position Qualification Previous Position Experience 1 Financial Manager M.A Accounting 22
Firm (A) Classification in Amman stock Market from 2005 to 2013 Interview firm market during 2005 to 2013 in Amman stock market
Year Firm Market Classification
2005 1 2006 1 2007 2 2008 2 2009 1 2010 2 2011 2 2012 2 2013 2

Appendices
312
Group (3): Semi-structured Interviews (B) This firm is a public firm, listed on Amman Stock Exchange in October 2003 this firm operated under paper and cardboard industries. It was established 40 years ago. Shareholders Types Jordanian
Shareholders Arab Shareholders Foreign Shareholders Individuals 735 735 17 Companies 11 11 0 Mutual Funds 1 1 0 Institutions 1 1 0 Joint 2 2 0 Organizations 1 1 0 Total 751 751 17
Respondent Information for (B) Firm Below Table provides all respondent personal information (e.g. qualification, experience, and position). Respondent Personal Information NO R. Position Qualification Previous Position
Experience 1 Financial Manager M.A Accounting 9 2 Internal Auditor
Manger M.A International Financial Business
12
Firm (B) Classification in Amman stock Market from 2005 to 2013 Interview firm market during 2005 to 2013 in Amman stock market
Year Firm Market Classification
2005 1 2006 1 2007 2 2008 2 2009 1 2010 2 2011 2 2012 2 2013 2

Appendices
313
Group (4): Semi-structured Interviews (A) This firm is a public firm, listed on Amman Stock Exchange in 2005. This firm operated under materials sector. It was established 18 years ago. Shareholders Types Jordanian
Shareholders Arab Shareholders Foreign Shareholders
Individuals 140 8 1 Companies 15 0 0 Mutual Funds 1 0 0 Total 156 8 1
Respondent Information for (A) Firm Below Table provides all respondent personal information (e.g. qualification, experience, current position and previous position. Respondent Personal Information
NO R. Position Qualification Previous Position Experience
1 Financial and Administrative Manager
B.A Accounting 11
Firm (A) Classification in Amman stock Market from 2005 to 2013 Interview firm market during 2005 to 2013 in Amman stock market
Year Firm Market Classification
2005 2 2006 2 2007 1 2008 1 2009 1 2010 2 2011 2 2012 2 2013 2

Appendices
314
Group (4): Semi-structured Interviews (B) This firm is a public firm, listed on Amman Stock Exchange in 2004. This firm operated under packaging and printing sector. It was established 19 years ago. Shareholders Types Jordanian
Shareholders Arab Shareholders Foreign Shareholders
Individuals 240 7 5 Companies 10 3 0 Mutual Funds 1 0 0 Total 251 10 5
Respondent Information for (B) Firm Below Table provides all respondent personal information (e.g. qualification, experience, current position and previous position. Respondent Personal Information
NO R. Position Qualification Previous Position Experience
1 Financial Manager
B.A Accounting 10
Firm (B) Classification in Amman stock Market from 2005 to 2013 Interview firm market during 2005 to 2013 in Amman stock market
Year Firm Market Classification
2005 1 2006 1 2007 1 2008 1 2009 1 2010 2 2011 2 2012 2 2013 2

Appendices
315
Group (5): Semi-structured Interviews (A) This firm is a public firm, listed on Amman Stock Exchange early of 2000, operating within the Pharmaceutical and Medical Industries. It was established 36 years ago. Shareholders Types Jordanian
Shareholders Arab Shareholders Foreign Shareholders
Individuals 619 13 4 Companies 11 0 0 Mutual Funds 1 0 0 Total 631 13 4
Respondent Information for (A) Firm Below Table provides all respondent personal information (e.g. qualification, experience, current position and previous position. Respondent Personal Information NO R. Position Qualification Previous Position
Experience 1 Financial Management Manager M.A Accounting 33
Firm (A) Classification in Amman stock Market from 2005 to 2013 Interview firm market during 2005 to 2013 in Amman stock market
Year Firm Market Classification
2005 2 2006 2 2007 2 2008 1 2009 1 2010 1 2011 1 2012 2 2013 2

Appendices
316
Group (6): Semi-structured Interviews (A) This firm is a public firm, listed on Amman Stock Exchange in 2003, operating within Textiles, Leathers and Clothings Industries. It was established 50 years ago. Shareholders Types Jordanian
Shareholders Arab Shareholders Foreign Shareholders
Individuals 940 65 4 Companies 28 2 1 Mutual Funds 2 0 0 Institutions 3 0 0 Governments 1 0 0 Joint 1 0 0 Organizations 2 0 0 Total 977 67 5
Respondent Information for (A) Firm Below Table provides all respondent personal information (e.g. qualification, experience, current position and previous position. Respondent Personal Information NO R. Position Qualification Professional
Certificate Holding
Previous Position Experience
1 General Manager B.A Accounting N/A 49 2 Financial Manager B.A Accounting JCPA 40
Firm (A) Classification in Amman stock Market from 2005 to 2013 Interview firm market during 2005 to 2013 in Amman stock market
Year Firm Market Classification
2005 1 2006 1 2007 1 2008 1 2009 1 2010 2 2011 2 2012 1 2013 1

Appendices
317
Group (7): Semi-structured Interviews (A) This firm is a public firm, listed on Amman Stock Exchange early of 2003, operating within Mining sector. It was established for more 60 years ago. Shareholders Types Jordanian
Shareholders Arab Shareholders Foreign Shareholders
Individuals 3,042 390 58 Companies 45 15 11 Mutual Funds 16 2 25 Institutions 4 0 2 Governments 1 2 0 Organizations 3 0 0 Total 3,111 409 96
Respondent Information for (A) Firm Below Table provides all respondent personal information (e.g. qualification, experience, current position and previous position. Respondent Personal Information NO R. Position Qualification Professional
Certificate Holding
Previous Position Experience
1 Executive Financial Manager
M.A Accounting
JCPA 40
Firm (A) Classification in Amman stock Market from 2005 to 2013 Interview firm market during 2005 to 2013 in Amman stock market
Year Firm Market Classification
2005 1 2006 1 2007 1 2008 1 2009 1 2010 1 2011 1 2012 1 2013 1

Appendices
318
Group (8): Semi-structured Interviews (A) This firm is a public firm, listed on Amman Stock Exchange early of 2003, operating within the mining industries. It was established 58 years ago. Shareholders Types Jordanian
Shareholders Arab Shareholders Foreign Shareholders
Individuals 1,174 137 21 Companies 18 5 10 Mutual Funds 5 1 20 Institutions 3 0 1 Governments 1 6 0 Organizations 1 0 0 Total 1,202 149 52
Respondent Information for (A) Firm Below Table provides all respondent personal information (e.g. qualification, experience, current position and previous position. Respondent Personal Information NO
R. Position Qualification
Professional Certificate Holding
Previous Position Experience
1 Internal Audit Manager
B.A Accounting
CPA 15
2 Financial Manager
M.A Accounting
JCPA 10
Firm (A) Classification in Amman stock Market from 2005 to 2013 Interview firm market during 2005 to 2013 in Amman stock market
Year Firm Market Classification
2005 1 2006 1 2007 1 2008 2 2009 2 2010 2 2011 2 2012 1 2013 1

Appendices
319
10.3 Appendix (3) Earnings Management Values Carves for all Sample Models (SJ, MJ, and PPY)
-4.00
-3.00
-2.00
-1.00
0.00
1.00
2.00
3.00
EM E
stim
ate
Axis Title
EM Estimates for the MJ Model

Appendices
320
-4.00
-3.00
-2.00
-1.00
0.00
1.00
2.00
3.00
4.00
50 100
150
200
250
300
350
EM E
stim
ate
Axis Title
EM Estimates for the PPY Model

Appendices
321
10.4 Appendix (4) Regression results and Diagnostics
VIF and Tolerance Results for all Models
First Model (SJ) Second Model (MJ) Third Model (PPY) Variable VIF Tolerance Variable VIF Tolerance Variable VIF Tolerance INDOWNL 34.04 0.03 INDOWNL 34.01 0.03 INDOWNL 26.29 0.04 CFOA 15.64 0.06 CFOA 15 0.07 CFOA 10.72 0.09 ROA 13.53 0.07 ROA 12.75 0.08 ROA 10.69 0.09 ACMEETING 6.69 0.15 ACMEETING 6.46 0.15 ACMEETING 7.97 0.13 ACSIZE 5.92 0.17 ACSIZE 5.51 0.18 ACSIZE 6.53 0.15 IOWNFOR 2.56 0.39 IOWNFOR 2.34 0.43 ACEXPERTISE 2.7 0.37 ACEXPERTISE 2.29 0.44 ACEXPERTISE 2.25 0.45 IOWNFOR 1.98 0.51 EXAREPUT 2.06 0.49 EXAREPUT 2.05 0.49 BSIZE 1.61 0.62 FSUB 2.03 0.49 FAMOWN 1.88 0.53 EXAREPUT 1.6 0.62 FAMOWN 1.88 0.53 MANOWN 1.72 0.58 BLOCKOWN 1.57 0.63 MANOWN 1.8 0.56 BSIZE 1.71 0.58 BINDEPEND 1.53 0.65 BSIZE 1.74 0.58 BLOCKOWN 1.7 0.59 MANOWN 1.5 0.67 BLOCKOWN 1.7 0.59 FSUB 1.7 0.59 FSUB 1.48 0.67 BINDEPEND 1.65 0.60 BINDEPEND 1.65 0.61 BMEETING 1.48 0.68 BMEETING 1.65 0.61 BMEETING 1.64 0.61 FAMOWN 1.46 0.68 STATOWN 1.56 0.64 IOWNLOC 1.45 0.69 BOUTSIDE 1.39 0.72 IOWNLOC 1.5 0.67 STATOWN 1.45 0.69 STATOWN 1.33 0.75 BOUTSIDE 1.45 0.69 BOUTSIDE 1.41 0.71 IOWNLOC 1.33 0.75 ACINDEPEND 1.42 0.70 ACINDEPEND 1.4 0.71 EXAOPIN 1.3 0.77 EXAOPIN 1.38 0.72 EXAOPIN 1.37 0.73 ACINDEPEND 1.29 0.77 FLVE 1.35 0.74 FLVE 1.35 0.74 FLVE 1.22 0.82 INDOWNF 1.23 0.82 INDOWNF 1.22 0.82 INDOWNF 1.19 0.84 EXACHANG 1.16 0.86 EXACHANG 1.16 0.86 EXACHANG 1.13 0.88 EXATENURE 1.04 0.96 EXATENURE 1.04 0.96 EXATENURE 1.03 0.97 Mean VIF 4.4 Mean VIF 4.34 Mean VIF 3.76 BSIZE is Board of Director Size, BMEETING is Number of the Board of Directors, BOUTSIDE is Board of Director Outsiders, and BINDEPEND is Board of Director Independence. ACSIZE is Audit Committee Size, ACMEETING is Number of Audit Committee Meetings, ACINDEPEND is Audit Committee Independence, and ACEXPERTISE is Audit Committee Expertise. EXAREPUT is External Auditor Reputation, EXATENURE is External Audit Tenure, EXAOPIN is External Audit Opinion, and EXACHANG is External Audit Change. MANOWN is Managerial Shareholders, IOWNFOR is Institutional Shareholders Foreign, IOWNLOC is Institutional Shareholders Local, INDOWNF is Individual Foreign, INDOWNL is Individual Local, FAMOWN is Family Ownership, BLOCKOWN is Blockholder Ownership, and STATOWN is State Ownership. FSUB is Firm Subsidiary, FLVE is Financial Leverage, ROA is Firm Performance, and CFOA is Cash Flow from Operating Activities.

Appendices
322
Heteroskedasticity Results for all Models
Breusch-Pagan/Cook-Weisberg test for H0: Constant variance
Variables: fitted values of V First Model (SJ) Second Model (MJ) Third Model (PPY) Chi2(1) 302.75 300.23 694.33 Prob > chi2 0.0 0.0 0.0

Appendices
323
GLS Regression Results for the SJ Model
ACCSJ (N, 273) Exp Signe Coef. z P>z Board of Directors Characteristics
BSIZE - -0.004 -0.320 BMEETING - -0.021 -0.520 BOUTSIDE - -0.030 -0.220 BINDEPEND - 0.011 0.200
Audit Committee Characteristics ACSIZE - -0.050 -1.040 ACMEETING - 0.039 1.050 ACINDEPEND - -0.039 -0.710 ACEXPERTISE - 0.070 0.760
External Audit Factors EXAREPUT - 0.067 1.020 EXATENURE + 0.033 0.620 EXAOPIN + 0.127 1.860 * EXACHANG - -0.055 -0.790
Ownership Structures MANOWN - -0.030 -0.260 IOWNFOR - -0.188 -1.310 IOWNLOC - -0.023 -1.010 INDOWNF + -0.247 -1.250 INDOWNL + 0.063 2.550 ** FAMOWN - -0.252 -1.780 * BLOCKOWN - 0.024 0.310 STATOWN - -0.117 -0.470
Control Variables ROA + 0.983 4.280 *** CFOA - -0.861 -4.030 *** FLVE + 0.749 2.590 *** FSUB - -0.040 -0.610 Adj 𝑹𝑹𝟐𝟐 between Adj 𝑹𝑹𝟐𝟐 overall
𝟖𝟖𝟐𝟐% 𝟖𝟖𝟖𝟖%
Wild Chi2 𝟏𝟏𝟖𝟖𝟖𝟖𝟏𝟏∗∗∗ ACCSJ is Discretionary accruals (Standard Jones Model), ACCMJ is Discretionary accruals
(Modified Jones Model), WAPPY is Working Capital Accruals, BSIZE is Board of Director Size, BMEETING is Number of the Board of Directors, BOUTSIDE is Board of Director Outsiders,
and BINDEPEND is Board of Director Independent. ACSIZE is Audit Committee Size, ACMEETING is Number of Audit Committee Meetings, ACINDEPEND is Audit Committee Independent, and ACEXPERTISE is Audit Committee Expertise. EXAREPUT is External Auditor Reputation, EXATENURE is External Audit Tenure, EXAOPIN is External Audit
Opinion, and EXACHANG is External Audit Change. MANOWN is Managerial Shareholders, IOWNFOR is Institutional Shareholders Foreign, IOWNLOC is Institutional Shareholders
Local, INDOWNF is Individual Foreign, INDOWNL is Individual Local, FAMOWN is Family Ownership, BLOCKOWN is Blockholders Ownership, and STATOWN is State Ownership.
FSUB is Firm Subsidiary, FLVE is Financial Leverage, ROA is Firm Performance, and CFOA is Cash Flow from Operating Activities.
Notes: indicate significant at *** 0.001, ** 0.05, * 0.10

Appendices
324
GLS Regression Results for the MJ Model
ACCMJ (N, 273) Exp Signe Coef. z P>z Board of Directors Characteristics
BSIZE - -0.001 -0.040 BMEETING - -0.008 -0.090 BOUTSIDE - -0.159 -0.490 BINDEPEND - 0.038 0.290
Audit Committee Characteristics ACSIZE - -0.187 -1.660 * ACMEETING - 0.156 1.820 * ACINDEPEND - -0.090 -0.700 ACEXPERTISE - -0.103 -0.470
External Audit Factors EXAREPUT - 0.021 0.130 EXATENURE + 0.103 0.850 EXAOPIN + 0.120 0.750 EXACHANG - -0.307 -1.890 *
Ownership Structures MANOWN - -0.178 -0.650 IOWNFOR - -0.408 -1.180 IOWNLOC - -0.060 -1.090 INDOWNF + -0.328 -0.700 INDOWNL + -0.248 -4.280 *** FAMOWN - -0.116 -0.340 BLOCKOWN - -0.103 -0.550 STATOWN - -0.726 -1.210
Control Variables ROA + 4.356 8.180 *** CFOA - -0.824 -1.650 * FLVE + 1.292 1.890 * FSUB - -0.167 -1.070 Adj 𝑹𝑹𝟐𝟐 between Adj 𝑹𝑹𝟐𝟐 overall
𝟐𝟐𝟐𝟐% 𝟏𝟏𝟖𝟖.𝟓𝟓%
Wild Chi2 𝟏𝟏𝟐𝟐𝟏𝟏.𝟖𝟖𝟏𝟏∗∗∗ ACCSJ is Discretionary accruals (Standard Jones Model), ACCMJ is Discretionary accruals (Modified Jones Model), WAPPY is Working Capital Accruals, BSIZE is Board of Director Size, BMEETING is Number of the Board of Directors, BOUTSIDE is Board of Director Outsiders, and BINDEPEND is Board of Director Independent. ACSIZE is Audit Committee Size, ACMEETING is Number of Audit Committee Meetings, ACINDEPEND is Audit Committee Independent, and ACEXPERTISE is Audit Committee Expertise. EXAREPUT is External Auditor Reputation, EXATENURE is External Audit Tenure, EXAOPIN is External Audit Opinion, and EXACHANG is External Audit Change. MANOWN is Managerial Shareholders, IOWNFOR is Institutional Shareholders Foreign, IOWNLOC is Institutional Shareholders Local, INDOWNF is Individual Foreign, INDOWNL is Individual Local, FAMOWN is Family Ownership, BLOCKOWN is Blockholders Ownership, and STATOWN is State Ownership. FSUB is Firm Subsidiary, FLVE is Financial Leverage, ROA is Firm Performance, and CFOA is Cash Flow from Operating Activities.
Notes: indicate significant at *** 0.001, ** 0.05, * 0.10

Appendices
325
GLS Regression Results for the PPY Model
WAPPY (N, 392) Exp Signe Coef. z P>z Board of Directors Characteristics
BSIZE - -0.001 -0.040 BMEETING - -0.005 -0.050 BOUTSIDE - -0.120 -0.360 BINDEPEND - 0.001 0.010
Audit Committee Characteristics ACSIZE - -0.015 -0.130 ACMEETING - -0.066 -0.710 ACINDEPEND - 0.189 1.560 ACEXPERTISE - 0.183 0.820
External Audit Factors EXAREPUT - -0.153 -1.120 EXATENURE + 0.053 0.430 EXAOPIN + -0.164 -0.960 EXACHANG - 0.147 0.850
Ownership Structures MANOWN - 0.414 1.710 * IOWNFOR - 0.231 0.720 IOWNLOC - -0.028 -0.470 INDOWNF + -0.559 -1.100 INDOWNL + -0.224 -3.660 *** FAMOWN - 0.046 0.170 BLOCKOWN - 0.025 0.140 STATOWN - -0.350 -0.570
Control Variables ROA + 1.014 1.740 * CFOA - -2.143 -4.310 *** FLVE + -1.521 -2.190 ** FSUB - -0.121 -0.810 Adj 𝑹𝑹𝟐𝟐 between Adj 𝑹𝑹𝟐𝟐 overall
𝟐𝟐𝟐𝟐% 𝟏𝟏𝟐𝟐%
Wild Chi2 𝟏𝟏𝟖𝟖∗∗ ACCSJ is Discretionary accruals (Standard Jones Model), ACCMJ is Discretionary accruals (Modified Jones Model), WAPPY is Working Capital Accruals, BSIZE is Board of Director Size, BMEETING is Number of the Board of Directors, BOUTSIDE is Board of Director Outsiders, and BINDEPEND is Board of Director Independent. ACSIZE is Audit Committee Size, ACMEETING is Number of Audit Committee Meetings, ACINDEPEND is Audit Committee Independent, and ACEXPERTISE is Audit Committee Expertise. EXAREPUT is External Auditor Reputation, EXATENURE is External Audit Tenure, EXAOPIN is External Audit Opinion, and EXACHANG is External Audit Change. MANOWN is Managerial Shareholders, IOWNFOR is Institutional Shareholders Foreign, IOWNLOC is Institutional Shareholders Local, INDOWNF is Individual Foreign, INDOWNL is Individual Local, FAMOWN is Family Ownership, BLOCKOWN is Blockholders Ownership, and STATOWN is State Ownership. FSUB is Firm Subsidiary, FLVE is Financial Leverage, ROA is Firm Performance, and CFOA is Cash Flow from Operating Activities.
Notes: indicate significant at *** 0.001, ** 0.05, * 0.10

Appendices
326
GLS Regression Results for the Discretionary Revenue Model (Gross Accounts Receivable)1
GAR (N, 336) Exp Signe Coef. z P>z Board of Directors Characteristics
BSIZE - -0.018 0.576 BMEETING - 0.139 0.191 BOUTSIDE - -0.002 0.980 BINDEPEND - 0.053 0.705
Audit Committee Characteristics ACSIZE - 0.018 0.897 ACMEETING - 0.000 0.998 ACINDEPEND - -0.006 0.964 ACEXPERTISE - -0.080 0.754
External Audit Factors EXAREPUT - 0.026 0.863 EXATENURE + 0.114 0.441 EXAOPIN + 0.171 0.399 EXACHANG - 0.508 0.014 **
Ownership Structures MANOWN - -0.057 0.834 IOWNFOR - -0.075 0.835 IOWNLOC - 0.009 0.890 INDOWNF + 0.400 0.474 INDOWNL + -0.125 0.757 FAMOWN - 0.006 0.985 BLOCKOWN - 0.133 0.516 STATOWN - 0.028 0.968
Control Variables ROA + -0.729 0.311 CFOA - 0.762 0.198 FLVE + 0.373 0.661 FSUB - -0.067 0.699 Adj 𝑹𝑹𝟐𝟐 between Adj 𝑹𝑹𝟐𝟐 overall
𝟕𝟕.𝟏𝟏% 𝟏𝟏.𝟖𝟖%
Wild Chi2 𝟏𝟏𝟐𝟐.𝟓𝟓𝟐𝟐 ACCSJ is Discretionary accruals (Standard Jones Model), ACCMJ is Discretionary accruals (Modified Jones Model), WAPPY is Working Capital Accruals, BSIZE is Board of Director Size, BMEETING is Number of the Board of Directors, BOUTSIDE is Board of Director Outsiders, and BINDEPEND is Board of Director Independent. ACSIZE is Audit Committee Size, ACMEETING is Number of Audit Committee Meetings, ACINDEPEND is Audit Committee Independent, and ACEXPERTISE is Audit Committee Expertise. EXAREPUT is External Auditor Reputation, EXATENURE is External Audit Tenure, EXAOPIN is External Audit Opinion, and EXACHANG is External Audit Change. MANOWN is Managerial Shareholders, IOWNFOR is Institutional Shareholders Foreign, IOWNLOC is Institutional Shareholders Local, INDOWNF is Individual Foreign, INDOWNL is Individual Local, FAMOWN is Family Ownership, BLOCKOWN is Blockholders Ownership, and STATOWN is State Ownership. FSUB is Firm Subsidiary, FLVE is Financial Leverage, ROA is Firm Performance, and CFOA is Cash Flow from Operating Activities.
Notes: indicate significant at *** 0.001, ** 0.05, * 0.10
1 This regression showed the weak results among corporate governance models (SJ, MJ, PPY, and discretionary revenue models).

Appendices
327
10.5 Appendix (5) Model Specification Tests
SJ Model
.
_cons -.1019887 .0176061 -5.79 0.000 -.1366514 -.067326 _hatsq 3.718978 .2554299 14.56 0.000 3.216091 4.221866 _hat -.4261994 .1470732 -2.90 0.004 -.7157555 -.1366434 TAA1 Coef. Std. Err. t P>|t| [95% Conf. Interval]
Total 39.6940882 272 .145934148 Root MSE = .26501 Adj R-squared = 0.5188 Residual 18.9616785 270 .070228439 R-squared = 0.5223 Model 20.7324097 2 10.3662048 Prob > F = 0.0000 F( 2, 270) = 147.61 Source SS df MS Number of obs = 273
. linktest
PPEA1 -.132111 .0280568 -4.71 0.000 -.1873489 -.0768731 REVA1 .1571627 .0920304 1.71 0.089 -.0240256 .3383511 A1 587.6166 90.06349 6.52 0.000 410.3006 764.9326 TAA1 Coef. Std. Err. t P>|t| [95% Conf. Interval]
Total 39.7545581 273 .145621092 Root MSE = .35407 Adj R-squared = 0.1391 Residual 33.8491636 270 .125367273 R-squared = 0.1485 Model 5.9053945 3 1.96846483 Prob > F = 0.0000 F( 3, 270) = 15.70 Source SS df MS Number of obs = 273
. regress TAA1 A1 REVA1 PPEA1, noconstant

Appendices
328
MJ Model
PPY Model
_cons -.042291 .0085873 -4.92 0.000 -.0591977 -.0253844 _hatsq .3074277 .0138268 22.23 0.000 .2802055 .3346498 _hat .0640524 .0503701 1.27 0.205 -.0351158 .1632205 TAA1 Coef. Std. Err. t P>|t| [95% Conf. Interval]
Total 39.6940882 272 .145934148 Root MSE = .13851 Adj R-squared = 0.8685 Residual 5.17974361 270 .019184236 R-squared = 0.8695 Model 34.5143446 2 17.2571723 Prob > F = 0.0000 F( 2, 270) = 899.55 Source SS df MS Number of obs = 273
. linktest
PPEA1 -.0289488 .018861 -1.53 0.126 -.0660822 .0081847 REVARA1 -.7185316 .0378719 -18.97 0.000 -.7930935 -.6439697 A1 12.24712 65.94668 0.19 0.853 -117.588 142.0822 TAA1 Coef. Std. Err. t P>|t| [95% Conf. Interval]
Total 39.7545581 273 .145621092 Root MSE = .23305 Adj R-squared = 0.6270 Residual 14.6643633 270 .054312457 R-squared = 0.6311 Model 25.0901948 3 8.36339827 Prob > F = 0.0000 F( 3, 270) = 153.99 Source SS df MS Number of obs = 273
. regress TAA1 A1 REVARA1 PPEA1, noconstant
_cons -237.151 217.967 -1.09 0.277 -665.6919 191.3899 _hatsq 1.31e-07 3.13e-07 0.42 0.675 -4.84e-07 7.47e-07 _hat .9926501 .0340374 29.16 0.000 .9257299 1.05957 WCA Coef. Std. Err. t P>|t| [95% Conf. Interval]
Total 4.4432e+10 391 113635797 Root MSE = 4269.6 Adj R-squared = 0.8396 Residual 7.0911e+09 389 18229087 R-squared = 0.8404 Model 3.7340e+10 2 1.8670e+10 Prob > F = 0.0000 F( 2, 389) = 1024.20 Source SS df MS Number of obs = 392
. linktest
CR -.9681847 .0247004 -39.20 0.000 -1.016747 -.919622 AD .9986677 .0244401 40.86 0.000 .9506168 1.046719 WCA Coef. Std. Err. t P>|t| [95% Conf. Interval]
Total 4.4968e+10 392 114715168 Root MSE = 4271.7 Adj R-squared = 0.8409 Residual 7.1164e+09 390 18247139.7 R-squared = 0.8417 Model 3.7852e+10 2 1.8926e+10 Prob > F = 0.0000 F( 2, 390) = 1037.20 Source SS df MS Number of obs = 392
. regress WCA AD CR, noconstant

Appendices
329
Discretionary Revenue Model (Gross Accounts Receivable)
_cons -.2856277 .2286162 -1.25 0.212 -.7353617 .1641062
_hatsq .0364372 .0044603 8.17 0.000 .0276628 .0452115
_hat 1.214924 .0908335 13.38 0.000 1.036236 1.393611
GR Coef. Std. Err. t P>|t| [95% Conf. Interval]
Total 8903.30585 331 26.898205 Root MSE = 4.1062
Adj R-squared = 0.3731
Residual 5547.32854 329 16.861181 R-squared = 0.3769
Model 3355.97731 2 1677.98866 Prob > F = 0.0000
F( 2, 329) = 99.52
Source SS df MS Number of obs = 332
. linktest
_cons .0951255 .2479373 0.38 0.701 -.3926225 .5828734
P .0402324 .0085996 4.68 0.000 .023315 .0571497
S .0889446 .0118625 7.50 0.000 .0656084 .1122808
A1 -83.77873 12.73506 -6.58 0.000 -108.8314 -58.72603
GR Coef. Std. Err. t P>|t| [95% Conf. Interval]
Total 8903.30585 331 26.898205 Root MSE = 4.5103
Adj R-squared = 0.2437
Residual 6672.56188 328 20.3431765 R-squared = 0.2506
Model 2230.74397 3 743.581323 Prob > F = 0.0000
F( 3, 328) = 36.55
Source SS df MS Number of obs = 332
. regress GR A1 S P