earnings management in family firms ear050512 v3 and real... · accounting and real earnings...
TRANSCRIPT

ACCOUNTING AND REAL EARNINGS MANAGEMENT
IN FAMILY FIRMS
Ann-Kristin Achleitner
Center for Entrepreneurial and Financial Studies (CEFS) Technische Universität München
Nina Fichtl Center for Entrepreneurial and Financial Studies (CEFS)
Technische Universität München [email protected]
Christoph Kaserer*
Center for Entrepreneurial and Financial Studies (CEFS) Technische Universität München
*Corresponding Author Center for Entrepreneurial and Financial Studies (CEFS)
TUM School of Management │ Technische Universität München Arcisstr. 21 │ 80333 München
Tel: + 49 (0)89 289 – 25489 │ Fax: + 49 (0)89 289 – 25488
Accounting and Real Earnings Management in Family Firms
ABSTRACT
This paper starts from the presumption that firms follow multiple earnings management
strategies simultaneously, i.e. they engage in accounting (AEM) and real earnings
management (REM) at the same time. We hypothesize that the outcome of this trade-off is
driven by earnings management motives influenced by the ownership structure of the firm and
the institutional environment. In order to test this hypothesis, we use a large hand-collected
panel data set of listed German firms over the period 1998 to 2008. Specifically, we test the
hypothesis that firms owned by their founding families should engage more in AEM and less
in REM activities as compared to their non-family counterparts. In a nutshell, this is because
at the one side control motives are a strong driver for AEM in family firms, whereas at the
other side, family shareholders tend to dislike REM because of its negative performance
impact. Our results clearly support this hypothesis, even when we control for a potential
selection bias.
JEL Classification: G32, M4, M41, M48
Keywords: family firms, accounting earnings management, real earnings management,
earnings quality, ownership structures, Germany.

2
1. Introduction
In this paper we scrutinize the trade-off between accounting earnings management (AEM)
and real earnings management (REM). It is agreed in the literature that AEM refers to the
way in which the discretion granted by accounting standards is exploited, whereas REM
affects the timing and structuring of business activities. Hitherto, the overwhelming part of
the literature focuses on drivers of AEM (for surveys cf. e.g. Healy and Wahlen, 1999;
Armstrong et al., 2010, Kothari et al., 2010). Some recent papers investigate drivers of
REM (e.g. Gunny 2010; Roychowdhury, 2006), whereby only very few papers take an
integrated view by looking at both earnings management mechanisms simultaneously
(Cohen et al., 2008; Cohen and Zarowin 2010; Zang, 2012). However, such an integrated
view is a prerequisite for understanding earnings manipulation, as these papers point out
that firms engage in multiple earnings management strategies at the same time. Such an
understanding is important for any discussion about accounting choices and enforcement.
In this paper we make a contribution to this strand of literature by scrutinizing the impact
of ownership structures on both AEM as well as REM. More specifically, we hypothesize
that by taking the specific benefits of earnings manipulation as well as the incentive
structures governing the firms into account, closely-held firms should be less inclined to
use REM, but more inclined to use AEM as compared to widely-held firms. We test this
hypothesis by analyzing earnings management in family-owned firms.
Our hypothesis is based on two pillars. First, we follow Cohen and Zarowin (2010) and
Zang (2012) in pointing out that the choice between AEM and REM is, among others,
determined by the specific motivation that is pursued. Such motivation for earnings
management can be related to (i) meeting capital market expectations, (ii) influencing

3
management compensation, (iii) avoiding the breach of debt covenants or (iv) influencing
payout levels. While for motives (iii) and (iv) no direct preference for either AEM or REM
arises (as long as the costs of these instruments are not taken into account), a management
pursuing motivations (i) or (ii) might prefer REM over AEM. This is because as far as
earnings smoothing is concerned, it could be argued that the capital market, e.g. financial
analysts, is able to look behind the veil of financial accounting policy. For example,
Graham et al. (2005) report that 80% of surveyed managers would decrease discretionary
spending on R&D or maintenance in order to meet formerly published earnings targets.
Moreover, to the extent that these REM actions have an impact on the stock price, REM is
also an instrument to influence stock-based compensation in the short-term.
Actually, both family and non-family firms are interested in earnings management.
However, the underlying motives are quite different. While in widely-held firms earnings
management is mostly driven by the desire to smooth earnings and to influence
management compensation, the dominant motive in family-owned firms is to stay in
control of the company, i.e. to avoid the breach of covenant clauses (Prencipe et al., 2008),
and to pay smooth dividends (Schmid et al., 2010). Hence, from the benefit side family-
owned firms are, at best, indifferent between AEM and REM, while non-family firms may
have a clear preference for REM.
Second, for getting the whole picture about the trade-off between AEM and REM also the
costs of these two instruments have to be taken into account (Zang, 2012). While AEM is
based on pure accounting choices and, therefore, has no cash flow consequences, this does
not hold to be true for REM. By definition, REM implies a deviation from normal business
practices with the goal to avoid the reporting of a loss or to smooth earnings.
4
Roychowdhury (2006) shows that this effect is obtained by boosting earnings through
increased price discounts, overproduction in order to allocate less overhead costs to the
cost of goods sold and aggressively reducing discretionary expenses such as R&D,
advertising and SG&A expenses. Therefore, it is not surprising , that REM has a negative
impact on future performance (Gunny, 2010). As a consequence, the propensity to use
REM instead of AEM is related to the degree of interest alignment between shareholders
and management.
Therefore, from the cost side perspective we would expect closely-held firms, e.g. family
firms, to prefer AEM over REM as in these firms a stronger alignment between the interest
of shareholders and managers can be assumed. For firms with atomistic shareholder
structures this alignment may be less effective so that the negative performance
consequences of REM are given a lower weight.
The results presented in this paper clearly support our hypothesis that family firms are less
inclined to use REM, but more inclined to use AEM as compared to widely-held firms.
More specifically, our findings can be summarized as follows. First, while all firms use
AEM as well as REM simultaneously, there is strong evidence that family-owned firms use
more AEM and less REM compared to their non-family counterparts. Second, this result is
not driven by family management, i.e. the fact that members of the founding family hold
positions in the board. This is what we would expect according to our theoretical
reasoning, as the motives for earnings management are related to the position of the
founding family as a blockholder in the company. Third, this reasoning is further supported
by the fact that we also find non-family firms with significant insider ownership to rely
5
more heavily on AEM. It should be noted that the results are robust against a potential self-
selection bias.
The paper contributes to the literature along several dimensions. First, while accounting
earnings management in family firms has been addressed by previous research (e.g. Wang,
2006; Ali et al,. 2007; Prencipe et al., 2008; Tong, 2007, Jaggi et al., 2009; Bar-Yosef and
Prencipe, 2011), this paper to the best of our best knowledge studies the effects of family
involvement on the trade-off between AEM and REM for the first time. Second, the paper
corroborates former studies indicating that control considerations are an important motive
for earnings management in family firms (Prencipe et al., 2008; Bar-Yosef and Prencipe,
2011). In this sense, it raises some doubts against other studies concluding that because of
higher interest alignment earnings quality is superior in family firms (Wang, 2006).
Without taking into account the trade-off between AEM and REM, it is quite difficult to
get a complete picture about earnings management activities in family firms.
Fourth, the paper offers a potential explanation why evidence on AEM in family firms
hitherto is mixed. While evidence on US and UK firms commonly suggests that family and
managerial ownership is negatively associated with accounting earnings management
(Warfield et al., 1995; Peasnell et al., 2005; Wang, 2006; Ali et al., 2007; Tong, 2007),
results on European and Asian firms indicate that family influence increases the level of
accounting earnings management (Gabrielsen et al., 2002; Jara-Bertin and Lopez Iturriaga,
2008; Jaggi et al., 2009). If the trade-off between AEM and REM depends, among others,
on ownership structures and the institutional framework, the optimal choice between AEM
and REM is likely to differ across countries.

6
Third, beyond the family-firm literature, we also add some evidence to the literature on the
interaction between AEM and REM, especially because we relate this trade-off to
ownership structures. This issue has not yet been scrutinized in the literature (Cohen and
Zarowin, 2010; Zang, 2012).
The rest of the paper is organized as follows. Section 2 develops the theoretical framework
and discusses related literature. Section 3 presents the empirical models, while section 4
reports the sample and descriptive statistics. Results of the analyses are presented in
section 5. Section 6 concludes the paper and points out to avenues for future research.
2. Related Literature and Hypotheses
Earnings management can be defined as “a purposeful intervention in the external financial
reporting process, with the intent of obtaining some private gain.” (Schipper, 1989: 92).
Thereby, earnings management comprises AEM and REM. While the former is the
outcome of accounting choices, the latter results from cash flow choices including
operating, financing and investment decisions (e.g. Schipper, 1989; Roychowdury, 2006;
Dechow and Skinner, 2000). Typical examples for REM activities include the deferral of
discretionary expenses such as marketing or R&D expenses (e.g. Baber et al., 1991;
Dechow and Sloan, 1991; Holthausen et al., 1995; Bushee, 1998; Bens et al., 2003), the
sale of profitable assets or timing of income recognition from the disposal of a long-lived
asset (Bartov 1993; Herrmann et al., 2003), inventory management (e.g. Hunt et al., 1996;
Thomas and Zhang, 2002) or the cutting of prices to boost sales in the current period and
other means to accelerate sales (Jackson and Wilcox, 2000).
It is agreed in the theoretical and empirical literature that AEM and REM are complements
rather than substitutes (Ewert and Wagenhofer, 2005; Cohen and Zarowin, 2010; Zang,

7
2012). Therefore, there is a trade-off between the two instruments the outcome of which
depends on the associated benefits and costs. This trade-off most likely depends on the
ownership structure of a company. Actually, given that the family is concerned about the
longevity of the firm, family firms are presumed to be less subject to managerial myopia
and more inclined to invest into positive NPV projects rather than boost current earnings
by engaging in risky projects (James, 1999). Hence, there is more interest alignment
between the shareholders and the management in a family-owned firm as compared to
widely-held firms. The long-term investment horizon of family shareholders reduces the
capital market pressure to meet short-term earnings targets such as analyst or management
forecasts (Graham et al., 2005).
While the alignment of interests is considered to reduce the level of earnings management,
family firms could exhibit higher levels of earnings management due to conflicts between
family and minority shareholders. Previous studies argue that family firms may ‘mask’
performance to conceal expropriation of minority shareholders (Leuz et al., 2003; Wang,
2006; Jara-Bertin and Lopez Iturriaga 2008; Jaggi et al., 2009). Moreover, long-term
orientation does not only mitigate agency costs arising from short-termism but also results
in the wish to maintain a controlling position in the firm and risk aversion. Family firms
could have incentives to engage in earnings management in order to conceal ‘true’
economic performance with the purpose of defending financial and non-financial private
benefits of control from owning the company.
Two important goals pursued by the family blockholder should be mentioned in this
context. First, family firms could make use of accounting policy discretion to meet debt-
related earnings targets, i.e. debt covenants (Prencipe et al., 2008). Second, it should not be
8
forgotten that families often have an interest to smooth earnings in order to smooth
dividend payouts (Kasanen et al., 1996; García Lara et al., 2005; Schmid et al., 2010).
However, these family-specific goals can be pursued by pure AEM. There is not so much
need to engage in REM, especially since the latter is associated with negative performance
consequences (Gunny, 2010). Indeed, family firms as long-term investors may have lower
incentives to sacrifice firm value to meet short-term earnings targets (Hutton, 2007;
Salvato and Moores, 2010). As opposed to that, the management in a widely-held firm may
engage in REM rather than AEM because the latter is more easily detected by the market.
In fact, financial analysts at least to some extent may be able to look behind the veil of
financial accounting policy (Graham et al., 2005). As managers are considered to have
strong incentives to manage earnings for compensation and reputation purposes (e.g.
(Healy, 1985; Holthausen et al., 1995; Bergstresser and Philippon 2006), they would use
REM instead of AEM instruments.
Because of these interacting effects between AEM and REM, it is not surprising that
previous evidence on AEM in family firms is mixed. While evidence on US and UK firms
commonly suggests that family and managerial ownership is negatively associated with
accounting earnings management (Dhaliwal et al., 1982; Warfield et al., 1995; Peasnell et
al., 2005; Wang, 2006; Ali et al., 2007; Tong, 2007), results on European and Asian firms
indicate that insider ownership and family influence tend to increase the level of
accounting earnings management (Gabrielsen et al. 2002; Jara-Bertin and Lopez Iturriaga,
2008; Jaggi et al., 2009).
According to our main hypothesis these differences can be well explained by differences in
the institutional framework and in the level of family ownership. The outcome of the trade-

9
off between AEM and REM is driven by two mechanisms. First, the level of family
ownership is relevant as it determines the degree of interest alignment. As ownership
structures in Asian and European countries tend to be more concentrated as compared to
the US or the UK we expect, on the margin, AEM to be less attractive relative to REM in
the latter countries as compared to the former ones. It should be noted that the level of
family ownership in our sample is 36% as compared to an average of 10% in the sample of
S&P 500 firms in Wang (2006).
Second, investor protection rights should set a limit to the degree of AEM put in place by
the management. In fact, as far as AEM is concerned, it is well known that it is confined by
the level of investor protection (Ball et al., 2000, 2003; Leuz et al., 2003). Therefore, we
can expect that this influences the level of REM. As a consequence, it could be that in
countries with higher investor protection rights, the management of widely-held firms has
less discretion in implementing AEM making REM relatively more attractive.
As an additional aspect, Wang (2006) points out that there could be a non-linear
relationship between family ownership and AEM. Incentives to manage earnings in family
firms are likely to change with the level of ownership. Previous studies point out that
incentives to defend private benefits of control are particularly pronounced at medium
levels of managerial or family ownership (Morck et al., 1988; Himmelberg et al., 1999;
Anderson and Reeb, 2003). We are able to observe a high heterogeneity regarding the level
of family ownership in our sample of German listed firms and test if there is a non-linear
relationship between family ownership and earnings management.
Family members have different possibilities to influence earnings depending on whether
they only act as shareholders or are involved in the board. Germany is characterized by a

10
two-tier board structure. Compared to unitary board systems, dual board systems separate
distinctly between the management and the supervision of a company. We take this effect
into account by analyzing the impact of family ownership and the impact of family
management separately. According to our reasoning family ownership should be the
driving factor for AEM. However, it may well be that control incentives are more
pronounced in those firms where the family is also active in the management. Therefore, it
will be interesting to see whether the existence of a family-CEO has an additional impact
on AEM activities.
To sum up, the main hypotheses tested in our paper are as follows:
(i) By taking the specific benefits of earnings manipulation as well as
differences in the incentive structures into account, family-owned firms
should be less inclined to use REM, but more inclined to use AEM as
compared to widely-held firms. This should at least hold to be true in a
German corporate governance context with relatively weak investor
protection rights.
(ii) Earnings management activities in family firms should be driven by family
ownership and not by family management.
(iii) While we have no clear prediction as far as the impact of the ownership
level on the degree of AEM is concerned, we expect REM to be the lower
the larger the ownership stake of the family is.
(iv) We expect family firms where the founder is appointed as the CEO to
engage in more AEM because of the long-term control motive of the
founder.

11
3. Research Design
3.1 Measurement of Family Involvement
The family firm definition used in this study follows the founding family concept used in
the literature (Anderson and Reeb, 2003). Accordingly, firms classify as family firms when
the founder or a member of his/her family by either blood or marriage serve as directors in
the management and/or supervisory board or act as blockholder, either individually or as a
group (Villalonga and Amit, 2006). In order to account for the more concentrated
ownership, studies related to the German capital market set the threshold for a family
blockholding at 25% of voting rights (Andres, 2008; Ampenberger et al., 2012). In this
study we follow this approach. It should also be noted that according to the German Stock
Corporation Act, important corporate decisions can be blocked with 25% of the voting
rights.
According to this definition, we use the dichotomous variable Dummy_FF indicating
whether a specific firm is a family or non-family firm. However, we also use other proxies
measuring family involvement. Family ownership FF_OWN corresponds to the percentage
of common shares controlled by the founding family, while FMB is a dummy variable
which indicates the presence of the founding family in the management board. Moreover,
in order to analyze the role of the CEO, we include the following indicator variables in the
regression model: a dummy variable indicating whether the CEO is a founder of the
company (F_CEO), a descendant of the founding family (D_CEO), or an outside hired
CEO (H_CEO). The presence of a founding family member as a chairman in the
supervisory board is indicated by the dummy variable FF_Chair.
12
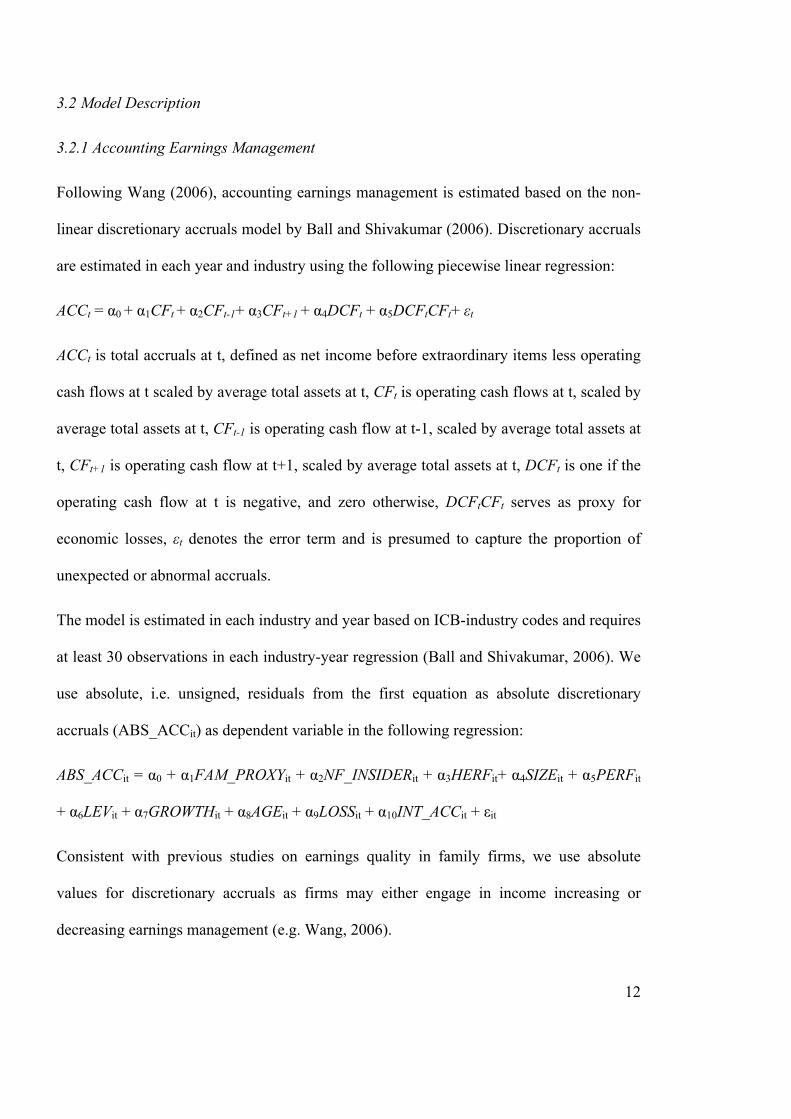
3.2 Model Description
3.2.1 Accounting Earnings Management
Following Wang (2006), accounting earnings management is estimated based on the non-
linear discretionary accruals model by Ball and Shivakumar (2006). Discretionary accruals
are estimated in each year and industry using the following piecewise linear regression:
ACCt = α0 + α1CFt + α2CFt-1+ α3CFt+1 + α4DCFt + α5DCFtCFt+ εt
ACCt is total accruals at t, defined as net income before extraordinary items less operating
cash flows at t scaled by average total assets at t, CFt is operating cash flows at t, scaled by
average total assets at t, CFt-1 is operating cash flow at t-1, scaled by average total assets at
t, CFt+1 is operating cash flow at t+1, scaled by average total assets at t, DCFt is one if the
operating cash flow at t is negative, and zero otherwise, DCFtCFt serves as proxy for
economic losses, εt denotes the error term and is presumed to capture the proportion of
unexpected or abnormal accruals.
The model is estimated in each industry and year based on ICB-industry codes and requires
at least 30 observations in each industry-year regression (Ball and Shivakumar, 2006). We
use absolute, i.e. unsigned, residuals from the first equation as absolute discretionary
accruals (ABS_ACCit) as dependent variable in the following regression:
ABS_ACCit = α0 + α1FAM_PROXYit + α2NF_INSIDERit + α3HERFit+ α4SIZEit + α5PERFit
+ α6LEVit + α7GROWTHit + α8AGEit + α9LOSSit + α10INT_ACCit + εit
Consistent with previous studies on earnings quality in family firms, we use absolute
values for discretionary accruals as firms may either engage in income increasing or
decreasing earnings management (e.g. Wang, 2006).

13
The experimental variable FAM_PROXY denotes the variables that proxy for family
involvement as explained above. Following Wang (2006) and other prior literature, the
following control variables are included in the model: firm size (SIZE) measured as natural
logarithm of total assets, profitability (PERF) measured as net income scaled by average
total assets, leverage (LEV) defined as debt to total assets, a dummy variable that indicates
if the firm exhibits a loss in the observation period (LOSS), growth (GROWTH) measured
as sales growth and age (AGE) measured as observation year less founding year.
Our observation period covers the years 1998 to 2008 and is hence characterized by the
internationalization of accounting standards in Germany. To control for differences in the
accounting standard applied, we include a dummy variable INT_ACC in our analysis that
equals one if international accounting standards (IFRS or US GAAP) are applied in the
respective observation period and zero if financial statements are prepared according to
German GAAP.
We differentiate between effects of family ownership and ownership concentration by
including the Herfindahl index (HERF) for ownership concentration. Furthermore, non-
family insider ownership (NF_INSIDER) is added as a control variable to examine if
effects are due to insider or family ownership (Wang, 2006).
3.2.2 Real Earnings Management
Following Roychowdhury (2006), we use discretionary cash flows to analyze effects of
family ownership and management on real earnings management.
Discretionary cash flows are presumed to result from sales manipulation. Managers may be
tempted to temporarily increase sales. Increased sales from price discounts are presumed to
vanish when the firm returns to its old prices. As a consequence, the cash inflow per sale

14
net of price discount is lower because margins decrease. Roychowdhury (2006) expects
that sales management activities are reflected in lower current period cash flows from
operations and higher production costs as compared to levels common for the respective
sales level.
The estimation model for discretionary cash flows is expressed by the following regression
equation:
CFOt/At-1=α0 + α1 (1/At-1) + α2 (St/At-1) + α3 (ΔSt /At-1) + εt
All variables used in the model are scaled by lagged total assets (At-1). CFOt is cash flows
from operating activities in t, St is sales in t, ΔSt is change in sales from t-1 to t. The
regression is run cross-sectionally for each industry and year with a minimum of 15
observations per industry-year based on ICB codes. The residuals are presumed to capture
the amount of discretionary cash flows (Discr_CF). Higher levels of discretionary cash
flows are interpreted as lower levels of real earnings management.
Effects of family influence on discretionary cash flows are examined based on the
following regression model:
Discr_CFit = α0 + α1FAM_PROXYit + α2NF_INSIDERit + α3HERFit+ α4SIZEit + α5PERFi +
α6LEVit + α7GROWTHit + α8AGEit + α9LOSSit + α10INT_ACCit + εit
Experimental and control variables in the models on real earnings management are as
defined in our models on accounting earnings management. All models are calculated
based on pooled OLS and between effects models.

15
4. Data and Descriptive Statistics
4.1 Sample Selection
Our sample covers eleven years of panel data for the period from 1998 to 2008. We start
our sample selection process by identifying all German corporations whose common stock
is listed in the CDAX in the respective year. In this way, we get 7,642 firm-year
observations. The CDAX corresponds to the market segment that comprises the EU
regulated market of the German stock exchange. We eliminate observations of financial
firms based on the ICB industry classification in Thomson Financial Datastream.
Observations are only included if full information regarding the founder, ownership
structures and/or board structures as well as the accounting standard applied in the
respective year is available. Outliers are eliminated based on the top and bottom 1%-
percentile. Based on this sampling procedure, we include 4,937 firm-year observations of
non-financial firms (708 cross-sections) in our analysis (2,335 observations for family
firms and 2,602 observations for non-family firms).
Data on ownership and board structures is derived from Hoppenstedt Aktienführer which
publishes annual data on ownership structures of listed German firms. This information is
verified using several further databases including Bureau van Dijk’s Amadeus database,
Commerzbank’s Wer gehört zu wem, the director dealings database of the Bundesanstalt
für Finanzdienstleistungsaufsicht (BaFin) and web research. Data on the founder is derived
from Hoover’s Online Profile, Factiva, LexisNexis as well as web-based research.
Accounting data comes from the Worldscope database. Data on accounting standards is
verified by hand using annual reports of the respective observation year.
16
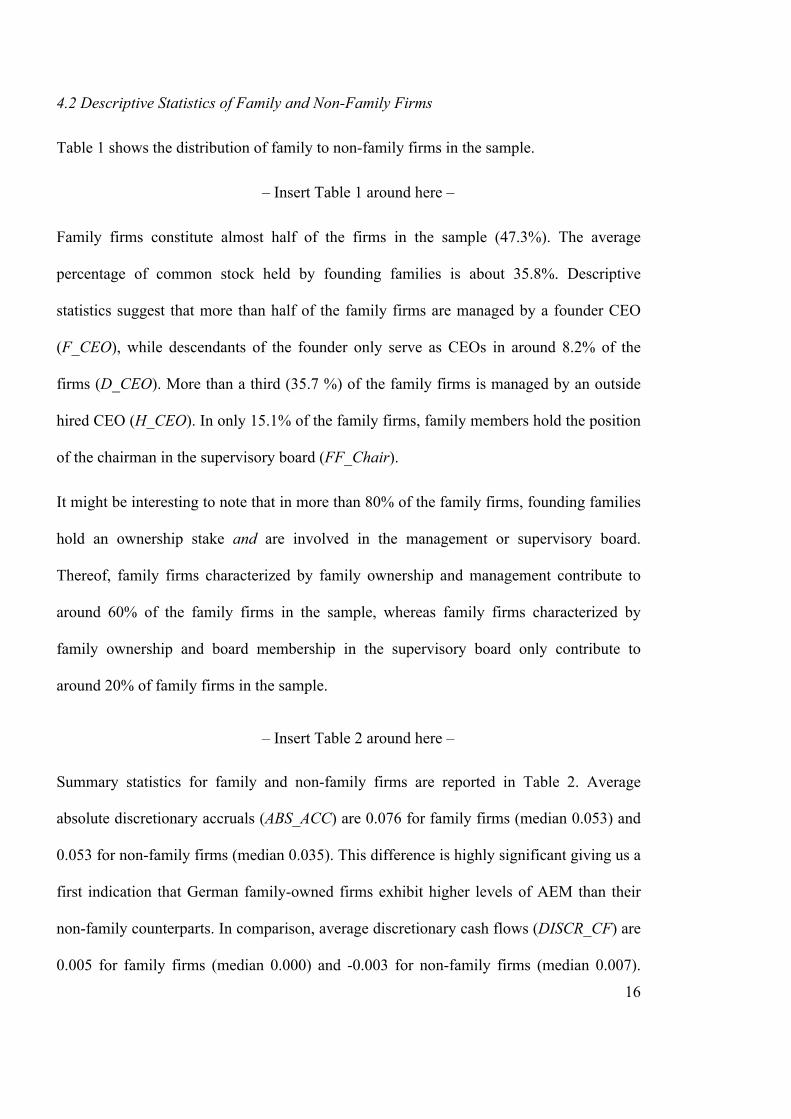
4.2 Descriptive Statistics of Family and Non-Family Firms
Table 1 shows the distribution of family to non-family firms in the sample.
– Insert Table 1 around here –
Family firms constitute almost half of the firms in the sample (47.3%). The average
percentage of common stock held by founding families is about 35.8%. Descriptive
statistics suggest that more than half of the family firms are managed by a founder CEO
(F_CEO), while descendants of the founder only serve as CEOs in around 8.2% of the
firms (D_CEO). More than a third (35.7 %) of the family firms is managed by an outside
hired CEO (H_CEO). In only 15.1% of the family firms, family members hold the position
of the chairman in the supervisory board (FF_Chair).
It might be interesting to note that in more than 80% of the family firms, founding families
hold an ownership stake and are involved in the management or supervisory board.
Thereof, family firms characterized by family ownership and management contribute to
around 60% of the family firms in the sample, whereas family firms characterized by
family ownership and board membership in the supervisory board only contribute to
around 20% of family firms in the sample.
– Insert Table 2 around here –
Summary statistics for family and non-family firms are reported in Table 2. Average
absolute discretionary accruals (ABS_ACC) are 0.076 for family firms (median 0.053) and
0.053 for non-family firms (median 0.035). This difference is highly significant giving us a
first indication that German family-owned firms exhibit higher levels of AEM than their
non-family counterparts. In comparison, average discretionary cash flows (DISCR_CF) are
0.005 for family firms (median 0.000) and -0.003 for non-family firms (median 0.007).

17
Even though this difference is only weakly significant, it nevertheless is in line with our
hypothesis that non-family firms engage more actively in REM than family firms. It should
be noted that the level of REM decreases in discretionary cash flows.
Results emerging from Table 2 indicate that family firms tend to be significantly smaller in
terms of total assets (SIZE). They exhibit lower return on assets (PERF) and leverage
(LEV). Family firms appear to have higher sales growth (GROWTH) than non-family
firms. Consistent with lower ownership concentration in family firms than in non-family
firms (HERF), untabulated statistics indicate that large block holdings of non-family
insiders, financial investors or other shareholder groups can be found more frequently in
non-family than in family firms. This evidence indicates that founding families tend to be
the dominant shareholder in listed family firms in Germany.
Descriptive statistics on the industry distribution are displayed in Table 3 and show that
family firms are represented in all industries among German listed firms but are
particularly concentrated in the health care, the consumer services, the telecommunication
and the technology industry.
– Insert Table 3 around here –
Pearson correlation coefficients between the variables used in the analysis are displayed in
Table 4. Abnormal accruals (ABS_ACC) are significantly negatively correlated with
discretionary cash flows (DISCR_CF). This relation can possibly be explained by the fact
that firms engage in accounting and real earnings management at the same time, i.e. they
use multiple earnings management strategies. This is consistent with the results in
Roychowdhury (2006).
– Insert Table 4 around here –

18
5. Results
5.1 Family Firms and Accounting Earnings Management
Table 5 shows the results from the pooled ordinary least squares (OLS) regression on
accounting earnings management with absolute abnormal discretionary accruals
(ABS_ACC) as dependent variable. Results from the pooled OLS regression are consistent
with results from between effects models which are therefore not tabulated.
– Insert Table 5 around here –
First of all, all model specifications indicate that family firms have significantly higher
levels of discretionary accruals than non-family firms, regardless how family involvement
is measured. Moreover, model 3 suggests that family ownership – not family management
– is the main driver of AEM in family firms. The coefficient on family ownership
(FF_OWN) is much more relevant than the coefficient on family board management
(FMB) from a statistical as well as an economic point of view. This corroborates our
hypothesis that the private interests of the founding family are driving the AEM activities.
In line with this result, we find in model 4 that AEM is particularly prevalent in family
firms where either the founder or an external manager is appointed as the CEO (F_CEO,
H_CEO). As far as the founding CEO is concerned, this is not surprising as the motives for
earnings management, especially to stay in control of the firm, may be strongly developed
also in this case. Moreover, the founding CEO may also be driven by socio-emotional
factors arising from being in control of the firm (Stockmans et al., 2010).
What is probably more intriguing is the fact that also externally hired CEOs engage
strongly in AEM, if they are hired by a family firm. However, our primary hypothesis also
delivers an explanation for that. The externally hired CEO, similarly to the CEO in a

19
widely-held firm, has an incentive to influence his compensation by earnings management
activities. However, as opposed to the widely-held firm, where REM may be a preferred
instrument for doing that, in the family-owned firm there may be strong limits set to such
REM activities because of the tight control exercised by the family. Therefore, the
externally hired CEO in a family firm has a different trade-off rate between AEM and
REM as the CEO in a widely-held firm leading him to engage more in AEM. As an
additional explanation one should take into account that variable compensation in family
firms tends to be rather accounting than stock based as compared to non-family firms
(Cheng and Firth, 2006; Young and Tsai, 2008; Gomez-Mejia et al., 2003). Therefore,
there is an additional incentive for the external manager to prefer AEM over REM.
The coefficient on ownership concentration (HERF) is negative and significant in models 2
and 3. This result may indicate that earnings management on average decreases with
increasing ownership concentration. One explanation might be that the existence of other
large shareholders sets a limit to the AEM activities, which is in line with our reasoning
that the degree of earnings management is confined by the degree of corporate control.
To assess the robustness of our results on AEM, we use the model applied by DeFond and
Jiambalvo (1994), Kasznik (1999) and Cohen and Zarowin (2010) among others to
estimate discretionary accruals. Since this alternative measure produces consistent results
with the Ball and Shivakumar (2006) model, results are not tabulated.
5.2 Family Firms and Real Earnings Management
Consistent with the analysis on accounting earnings management, four models are
examined to analyze effects of founding family involvement on real earnings management
based on pooled OLS and between effects models. The results in Table 6 are from the

20
pooled OLS regressions. Results are largely consistent with results derived from the
between effects models which are therefore not tabulated.
– Insert Table 6 around here –
According to the results presented in Table 6 we find some indication that REM is less
pronounced in family firms. Regardless of the model specification, coefficients are positive
indicating that there is a lower level of REM in family-owned firms. However, one has to
admit that from a statistical point of view the evidence is rather weak, as only in three
models the coefficients are statistically significant. Two of these three significant
coefficients measure family ownership, which corroborates our reasoning that family
ownership has a dampening impact on REM. The third coefficient relates to the
appointment of an externally hired CEO. As already explained in the preceding section, we
expect that such an externally hired CEO should have an incentive to engage in AEM
rather than in REM. However, by splitting up the impact into family ownership and family
management variables, we do not get any significant results.
As an alternative measure for real earnings management, we use discretionary expenses.
Results are consistent with those presented in Table 6 and indicate that REM is
significantly lower in family firms. Due to limited space, results are not tabulated.
5.3 Additional Analyses
5.3.1 Earnings Management and Self-Selection Bias
Two objections against our results could be raised. First, one could argue that AEM and
REM should be analyzed in an integrated framework as it has been presumed that firms are
using both instruments simultaneously. Second, and more importantly, it may well be that
firms self-select into the group of family or non-family firms. As has already been shown

21
in Table 3 the industry distribution of family firms is quite different from the distribution
of non-family firms. For different industries, however, the earnings management incentives
as well as constraints may be totally different. Therefore, it may well be that other firm
characteristics are responsible for forming this selection effect, which are much harder to
control for.
We therefore repeat our analysis by taking into account these two objections. For that
purpose we estimate a two-stage model using the Heckman (1979) method. In the first
stage, we explain total earnings management (Total_EM), i.e. AEM and REM, by a model
that takes economic variables into account that are expected to explain earnings
management activities with the exception of ownership variables (Cohen and Zarowin,
2010). In the second stage we explain, conditional on the results in the first stage, the
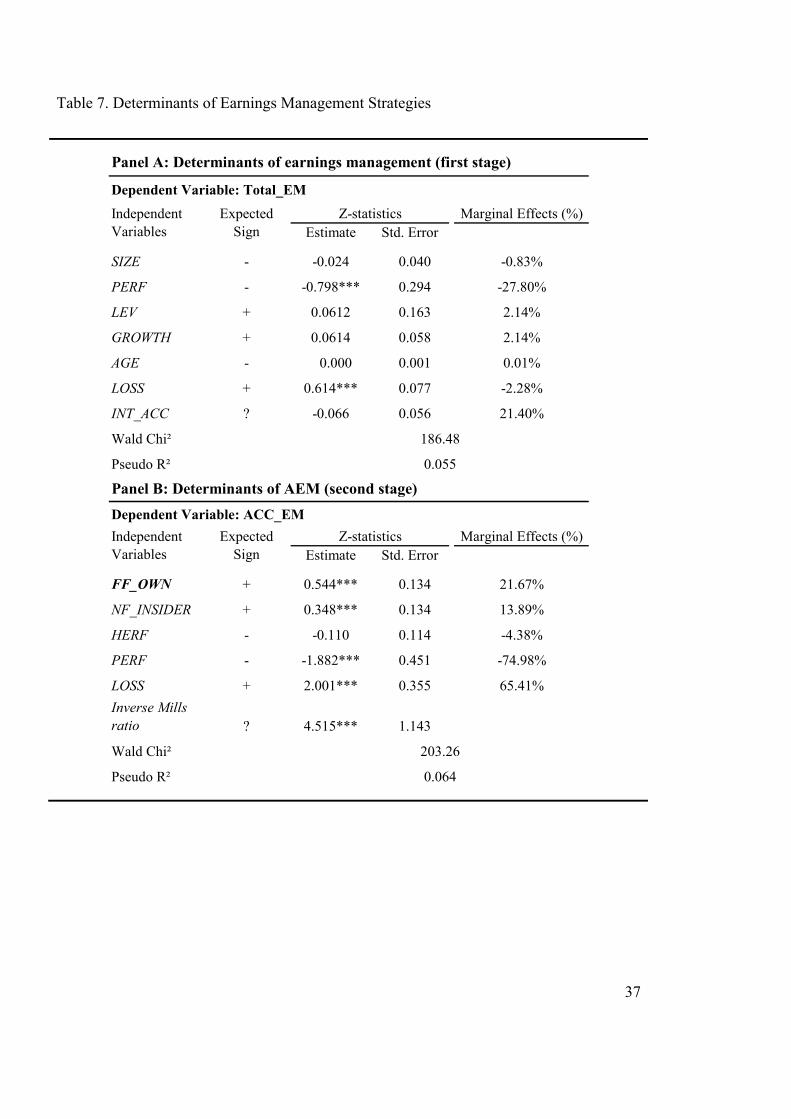
preference for either AEM or REM. Results are presented in Table 7.
– Insert Table 7 around here –
From a technical perspective, it should be noted that Total_EM is our measure whether a
firm-year observation is classified as an earnings management firm-year observation or
not. It is an indicator variable that equals one if either discretionary accruals are above or
discretionary cash flows are below the median in the respective year, and zero otherwise.
In the first stage, we get the expected result that earnings management activities are driven
by profitability (negative impact) and the existence of a loss (positive impact). In the
second stage, we see that these variables are still significant. However, on top of that also
the ownership structure becomes relevant. In fact, it clearly emerges that AEM is higher in
family firms, but also in insider-held firms, while REM is lower in these two types of
firms. Moreover, the coefficients are highly significant in all models. This is also true for

22
the coefficient on the inverse Mills ratio strongly indicating that there might be a selection
bias in the data.
To sum up, even by correcting for a potential selection bias and by taking an integrated
view on AEM as well as REM, we find results strongly corroborating our hypotheses that
family firms engage more in AEM and less in REM as compared to their non-family
counterparts.
5.3.2 Non-linear Effects of Family Ownership on Earnings Management
We test for non-linearity between family ownership and earnings management in three
ways. Following Wang (2006), we generate three indicator variables, one for family firms
without family ownership but presence of family members on one of the boards
(No_FAM), one for weak (W_FAM) and one for strong family ownership (S_FAM). The
indicator variable on strong family ownership (S_FAM) equals one if the percentage of
common stock owned by family members is greater than or equal to the median of family
ownership in the respective year (about 30%), and zero otherwise. Accordingly, the
dummy variable on weak family ownership (W_FAM) equals one if the percentage of
common stock owned by the family is below the median value of family ownership in the
respective year, and zero otherwise. In a second model, we add the square of family
ownership to the models for accounting earnings management (FF_OWN and FF_OWN²).
In a third model, we include dummy variables for family ownership according to the
different control thresholds in German listed firms (FF_1 to FF_4): An ownership level
between zero and 25% (blocking minority, FF_1), between 25% and 50% (simple
majority, FF_2), between 50% and 75% (qualified majority, FF_3) and above the qualified
majority of 75% (FF_4).
Results are presented in table 8. Again, our results corroborate the hypotheses that AEM
activities are driven by family ownership and not by family management. In fact, while the

23
coefficients on weak family ownership (W_FAM) and strong family ownership (S_FAM)
are positive and statistically significant, we do not find any impact in those firms where
families do not have significant ownership stakes but are present in the supervisory or
management board (No_FAM).
– Insert Table 8 around here –
As far as different levels of ownership are concerned, our hypothesis does not make a clear
prediction. Nevertheless, one might expect that the impact on AEM is the larger the larger
the ownership stake of the family is. While the result in model 2 is not against this
presumption, this is not true for the results of model 3 in Table 8. In fact, according to
these results AEM activities do not seem to strongly depend on the ownership stake held
by the founding family. This is at least true for ownership stakes of up to 75% of voting
rights. Beyond this level the coefficient on family ownership is not significantly different
from zero. This could be an indication that incentives to manage accounting earnings are
particularly pronounced for medium levels of family ownership. However, it should be
taken into account that this result may also be driven by data issues, as the number of
family firms in which the family holds more than 75% of the voting rights becomes very
small (4.5% of family firms).
– Insert Table 9 around here –
As far as REM is concerned, our hypothesis predicts that these activities should be less
pronounced the larger the ownership stake of the family is. This is true, at least, if we
assume that the cost of REM activities gets more strongly weighted the more this cost is
borne by the family. The results presented in Table 9 slightly corroborate this hypothesis.
In fact, REM is less pronounced in firms with strong family ownership (S_FAM), whereas

24
the coefficients on weak or no family influence are not significantly different from zero
according to model 1. The results in model 2, however, are not in accordance with our
hypothesis, while the results in model 3 only partially support it.
4.3.2 Presence of Other Large Shareholders
As a final remark, it should be noted that results are robust when variables that can be used
as proxy for the presence of other blockholders are included in the models. At first, we add
the percentage held by outside blockholders, i.e. shareholders owning more than 5% of
shares in the firm. Secondly, we control for other types of large shareholders that may
affect earnings characteristics, i.e. banks, strategic shareholders, private equity and
institutional investors. Untabulated results suggest that the presence of these types of
outside blockholders is not systematically associated with AEM or REM and does not
affect our results.
5. Summary and Conclusion
When engaging in earnings management firms are faced with a trade-off between AEM
and REM. While there are several papers investigating the two mechanisms on an isolated
basis, only few studies have taken an integral view. This paper aimed to shed new light on
the understanding of this trade-off.
Specifically, we have argued that the outcome of this trade-off is driven by the motives
driving earnings management, the ownership structure of the firm and the institutional
environment. In order to test this hypothesis, we have used a large panel data set of listed
German firms over the period 1998 to 2008. Our ownership variable of interest was related
to the founding family concept. We hypothesized that firms owned by their founding
families should engage more in AEM and less in REM activities. In a nutshell, this is

25
because at the one side they engage in earnings management not because of capital market
pressures, but because of control motives (i.e. avoiding the breach of covenant clauses or
influencing the dividends). At the other side, because of their large ownership stakes they
dislike REM because of its negative performance impact.
Our results corroborate this hypothesis. We find clear evidence that family firms engage
more actively in AEM compared to their non-family counterparts, while they engage less
in REM. This result is robust against a potential selection bias. In fact, by applying a two-
stage Heckman selection model we can clearly corroborate these results. Moreover, by
splitting-up the family involvement into a family ownership and a family management
component, it can be shown that the effect is driven by family ownership. However, with
respect to the question whether ownership has a linear or non-linear impact on earnings
management activities the findings are rather mixed.
Our findings also shed some light on the question why evidence on AEM in family firms
presented hitherto was mixed. We argue that the ownership structures as well as the
institutional environment, especially the level of investor protection, influence the trade-off
between AEM and REM. As this impact is different for family and non-family firms it may
well be that the relative level of AEM changes across countries.
26
References
Ali, A., Chen, T.-Y. and Radhakrishnan, S. (2007) Corporate disclosures by family firms,
Journal of Accounting and Economics, 44(1-2), pp. 238–286.
Ampenberger, M., Schmid, T., Achleitner, A.-K., Kaserer, C. (2012) Capital structure
decisions in family firms: empirical evidence from a bank-based economy, Review of
Managerial Sciences, Forthcoming.
Anderson, R. C. and Reeb, D. M. (2003) Founding-Family Ownership and Firm
Performance: Evidence from the S&P 500, The Journal of Finance, 58(3), pp. 1301–
1328.
Andres, C. (2008) Large shareholders and firm performance – An empirical examination of
founding-family ownership, Journal of Corporate Finance, 14 (4), pp. 431–445.
Armstrong, C. S., Guay, W.R. and Weber, J.P. (2010) The Role of Information and
Financial Reporting in Corporate Governance and Debt Contracting, Journal of
Accounting and Economics, 50(2-3), pp. 179–234.
Baber, W. R., Fairfield, P. M. and Haggard, J. A. (1991) The Effect of Concern about
Reported Income on Discretionary Spending Decisions: The Case of Research and
Development, The Accounting Review, 66(4), pp. 818–829.
Ball, R., Kothari, S. P. and Robin, A. (2000) The effect of international institutional factors
on properties of accounting earnings, Journal of Accounting and Economics, 29(1),
pp. 1–51.
Ball, R., Robin, A. and Wu, J. S. (2003) Incentives versus standards: properties of
accounting income in four East Asian countries, Journal of Accounting and
Economics, 36(1-3), pp. 235–270.
Ball, R. and Shivakumar, L. (2006) The Role of Accruals in Asymmetrically Timely Gain
and Loss Recognition, Journal of Accounting Research, 44(2), pp. 207–242.
Bar-Yosef, S. and Prencipe, A. (2011) Earnings Management and Corporate Governance
in Family-Controlled Companies, Journal of Accounting, Auditing and Finance,
26(2), pp. 199–227.

27
Bartov, E. (1993) The Timing of Asset Sales and Earnings Manipulation, The Accounting
Review, 68(4), pp. 840–855.
Bens, D. A., Nagar, V., Skinner, D. J. and Wong, M. H. F. (2003) Employee stock options,
EPS dilution, and stock repurchases, Journal of Accounting and Economics, 36(1-3),
pp. 51–90.
Bergstresser, D. and Philippon, T. (2006) CEO incentives and earnings management,
Journal of Financial Economics, 80(3), pp. 511–529.
Bushee, B. (1998) The influence of institutional investors on myopic R&D investment
behavior, The Acounting Review, 73(3), pp. 305–333.
Cheng, S. and Firth, M. (2006) Family Ownership, Corporate Governance, and Top
Executive Compensation, Managerial and Decision Economics, 27(7), pp. 549–561.
Cohen, D. A., Dey, A. and Lys, T. Z. (2008) Real and accrual-based earnings management
in the pre- and post-sarbanes-oxley periods, The Accounting Review, 83(3), pp. 757–
787.
Cohen, D.A. and Zarowin, P. (2010) Accrual-based and real earnings management
activities around seasoned equity offerings, Journal of Accounting and Economics,
50(1), pp. 2–19.
Dechow, P. M. and Skinner, D. J. (2000) Earnings Management: Reconciling the Views of
Accounting Academics, Practitioners, and Regulators, Accounting Horizons, 14(2),
pp. 235–250.
Dechow, P. M. and Sloan, R. (1991) Executive incentives and the horizon problem: an
empirical investigation, Journal of Accounting and Economics, 14(1), pp. 15–89.
DeFond, M. L. and Jiambalvo, J. (1994) Debt covenant violation and manipulation of
accruals, Journal of Accounting and Economics, 17(1-2), pp.145–176.
Dhaliwal, D. S., Salamon, G. L. and Dan Smith, E. (1982) The effect of owner versus
management control on the choice of accounting methods, Journal of Accounting
and Economics, 4(1), pp. 41–53.

28
Ewert, R. and Wagenhofer, A. (2005) Economic Effects of Tightening Accounting
Standards to Restrict Earnings Management, The Accounting Review, 80(4), pp.
1101–1124.
Gabrielsen, G., Gramlich, J. D. and Plenborg, T. (2002) Managerial Ownership,
Information Content of Earnings, and Discretionary Accruals in a Non-US Setting,
Journal of Business Finance & Accounting, 29(7/8), pp. 967–988.
García Lara, J. M., García Osma, B. and Araceli, M. (2005) The Effect of Earnings
Management on the Asymmetric Timeliness of Earnings, Journal of Business
Finance & Accounting, 32(3/4), pp. 691–726.
Gomez-Mejia, L. R., Larraza-Kintana, M. and Makri, M. (2003) The Determinants of
Executive Compensation in Family-Controlled Public Corporations, The Academy of
Management Journal, 46(2), pp. 226–237.
Graham, J. R., Harvey, C. R. and Rajgopal, S. (2005) The economic implications of
corporate financial reporting, Journal of Accounting and Economics, 40(1-3), pp. 3–
73.
Gunny, K. (2010) The Relation between Earnings Management Using Real Activities
Manipulation and Future Performance: Evidence from Meeting Earnings
Benchmarks', Contemporary Accounting Research, 27 (3), pp. 855–888.
Healy, P. M. (1985) The effect of bonus schemes on accounting decisions, Journal of
Accounting and Economics, 7(1-3), pp. 85-107.
Healy, P. M. and Wahlen, J. M. (1999) A Review of the Earnings Management Literature
and Its Implications for Standard Setting, Accounting Horizons, 13(4), pp. 365–383.
Herrmann, D., Inoue, T. and Thomas, W. B. (2003) The Sale of Assets to Manage
Earnings in Japan, Journal of Accounting Research, 41(1), pp. 89–108.
Himmelberg, C. P., Hubbard, R. G. and Palia, D. (1999) Understanding the determinants of
managerial ownership and the link between ownership and performance, Journal of
Financial Economics, 53(3), pp. 353–384.
Holthausen, R. W., Larcker, D. F. and Sloan, R. G. (1995) Annual bonus schemes and the
manipulation of earnings, Journal of Accounting and Economics, 19(1), pp. 29–74.

29
Hunt, A., Moyer, S. E. and Shevlin, T. (1996) Managing interacting accounting measures
to meet multiple objectives: A study of LIFO firms, Journal of Accounting and
Economics, 21(3), pp. 339–374.
Hutton, A. P. (2007) A discussion of 'corporate disclosure by family firms', Journal of
Accounting and Economics, 44(1-2), pp. 287–297.
Jackson, S. and Wilcox, W. (2000) Do managers grant sales price reductions to avoid
losses and declines in earnings and sales?, Quarterly Journal of Business and
Economics, 39(4), pp. 3–20.
Jaggi, B., Leung, S. and Gul, F. (2009) Family control, board independence and earnings
management: Evidence based on Hong Kong firms, Journal of Accounting & Public
Policy, 28(4), pp. 281–300.
James, H. S. (1999) Owner as manager, extended horizons and the family firm,
International Journal of the Economics of Business, 6(1), pp. 41–55.
Jara-Bertin, M. A. and Lopez Iturriaga, F. J. (2008) Earnings Management and Contest to
the Control: An Analysis of European Family Firms, Corporate Governance: An
International Review, 16(3), pp. 146–159.
Kasanen, E., Kinnunen, J. and Niskanen, J. (1996) Dividend-based earnings management:
Empirical evidence from Finland, Journal of Accounting and Economics, 22(1-3),
pp. 283–312.
Kasznik, R. (1999) On the Association between Voluntary Disclosure and Earnings
Management, Journal of Accounting Research, 37(1), pp. 57–81.
Kothari, S. P., Ramanna, K. and Skinner, D. J. (2010) Implications for GAAP from an
analysis of positive research in accounting, Journal of Accounting and Economics,
50 (2-3), pp. 246–286.
Leuz, C., Nanda, D. and Wysocki, P. D. (2003) Earnings management and investor
protection: an international comparison, Journal of Financial Economics, 69(3), pp.
505–527.
30
Morck, R., Shleifer, A. and Vishny, R. W. (1988) Management Ownership and Market
Valuation - An Empirical Analysis, Journal of Financial Economics, 20 (1-2), pp.
293–315.
Peasnell, K., Pope, P. and Young, S. (2005) Board Monitoring and Earnings Management:
Do Outside Directors Influence Abnormal Accruals?, Journal of Business Finance &
Accounting, 32(7-8), pp. 1311–1346.
Prencipe, A., Markarian, G. and Pozza, L. (2008) Earnings Management in Family Firms:
Evidence from R&D Cost Capitalization in Italy, Family Business Review, 21(1), pp.
71–88.
Roychowdury, S. (2006) Earnings management through real activities manipulation,
Journal of Accounting and Economics, 42(3), pp. 335–370.
Salvato, C. and Moores, K. (2010) Research on Accounting in Family Firms: Past
Accomplishments and Future Challenges, Family Business Review, 23(3), pp. 193–
215.
Schipper, K. (1989) Commentary on Earnings Management, Accounting Horizons 3(4),
pp. 91–102.
Schmid, T., Ampenberger, M., Kaserer, C. and Achleitner, A.-K. (2010) Controlling
Shareholders and Payout Policy: Do Founding Families Have a Special 'Taste for
Dividends'?, CEFS Working Paper No. 2010-01, Technische Universität München.
Stockmans, A., Lybaert, N. and Voordeckers, W. (2010) Socioemotional Wealth and
Earnings Management in Private Family Firms, Family Business Review, 23(3), pp.
280–294.
Thomas, J. K. and Zhang, H. (2002) Inventory changes and future returns, Review of
Accounting Studies, 7(2-3), 163–187.
Tong, Y. H. (2007) Financial Reporting Practices of Family Firms, Advances in
Accounting, 23(1), pp. 231–261.
Villalonga, B. and Amit, R. (2006) How do family ownership, control and management
affect firm value?, Journal of Financial Economics, 80(2), pp. 385–417.

31
Wang, D. (2006) Founding Family Ownership and Earnings Quality, Journal of
Accounting Research, 44(3), pp. 619–656.
Warfield, T. D., Wild, J. J. and Wild, K. L. (1995) Managerial ownership, accounting
choices, and informativeness of earnings, Journal of Accounting and Economics,
20(1), pp. 61–91.
Young, C.-S. and Tsai, L.-C. (2008) The sensitivity of compensation to social capital:
Family CEOs vs. nonfamily CEOs in the family business groups, Journal of
Business Research, 61(4), pp. 363-374.
Zang, A. (2012) Evidence on the Trade-Off between Real Activities Manipulation and
Accrual-Based Earnings Management, The Accounting Review, 87 (2), pp. 675–703.

32
Table 1.Distribution of Family Firms and Family Firm Characteristics
Year No. of Firms
No. of Family Firms
Percentage of Family Firms
Family Ownership
Family Management
F_CEO D_CEO H_CEO FF_Chair
46.15% 17.95% 35.90% 12.09%1998 305 99 32.46% 45.33% 68.69% 46.15% 17.95% 35.90% 12.09%1999 418 175 41.87% 43.01% 76.00% 60.93% 9.93% 29.14% 12.50%2000 557 291 52.24% 38.59% 77.32% 60.70% 7.39% 31.91% 12.95%2001 542 291 53.69% 37.31% 73.54% 57.63% 7.25% 35.11% 13.72%2002 499 248 49.70% 37.48% 69.76% 56.64% 6.19% 37.17% 14.17%2003 469 232 49.47% 37.81% 68.53% 57.41% 6.48% 36.11% 15.49%2004 442 214 48.42% 34.57% 68.22% 55.10% 7.65% 37.24% 17.70%2005 436 205 47.02% 30.83% 69.76% 53.97% 8.99% 37.04% 17.59%2006 434 206 47.47% 29.58% 68.93% 51.79% 9.74% 38.46% 16.92%2007 436 198 45.41% 30.33% 69.19% 55.61% 8.56% 35.83% 16.49%2008 399 176 44.11% 31.83% 65.34% 52.98% 7.74% 39.29% 15.70%56.05% 8.24% 35.72% 15.08%
Total 4,937 2,335 47.30% 35.80% 70.88% 56.05% 8.24% 35.72% 15.08%
Note: Family Ownership refers to the mean of common stock held by the founding family in family firms. Family Management presents the percentage of family firms in which one or more members of the founding family hold positions in the management board. F_CEO represents the percentage of founding CEOs, D_CEO the percentage of descendant CEOs and H_CEO the percentage of hired CEOs in family firms.

33
Table 2.Summary Statistics for Family and Non-Family Firms
Sample Period: 1998-2008
Variable
FF NF FF NF FF NF FF NF Mean Median
Governance Characteristics
FF_OWN 0.358 0.006 0.376 0.000 0.250 0.028 2,335 2,602 *** ***FMB 0.709 0.000 1.000 0.000 0.454 0.000 2,335 2,602 *** ***NF_INSIDER 0.070 0.141 0.000 0.000 0.139 0.243 2,335 2,602 *** ***HERF 0.217 0.345 0.171 0.257 0.181 0.310 2,335 2,602 *** ***Firm Characteristics
ABS_ACC 0.076 0.053 0.053 0.035 0.070 0.057 1,670 1,765 *** ***DISCR_CF 0.005 -0.003 0.000 0.007 0.118 0.864 2,066 2,436 * n.s.SIZE 4.982 5.487 4.862 5.358 0.684 0.874 2,268 2,514 *** ***PERF -0.039 0.004 0.020 0.026 0.178 0.120 2,186 2,512 *** ***LEV 0.200 0.219 0.154 0.194 0.184 0.172 2,012 2,329 *** ***GROWTH 0.210 0.095 0.089 0.040 0.515 0.367 2,217 2,508 *** ***AGE 30.15 67.82 16.00 60.00 38.55 54.54 2,335 2,602 *** ***LOSS 0.393 0.281 0.000 0.000 0.488 0.450 2,235 2,559 ***1 -INT_ACC 0.794 0.601 1.000 1.000 0.405 0.490 2,335 2,602 ***1 -
Mean Median Std. Deviation Observations Sign. of Diff.
Notes: FF refers to family firms, whereas NF refers to non-family firms. FF_OWN is family ownership, FMB is a dummy variable and one if one or more members of the founding family hold positions in the management board and zero otherwise, NF_INSIDER is non-family insider ownership, HERF is a Herfindahl index on ownership concentration at a firm and year level, ABS_ACC is absolute abnormal accruals, DISCR_CF is discretionary cash flows, SIZE is natural logarithm of total assets, PERF is net income scaled by average total assets, LEV is debt to total assets, GROWTH is sales growth, AGE is firm age since incorporation, LOSS is one if net income is negative and zero otherwise, INT_ACC is one if financial statements are prepared according to IFRS or US GAAP and zero if prepared under German GAAP (HGB). Significance of differences is assessed based on t-tests (mean) and Wilcoxon/Man-Whitney tests (median). 1denotes that significance of differences in dummy variables is assessed based on Chi² tests.
Table 3.Industry Distribution of Family and Non-Family Firms
ICB-Code Industry DescriptionNon-Family
Firms Family FirmsFamily Firms per
Industry [%]1 Basic Materials 254 64 20.13%2 Industrials 829 454 35.39%3 Consumer Goods 572 260 31.25%4 Health Care 134 256 65.64%5 Consumer Services 325 355 52.21%6 Telecommunication 28 35 55.56%9 Technology 334 864 72.12%

34
Tab
le 4
.Cor
rela
tion
Mat
rix
Variables
12
34
56
78
910
1112
1314
1516
1718
19
1AB
S_AC
C1
2D
ISC
R_C
F-0
.058
***
1
3D
umm
y_FF
0.17
4***
0.02
7*1
4FF
_OW
N0.
0801
***
0.05
83**
*0.
7124
***
1
5FM
B0.
0824
***
-0.0
30**
0.14
07**
*0.
7124
***
10.
1613
*6
FF_O
WN
x F
MB
0.02
64-0
.010
60.
1394
***
0.14
07**
* 0
.770
7***
1
7F_
CEO
0.16
13**
*0.
026*
0.59
46**
*0.
1394
***
0.01
43-0
.006
91
0.52
17*
8D
_CEO
-0.0
514*
**0.
013
0.20
24**
*0.
5946
***
-0.0
279*
*-0
.027
*-0
.108
2***
1
9H
_CEO
0.06
94**
*0.
000
0.52
17**
*0.
2024
***
0.1
743*
** 0
.195
2***
-0.2
788*
** -0
.094
7***
1
10FF
_Cha
ir0.
0341
**0.
002
0.29
30**
* 0
.240
1***
-0.0
050.
0106
-0.0
338*
*0.
0198
0.3
995*
**1
11N
F_IN
SID
ER0.
017
0.01
1-0
.197
***
-0.2
957*
** 0
.101
4***
-0.0
28**
-0.0
874*
** -0
.096
6***
-0.1
092*
**-0
.049
0***
1
12H
ERF
-0.0
82**
*0.
003
-0.2
43**
* -0
.047
8***
-0.0
546*
**0.
0119
-0.2
004*
**0.
0335
** -0
.105
1***
-0.0
667*
**0.
0285
**1
13SI
ZE-0
.275
***
-0.0
19-0
.304
***
-0.1
823*
**-0
.122
6***
-0.0
504*
**-0
.312
8***
-0.0
015
-0.0
458*
**-0
.054
2***
-0.1
440*
** 0
.108
4***
1
14PE
RF-0
.364
***
0.33
3***
-0.1
43**
*-0
.032
** -0
.106
5***
-0.0
548*
** -0
.157
8***
0.0
540*
** -0
.037
8***
0.02
190.
000
0.1
196*
** 0
.286
2***
1
15LE
V-0
.057
***
-0.0
94**
*-0
.052
***
-0.0
105
0.0
500*
** 0
.074
2***
-0.1
534*
**0.
0308
** 0
.083
7***
0.0
586*
** 0
.090
6***
-0.0
762*
* 0
.089
7***
-0.0
566*
**1
16G
ROW
TH-0
.001
0.03
6**
0.12
8***
0.0
903*
**-0
.003
3-0
.015
4 0
.159
3***
-0.0
257*
0.00
20.
0091
0.0
251*
-0.0
802*
**-0
.064
0***
0.0
552*
** -0
.101
6***
117
AGE
-0.2
27**
*-0
.02
-0.3
67**
* -0
.209
2***
-0.1
371*
** -0
.082
0***
-0.
3959
***
0.0
827*
** -0
.073
9***
-0.0
739*
**-0
.015
9 0
.255
6***
0.4
722*
** 0
.216
8***
0.0
453*
** -0
.164
9***
1
18LO
SS0.
318*
**-0
.258
***
0.11
8***
0.0117
0.0
884*
** 0
.029
5**
0.1
514*
** -
0.07
80**
*0.
0245
-0.0
059
0.0
315*
*-0
.108
0***
-0.3
080*
** -0
.692
5***
0.0
837*
**-0
.049
4***
-0.2
332*
**1
19IN
T_AC
C0.
065*
**0.
037*
*0.
208*
** 0
.073
8***
0.0
724*
** 0
.032
4**
0.2
295*
** -
0.07
87**
* 0
.051
0***
0.0
436*
**-0
.033
4**
-0.2
861*
**-0
.061
1***
-0.0
891*
** -
0.11
32**
* 0
.080
1***
-0.2
822*
**0.
0656
***
1
*, *
*, *
** s
igni
fican
tly d
iffer
ent f
rom
zer
o at
the α
= 0.
1, 0
.05
and
0.01
leve
l, re
spec
tivel
y.

35
Table 5.Effects of Family Involvement on Discretionary Accruals
Dependent Variable: ABS_ACC
Estimate Std. Error Estimate Std. Error Estimate Std. Error Estimate Std. Error
Intercept ? 0.109*** 0.011 0.114*** 0.011 0.110*** 0.012 0.111*** 0.012
Dummy_FF ? 0.008*** 0.003
FF_OWN ? 0.012** 0.006 0.015** 0.007
FMB ? 0.007 0.006
FF_OWN X FMB ? -0.014 0.012
F_CEO ? 0.008* 0.004
D_CEO ? -0.003 0.006
H_CEO ? 0.011*** 0.004
Family_Chair ? 0.001 0.006
NF_INSIDER ? 0.005 0.006 0.005 0.006 0.006 0.006 0.005 0.006
HERF ? -0.007 0.005 -0.009** 0.005 -0.008** 0.005 -0.006 0.005
SIZE - -0.008*** 0.002 -0.008*** 0.002 -0.008*** 0.002 -0.008*** 0.002
PERF - -0.126*** 0.021 -0.128*** 0.021 -0.126*** 0.021 -0.126*** 0.022
LEV + -0.024*** 0.008 -0.025*** 0.008 -0.024*** 0.008 -0.025*** 0.008
GROWTH + -0.003 0.004 -0.003 0.004 -0.004 0.004 -0.004 0.004
AGE - -0.000*** 0.000 -0.000*** 0.000 -0.000*** 0.000 -0.000*** 0.000
LOSS + 0.013*** 0.004 0.013*** 0.004 0.0131*** 0.004 0.013*** 0.004
INT_ACC ? -0.002 0.003 -0.001 0.003 -0.002 0.003 -0.003 0.003
F-Value
p-value F-test
Adj R²
N
30.12
0.000
0.179
3,008
Model 4
27.85
0.000
0.181
2,948
35.47
0.179
0.000
36.35
0.000
Independent Variables
Expected Sign
Model 1 Model 2 Model 3
0.180
3,0083,008 Notes: Results are derived from pooled OLS models. ABS_ACC denotes absolute abnormal accruals; Dummy_FF is an indicator variable that equals one if the founding family holds more than 25% of ordinary shares or positions in the management or supervisory board; FF_OWN is the percentage of common shares held by the family; FMB is a dummy variable and equals on if a family member is involved in the management of the firm and zero otherwise. F_CEO is one if one of the founders serves as CEO, D_CEO is one if there is a descendant CEO, H_CEO is one if there is an external CEO in a family firm. NF_INSIDER is the percentage of common shares held by non-founding family insiders; HERF is a Herfindahl index and corresponds to ownership concentration; SIZE is the natural logarithm of total assets; PERF is net income before extraordinary items scaled by average total assets; LEV is total debt to total assets; GROWTH is sales growth; LOSS is an indicator variable which equals one if net income is negative and zero otherwise; INT_ACC is an indicator variable that equals 1 if consolidated financial statements are prepared according to IFRS or US GAAP and zero otherwise. Standard errors are clustered on a year and firm level following Petersen (2009). *** / ** / * indicate a two-tailed significance level at 99% / 95% / 90%. Mean VIFs are between 1.35 and 1.59, max. VIF 2.46 (FF_OWN X FMB).

36
Table 6.Effects of Family Involvement on Discretionary Cash Flows
Dependent Variable: Discr_CF
Estimate Std. Error Estimate Std. Error Estimate Std. Error Estimate Std. Error
Intercept ? 0.090*** 0.022 0.089*** 0.021 0.0895*** 0.021 0.089*** 0.022
Dummy_FF ? 0.009 0.006
FF_OWN ? 0.026** 0.012 0.0280* 0.016
FMB ? -0.001 0.011
FF_OWN X FMB ? -0.001 0.026
F_CEO ? 0.010 0.009
D_CEO ? 0.008 0.014
H_CEO ? 0.014* 0.008
Family_Chair ? -0.009 0.011
NF_INSIDER ? 0.010 0.011 0.015 0.012 0.015 0.012 0.010 0.012
HERF ? -0.003 0.009 -0.006 0.009 -0.006 0.009 -0.001 0.009(0.00895)SIZE - -0.017*** 0.004 -0.016*** 0.004 -0.0163*** 0.004 -0.016*** 0.004
PERF - 0.312*** 0.027 0.310*** 0.027 0.310*** 0.027 0.315*** 0.028
LEV + -0.034** 0.014 -0.036** 0.014 -0.0362** 0.014 -0.033** 0.015
GROWTH + -0.009 0.007 -0.009 0.007 -0.008 0.007 -0.007 0.007
AGE - 0.000 0.000 0.000 0.000 0.000 0.000 0.000 0.000
LOSS + -0.015** 0.007 -0.015** 0.007 -0.0145** 0.007 -0.015** 0.007
INT_ACC ? 0.017*** 0.005 0.017*** 0.005 0.017*** 0.005 0.014*** 0.005
F-Value
p-value F-test
Adj R²
N
27.64
Model 4Independent Variable
Expected Sign
Model 1 Model 2 Model 3
23.66
0.000
0.132
3,767
32.64
0.000
0.133
3,859
30.12
0.134
0.000
3,859
0.134
3,859
0.000
Notes: Results are derived from pooled OLS models. Discr_CF denotes discretionary cash flows; Dummy_FF is an indicator variable that equals one if the founding family holds more than 25% of ordinary shares or positions in the management or supervisory board; FF_OWN is the percentage of common shares held by the family; FMB is a dummy variable and equals on if a family member is involved in the management of the firm and zero otherwise. F_CEO is one if one of the founders serves as CEO, D_CEO is one if there is a descendant CEO, H_CEO is one if there is an external CEO in a family firm. NF_INSIDER is the percentage of common shares held by non-founding family insiders; HERF is a Herfindahl index and corresponds to ownership concentration; SIZE is natural logarithm of total assets; PERF is net income before extraordinary items scaled by average total assets; LEV is total debt to total assets; GROWTH is sales growth; LOSS is an indicator variable which equals one if net income is negative and zero otherwise; INT_ACC is an indicator variable that equals 1 if consolidated financial statements are prepared according to IFRS or US GAAP and zero otherwise. Standard errors are clustered on a year and firm level following Petersen (2009). *** / ** / * indicate a two-tailed significance level at 99% / 95% / 90%. Mean VIFs are between 1.33 and 1.57, max. VIF 2.46 (FF_OWN X FMB).
37
Table 7. Determinants of Earnings Management Strategies
Dependent Variable: Total_EMMarginal Effects (%)
Estimate Std. Error
SIZE - -0.024 0.040 -0.83%
PERF - -0.798*** 0.294 -27.80%
LEV + 0.0612 0.163 2.14%
GROWTH + 0.0614 0.058 2.14%
AGE - 0.000 0.001 0.01%
LOSS + 0.614*** 0.077 -2.28%
INT_ACC ? -0.066 0.056 21.40%
Wald Chi²
Pseudo R²
Dependent Variable: ACC_EMMarginal Effects (%)
Estimate Std. Error
FF_OWN + 0.544*** 0.134 21.67%
NF_INSIDER + 0.348*** 0.134 13.89%
HERF - -0.110 0.114 -4.38%
PERF - -1.882*** 0.451 -74.98%
LOSS + 2.001*** 0.355 65.41%Inverse Mills ratio ? 4.515*** 1.143
Wald Chi²
Pseudo R²
Dependent Variable: Real_EMMarginal Effects (%)
Estimate Std. ErrorM Z-statisticsFF_OWN - -0.275** 0.129 -10.98%
NF_INSIDER - -0.206 0.148 -8.20%
HERF ? 0.112 0.106 0.0447
PERF - -0.422 0.446 -16.83%
LOSS + -1.448*** 0.350 -51.77%Inverse Mills ratio ? -5.629*** 1.137
Wald Chi²
Pseudo R² 0.067
Independent Variables
Expected Sign
Z-statistics
Z-statistics
Z-statistics
Panel C: Determinants of REM (second stage)
Independent Variables
Expected Sign
Z-statistics
203.26
0.064
205.78
Independent Variables
Expected Sign
Z-statistics
Panel A: Determinants of earnings management (first stage)
186.48
0.055
Panel B: Determinants of AEM (second stage)

38
Table 7. Determinants of Earnings Management Strategies (continued)
Dependent Variable: Real_EMMarginal Effects (%)
Estimate Std. ErrorM Z-statisticsFF_OWN - -0.275** 0.129 -10.98%
NF_INSIDER - -0.206 0.148 -8.20%
HERF ? 0.112 0.106 0.0447
PERF - -0.422 0.446 -16.83%
LOSS + -1.448*** 0.350 -51.77%Inverse Mills ratio ? -5.629*** 1.137
Wald Chi²
Pseudo R² 0.067
Independent Variables
Expected Sign
Z-statistics
Z-statistics
Z-statistics
Panel C: Determinants of REM (second stage)
205.78
Notes: This table presents the results of two probit models. For Panel A, the dependent variable Total_EM takes the value of 1 if either the level of absolute discretionary accruals (REM) is below or the level of discretionary accruals (AEM) is above the median value and zero otherwise. For Panel B, the dependent variable Real_EM takes the value of 1 if the discretionary expenses multiplied by negative one is above the median and zero otherwise. For Panel C, the dependent variable ACC_EM takes the value of 1 if absolute abnormal accruals are above median in the respective year and zero otherwise. SIZE is the natural logarithm of total assets; PERF is net income before extraordinary items scaled by average total assets; LEV is total debt to total assets; GROWTH is sales growth; LOSS is one if net income is negative and zero otherwise; INT_ACC is one if financial statements are prepared according to IFRS or US GAAP and zero otherwise. FF_OWN is founding family ownership; NF_INSIDER non-founding family insider ownership; HERF is a Herfindahl index and corresponds to ownership concentration. Standard errors are clustered on a year and firm level following Petersen (2009). *** / ** / * indicate a two-tailed significance level at 99% / 95% / 90%.

39
Table 8.Non-linearity between Family Ownership and Discretionary Accruals
Dependent Variable: ABS_ACC
Estimate Std. Error Estimate Std. Error Estimate Std. Error
Intercept ? 0.106*** 0.011 0.110*** 0.011 0.109*** 0.011
No_FAM ? 0.008 0.005
W_FAM ? 0.011*** 0.004
S_FAM ? 0.010** 0.004
FF_OWN + 0.041** 0.020
FF_OWN² - -0.045 0.028
FF_1 ? 0.008* 0.005
FF_2 ? 0.012*** 0.005
FF_3 ? 0.007* 0.004
FF_4 ? 0.004 0.008
NF_INSIDER ? -0.006 0.005 0.006 0.006 -0.005 0.005
HERF ? 0.006 0.006 -0.007 0.005 0.006 0.006
SIZE - -0.008*** 0.002 -0.008*** 0.002 -0.008*** 0.002
PERF - -0.126*** 0.021 -0.128*** 0.021 -0.127*** 0.021
LEV + -0.024*** 0.008 -0.024*** 0.008 -0.024*** 0.008
GROWTH + -0.004 0.004 -0.003 0.004 -0.003 0.004
AGE - -0.000*** 0.000 -0.000*** 0.000 -0.000*** 0.000
LOSS + 0.013*** 0.004 0.013*** 0.004 0.013*** 0.004
INT_ACC ? -0.002 0.003 -0.002 0.003 -0.002 0.003
F-Value
p-value F-test
Adj. R²
N
0.000
3,008 3,008
0.000
0.180
0.000
0.180
30.39
3,008
0.181
Model 3
32.33 27.43
Expected Sign
Model 2Model 1Independent Variable
Notes: Results are derived from pooled OLS models. ABS_ACC is absolute abnormal accruals; No_FAM is a dummy variable and one if the family only holds positions in one of the board, W_FAM is a dummy variable and one if family ownership is below the median value of family ownership and zero otherwise; S_FAM is a dummy variable and one if family ownership is above the median value of family ownership and zero otherwise; FF_OWN (FF_OWN²) is the (squared) percentage of shares held by the family; NF_INSIDER is the percentage of common shares held by non-founding family insiders; HERF is a Herfindahl index proxies for ownership concentration; SIZE is log total assets; PERF is net income before extraordinary items scaled by average total assets; LEV is debt to assets; GROWTH is sales growth; LOSS is a dummy variable and one if net income is negative and zero otherwise; INT_ACC is one if consolidated financial statements are prepared according to IFRS/US GAAP and zero otherwise. Standard errors are clustered on a year and firm level following Petersen (2009). *** / ** / * indicate a two-tailed significance level at 99% / 95% / 90%.

40
Table 9.Non-linearity between Family Ownership and Discretionary Cash Flows
Dependent Variable: Discr_CF
Estimate Std. Error Estimate Std. Error Estimate Std. Error
Intercept ? 0.091*** 0.022 0.094*** 0.022 0.095*** 0.022(0.0215) (0.0216)No_FAM ? 0.006 0.012
W_FAM ? -0.003 0.008
S_FAM ? 0.017** 0.007
FF_OWN ? -0.020 0.041
FF_OWN² ? 0.071 0.059
FF_1 ? -0.006 0.010
FF_2 ? -0.001 0.009
FF_3 ? 0.021** 0.008
FF_4 ? 0.015 0.018
NF_INSIDER ? 0.013 0.012 0.014 0.012 -0.010 0.009
HERF ? -0.009 0.009 -0.010 0.009 0.014 0.012
SIZE - -0.016*** 0.004 -0.017*** 0.004 -0.017*** 0.004
PERF - 0.311*** 0.027 0.310*** 0.027 0.308*** 0.027
LEV + -0.036** 0.014 -0.037** 0.014 -0.036** 0.014
GROWTH + -0.008 0.007 -0.008 0.007 -0.008 0.007
AGE - 0.000 0.000 0.000 0.000 0.000 0.000
LOSS + -0.014** 0.007 -0.014** 0.007 -0.015** 0.007
INT_ACC ? 0.017*** 0.005 0.018*** 0.005 0.018*** 0.005
F-Value
p-value F-test
Adj. R²
N 3,859
25.8
0.135
0.000
Model 3
30.28
Model 2
0.000
0.135
3,859
Independent Variable
0.000
3,859
0.135
Expected Sign
Model 1
27.62
Notes: Results are derived from pooled OLS models. Discr_CF is discretionary cash flows; No_FAM is a dummy variable and one if the family only holds positions in one of the board, W_FAM is a dummy variable and one if family ownership is below the median value of family ownership and zero otherwise; S_FAM is a dummy variable and one if family ownership is above the median value of family ownership and zero otherwise; FF_OWN (FF_OWN²) is the (squared) percentage of shares held by the family; NF_INSIDER is the percentage of common shares held by non-founding family insiders; HERF is a Herfindahl index proxies for ownership concentration; SIZE is log total assets; PERF is net income before extraordinary items scaled by average total assets; LEV is debt to assets; GROWTH is sales growth; LOSS is a dummy variable and one if net income is negative and zero otherwise; INT_ACC is one if consolidated financial statements are prepared according to IFRS/US GAAP and zero otherwise. Standard errors are clustered on a year and firm level following Petersen (2009). *** / ** / * indicate a two-tailed significance level at 99% / 95% / 90%.