earsel symposium “geoinformation for european … · analysis (moller-jensen 1990, mehldau...
TRANSCRIPT

Proceedings of 22nd EARSEL Symposium “Geoinformation for European-wide integration, Prague, June 2002
Object-oriented mapping and analysis of urban land use/cover using IKONOS data
Martin Herold & Joseph Scepan Department of Geography, University of California, Santa Barbara,
Santa Barbara, CA 93106, USA, Tel. 001-805-8934196, [email protected]
André Müller Department of Geography, Friedrich Schiller University Jena, Germany
Sylvia Günther Department of Cartography, Technical University Dresden, Germany
Keywords: urban land use, object-oriented, segmentation, Ikonos, spatial metrics, eCognition
ABSTRACT: There are a number of challenges in applying high-spatial resolution satellite image data for analysis of larger urban areas. This paper explores the use of object-oriented image analysis approaches in mapping urban land cover and land use. The study is based on seven IKONOS images covering the Santa Barbara, CA region. Image processing included geometric and atmospheric correction and image segmentation and classification using spectral and spatial information to separate 9 land cover classes 79 % overall accuracy was achieved with this approach. Specific problems are identified due the spectral and spatial complexity of urban areas, causing confusion between different roof types, roads and bare soil and NPV. Further analysis and refinement of the land cover mapping product (in particular buildings) applied two spatial metrics urban land use and socioeconomic information. The results show the importance, capabilities and challenges of object-oriented approaches in providing detailed and accurate information about the physical structure of urban areas and their relationship to urban land use and socioeconomic characteristics that should be further investigated in related studies.
1 INTRODUCTION
Urban areas as centers of economic and social development are an important objective in the application of remote sensing technology. Common problems in detailed and accurate urban area remote sensing results from the spatial and spectral heterogeneity of the urban environment typically consisting of built up structures (buildings, transportation areas), various vegetation covers (e.g. parks, gardens, agricultural areas), bare soil zones and water bodies. In order to accurately characterize this complex spatial environment, specific spatial and spectral sensor characteristics and improved image analysis techniques are required. New data resources and innovative concepts in image analysis have the potential for improving the mapping and analysis of spatial urban land use and land cover. Data from new high-spatial resolution satellite sensors IKONOS and QUICKBIRD are available. These data have significant potential for detailed digital imaging of the urban environment.
But, due to the higher spatial resolution, it is
more difficult to apply traditional digital image
analysis algorithms to derive thematic information from these new data. Considering the spatial heterogeneity of urban areas, high spatial resolution (2.5 m – 4 m) sensors represent urban land cover objects in comparatively few adjacent pixels. However, the geometry of the targets (e.g. roof structures, topography) and the heterogeneity of the objects themselves (e.g. roads with cracks or fillings) result in distinct spectral variation within these areas of homogenous land cover. Accordingly, urban land cover characterization from such data should apply an object-oriented rather than a pixel-based image analysis. Object-oriented classification is based on image segmentation and may results in a more homogenous and more accurate mapping product with higher detail in class definition (Bauer & Steinnocher 2000, Bauer & Steinnocher 2001, Willhauck 2000, Blaschke & Strobl 2001).
Satellite sensors like IKONOS and QUICKBIRD
are relatively limited in their spectral resolution. Considering the spectral complexity of urban land cover, there are specific limitations in the separation of built up and non-built up materials and of roofs and roads and of different roof types (Herold et al.

2002b). Accordingly, the image classification should include additional information about spatial shape and context. Object-based techniques have shown its potential to consider spatial complexity in the image classification process (Blaschke & Strobl 2001).
Remote sensing derived land cover maps usually
don’t provide sufficient thematic detail for most urban applications. In other words, the potential of applying remote sensing techniques to urban area mapping mainly results from the further analysis or refinement of the land cover mapping product. Based on the experiences in visual air photo interpretation (Haack et al. 1997), it is argued that the most important information for a more detailed urban land use and socioeconomic mapping can be derived from image context and texture (Barnsley et al. 1993). A part of the idea follows the concept of urban morphology: “… as a specific branch of urban geography [… with] its own, largely descriptive, language of discourse. It attempts to find more precise mathematical description of cities or parts of cities.” (Webster 1995, 280). Although related concepts have been widely discussed in the field of Geography (Golledge 1995) and remote sensing analysis (Moller-Jensen 1990, Mehldau and Schowengerdt 1990, Barnsley and Barr 1997), there are only a few studies that have investigated these issues in terms of high resolution remote sensing data (Bauer and Steinnocher 2001, Herold et al. 2002a).
Finally an important challenge relates to
application of high spatial resolution data and object-oriented approaches for large urban agglomerations. Usually, the coverage of these large areas requires several individually acquired images and represents a wide variety of different land cover types with higher spectral within class variability. Geometric distortions and radiometric variations between the images have to be reduced to provide a spectrally homogenous dataset for image analysis. Besides spectral variability, image analysis for urban analysis requires sophisticated evaluations and development of settings and parameters in object-oriented analysis. Most of these are applied as global variables, i.e. the parameters used for image segmentation or class related characteristics of object shape and size for image classification. Usually, these parameters can easily be optimized for smaller areas a suitable definition of those parameters might be problematic for a whole urban area with different land uses characteristics.
This paper presents an example of object-oriented mapping and analysis of IKONOS data in the Santa Barbara, CA region. The dataset consists of seven individual images acquired in April and May 2001.
We will describe the preprocessing of the data including the radiometric correction of atmospheric effects and derivation of reflectance values using field spectra. For image segmentation and classification we used the eCognition software system that provides state-of-the-art techniques of digital object-oriented image analysis. The derived land cover map was further analyzed with spatial metrics to derive an additional level of information related to urban land use and socioeconomic information. This study documents the potentials of the combined application of high spatial resolution space-borne IKONOS data, object-oriented image analysis algorithms and spatial metrics to allow a detailed and accurate mapping and analysis of urban land cover and land use.
2 DATA AND IMAGE PROCESSING
2.1 IKONOS data
The study is based on 7 individual multispectral IKONOS images (4 m spatial resolution) acquired in spring 2001 covering the Santa Barbara urban area (see Figure 1). The specific IKONOS image characteristics are shown in Table 1. The data were acquired on different dates with varying atmospheric and illumination conditions.
Main Image ID
Image ID
Acqu. Date
Acqu. Time
(GMT)
Sun Angle Azimuth
Sun Angle Elevation
75003 _000 4/22/2001 18:50 140.76 deg 63.27 deg
75009 _000 4/22/2001 18:50 141.27 deg 63.41 deg
_001 5/3/2001 18:52 138.36 deg 66.73 deg
75012 _000 5/3/2001 18:52 138.36 deg 66.73 deg
75015 _000 4/22/2001 18:50 140.76 deg 63.27 deg
_001 4/22/2001 18:51 141.16 deg 63.38 deg
75321 _000 7/5/2001 18:49 120.74 deg 70.20 deg Table 1: Characteristics of the IKONOS data
2.2 Field measurements and mapping
Ground reference data were acquired to characterize the field spectral properties of urban surfaces and to develop a basis for the training and validation of the image classification. Field spectra were recorded using an ASD field spectrometer. These data were used to identify the spectral properties of different urban surface categories, for radiometric calibration and atmospheric correction of the IKONOS data. Ground mapping and the selection of classification training and test sites were done by additional low altitude aerial photographic

flights and field observations using as a base a digital parcel and building dataset of the study area.
2.3 Image pre-processing
The IKONOS remote sensing datasets were acquired with initial geo-rectification completed. However, an accurate mosaic of the individual images required additional geometric correction.
This was done by standard polynominal transformation with 50-70 points per scene. Small portions of the images dominated by topography, the geo-rectification resulted in more locational error than the usual 1-2 pixel uncertainty. As most of the study area is flat, these errors did not justify the effort of a further correction using ortho-rectification.
Figure 1: Mosaic of seven IKONOS images (channels 4/3/2) of the Santa Barbara urban area shown with the extent of the urban area mapped from the data (in yellow) and the administrative boundaries of the urban sub-areas (in blue).
The atmospheric correction and reflectance retrieval is a mandatory preprocessing step for reduction of radiometric differences in the images given the differences in acquisition date between the individual images. The reflectance retrieval was based on an image inter-calibration approach to derive the reflectance values for the IKONOS data from ASD field reflectance spectra.
Figure 2: Spectral response function for 4 multi-spectral IKONOS bands in normalized transmittance values convolved to 10 nm increments.
The spectral response functions shown in Figure
2 were used to convolve IKONOS spectra from reference ASD field spectra of specific targets. The IKONOS spectral response functions are available
with 5 nm increments from the system operator Space Imaging.
Figure 3: Regression models used for reflectance inter-calibration of IKONOS and convolved ASD field spectra.
The spectral response functions were converted into normalized transmittance values with 10 nm increments (Figure 2), where the value represents the percent contribution of every ASD acquired band (in 10 nm bandwidth) to the signal of the specific IKONOS band. The image was transformed to reflectance using three dark (usually water or shade) and three bright (usually beach or light metal roofs) targets in the #75009 image.
This image covered the Santa Barbara downtown
area where most of the field spectra were recorded.
Goleta Santa Barbara Summerland Carpinteria
California

The reflectance retrieval applied ASD field spectra convolved to the individual IKONOS channels with a linear regression for each band (Figure 3). The results show a high correlation between IKONOS DN values (in relative radiance) and the ASD spectra with the highest blue band intercept showing the highest atmospheric distortion (primarily due to Rayleigh scattering). The other images were inter-calibrated the corrected image using the overlapping areas and applying a similar regression method as shown in Figure 3. Finally the seven corrected IKONOS images were merged to a mosaic (Figure 1). Examples of corrected IKONOS spectra are shown in Figure 4.
Figure 4: Examples of mean reflectance spectra for 11 different land cover types used in the image classification.
3 OBJECT-ORIENTED CLASSIFICATION
The first step in object-oriented analysis with eCognition is a segmentation of the image. This process extracts meaningful image objects (e.g. streets, houses, vegetation patches) based on their spectral and textural characteristics. In e*cognition the segmentation is a semi-automated process where the user can define specific parameters that influence size and shape of the resulting image segments. The resulting objects are attributed not only with spectral statistics but also with shape and context information, relation to neighboring objects and texture parameters. Given a spatial resolution of 4 m typical individual land cover objects (built up structures) are represented by several pixels. Figure 5 shows that in the NDVI image individual houses and built up structures (represented in dark) and their shapes are clearly visible.
Figure 5: NDVI image subset (top), color composite of channels 4,3,2 in 4 m spatial resolution (middle) and segmented image (bottom) derived from IKONOS.
The segmentation was performed by equally weighting of all 4 bands, using the following parameters: Scale 8, Color 0.7/Shape 0.3; Smoothness 0.4/Compactness 0.6. The scale parameter of eight is small but was chosen as most suitable to discriminate smaller targets like residential houses or swimming pools as individual image objects. Diagonal pixels were considered in delineation of the image objects in order to capture roads as linear features. This approach, however, caused some problems in the segmentation of individual houses as they are characterized by compact geometric shapes and were sometimes clumped with adjacent buildings or roads. This is a common characteristic of the segmentation process.

The results of the image segmentation are shown in Figure 6. It indicates the homogenization of specific image objects and the accurate representation of individual building structures. The IKONOS mosaic was 500 MB in size. Thus, the segmentation required extensive processing time and sophisticated computer hardware. The following image classification and analysis are based on the segmented image objects, rather than individual pixels. Thus, their processing required significantly less computing resources.
The image classification in eCognition is based
on user-defined fuzzy class descriptions based spectral and spatial features. Generally, the program uses a nearest neighbor algorithm, which performs class assignment based on minimum distance measures. The classification process can include a variety of different information, ranging from spectral mean values for each object, to measures of texture, context and shape. The goal of classification was to provide a detailed and accurate land cover product that forms the basis of further analysis of
urban structures and refinement of the thematic map towards representing land use and socioeconomic information for specific applications. Accordingly, the definition of the land cover classes had to be based upon the major land cover classes: bare soil, water, vegetation, non-photosynthetic vegetation and built up areas. Built up areas are represented by several different individual classes: for an analysis of spatial urban structure it is important to separate buildings from other classes such as roads, parking lots and swimming pools. Due to the spectral variability of roof targets different roof type classes were assigned for the classification (Figure 4). “Light Commercial Roofs” represent metal and asphalt roofs mainly found in commercial and industrial areas. “Light Residential Roofs” include light composite shingle, tile and gravel roofs with different colors. “Dark Residential Roofs” represent dark colored composite shingle, tile and wood shingle roofs. “Red Tile Roofs” form an individual class due to their specific spectra.
Figure 6: eCognition classification result (bottom) compared to IKONOS false color composite (ul) and digital data representing house and roads overlaid the NDVI.
The spectral characteristics of the classes are presented in Figure 4 showing the vegetation, water and swimming pools with their unique spectra. The other classes, especially the built up targets, have a similar spectral shape and their spectral contrast is mainly due to brightness differences. This shows the limitations of the IKONOS data in separation of those important classes on a pure spectral basis (Herold et al. 2002b). Accordingly, the classification process also included additional spatial and contextual information in order to evaluate their contribution.
The classification in eCognition was
implemented as hierarchical system with Level I classes: water, built up, vegetation and non-vegetated bare land surfaces. The eleven classes used and described before are assigned as Level II and Level III classes (see Figure 6). The Level I classes were separated using spectral information (nearest neighbor distance) except for bare soil/beach/bare rock areas which were constrained by a minimum object size to avoid their confusion with specific roof types. Another minimum size rule was applied for water bodies in order to specify additional separation criterion for shadows and swimming pools. The Level II built up class, (Roofs and Transportation Areas) were separated using spectral and shape information. Usually roads are determined by a linear structure whereas buildings have more compact shapes. We used the length/width ratio of objects to represent this feature in the classification process. The classification of different roof types (Level III classes) applied principally spectral information. During the classification process it was obvious that some classes were not succesfully separated. Accordingly some classes were merged: light commercial and residential roofs; parking lots with roads; bare soil
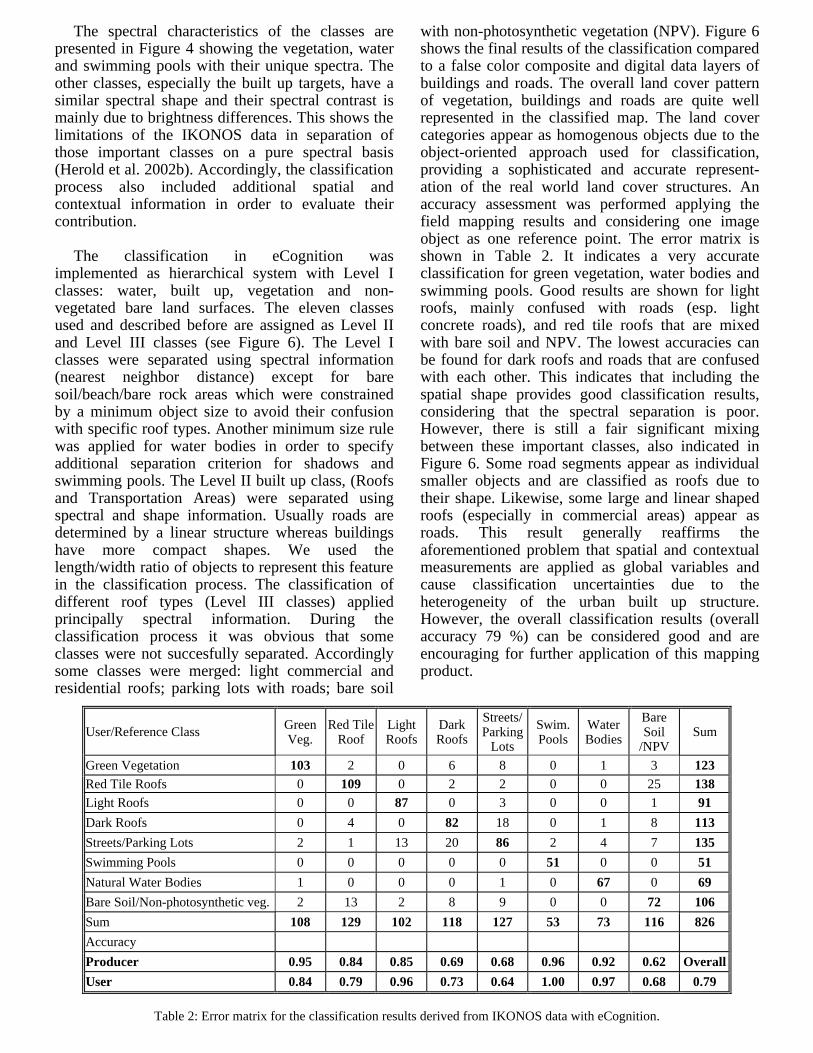
with non-photosynthetic vegetation (NPV). Figure 6 shows the final results of the classification compared to a false color composite and digital data layers of buildings and roads. The overall land cover pattern of vegetation, buildings and roads are quite well represented in the classified map. The land cover categories appear as homogenous objects due to the object-oriented approach used for classification, providing a sophisticated and accurate represent-ation of the real world land cover structures. An accuracy assessment was performed applying the field mapping results and considering one image object as one reference point. The error matrix is shown in Table 2. It indicates a very accurate classification for green vegetation, water bodies and swimming pools. Good results are shown for light roofs, mainly confused with roads (esp. light concrete roads), and red tile roofs that are mixed with bare soil and NPV. The lowest accuracies can be found for dark roofs and roads that are confused with each other. This indicates that including the spatial shape provides good classification results, considering that the spectral separation is poor. However, there is still a fair significant mixing between these important classes, also indicated in Figure 6. Some road segments appear as individual smaller objects and are classified as roofs due to their shape. Likewise, some large and linear shaped roofs (especially in commercial areas) appear as roads. This result generally reaffirms the aforementioned problem that spatial and contextual measurements are applied as global variables and cause classification uncertainties due to the heterogeneity of the urban built up structure. However, the overall classification results (overall accuracy 79 %) can be considered good and are encouraging for further application of this mapping product.
Table 2: Error matrix for the classification results derived from IKONOS data with eCognition.
User/Reference Class Green Veg.
Red Tile Roof
Light Roofs
Dark Roofs
Streets/ Parking
Lots
Swim. Pools
Water Bodies
Bare Soil
/NPV Sum
Green Vegetation 103 2 0 6 8 0 1 3 123 Red Tile Roofs 0 109 0 2 2 0 0 25 138 Light Roofs 0 0 87 0 3 0 0 1 91 Dark Roofs 0 4 0 82 18 0 1 8 113 Streets/Parking Lots 2 1 13 20 86 2 4 7 135 Swimming Pools 0 0 0 0 0 51 0 0 51 Natural Water Bodies 1 0 0 0 1 0 67 0 69 Bare Soil/Non-photosynthetic veg. 2 13 2 8 9 0 0 72 106 Sum 108 129 102 118 127 53 73 116 826 Accuracy Producer 0.95 0.84 0.85 0.69 0.68 0.96 0.92 0.62 Overall User 0.84 0.79 0.96 0.73 0.64 1.00 0.97 0.68 0.79

4 SPATIAL METRIC ANALYSIS
To further analyze and refine the land cover mapping product, we applied a set of spatial metrics to describe the built up structure in the study area and to explore the ability to represent land use pattern and socioeconomic characteristics. Spatial metrics are a useful tool to quantify structures and pattern in a landscape represented in a thematic map or classified data set. They are commonly used in landscape ecology (landscape metrics, Gustafson 1998). Recently, there has been an increasing interest in applying spatial metrics concept in an urban environment, emphasizing the strong spatial component in between objects of urban structure and related dynamics of change and growth processes (Barnsley and Barr 1997, Bauer and Steinnocher 2000, Alberti and Waddell 2000, Herold et al. 2002a). Figure 7 shows an example of applying this
concept to a thematic subset of classification result in the Santa Barbara region. The spatial metrics were derived from a binary layer of buildings derived from the land cover classification. The metric values for Patch Density, in this case housing density, and Contagion (a measure of landscape complexity) were calculated for a local circular area as spatial domain with 200 meter radius using the program FRAGSTATS (McGarical et al. 2002). The four maps represent the population density (from Census 2000 block level), the major land uses and the distribution of two spatial metrics. Comparing the patch density spatial distribution with the population density distribution, they show a similar pattern with higher population density for increased patch density. The Contagion represents the land use pattern quite well, with high values for low- density residential, intermediate values for medium and higher-density residential and the lowest values for commercial and industrial and highly populated areas.
Figure 7: Comparison of the population density (Census 2000 block data) and the major land use classes (mapped from 1998 airphotos) with the spatial distribution of two spatial metrics for the Santa Barbara, CA region.

Although these maps cannot really be compared
in quantitative terms due to the different spatial domain upon which they are based (also know as modifiable area unit problem), they clearly show the ability of the approach to represent specific spatial characteristics in urban areas. Given the high spatial resolution of the remote sensing data, it is possible to capture more spatial variability than traditional datasets such as CENSUS (Donnay and Unwin 2001, Liu 2002).
5 SUMMARY
This paper explores an object-oriented approach to address and investigate specific problems and challenges in high-resolution mapping and analysis of larger urban areas. The study applied a set of seven IKONOS images acquired in the Santa Barbara urban area. Given the sensor capabilities and the spatial and spectral complexity of the urban environment, image segmentation and object-oriented classification provide a useful approach to map urban land cover with good separation of important categories (e.g. built/non-built up, roads/roofs). The overall accuracy achieved was 79 %. The incorporation and further analysis of the land cover product using spatial metrics provide and additional level of information and relate the physical built up structure to urban land use and socioeconomic characteristics.
6 ACKNOWLEDGEMENT
The authors gratefully acknowledge the support provided for this research by the U.S. Department of Transportation, Research and Special Programs Administration, OTA# DTRS-00-T-0002 and the National Aeronautics and Space Administration Earth Science Enterprise Research Grant NAG5-3620.
7 REFERENCES
Alberti, M. and Waddell, P., 2000. An Integrated Urban Development and Ecological Simulation Model. Integrated Assessment, 1, pp. 215-227.
Bauer, T. and Steinnocher, K. 2000. Objektorientierte Auswertung von hochaufloesenden Fernerkundungsdaten in urbanen Raeumen, in Strobl, J. et al. eds. Angewandte Geographische Informationsverarbeitung XII. Proceedings of the AGIT Symposium Salzburg, Wichmann, pp. 30-38.
Bauer, T. & Steinnocher, K. (2001): Per-parcel land use classification in urban areas applying a rule-based technique. – In: GeoBIT, Jg. 6, Vol. 6, S. 24-27.
Barnsley, M.J., S.L. Barr, A. Hamid, P.A.L. Muller, G.J. Sadler, and J.W. Shepherd, 1993. Analytical Tools to
Monitor Urban Areas. Mather, P.M. (ed). Geographical Information Handling-Research and Applications. pp. 147-184.
Barnsley, M.J., and Barr, S.L., 1997. A graph based structural pattern recognition system to infer urban land-use from fine spatial resolution land-cover data. Computers, Environment and Urban Systems, 21(3/4), pp. 209-225.
Blaschke, T. & Strobl, J. (2001): What’s wrong with pixels?: Some recent developments interfacing remote sensing and GIS. – In: GeoBIT, Jg. 6, Vol. 6, S. 12-17.
Donnay J. P. and Unwin D. 2001. Modelling geographical distributions in urban areas, in Donnay, J.P., Barnsley, M.J. and Longley, P.A. (eds.), Remote sensing and urban analysis, Taylor and Francis, London and New York, pp. 205-224.
Golledge, R. G. 1995. Primitives of spatial knowledge, in Nyerges et al., Cognitive aspects of human-computer interaction for Geographic Information Systems, pp. 29-44.
Gustafson, E.J., 1998. Quantifying landscape spatial pattern: what is the state of the art? Ecosystems, 1, pp. 143-156.
Haack, B. N., Guptill, S. C., Holz, R. K., Jampoler, S. M., Jensen, J. R. and Welch, R. A. 1997. Urban analysis and planning, in Philipson et al. eds. Manual of photographic interpretation, 2. Ed, pp. 517-554.
Herold, M., Clarke, K. C. and Scepan, J., 2002. Remote Sensing and Landscape Metrics to describe Structures and Changes in Urban Landuse. Environment and Planning A (in press).
Herold, M., Gardner, M., Hadley, B. and Roberts, D. 2002b. The spectral dimension in urban land cover mapping from high-resolution optical remote sensing data, Proceedings of the 3rd Symposium on Remote Sensing of Urban Areas, June 2002, Istanbul, Turkey, on CD Rom.
Liu, X. and Clarke, K. C. 2002. Estimation of residential population using high resolution satellite imagery, Proceedings of the 3rd Symposium on Remote Sensing of Urban Areas, June 2002, Istanbul, Turkey, on CD Rom.
McGarigal, K., Cushman, S.A., Neel, M.C. and Ene., E., 2002. FRAGSTATS: Spatial Pattern Analysis Program for Categorical Maps. URL: www.umass.edu/landeco/ research/fragstats/fragstats.html (March 2002).
Mehldau, G. and Schowengerdt, R. A. 1990. A C-extension for rule based image classification systems, Photogrammetric Engineering and Remote Sensing, 56, 6, pp. 887-892.
Moller-Jensen, L. 1990. Knowledge-based classification of an urban area using texture and context information in Landsat TM imagery, Photogrammetric Engineering and Remote Sensing, 56, 6, pp. 899-904.
Weber, C., 2001. Remote sensing data used for urban agglomeration delimitation. Donnay, J.P., Barnsley, M.J. and Longley, P.A. (eds.), Remote sensing and urban analysis, Taylor and Francis, London and New York, pp. 155-167.
Webster, C. J. 1995. Urban morphological fingerprints, Environment and Planning B, 22, pp. 279-297.
Willhauck, G. (2000): Analyse der Veränderung in der Wald- Weidevegetation im Zeitraum von 1960 bis 1996 in Feuerland auf Basis von objektorientierter und pixelbasierter Klassifizierung von Fernerkundungsdaten. – unveröffentlichte, Diplomarbeit am Lehrstuhl für Landnutzungsplanung und Naturschutz, Forst-wissenschaftliche Fakultät, TU München.