earthquake distribution in northeast india from 1961-2010 · 2018-09-28 · plate-boundary...
TRANSCRIPT

International Journal of Scientific Engineering and Research (IJSER) www.ijser.in
ISSN (Online): 2347-3878, Impact Factor (2015): 3.791
Volume 4 Issue 7, July 2016 Licensed Under Creative Commons Attribution CC BY
Earthquake Distribution in Northeast India from
1961-2010
Abong A. A.1, George A. M.
2, Awhuwhe E. A.
3
1Department of Physics, Cross River University of Technology, P.M.B 1123, Calabar – Nigeria
2Department of Physics, University of Calabar, P.M.B 1115, Calabar – Nigeria 3Ministry of Solid Minerals Development, Governor’s Office Calabar – Nigeria
Abstract: This study investigated earthquake distribution in Northeast India from 1961 to 2010 with body wave magnitude, Mb 2.9.
Measure of central tendencies and spread, bar chart, pie chart, scatter plot were the statistical tools used. The data were obtained from
International Seismological Centre (ISC) On-line Bulletin, United Kingdom from 1st January 1961 to 31
st December, 2010 (50years).
Frequency-Magnitude Relationship was employed and the constants were calculated to be a=6.80 and b=0.93. The findings of the study
revealed that Northeast India is characterized majorly by minor and light earthquakes with low spatial spread. The rate of seismic activity
for magnitude range 2.0-2.9, 3.0-3.9 is regular while for 4.0-4.9, 5.0-5.9 and 6.0-6.9 are irregular or fluctuating. It therefore implies that
these trends may continue in future, but the probability of occurrence of great earthquake is low. However, one has to take caution
because tectonic activities of deformation and uncertainties of occurrence of earthquake are not well understood. Hence, the possibility of
occurrence of large earthquakes as a result of uncertainties associated with earthquake predictions, especially in intraplate and
plate-boundary regions.
Keywords: Frequency-Magnitude relationship, seismicity, seismotectonic, epicentre, intraplate region, plate-boundary region.
1. Introduction
The occurrence of earthquake around the world has
attracted the attention of many seismologists and
researchers. This global disaster is always in the headlines
of the social media. Earthquakes occur as a result of
movements along the faults that have evolved through
geological and tectonic processes. These are most
disastrous of all the natural disasters as they affect large
areas causing death, injuries, floods, fires and destruction
of physical resources on a massive scale [5]. These occur
without any early warning and are therefore unpredictable.
The extent to which an earthquake can cause damage
depends on its magnitude, location and time. The deaths
recorded during an earthquake mostly occur as a result of
collapse of the buildings.
Northeast India has the highest level of seismic hazard
potential [6]. The region has experienced two great
earthquakes, Shillong Earthquake of 1897 and Assam
Earthquake of 1950. According to the Global Seismic
Hazard Assessment Programme (GSHAP), this region is of
high risk with peak acceleration increasing in the range
0.35-0.40g [7]. The rapid population density and
urbanization in the northeast India has resulted in the
construction of storey structures different from
Assam-type buildings at the time of occurrence of great
earthquakes, thereby increasing the vulnerability of these
structures to earthquakes.
The seismologist’s aim is to predict occurrence of
earthquake by studying past and future events so as to
reduce the effect of earthquake damage on both man and
property.
In this paper, our objective is to provide useful information
on the distribution and frequency of occurrence of
earthquakes in Northeast India.
2. Materials and Method
2.1 Seismicity and seismotectonic of Northeast India
Northeast India is among the six most seismically active
regions of the world, the other being Mexico, Taiwan,
California, Japan and Turkey. It is situated at the junction
of Himalayan arc to the north and Burmese arc to the east
[5]. The region has experienced eighteen (18) large
earthquakes )7( M during the last hundred years which
includes the great earthquakes of Shillong (1897,
7.8M ) and Assam-Tibet border (1950, )7.8M .
Other small and micro earthquakes have also been
experienced in this region is as a result of the collision
tectonics between the Indian plate and the Eurasian plate in
the north and seduction tectonics along the Indo-Myanmar
range (IMR) in the east [2], [3] and [4].
Northeastern region is divided into five seismotectonic
zones (Figure1). These include Zone-A
Eastern-Himalayan collision, which is associated with a
series of north heading thrusts. The most important thrusts
are the Main Boundary Thrust (MBT), Main Central
Thrust (MCT) and Main Frontal Thrust (MFT). Zone-B is
also called the Syntaxis Zone which is the meeting place of
Himalayan and Burmese Arc. The main fracture of this
zone is Mishmi Thrust, Lohit Thrust and a part of Disang
Thrust. Zone-C, the Indo-Burma range is characterized by
Arakan Yoma, Chin Hills, Sagaing Fault and Schuppon
Belt which is mainly situated by Naga and Disang Thrust.
Zone-D is plate boundary zone of Shillong plateau and
Assam valley is made up of Shillong Massif, Mikir Hills,
Tista Fault, Dhubri Fault, Kopili Lineament, Dapsy Thrust,
a part of Naga Thrust and a part of Brahmaputra Fault. The
southern margin of the Shillong Massif is characterized by
the Dauki Fault which has been interpreted to have strike
slip displacement [9]. Zone-E consists of Bengal Basin and
Tripura-Mizo Fold Belt. The main fractures of this zone
Paper ID: IJSER15870 1 of 6

International Journal of Scientific Engineering and Research (IJSER) www.ijser.in
ISSN (Online): 2347-3878, Impact Factor (2015): 3.791
Volume 4 Issue 7, July 2016 Licensed Under Creative Commons Attribution CC BY
are Padma Fault, Yamuna Fault, Kaladan Fault and Tapu
Thrust.
Northeast India is associated with low seismicity and is
due to intraplate activity while Tripura folded belt is
characterized by moderate seismicity is as a result of
plate-boundary activity. The Srimangal earthquake of 1918
(M=7.6) happened beneath the Bengal basin along the
Sylhet fault. Cachar earthquake of 1984 happened in the
Tripura fold belt likely as a result of movement along the
Sylhet fault.
Figure 1: Map of the study area (After [8])
2.2 Method
The data set for this work were downloaded from the
International Seismological Centre (ISC) On-line Bulletin,
United Kingdom [10]. The selected data consisted of
natural earthquakes with Mb ≥2.9 for the study area from
1st January 1961 to 31st December 2010 (50years) with
focal depth from 0-700km. The data set comprised date of
occurrence of earthquake, origin time, coordinates of
epicentre, magnitude, event identification, focal depth of
earthquake and event type E. The region of study is
situated within the coordinates 21.00-29.50N and 88.00E -
97.50E (Figure 1). A total of 2940 events were used in the
study.
[11] developed a relationship for the frequency–magnitude
distribution (FMD), in the form:
LogN = a –bM (1)
For a given region and time interval, eqn(1) gives the
cumulative number of earthquakes (N) with magnitude
(M), where a and b are positive, real constants. The
parameter a describes the seismic activity. It is determined
by the event rate and for a given region depends on the
volume and time window used. The b parameter is a
tectonic parameter that describes the properties of the
seismic medium.
3. Results
The results of the study are shown (Table 1 to Table 4) and
Figure 2 to Figure 5.
Paper ID: IJSER15870 2 of 6
International Journal of Scientific Engineering and Research (IJSER) www.ijser.in
ISSN (Online): 2347-3878, Impact Factor (2015): 3.791
Volume 4 Issue 7, July 2016 Licensed Under Creative Commons Attribution CC BY
Table 1: Distribution of events based on magnitude for each year Year/Mag. 2.0-2.9 3.0-3.9 4.0-4.9 5.0-5.9 6.0-6.9 Total
1961 0 0 0 0 0 0
1962 0 0 0 1 1 2
1963 0 0 0 1 0 1
1964 0 0 6 15 2 23
1965 0 0 3 10 0 13
1966 0 0 13 5 0 18
1967 0 0 17 7 0 24
1968 0 0 8 3 0 11
1969 0 0 9 7 1 17
1970 0 0 10 8 1 19
1971 0 0 7 9 0 16
1972 0 0 10 3 0 13
1973 0 0 14 3 0 17
1974 0 0 20 1 0 21
1975 0 0 17 8 0 25
1976 0 0 14 1 1 16
1977 0 0 11 5 0 16
1978 0 0 36 4 0 40
1979 0 1 35 6 0 42
1980 0 0 28 2 1 31
1981 0 1 34 3 0 38
1982 0 1 37 7 0 45
1983 0 0 25 13 0 38
1984 0 1 32 12 0 45
1985 0 2 31 5 0 38
1986 0 0 24 9 0 33
1987 0 1 35 6 0 42
1988 0 4 46 7 0 57
1989 0 4 41 10 0 55
1990 0 3 41 3 1 48
1991 0 6 49 9 1 65
1992 0 18 53 6 0 77
1993 0 22 54 2 0 78
1994 0 15 43 7 0 65
1995 0 11 60 2 1 74
1996 0 40 75 4 0 119
1997 0 38 57 5 0 100
1998 0 40 37 6 0 83
1999 0 25 48 4 0 77
2000 0 36 40 4 1 81
2001 0 42 49 4 0 95
2002 1 90 31 2 1 125
2003 0 90 53 2 0 145
2004 0 98 58 1 0 157
2005 0 58 39 7 0 104
2006 0 64 39 5 0 108
2007 0 98 41 2 0 141
2008 0 108 51 1 0 160
2009 0 98 39 7 1 145
2010 0 105 31 1 0 137
Total 1 1120 1551 255 13 2940
Table 2: Distribution of magnitude, frequency and cumulative frequency Mb Frequency N Cumulative N
2.9 1 2940
3.0 2 2939
3.1 14 2937
3.2 21 2923
3.3 53 2902
3.4 103 2849
3.5 142 2746
3.6 161 2604
3.7 171 2443
Paper ID: IJSER15870 3 of 6
International Journal of Scientific Engineering and Research (IJSER) www.ijser.in
ISSN (Online): 2347-3878, Impact Factor (2015): 3.791
Volume 4 Issue 7, July 2016 Licensed Under Creative Commons Attribution CC BY
3.8 222 2272
3.9 231 2050
4.0 217 1819
4.1 180 1602
4.2 176 1422
4.3 193 1246
4.4 150 1053
4.5 164 903
4.6 156 739
4.7 140 583
4.8 107 443
4.9 68 336
5.0 74 268
5.1 49 194
5.2 44 145
5.3 24 101
5.4 26 77
5.5 10 51
5.6 6 41
5.7 11 35
5.8 5 24
5.9 6 19
6.0 5 13
6.1 3 8
6.2 2 5
6.3 1 3
6.4 1 2
6.6 1 1
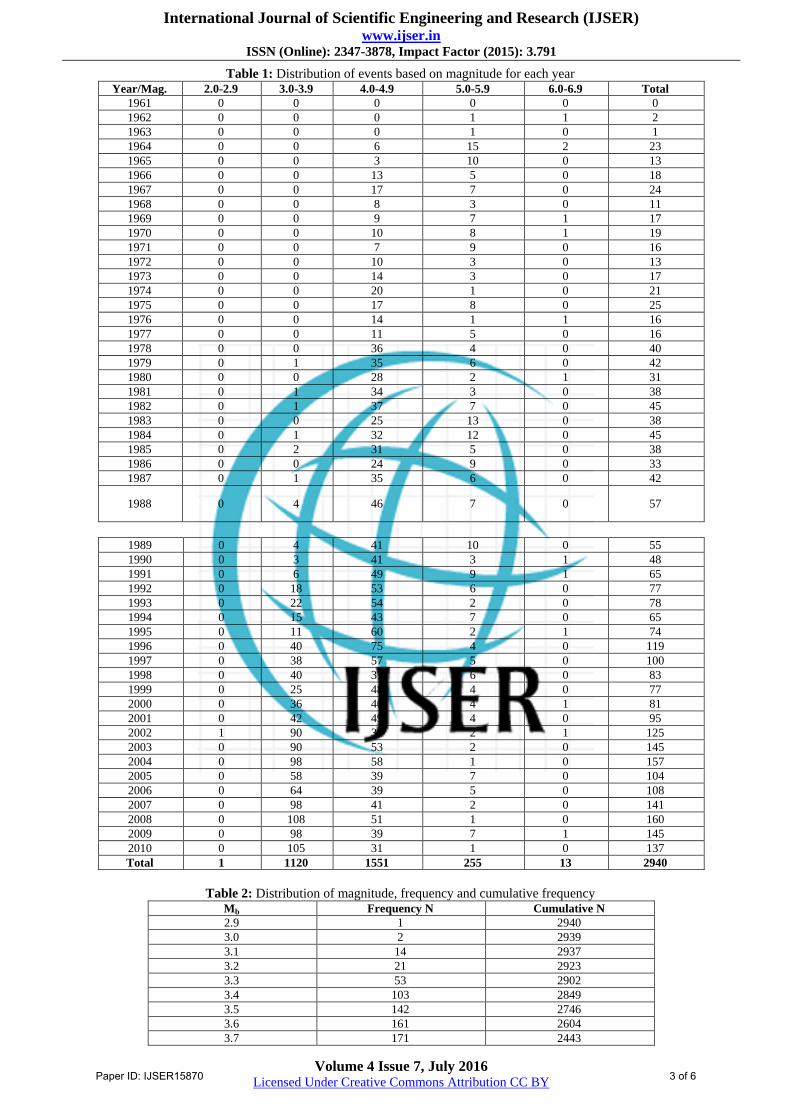
Table 3: Distribution of events based on frequency at an interval of 10-years Year/Mag. 2.0-2.9 3.0-3.9 4.0-4.9 5.0-5.9 6.0-6.9 Total
1961-1970 0 0 66 57 5 128
1971-1980 0 1 192 42 2 237
1981-1990 0 17 346 75 2 440
1991-2000 0 251 516 49 3 819
2001-2010 1 851 431 32 1 1316
From Table 3, the interval of 10 years was employed as
follows: (1961-1970), (1971-1980), (1981-1990),
(1991-2000) and (2001-2010). The frequency distribution
of earthquakes that occurred within the time interval of 10
years in 2001-2010 was higher than previous 10 years
interval. i.e. the frequency distribution increased from the
time interval 1961-1970 to 2001-2010. This implies that
the relative motion between the plates and plate-boundary
is increasing with time and this gives rise to large
accumulation of tectonic stress. The accumulated stress
was the cause of increase of the number of events with
time. The decrease in magnitude 6.0-6.9 from 3 during the
fourth 10 years to 1 during the last 10 years indicates that a
devastating earthquake is on the decrease in the study area
(Table 3 and Figur2).
Table 4: Central tendency and spread Depth(m) Magnitude
Mean 62.85 4.19
Median 52.65 4.1
Mode 33 3.9
Standard
Deviation 41.45 0.55
The central tendency was carried out to get rough estimate
of the average magnitude and the spread.
For these purposes mean, mode, median and standard
deviation were calculated for magnitude and depth values
(Table 4).
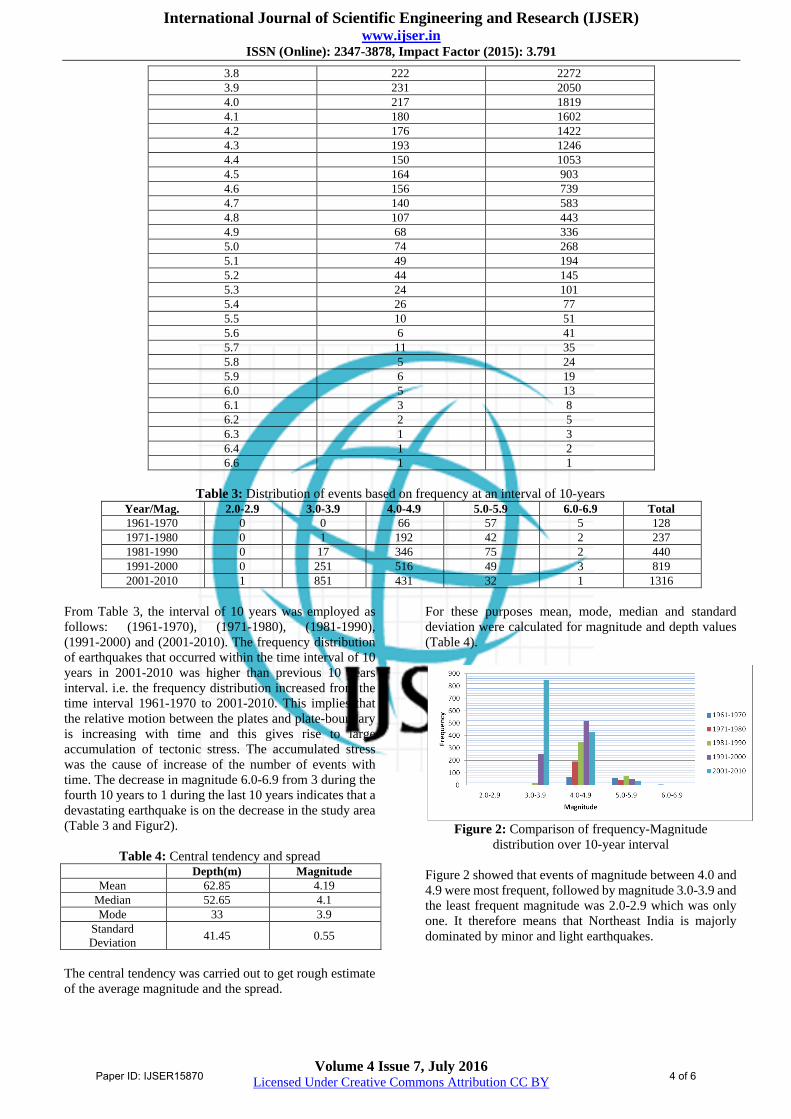
Figure 2: Comparison of frequency-Magnitude
distribution over 10-year interval
Figure 2 showed that events of magnitude between 4.0 and
4.9 were most frequent, followed by magnitude 3.0-3.9 and
the least frequent magnitude was 2.0-2.9 which was only
one. It therefore means that Northeast India is majorly
dominated by minor and light earthquakes.
Paper ID: IJSER15870 4 of 6
International Journal of Scientific Engineering and Research (IJSER) www.ijser.in
ISSN (Online): 2347-3878, Impact Factor (2015): 3.791
Volume 4 Issue 7, July 2016 Licensed Under Creative Commons Attribution CC BY
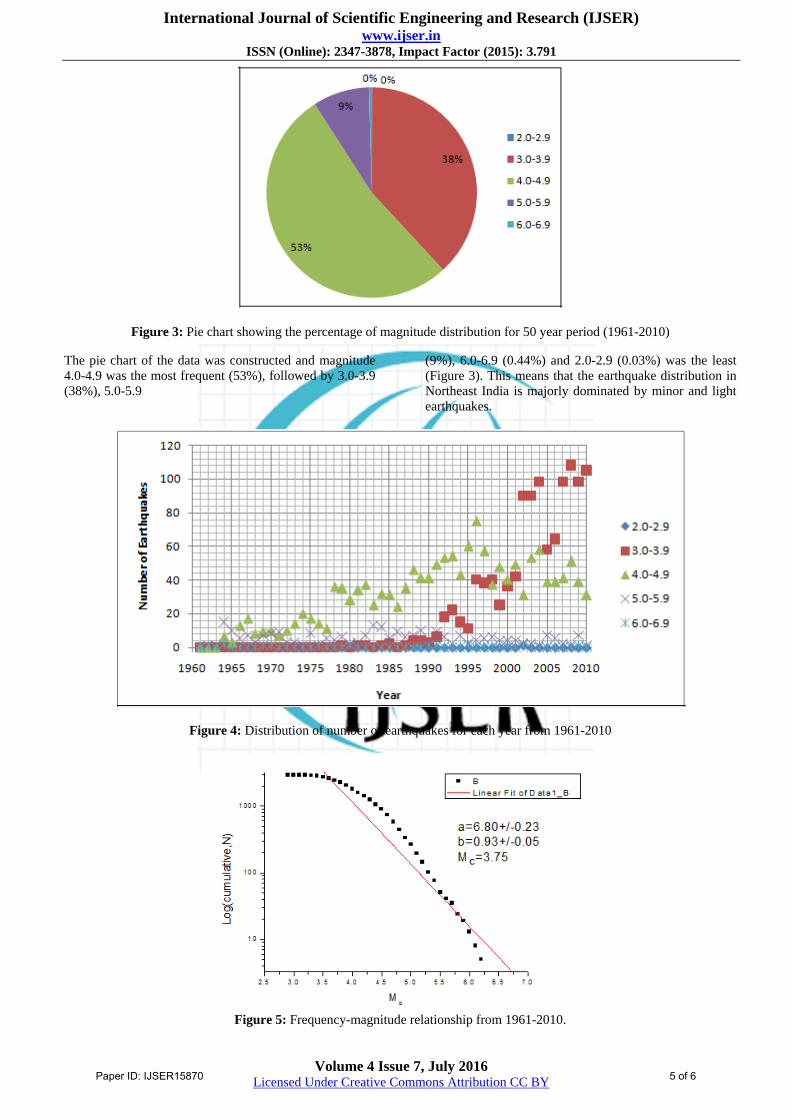
Figure 3: Pie chart showing the percentage of magnitude distribution for 50 year period (1961-2010)
The pie chart of the data was constructed and magnitude
4.0-4.9 was the most frequent (53%), followed by 3.0-3.9
(38%), 5.0-5.9
(9%), 6.0-6.9 (0.44%) and 2.0-2.9 (0.03%) was the least
(Figure 3). This means that the earthquake distribution in
Northeast India is majorly dominated by minor and light
earthquakes.
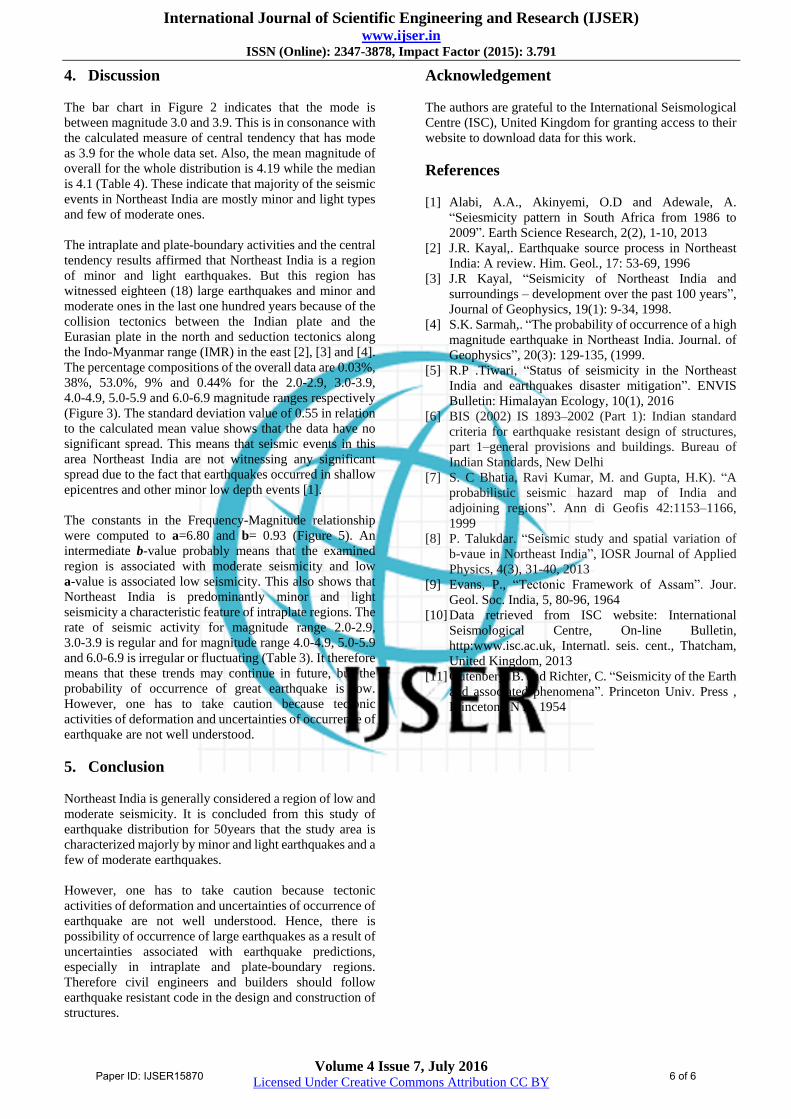
Figure 4: Distribution of number of earthquakes for each year from 1961-2010
Figure 5: Frequency-magnitude relationship from 1961-2010.
Paper ID: IJSER15870 5 of 6
International Journal of Scientific Engineering and Research (IJSER) www.ijser.in
ISSN (Online): 2347-3878, Impact Factor (2015): 3.791
Volume 4 Issue 7, July 2016 Licensed Under Creative Commons Attribution CC BY
4. Discussion
The bar chart in Figure 2 indicates that the mode is
between magnitude 3.0 and 3.9. This is in consonance with
the calculated measure of central tendency that has mode
as 3.9 for the whole data set. Also, the mean magnitude of
overall for the whole distribution is 4.19 while the median
is 4.1 (Table 4). These indicate that majority of the seismic
events in Northeast India are mostly minor and light types
and few of moderate ones.
The intraplate and plate-boundary activities and the central
tendency results affirmed that Northeast India is a region
of minor and light earthquakes. But this region has
witnessed eighteen (18) large earthquakes and minor and
moderate ones in the last one hundred years because of the
collision tectonics between the Indian plate and the
Eurasian plate in the north and seduction tectonics along
the Indo-Myanmar range (IMR) in the east [2], [3] and [4].
The percentage compositions of the overall data are 0.03%,
38%, 53.0%, 9% and 0.44% for the 2.0-2.9, 3.0-3.9,
4.0-4.9, 5.0-5.9 and 6.0-6.9 magnitude ranges respectively
(Figure 3). The standard deviation value of 0.55 in relation
to the calculated mean value shows that the data have no
significant spread. This means that seismic events in this
area Northeast India are not witnessing any significant
spread due to the fact that earthquakes occurred in shallow
epicentres and other minor low depth events [1].
The constants in the Frequency-Magnitude relationship
were computed to a=6.80 and b= 0.93 (Figure 5). An
intermediate b-value probably means that the examined
region is associated with moderate seismicity and low
a-value is associated low seismicity. This also shows that
Northeast India is predominantly minor and light
seismicity a characteristic feature of intraplate regions. The
rate of seismic activity for magnitude range 2.0-2.9,
3.0-3.9 is regular and for magnitude range 4.0-4.9, 5.0-5.9
and 6.0-6.9 is irregular or fluctuating (Table 3). It therefore
means that these trends may continue in future, but the
probability of occurrence of great earthquake is low.
However, one has to take caution because tectonic
activities of deformation and uncertainties of occurrence of
earthquake are not well understood.
5. Conclusion
Northeast India is generally considered a region of low and
moderate seismicity. It is concluded from this study of
earthquake distribution for 50years that the study area is
characterized majorly by minor and light earthquakes and a
few of moderate earthquakes.
However, one has to take caution because tectonic
activities of deformation and uncertainties of occurrence of
earthquake are not well understood. Hence, there is
possibility of occurrence of large earthquakes as a result of
uncertainties associated with earthquake predictions,
especially in intraplate and plate-boundary regions.
Therefore civil engineers and builders should follow
earthquake resistant code in the design and construction of
structures.
Acknowledgement
The authors are grateful to the International Seismological
Centre (ISC), United Kingdom for granting access to their
website to download data for this work.
References
[1] Alabi, A.A., Akinyemi, O.D and Adewale, A.
“Seiesmicity pattern in South Africa from 1986 to
2009”. Earth Science Research, 2(2), 1-10, 2013
[2] J.R. Kayal,. Earthquake source process in Northeast
India: A review. Him. Geol., 17: 53-69, 1996
[3] J.R Kayal, “Seismicity of Northeast India and
surroundings – development over the past 100 years”,
Journal of Geophysics, 19(1): 9-34, 1998.
[4] S.K. Sarmah,. “The probability of occurrence of a high
magnitude earthquake in Northeast India. Journal. of
Geophysics”, 20(3): 129-135, (1999.
[5] R.P .Tiwari, “Status of seismicity in the Northeast
India and earthquakes disaster mitigation”. ENVIS
Bulletin: Himalayan Ecology, 10(1), 2016
[6] BIS (2002) IS 1893–2002 (Part 1): Indian standard
criteria for earthquake resistant design of structures,
part 1–general provisions and buildings. Bureau of
Indian Standards, New Delhi
[7] S. C Bhatia, Ravi Kumar, M. and Gupta, H.K). “A
probabilistic seismic hazard map of India and
adjoining regions”. Ann di Geofis 42:1153–1166,
1999
[8] P. Talukdar. “Seismic study and spatial variation of
b-vaue in Northeast India”, IOSR Journal of Applied
Physics, 4(3), 31-40, 2013
[9] Evans, P., “Tectonic Framework of Assam”. Jour.
Geol. Soc. India, 5, 80-96, 1964
[10] Data retrieved from ISC website: International
Seismological Centre, On-line Bulletin,
http:www.isc.ac.uk, Internatl. seis. cent., Thatcham,
United Kingdom, 2013
[11] Gutenberg, B. and Richter, C. “Seismicity of the Earth
and associated phenomena”. Princeton Univ. Press ,
Princeton , NY., 1954
Paper ID: IJSER15870 6 of 6