earthquake response evaluation of rc frames using high strength … · · 2010-08-23in moment...
TRANSCRIPT
Pak. J. Engg. & Appl. Sci. Vol. 4, Jan 2009 (p. 1-14)
1
1. Introduction
Despite advances in recent years it is still difficult
to predict the characteristics of future earthquakes.
Failures in 1994 Northridge and 1995 Kobe earthquakes demonstrate the need to search new
materials and systems to built safer structures. In an
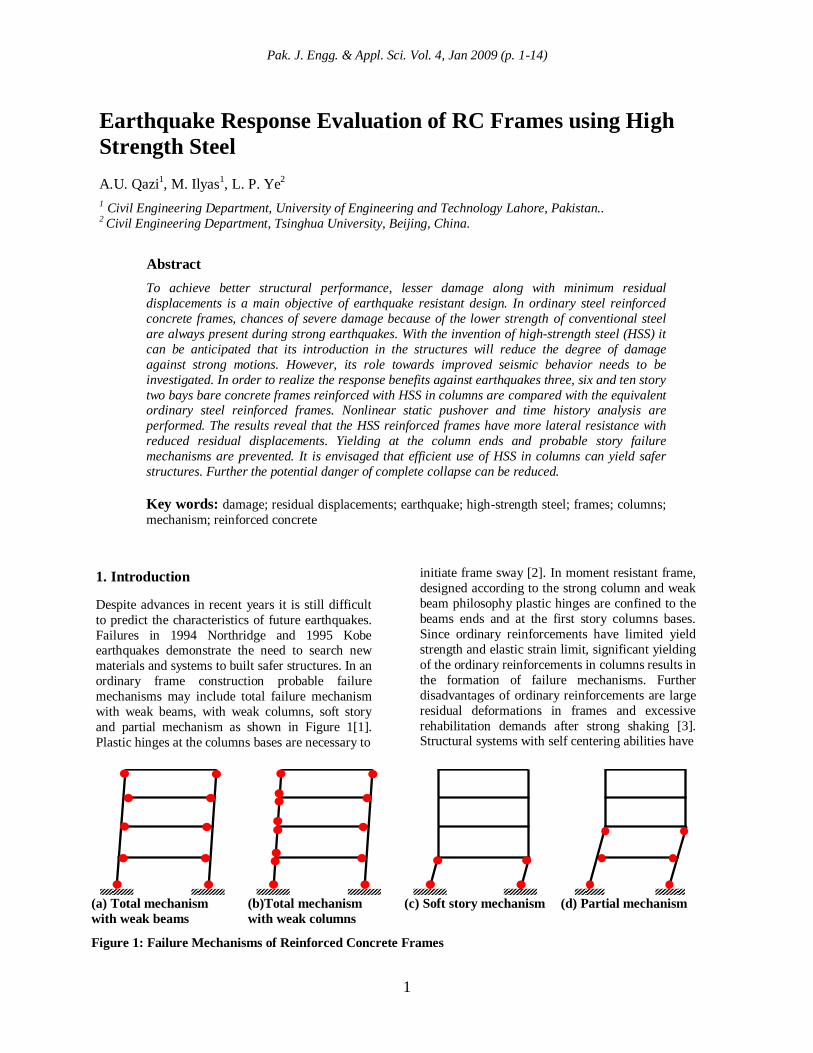
ordinary frame construction probable failure
mechanisms may include total failure mechanism
with weak beams, with weak columns, soft story
and partial mechanism as shown in Figure 1[1].
Plastic hinges at the columns bases are necessary to
initiate frame sway [2]. In moment resistant frame,
designed according to the strong column and weak
beam philosophy plastic hinges are confined to the
beams ends and at the first story columns bases.
Since ordinary reinforcements have limited yield
strength and elastic strain limit, significant yielding
of the ordinary reinforcements in columns results in
the formation of failure mechanisms. Further
disadvantages of ordinary reinforcements are large
residual deformations in frames and excessive
rehabilitation demands after strong shaking [3]. Structural systems with self centering abilities have
Earthquake Response Evaluation of RC Frames using High
Strength Steel
A.U. Qazi1, M. Ilyas
1, L. P. Ye
2
1 Civil Engineering Department, University of Engineering and Technology Lahore, Pakistan.. 2 Civil Engineering Department, Tsinghua University, Beijing, China.
Abstract
To achieve better structural performance, lesser damage along with minimum residual
displacements is a main objective of earthquake resistant design. In ordinary steel reinforced
concrete frames, chances of severe damage because of the lower strength of conventional steel
are always present during strong earthquakes. With the invention of high-strength steel (HSS) it
can be anticipated that its introduction in the structures will reduce the degree of damage
against strong motions. However, its role towards improved seismic behavior needs to be
investigated. In order to realize the response benefits against earthquakes three, six and ten story
two bays bare concrete frames reinforced with HSS in columns are compared with the equivalent ordinary steel reinforced frames. Nonlinear static pushover and time history analysis are
performed. The results reveal that the HSS reinforced frames have more lateral resistance with
reduced residual displacements. Yielding at the column ends and probable story failure
mechanisms are prevented. It is envisaged that efficient use of HSS in columns can yield safer
structures. Further the potential danger of complete collapse can be reduced.
Key words: damage; residual displacements; earthquake; high-strength steel; frames; columns;
mechanism; reinforced concrete
(a) Total mechanism
with weak beams (b)Total mechanism
with weak columns (c) Soft story mechanism (d) Partial mechanism
Figure 1: Failure Mechanisms of Reinforced Concrete Frames
Pak. J. Engg. & Appl. Sci. Vol. 4, Jan 2009
2
utilized un-bonded post tensioned steel tendons in
precast concrete [4, 5, 6] in steel structures [7] and
in concrete bridge piers [8]. Furthermore, advanced
composite materials have also been investigated
[3].
Stiffness plays much lower role than strength in resisting failure mechanisms during seismic event
[9]. Steel yield strength is an important factor in
determining the flexural strength of reinforced
concrete structural members. Therefore upon
reaching of the yield strength and under cyclic
loadings the flexural stiffness rapidly deteriorates.
In earthquake resistant frames, deformation
demands for columns may vary due to the
uncertainties in the prediction of future earthquake
motions. Increase in column-to-beam strength ratio
although reduces possibility of story failure
mechanism [10]. However, ordinary reinforcements in columns cannot provide large
flexural strength and elastic deformation capacity.
It is likely that under large lateral sway column
section will go into inelastic range. Therefore to
avoid formation of plastic hinges in columns and to
eliminate the chances of soft story and partial
failure mechanisms, HSS reinforcement in columns
is studied here. The response benefits as a result of
these numerical investigations are reported and are
compared with the corresponding ordinary steel
reinforced concrete frames. With the simple
proposed damage markers the degree of damage in
both the ordinary and HSS reinforced frames is
also evaluated.
2. Frames Geometry and steel area ratios
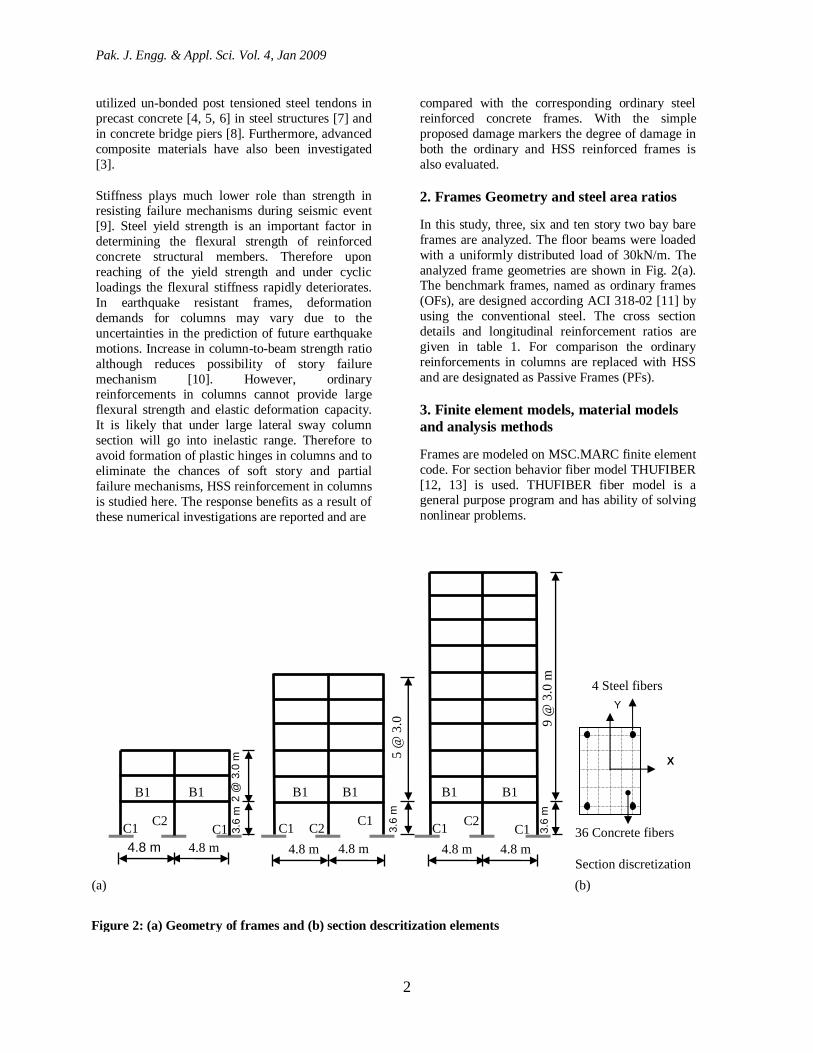
In this study, three, six and ten story two bay bare
frames are analyzed. The floor beams were loaded
with a uniformly distributed load of 30kN/m. The
analyzed frame geometries are shown in Fig. 2(a). The benchmark frames, named as ordinary frames
(OFs), are designed according ACI 318-02 [11] by
using the conventional steel. The cross section
details and longitudinal reinforcement ratios are
given in table 1. For comparison the ordinary
reinforcements in columns are replaced with HSS
and are designated as Passive Frames (PFs).
3. Finite element models, material models
and analysis methods
Frames are modeled on MSC.MARC finite element
code. For section behavior fiber model THUFIBER
[12, 13] is used. THUFIBER fiber model is a general purpose program and has ability of solving
nonlinear problems.
3.6
m
9 @
3.0
m
3.6
m
5 @
3.0
m
4.8 m 4.8 m 4.8 m 4.8 m 4.8 m 4.8 m
3.6
m 2
@ 3
.0 m
B1 B1 B1 B1 B1 B1
C1 C1 C2 C1
C2 C1 C1 C2
C1
Section discretization
(a) (b)
X
Y
4 Steel fibers
36 Concrete fibers
Figure 2: (a) Geometry of frames and (b) section descritization elements
Earthquake Response Evaluation of RC Frames using High Strength Steel
3
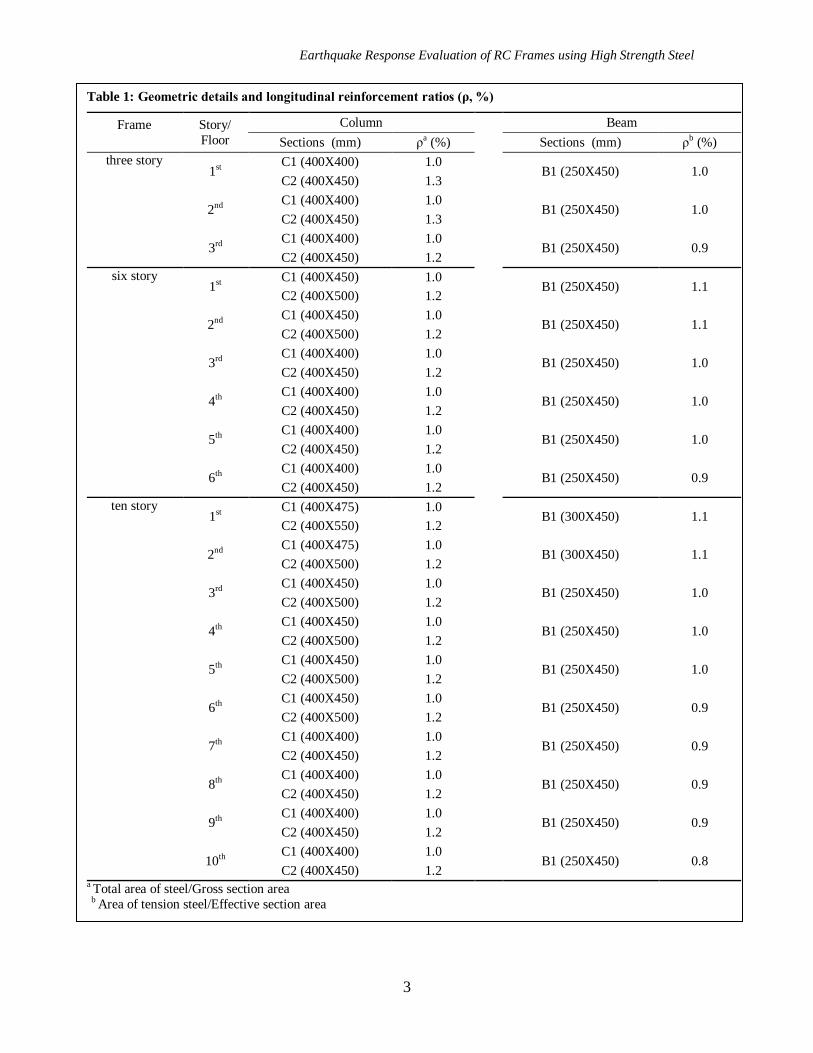
Table 1: Geometric details and longitudinal reinforcement ratios (ρ, %)
Frame
Story/
Floor
Column Beam
Sections (mm) ρa (%) Sections (mm) ρb (%)
three story
1st C1 (400X400) 1.0
B1 (250X450) 1.0 C2 (400X450) 1.3
2nd C1 (400X400) 1.0
B1 (250X450) 1.0 C2 (400X450) 1.3
3rd C1 (400X400) 1.0
B1 (250X450) 0.9 C2 (400X450) 1.2
six story 1st
C1 (400X450) 1.0 B1 (250X450) 1.1
C2 (400X500) 1.2
2nd C1 (400X450) 1.0
B1 (250X450) 1.1 C2 (400X500) 1.2
3rd C1 (400X400) 1.0
B1 (250X450) 1.0 C2 (400X450) 1.2
4th C1 (400X400) 1.0
B1 (250X450) 1.0 C2 (400X450) 1.2
5th C1 (400X400) 1.0
B1 (250X450) 1.0 C2 (400X450) 1.2
6th C1 (400X400) 1.0
B1 (250X450) 0.9 C2 (400X450) 1.2
ten story
1st C1 (400X475) 1.0
B1 (300X450) 1.1 C2 (400X550) 1.2
2nd C1 (400X475) 1.0
B1 (300X450) 1.1 C2 (400X500) 1.2
3rd C1 (400X450) 1.0
B1 (250X450) 1.0 C2 (400X500) 1.2
4th C1 (400X450) 1.0
B1 (250X450) 1.0 C2 (400X500) 1.2
5th C1 (400X450) 1.0
B1 (250X450) 1.0 C2 (400X500) 1.2
6th C1 (400X450) 1.0
B1 (250X450) 0.9 C2 (400X500) 1.2
7th C1 (400X400) 1.0
B1 (250X450) 0.9 C2 (400X450) 1.2
8th C1 (400X400) 1.0
B1 (250X450) 0.9 C2 (400X450) 1.2
9th C1 (400X400) 1.0
B1 (250X450) 0.9 C2 (400X450) 1.2
10th C1 (400X400) 1.0
B1 (250X450) 0.8 C2 (400X450) 1.2
a Total area of steel/Gross section area
b Area of tension steel/Effective section area
Pak. J. Engg. & Appl. Sci. Vol. 4, Jan 2009
4
Each section of the beams and columns is
discretized into 36 concrete and 4 steel fibers one at
each corner of the cross section, as shown in Figure
2 (b). The clear cover of concrete is 25mm
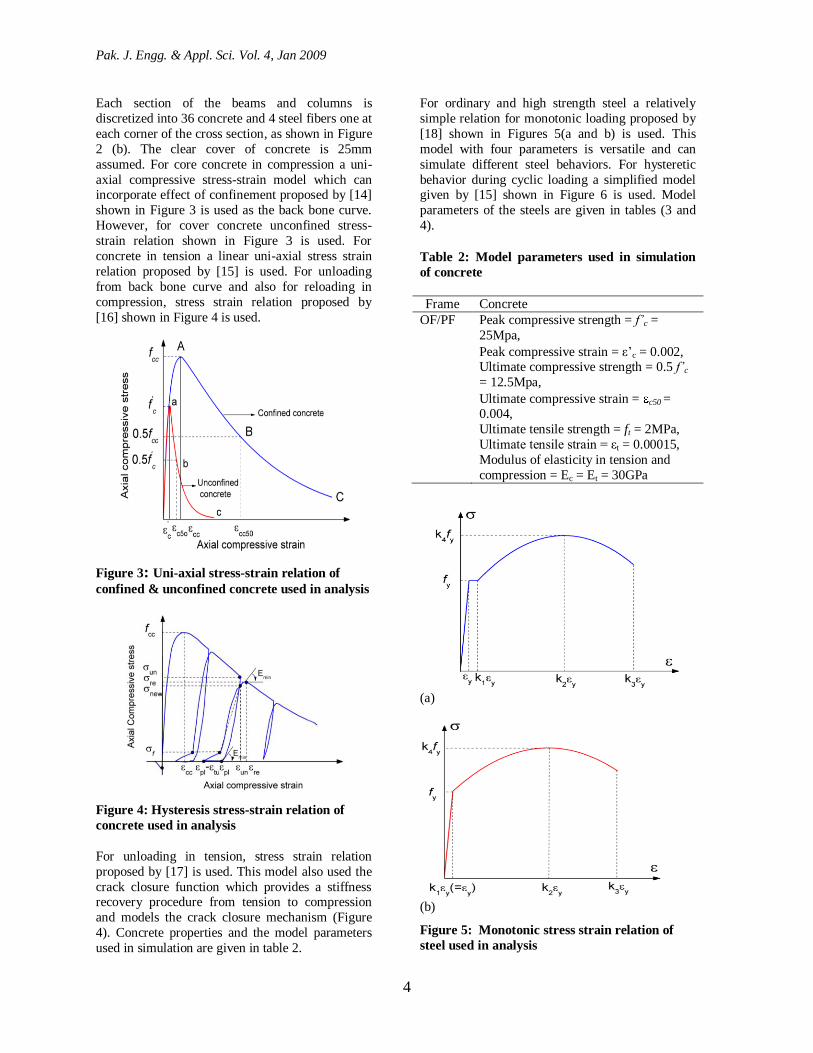
assumed. For core concrete in compression a uni-
axial compressive stress-strain model which can incorporate effect of confinement proposed by [14]
shown in Figure 3 is used as the back bone curve.
However, for cover concrete unconfined stress-
strain relation shown in Figure 3 is used. For
concrete in tension a linear uni-axial stress strain
relation proposed by [15] is used. For unloading
from back bone curve and also for reloading in
compression, stress strain relation proposed by
[16] shown in Figure 4 is used.
Figure 3: Uni-axial stress-strain relation of
confined & unconfined concrete used in analysis
Figure 4: Hysteresis stress-strain relation of
concrete used in analysis
For unloading in tension, stress strain relation
proposed by [17] is used. This model also used the
crack closure function which provides a stiffness recovery procedure from tension to compression
and models the crack closure mechanism (Figure
4). Concrete properties and the model parameters
used in simulation are given in table 2.
For ordinary and high strength steel a relatively
simple relation for monotonic loading proposed by
[18] shown in Figures 5(a and b) is used. This
model with four parameters is versatile and can
simulate different steel behaviors. For hysteretic
behavior during cyclic loading a simplified model given by [15] shown in Figure 6 is used. Model
parameters of the steels are given in tables (3 and
4).
Table 2: Model parameters used in simulation
of concrete
Frame Concrete
OF/PF Peak compressive strength = f’c =
25Mpa,
Peak compressive strain = ε’c = 0.002, Ultimate compressive strength = 0.5 f’c
= 12.5Mpa,
Ultimate compressive strain = c50 = 0.004,
Ultimate tensile strength = ft = 2MPa,
Ultimate tensile strain = εt = 0.00015,
Modulus of elasticity in tension and
compression = Ec = Et = 30GPa
(a)
(b)
Figure 5: Monotonic stress strain relation of
steel used in analysis

Earthquake Response Evaluation of RC Frames using High Strength Steel
5
Figure 6: Hysteresis stress-strain relation of
steel used in analysis
Table 3: Model parameters used in simulation
of ordinary steel
Frame Ordinary Steel
k1 = 3.0,
k2 = 25.0,
k3 = 60.0,
k4 = 1.5,
OF/PF Longitudinal steel yield strength = fy =
400MPa,
Stirrup steel yield strength=
fyh=350MPa,
Modulus of elasticity = Es = 200GPa
Longitudinal steel yield strain=εy =0.002
Table 4: Model parameters used in simulation
of high strength steel
Frame High strength steel
k1 = 2.0,
k2 = 10.0,
k3 = 40.0,
k4 = 1.08,
PF Longitudinal steel yield strength = fy =
1860MPa, Modulus of elasticity = Es = 198GPa
Longitudinal steel yield strain=εy =0.0093
In the analysis the shear strength is assumed large
enough and only flexure behavior is considered
dominant. Hence the shear deformation and shear
failure is neglected. P-delta effects are considered
in the analysis.
Beam element is used as finite element in
mathematical models. Trial runs are carried out to
evaluate the best size of the element in order to
avoid localization phenomena as suggested by [15].
Nonlinear static pushover and dynamic time history
analysis are used for comparative study.
4. Discussion on pushover analysis
4.1 Damage degree and observed failure mechanism
Frames are analyzed by performing nonlinear static
pushover analysis with the inverted triangular
lateral loads. Lateral loads are incrementally
applied, while the gravity loads are maintained
unchanged. For comparative study damage limit
states are defined and are related with the observed
material strains. Columns are considered critical towards the global stability of the structures. Hence
damage degree of the columns and beams is
separately marked. High-strength reinforcement
has more strength and elastic range than ordinary
steel, therefore damage markers in PFs columns are
different from OFs. The damage markers for beams
are given in table 5 and in table 6 damage markers
for the columns are enumerated.
For comparison, pushover curves of the OFs and
PFs are drawn in Figure 7. The first instant when
severe damage occurred in the OFs is marked and
the equivalent damage in the PFs is also shown. The moment when mechanism developed in OFs is
marked and the corresponding damage in PFs is
also revealed. The instant HSS yields in PFs and
the verge of collapse in OFs is also marked. For
clarity all the distressed sections at mechanism in
OFs and the comparable damage in PFs are shown
in Figure 8. To avoid congestion in pictures the
markers representing minimal damage are not
inserted on beams and columns.
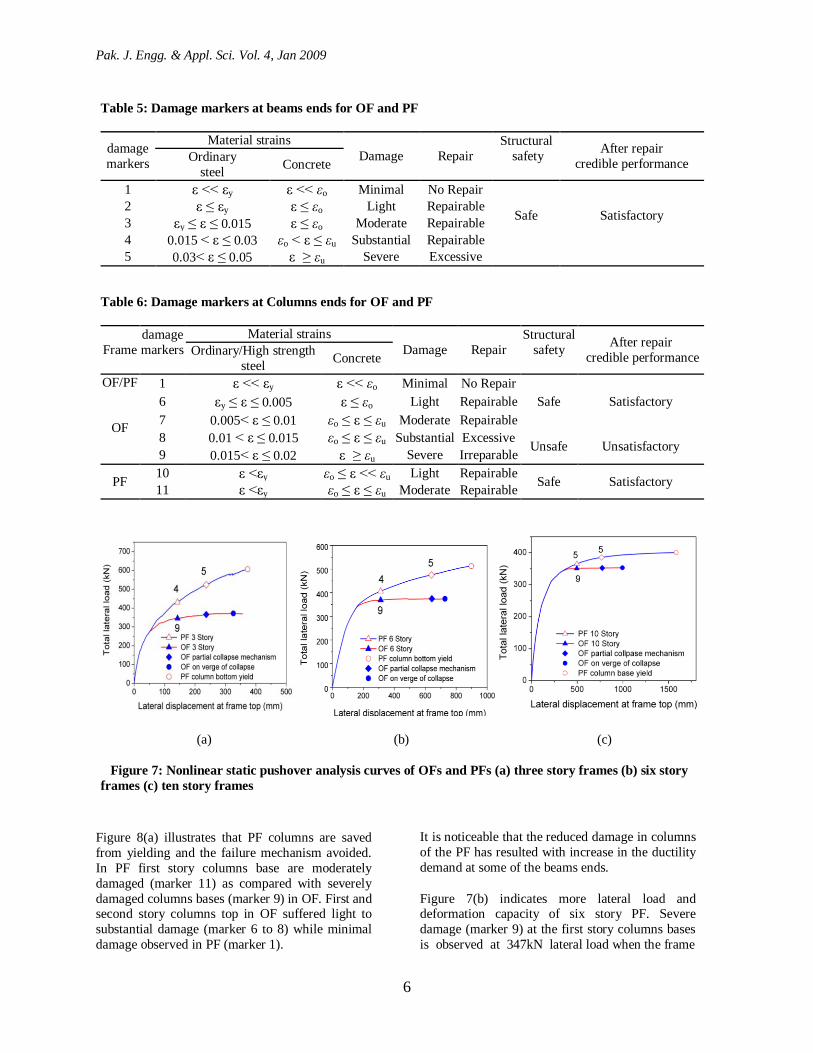
From Figure 7(a) more load and deformation
capacity of PF is evident for three story frame. OF has resisted 346kN lateral load at 146mm lateral
displacement when severe damage approached
(marker 9) the column base. While in PF, 431kN
lateral load with substantial damage (marker 4) at
the beam end section is observed.
Partial mechanism is observed at 366kN lateral
load and 238mm lateral displacement in OF.
However, PF resisted 525kN lateral load and only
one beam end section at the first floor approached
severe damage (marker 5). Yielding initiated at
607kN lateral load and 374mm lateral displacement
at the base of first story column in PF. PF lateral load and displacement magnitudes when column
base approached yield limit are almost 1.5 times
larger than corresponding values at failure
mechanism in OF. OF virtually collapsed at 372kN
load and at 325mm lateral displacement.
Pak. J. Engg. & Appl. Sci. Vol. 4, Jan 2009
6
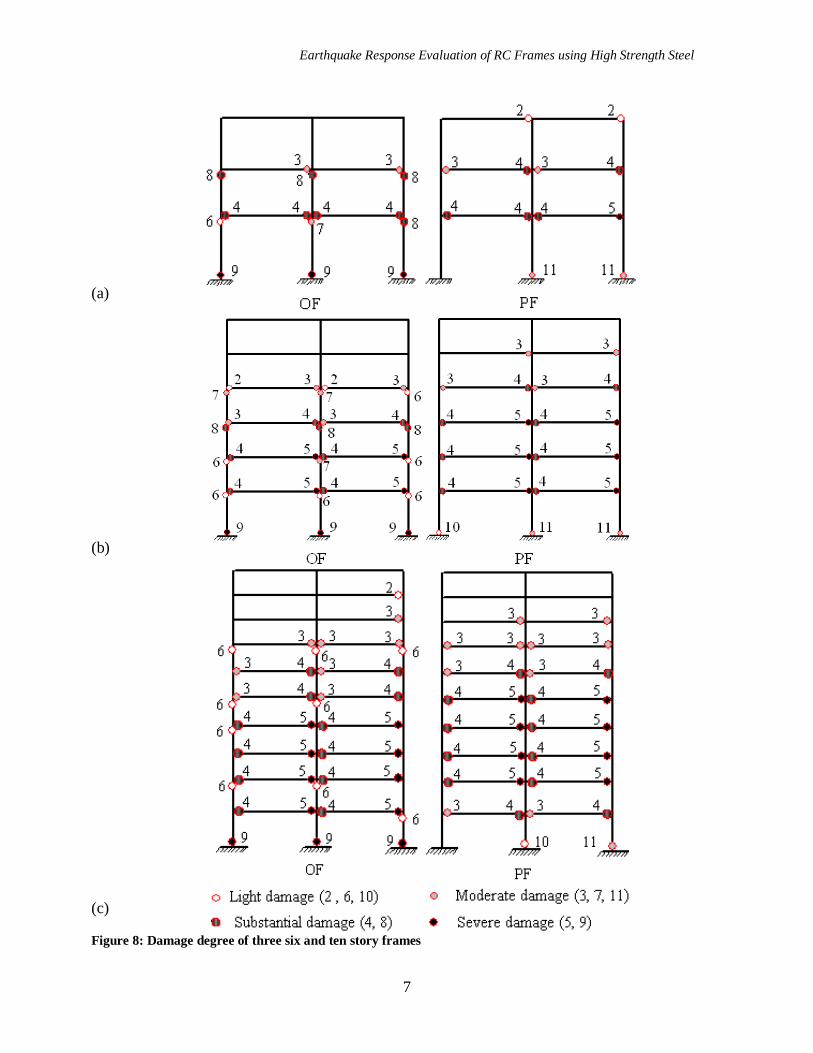
Figure 8(a) illustrates that PF columns are saved
from yielding and the failure mechanism avoided.
In PF first story columns base are moderately
damaged (marker 11) as compared with severely
damaged columns bases (marker 9) in OF. First and second story columns top in OF suffered light to
substantial damage (marker 6 to 8) while minimal
damage observed in PF (marker 1).
It is noticeable that the reduced damage in columns
of the PF has resulted with increase in the ductility
demand at some of the beams ends.
Figure 7(b) indicates more lateral load and deformation capacity of six story PF. Severe
damage (marker 9) at the first story columns bases
is observed at 347kN lateral load when the frame
Table 5: Damage markers at beams ends for OF and PF
damage
markers
Material strains
Damage Repair
Structural
safety
After repair
credible performance Ordinary
steel Concrete
1 ε << εy ε << εo Minimal No Repair
Safe
Satisfactory
2 ε ≤ εy ε ≤ εo Light Repairable
3 εy ≤ ε ≤ 0.015 ε ≤ εo Moderate Repairable
4 0.015 < ε ≤ 0.03 εo < ε ≤ εu Substantial Repairable
5 0.03< ε ≤ 0.05 ε ≥ εu Severe Excessive
Table 6: Damage markers at Columns ends for OF and PF
Frame
damage
markers
Material strains
Damage Repair
Structural
safety
After repair
credible performance Ordinary/High strength
steel Concrete
OF/PF 1 ε << εy ε << εo Minimal No Repair
Safe Satisfactory
OF
6 εy ≤ ε ≤ 0.005 ε ≤ εo Light Repairable
7 0.005< ε ≤ 0.01 εo ≤ ε ≤ εu Moderate Repairable
8 0.01 < ε ≤ 0.015 εo ≤ ε ≤ εu Substantial Excessive Unsafe Unsatisfactory
9 0.015< ε ≤ 0.02 ε ≥ εu Severe Irreparable
PF 10 ε <εy εo ≤ ε << εu Light Repairable
Safe Satisfactory 11 ε <εy εo ≤ ε ≤ εu Moderate Repairable
(a) (b) (c)
Figure 7: Nonlinear static pushover analysis curves of OFs and PFs (a) three story frames (b) six story
frames (c) ten story frames
Earthquake Response Evaluation of RC Frames using High Strength Steel
7
(a)
(b)
(c)
Figure 8: Damage degree of three six and ten story frames
Pak. J. Engg. & Appl. Sci. Vol. 4, Jan 2009
8
top deformed 226mm laterally. While, PF resisted
383kN lateral load and its beam end section
reached substantial damage (marker 4). Mechanism
occurred in OF at 356kN lateral load when the top
of the frame laterally displaced to 566mm. At this
stage PF resisted 480kN lateral load and mechanism remained absent. However the beams
end sections reached severe damage (marker 5). PF
column bottoms approached yielding at 506kN
lateral load and at 751mm lateral displacement
which is almost 1.4 times larger in magnitudes than
the corresponding values observed at mechanism in
OF.
Damage markers in Figure 8(b) highlight the
reduced damage degree of PF. The columns are
saved from yielding in PF, while severe yielding
occurred in columns of the OF. Partial mechanism
observed in OF because of the severe yielding at the columns bases (marker 9) and at the top of
fourth story columns (marker 8). However columns
bases in PF showed moderate damage (marker 11).
It is also noticeable that beam ends in both the
frames showed comparable damage.
For the ten story frames large deformation capacity
of PF is again evident (Figure 7(c)). At 351kN
lateral load and 495mm lateral displacement OF
column bottom reached severe damage (marker 9).
However PF beam end section showed severe
damage (marker 5) and the lateral load magnitude observed is 367kN. Further load increment
increased damage at the columns bases without
much increase in the load resistance in OF and
mechanism is observed at 352kN load and at
774mm lateral displacement. While PF, still
showed damage concentration at the beams ends
(marker 5) and has resisted 385kN lateral load. PF
reached the yielding at the columns bases at 400kN
lateral load and at 1584mm lateral displacement.
OF completely collapsed because of columns base
failures at 353kN lateral load and 995mm lateral
displacement. It is noticeable that the lateral deformation capacity of PF at the initiation of
yielding is almost 2.0 times larger than OF at the
start of mechanism and the loading resistance is
almost 1.13 times larger than OF.
Figure 8(c) illustrates comparable damage at the
beam ends between OF and PF. However severe
damage at the columns bases of the first story
columns (marker 9) and yielding at the top of the
sixth and seventh story columns (marker 6) is
observed in OF. Partial mechanism declared in OF
at the moment when maximum useable strain limits of 0.02 in compression and 0.05 in tension (FEMA-
356) [20] crossed. Since the load increment
resulted with large strains at the columns bases
without further increase in load resistance. In
contrast PF columns showed light damage (marker
10). Absence of yielding in the columns not only
provided lateral load resistance but also delayed formation of failure mechanism in PF.
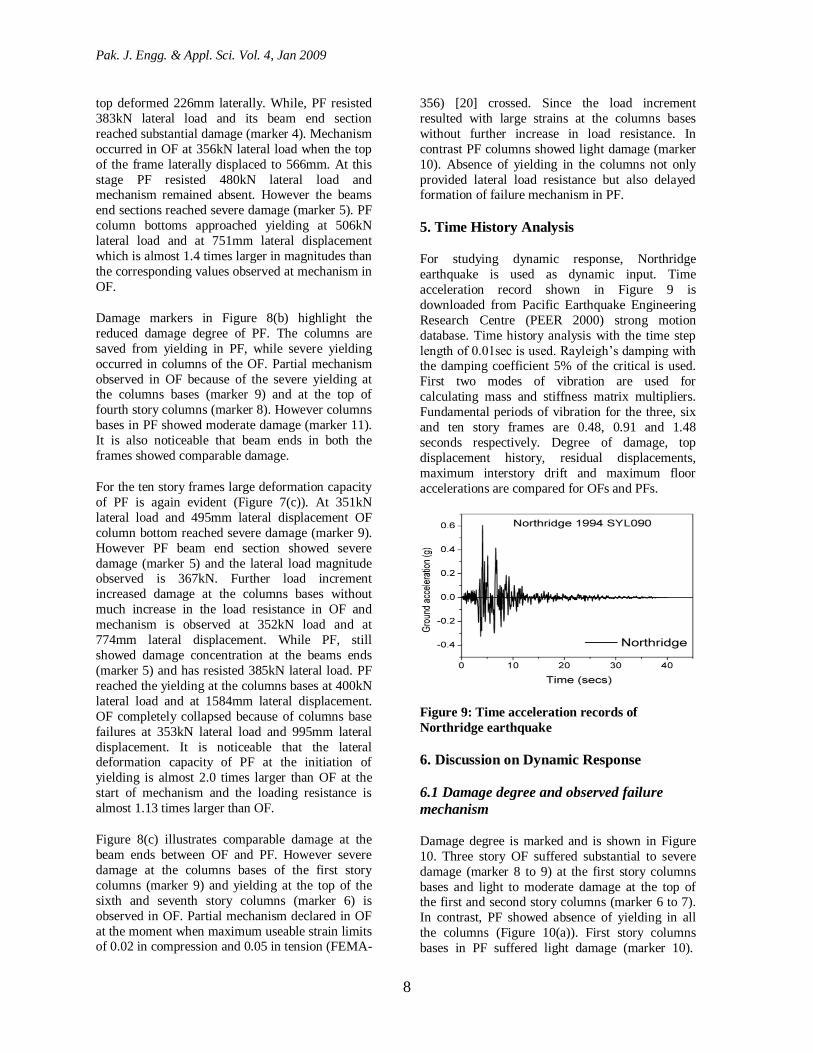
5. Time History Analysis
For studying dynamic response, Northridge
earthquake is used as dynamic input. Time
acceleration record shown in Figure 9 is
downloaded from Pacific Earthquake Engineering
Research Centre (PEER 2000) strong motion
database. Time history analysis with the time step
length of 0.01sec is used. Rayleigh’s damping with the damping coefficient 5% of the critical is used.
First two modes of vibration are used for
calculating mass and stiffness matrix multipliers.
Fundamental periods of vibration for the three, six
and ten story frames are 0.48, 0.91 and 1.48
seconds respectively. Degree of damage, top
displacement history, residual displacements,
maximum interstory drift and maximum floor
accelerations are compared for OFs and PFs.
Figure 9: Time acceleration records of
Northridge earthquake
6. Discussion on Dynamic Response
6.1 Damage degree and observed failure
mechanism
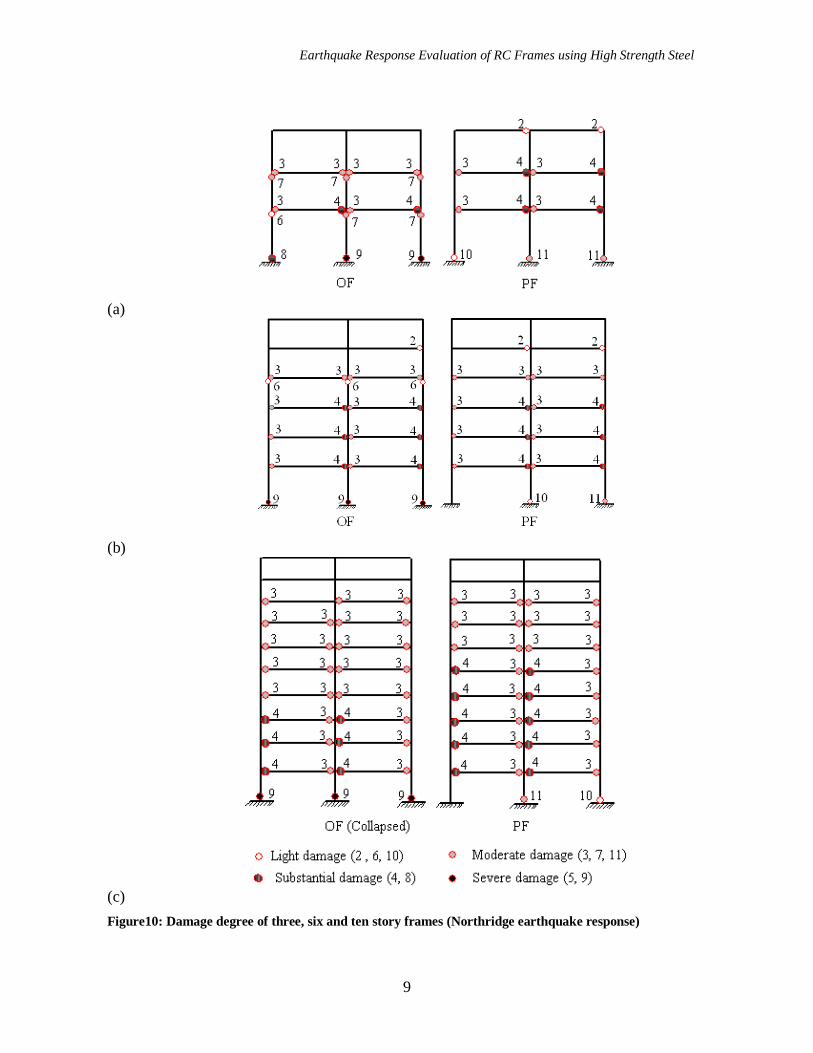
Damage degree is marked and is shown in Figure
10. Three story OF suffered substantial to severe
damage (marker 8 to 9) at the first story columns
bases and light to moderate damage at the top of the first and second story columns (marker 6 to 7).
In contrast, PF showed absence of yielding in all
the columns (Figure 10(a)). First story columns
bases in PF suffered light damage (marker 10).
Earthquake Response Evaluation of RC Frames using High Strength Steel
9
(a)
(b)
(c)
Figure10: Damage degree of three, six and ten story frames (Northridge earthquake response)

Pak. J. Engg. & Appl. Sci. Vol. 4, Jan 2009
10
Some of the beams ends in PF showed more
distress as compared with OF. More yielding at the
beams ends in PF demonstrates the increase in the
ductility demands. This demand can be fulfilled by
providing confinement at the beam ends.
Figure 10(b) illustrates the damage in the six story frames. In OF severe damage (marker 9) is
apparent at the first story columns bases. Further at
the top of fourth story columns light damage
(marker 6) is observed. This formation of plastic
hinges highlights imminence of the partial
mechanism. While in PF because of more flexural
strength of columns, damage is seen confined at the
beam ends only and all the columns are saved from
yielding. Damage degree of ten story frames is
shown in Figure 10(c). Since OF virtually
collapsed and results did not converge. Damage
occurred in OF till 6.6secs of simulation is compared with PF. Since afterwards all the critical
sections showed severe damage. Bottom of the first
story columns in OF showed severe damage (maker
9) while the columns in the above stories showed
minimal damage. PF showed light to moderate
damage (marker 10 to 11) in the first story columns
at base. Beams in the lower stories in PF showed
slightly more damage than OF. Although the
difference in damage degree in beams between OF
and PF is not as significant but excessive damage at
the columns bases in OF formed total failure mechanism. While in PF, large deformation
capacity of columns delayed formation of total
mechanism.
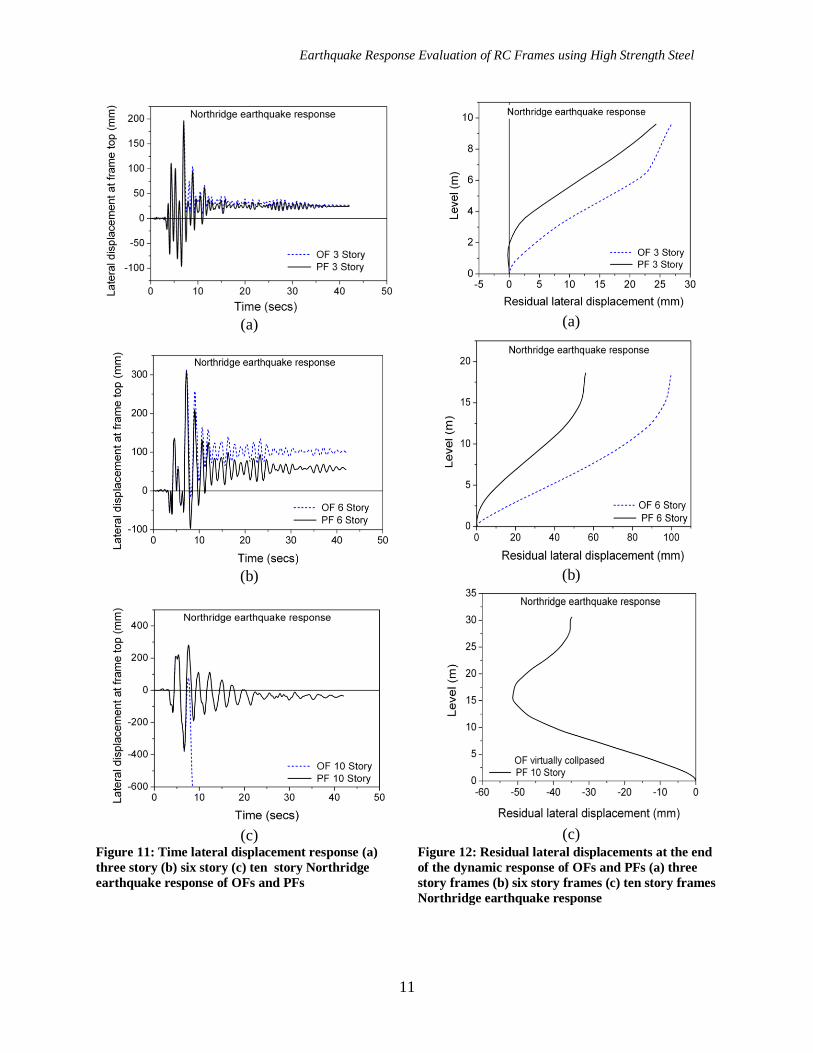
6.2 Top Displacement History
The top displacement histories are shown in
Figures 11. For the three story frames (Figure 11(a)), the difference is less obvious at the top.
Since excessive yielding at the columns bases and
at the top of second story columns resulted in
partial mechanism in OF. Hence, the top story of
the OF moved like a rigid body without much of
the relative lateral deformations. However, in
contrast inelastic deformations did not concentrate
at one particular floor in PF. It can also be stated
that absence of yielding in the columns of PF does
not increase the maximum lateral displacement
response.
From Figures 11(b) less lateral shift from origin is
evident in PF. Smaller lateral shift during
oscillations is the result of virtually elastic columns
of the PF. A good agreement between maximum
lateral displacements is also noticed.
Ten story frames top displacement history is shown
in Figure 11(c). OF virtually collapsed and results
did not converge after 9sec. More deformation
capacity of the columns of PF prevented permanent
drift from the zero position.
6.3 Residual lateral displacement
Frames are analyzed for period more than dynamic
input. Residual displacements shown in Figures 12
are observed when the oscillations almost ceased in
frames. For the three story frames the reduced
residual lateral displacements are attained in PF
(Figure 12(a)). Residual displacements for the six
story frames also stress the lowering in residual
displacements in PF (Figure 12(b)). For the ten
story frames residual displacements of the PF are shown in Figure 12(c). Since OF approached
dynamic instability and results did not converge. It
is also interesting to note that at the first story the
residual displacements are negligible in PFs.
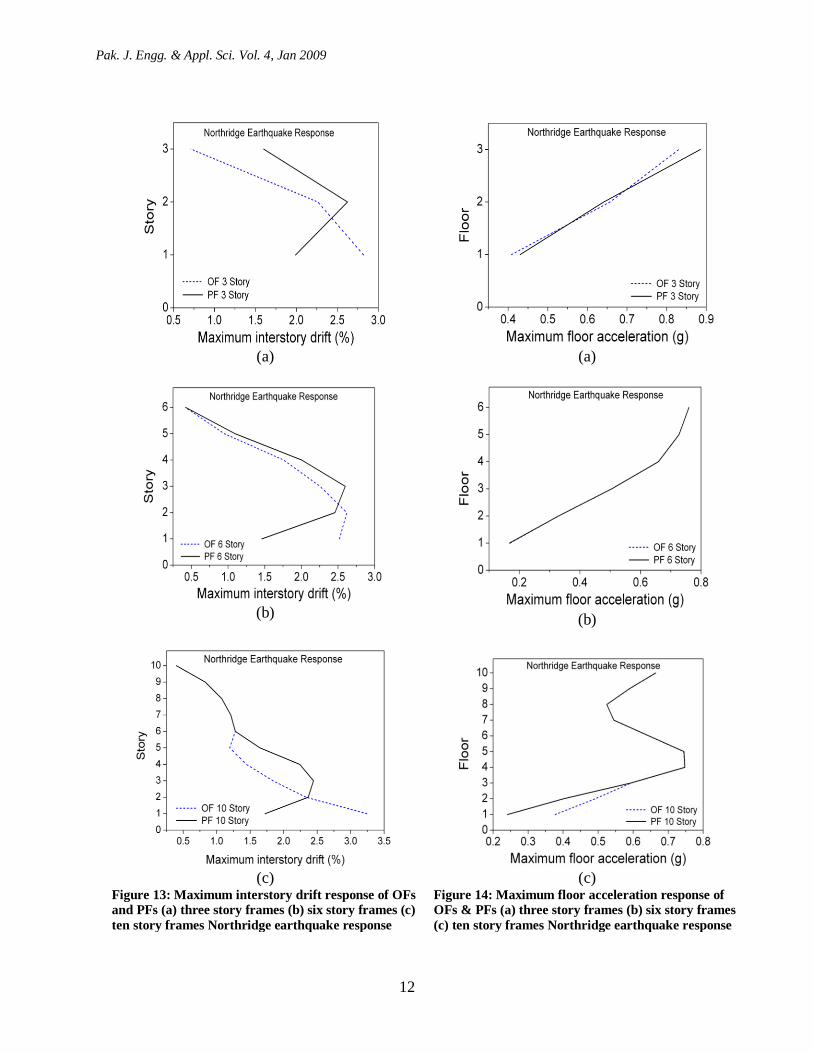
6.4 Interstory Drift Response
In this study maximum interstory drift response is
also compared for rational comparison. The
observed maximum interstory drifts are drawn in
Figures 13.
Three story OF showed considerably more drift
magnitudes at the first story as compared with PF
(Figure 13(a)). In the second and third stories
maximum interstory drift magnitude is observed
more in PF. Since partial mechanism approached in
OF and third story columns showed less relative
displacements. Comparison of maximum interstory
drift magnitude in the frames revealed more
response in OF. Six story frames indicates more
drift at the first and second story in OF (Figure
13(b)). However, relatively more magnitude is
observed in the above stories of the PF. Because of the absence of yielding in PF columns slight
increase in drift in the above stories is
understandable. Maximum interstory drifts for ten
story OF shown in Figure 13(c) are at 6.6sec of the
simulation time, before approaching collapse
mechanism. It is evident from results that first story
failure mechanism approached in OF. PF, however
showed steady response and maximum interstory
drift occurred at the third story.
6.5 Maximum floor acceleration response
A large portion of non structural components and
building contents are damaged primarily as a result
Earthquake Response Evaluation of RC Frames using High Strength Steel
11
(a)
(a)
(b)
(b)
(c)
(c)
Figure 11: Time lateral displacement response (a)
three story (b) six story (c) ten story Northridge
earthquake response of OFs and PFs
Figure 12: Residual lateral displacements at the end
of the dynamic response of OFs and PFs (a) three
story frames (b) six story frames (c) ten story frames
Northridge earthquake response
Pak. J. Engg. & Appl. Sci. Vol. 4, Jan 2009
12
(a)
(a)
(b)
(b)
(c)
(c)
Figure 13: Maximum interstory drift response of OFs
and PFs (a) three story frames (b) six story frames (c)
ten story frames Northridge earthquake response
Figure 14: Maximum floor acceleration response of
OFs & PFs (a) three story frames (b) six story frames
(c) ten story frames Northridge earthquake response

Earthquake Response Evaluation of RC Frames using High Strength Steel
13
of being subjected to large floor acceleration
demands [21]. Maximum floor acceleration
response is compared and is shown in Figure 14.
It is evident from Figure 14(a) that the three story
frames responded with a little difference. Six story
frames also showed exact similarity in response
between OF and PF (Figure 14(b)). Maximum floor
acceleration response of ten story frame also
revealed almost similarity in response in the above
floors between OF and PF. However, in the first
and second floor relatively more response is
observed in OF before approaching collapse
mechanism (Figure 14(c)).
Hence from the above observations in general, a
similarity in the acceleration response between OF
and PF can be inferred.
7. Conclusions
To determine the response benefits of HSS
reinforcements in frame construction, non linear
static pushover and time history analysis are
performed. For detailed investigation two bays
three, six and ten story frames are selected. Based
on the analysis results following conclusions can be
drawn.
1. In the small to medium rise frames HSS
reinforcements in the frame columns can
provide more lateral strength and deformation
capacity against lateral loadings. However,
for high rise frames increase in deformation
capacity is more obvious than the strength
increase by the use of HSS reinforcements in
the columns.
2. Damage degree in the ordinary steel
reinforced concrete construction can be
reduced by replacing the ordinary
reinforcement with HSS. Soft story and
partial failure mechanism can be prevented
and total or sway failure mechanism can be
delayed by utilizing HSS reinforcements in
columns.
3. Residual displacements at the end of dynamic
event can be minimized by using HSS
reinforcements.
4. The absence of yielding in columns because
of HSS may also increase ductility demands
at the beams ends.
5. Frame response is observed by simple
replacement of ordinary reinforcement with
HSS. However, in the future study various parameters such as beam column stiffness
ratios, beam column strength ratios and shear
strength demands because of HSS
reinforcement needs to be investigated.
8. References
[1] Dinh, T. V. and Ichinose T; Journal of
Structural Engineering, 131-3(2005) 416-427.
[2] Paulay, T. and Priestley M. J. N; Seismic
design of reinforced concrete and masonry
buildings, Wiley, New York, (1992).
[3] Fischer, G., and Li, V. C; ACI Structural
journal, 100-2 (2003) 166-176.
[4] Priestley, M. J. N., Sritharan, S. S., Conley, J.
R. and Pampanin S; Precast/Prestressed
Concrete Institute Journal, 44-6 (1999) 42-67.
[5] El-Sheikh, M.T., Sause, R., Pessiki, S. and
Lu, L. W; Precast/Prestressed Concrete
Institute Journal, 44 -3(1999) 54-71.
[6] Kurama, Y. C., Pessiki, S., Sause, R. and Lu
L. W; Precast/Prestressed Concrete Institute
Journal, 44-3(1999) 72-89.
[7] Ricles, J. M., Sause, R., Garlock, M. M. and
Zhao, C; Journal of Structural Engineering,
127-2(2001) 113-121.
[8] Kwan, W. P. and Billington, S. L; Journal of
Bridge Engineering, 8-2 (2003) 92-101.
[9] Lu Y; Journal of Structural Engineering, 128-
2(2002) 169-178.
[10] Dooley, L. and Bracci, J. M; ACI Structural
Journal, 98-6(2001) 834-851.
[11] American Concrete Institute (ACI); Building
code requirements for structural concrete and
commentary, Detroit, (2002) ACI 318-02.

Pak. J. Engg. & Appl. Sci. Vol. 4, Jan 2009
14
[12] Lu, X. Z., Miao, Z. W., Huang, Y. L. and Ye,
L. P; Proc., MSC. Software Chinese Users’
Conference, Chengdu, China, (2005), 1-10.
[13] Wang, X. L., Lu, X. Z., Ye, L. P; Earthquake
Resistant Engineering and Retrofitting, 28-
6(2006) 25-29.
[14] Legeron, F. and Paultre, P; Journal of
Structural Engineering, 129-2(2003) 241-252.
[15] Legeron, F., Paultre, P., Mazars, J; Journal of
Structural Engineering, 131-6(2005) 946-955.
[16] Mander, J. B., Priestley, M. J. N. and Park, R.
Journal of Structural Engineering, 114-
8(1988) 1804–1825.
[17] Miranda, E. and Taghavi, S; Journal of
Structural Engineering, 131-2(2005) 203-211.
[18] Esmaeily, A. and Xiao, Y; ACI Structural
Journal, 102-5(2005) 736–744.
[19] http://peer.berkeley.edu/smcat/search.html
assessed 10 June 2007.
[20] Federal Emergency Management Agency
(FEMA); Prestandard and commentary for the
seismic rehabilitation of buildings,
Washington, D. C, (2000), FEMA-356.
[21] Miranda, E. and Taghavi, S; Journal of
Structural Engineering, 131-2(2005) 203-211.