east african community economic partnership …...the east african community (eac) and the eu share...
TRANSCRIPT

Trade
The Economic Impactof the EU - East African Community Economic Partnership Agreement
1
ACKNOWLEDGMENTS
This report is produced by the Directorate-General for TRADE and was prepared under the overall coordination of Lars Nilsson, Deputy Chief Economist in DG TRADE.
The main contributors were Thanos Rammos, Thierry Beranger, Alessandra Tucci, DG TRADE.
Statistics for section 3 were provided by Fabio De Franceschi, DG TRADE.
The simulations presented in this report were performed by Dan Ciurac, Charles Xiao and Derk Bienen (BKP Development Research & Consulting GmbH “BKP”) under the contract No SI2. 720596.

2
THE ECONOMIC IMPACT OF THE ECONOMIC PARTNERSHIP AGREEMENT
BETWEEN THE EU AND THE EAST AFRICAN COMMUNITY
An analysis prepared by the European Commission's
Directorate-General for Trade
Executive Summary
On 3 April 2014, Heads of State and Governments of Africa and of the European Union (EU) gathered at the Fourth EU Africa Summit declared: "Our economies remain closely linked, and we will work to ensure that the growth of the one will help the other. We are also convinced that trade and investment and closer economic integration on each of our continents will accelerate that growth." While acknowledging the "valuable role" of development assistance, they called for "a fundamental shift from aid to trade and investment as agents of growth, jobs and poverty reduction."1
That priority is reflected in the Economic Partnership Agreements (EPAs) between the EU and African, Caribbean and Pacific (ACP) countries, which are the main pillar of ACP-EU trade cooperation, and aim at creating the right conditions for trade and investment. Highlighting the positive outcomes of the conclusions of three regional agreements in 2014 (West Africa, SADC EPA group and EAC), the Trade for All Communication of October 20152 considered that those agreements "established a new dynamic partnership between the two continents and paved the way to closer cooperation in the future." In this context, the EU-EAC EPA establishes a long-term and stable trade relationship between both parties, in compliance with international trade rules.
The East African Community (EAC) and the EU share strong trade links. The EU is the EAC's first trade partner for exports (25.3% of EAC exports go to the EU) and third partner for imports (12.5% of EAC imports). All in all, trade between both regions amounts to €6.8 bn. and has increased steadily in the last ten years (by more than 75%) both for exports and imports. EAC countries experimented steady growth rates in recent years, above 6% annually, sustained in particular by foreign direct investment in the region. A large share of the EAC's foreign direct investment stock comes from the EU.
The present report is part of the "Economic analyses of negotiated outcome" undertaken by DG TRADE at the end of negotiations. Contrary to earlier reports, it does not rely on hypothetical scenarios but on the actual outcome of the negotiation between the parties, with a view to provide information to all stakeholders involved in the adoption process of the agreement, as well as to the wider public.
1 EU Africa Summit Declaration of 3 April 2014, §43. 2 "Trade for all, Towards a more responsible trade and investment policy", European Commission, October 2015.

3
The rationale and content of the EAC – EU EPA
The EU's trade relations with the ACP countries were historically framed by a series of conventions, which granted unilateral preferences to the ACP countries on the EU market. By the end of the 1990s, it was found that these conventions did not promote trade competiveness, diversification and growth as intended. They were also found to be in breach of the World Trade Organisation's (WTO) principles, as they established unfair discrimination between developing countries. A change was therefore required. EPAs were the response defined jointly by the ACP countries and the EU in the Cotonou Agreement. EPAs build a new bilateral partnership for trade and development, asymmetric in favour of ACP countries. In keeping with the objectives set out in the Cotonou Agreement, sustainable development is a key objective of the EPA, which is explicitly based on the "essential and fundamental" elements set out in the Cotonou Agreement (human rights, democratic principles, the rule of law, and good governance). The joint EPA institutions are tasked with the function of monitoring and assessing the impact of the implementation of EPAs on the sustainable development of the parties, also carving out a clear role for civil society.
In view of these objectives, the EPA differs from most Free Trade Agreements (FTAs) currently in place or negotiated by the EU with other trading partners: while it remains a reciprocal agreement (as a factor favouring trade and investment, and as a condition for its compatibility with WTO principles), it weighs in favour of the EAC through specific provisions:
• trade rules that constitute a key contribution to the reform agenda and better business environment in the EAC Partner States,
• an "asymmetry" in the commitments to take into account the different level of development, which covers market access, rules of origin and the use of safeguard measures by the EAC,
• the development assistance which revolves around the needs for the partner countries to respond to the first two pillars.
The institutional provisions of the EPA set up a specific forum for the East African Community and the EU to discuss and resolve trade issues: in that manner, the EPA creates a genuine bi-regional partnership, which is also extended to civil society through a consultative committee.
The conclusion of the EPA negotiations should also be seen in the context of the EAC's efforts to improve regional integration. The EAC established a Customs Union in 2005 and ratified a more far-reaching common market protocol in 2010. The EPA would contribute to foster those efforts, especially through the flexible rules of origin provisions that are part of the agreement and the development assistance channelled in the EPA context for instance to support regulatory convergence and trade facilitation within the region.

4
The estimated effects of the tariff reductions set out in the EAC – EU EPA
The economic impact of the EPA was assessed using a dynamic general equilibrium model. In a conservative manner, only the impact of the tariff reductions was assessed, i.e. what is easily quantifiable from the agreement, but an estimate of the impact of the reduction of non-tariff barriers was also undertaken. Non-tariff barriers are a major impediment to trade and the EAC has proceeded to the creation of an appropriate mechanism at EAC regional level for identifying, monitoring and removing all of them. This on-going process in the EAC will receive further momentum from the effect of the EPA, which creates obligations between EAC partner states and the EU affecting their trade. Other essential provisions of the EPA (rules of origin, trade facilitation, cooperation on norms, the development cooperation provisions, etc.) were left out from the model since they are difficult to quantify without making strong assumptions; still they weigh in favour of EAC countries. The results presented in the study should thus rather be seen as a lower approximation which is expected to be exceeded in the long-term thanks to the non-tariff provisions of the agreement.
Based on the simulation results, the GDP of all EAC countries will be positively affected by the agreement, albeit to a small extent, on average by 0.3% (all results refer to the situation in 2042 compared to a baseline without the EPA). Welfare is also expected to slightly increase. Kenya and Tanzania are the countries which would benefit the most in terms of GDP.
Total exports from the EAC to the world are positively affected by the EPA and so are total imports, though to a smaller extent. Exports are expected to increase on average by 1.1% and imports by 0.9%. Despite the fact that most EAC countries already enjoy duty-free quota-free (DFQF) access in the EU market, all countries experience a rise in their exports thanks to the EPA from +0.15% (Uganda) to +0.45% (Tanzania). Kenya experiences a slightly larger increase in exports (+0.86%) due to the improvement in market access sustained by the EPA. The EPA only has as a small positive impact on the EU's trade with the world (+0.05% for both imports and exports).
In a majority of sectors (22 out of 37), EAC exports are set to increase. This is particularly the case of manufacturing and raw material sectors (11 out of 14 sectors) where overall exports increase by 0.8%. Agricultural and food sectors also increase on average by 3% but with more variation depending on the sectors. Most services sectors are due to increase (5 out of 7 sectors), but overall there is model-induced reallocation of exports from services (which are not covered by the EPA) to agriculture and industry sectors.
As a result of bilateral trade liberalisation, EAC imports from the EU are expected to increase at the expense of other trade partners: however, this does not affect disproportionally the current trade pattern (EU share of EAC total imports would only increase from 10.6% to 12.9%).
Tariff reduction is expected to slightly reduce the poverty headcount in EAC countries.
For all five EAC Member States, the implementation of the EPA corresponds to a moderate reduction of revenues from excise taxes and duties, which is smaller or even becomes positive when considering the impact on total revenues (from -1.09% to +0.02%). In Kenya, the increased revenues from income taxes, linked to the GDP gains,

5
and the increased VAT from consumption, will more than offset the revenue losses from the elimination of the duties. In the other EAC Member States, decrease in government revenues remains negative, though small. The limitations of the model used should be recalled, as the dynamic effects of rules of origin improvements and accompanying measures would further mitigate those revenue effects.
Additional simulations have been carried out in order to assess the impact of the reduction of non-tariff barriers. This leads to significantly higher results, for instance on GDP (+0.6% for the whole EAC, ranging from +0.3% in Rwanda to +0.7% in Tanzania and Uganda). This shows that, in addition to tariff reduction, implementation also has to focus on reducing other existing barriers to trade in order to maximise the positive impact.
Conclusion
The simulation of the impact of tariff reductions set out in the EPA shows positive gains for the East Africa Community. Only those aspects of the EPA that are readily quantifiable (tariff reductions) have been assessed but an analysis of the reduction of non-tariff barriers already leads to much higher positive results.
The EPA creates joint institutions in charge of the implementation of the agreement. It will be the task of those institutions to ensure that the EPA is properly implemented, as well as to make proposals for reviewing priorities set out in the agreement. For that purpose, constant monitoring of EPA implementation is paramount.
In addition, the EPA foresees discussions on a wider negotiation agenda ("rendez-vous clauses") covering other areas affecting trade and investment, for instance services, investment, or sustainable development, which could bring additional benefits to the countries concerned, when concluded.

6
Content
Executive summary
1. Introduction
2. Context and objectives of the EU – EAC Economic Partnership Agreement
2.1. Context of the EPA
2.2. Objectives of the EPA
3. Content of the EAC-EU EPA
3.1. Trade in Goods
3.2. Development
3.3. Rules of Origin
4. Overview of the economic and trade relations between the EU and the EAC
4.1. The economy of the East African Community
4.2. EAC trade with the world
4.3. Trade relations between the EU and EAC
5. Literature review
6. Analysis of the potential economic effects of the tariff reductions set out in the EPA
6.1. Description of the methodology
6.2. Impact of tariff reduction - Analysis of results
6.3. Impact of NTB reduction – additional simulations
6.4. Summary of modelling results
References

7
1. Introduction
The East African Community (EAC) includes five countries: Burundi, Kenya, Rwanda, Tanzania and Uganda. One country, Kenya, is a lower middle-income country, and the four others are Least Developed Countries (LDCs). They have an operational customs union, a ratified common market protocol, a signed monetary union protocol and the ambition to proceed in a fast track integration process aimed ultimately at a political union. They negotiated as a bloc an Economic Partnership Agreement (EPA) since 2007, when they decided to break out of the Eastern Southern Africa EPA configuration. In November 2007, they agreed on an interim EPA ("Framework EPA" or "FEPA"), but in June 2010 both parties agreed to continue negotiations for a full (comprehensive) EPA.
The negotiations of the EPA between the EU and the EAC were concluded on 14 October 2014. The agreement was initialled on 16 October in Brussels by the Chief Negotiators of the EU and of EAC members.
This study has the aim of presenting an analysis of the consequences of the EPA at a point in time, where all elements are known, i.e. after the end of the negotiations. It has been written to help understand the political and economic context in which the EAC-EU EPA has been negotiated; it also identifies the main elements of the agreement; and it offers an assessment of the impact of the agreement on welfare, government revenue and poverty in the EAC Partner States.
Estimating the future effects of trade agreements is not an exact science, even when the content of the agreement is known. Apart from the methodological problems presented in section 6, certain aspects of the EPA make the analysis a challenging task:
• The analysis of the impact of the EPA is made against a baseline that describes what would happen if the EAC Partner States would not ratify the EPA. In the case of Kenya, which is the sole middle-income country in the EAC, the main exports of horticultural products to the EU would face the GSP preferential (non-zero) tariffs and in particular cut flowers (representing one third of total exports to the EU) would face the most-favoured-nation tariffs (MFN) applicable to all WTO members. Such an outcome would be detrimental for Kenya's exports, because the GSP and/or MFN duty would highly affect their competitiveness leading most likely to substantial loss of EU market share. The four other EAC Partner States, as least-developed countries (LDC) in the region, would be beneficiaries of the Everything-but-Arms (EBA) scheme, which would still provide duty-free and quota-free access to the EU, but which offers less advantageous rules of origin. In addition, the EPA offers those countries a guarantee for the duty-free quota free access to the EU market irrespective of their upgrade to middle-income countries in the forthcoming future.
• Further, the analysis addresses the treatment of non-tariff barriers facing goods trade. This has been quantified using the metrics of the OECD's Trade Facilitation Indicators and the economic impact of corresponding reductions in NTBs has been simulated.
• Many trade-related elements of the EPA could not be modelled by this study. For instance, the EPA offers safeguards that may be activated by the EAC Partner States to protect their domestic markets from surges in imports, but it is difficult to foresee whether the use of such safeguards will be needed in the future, and if so for which products.

8
• Importantly, the development-cooperation chapter of the EPA contains commitments by both the European Union and the EU Member States individually to carry out development financing to support the implementation of this Agreement. This financial assistance is an essential part of making sure that the EPA will become an instrument to propel economic growth, attract investment and create jobs. It is however not part of this study and of the model-based economic analysis it presents, which therefore inevitably can give only a partial, conservative picture of the impact of the EPA.
This study is structured as follows. First, it seeks to explain the context and rationale for concluding the EPA (section 2) as well as the content of the agreement (section 3). Then, it looks at the existing economic and trade relationship between the EAC countries and the EU (section 4). After a literature review (section 5), economic modelling tools are applied to assess the impact of the tariff liberalisation schedule set out in the agreement (section 6).
9
2. Context and objectives of the EU – EAC Economic Partnership Agreement
2.1. Context of the EPA
The Lomé Conventions (the first of which dates back to 1975) set out the principle of non-reciprocal concessions on trade in favour of African, Caribbean and Pacific countries (ACP)3. The first three Conventions were concluded for a period of five years. The fourth Convention covered the period from 1990 to 2000.
By the end of the 1990s there was a sense of frustration that the significant trade preferences for ACP exports had failed to stem the steady fall in ACP countries’ share of total extra-EU imports and to bring the much needed diversification of ACP economies. Moreover, these preferences were assessed to be in breach of the rules of the World Trade Organisation (WTO), which provide that countries in a similar situation should be treated on an equal basis. However, WTO rules also provide that countries can be granted specific treatment, insofar as such treatment is granted in the framework of a reciprocal free trade agreement that covers substantially all trade between the parties. The WTO agreed with much difficulty to an exception for the non-reciprocal trade regimes until the end of 2007, after which they were to be replaced by WTO-compatible arrangements.
The ACP countries and the EU have jointly designed the EPAs as a response to that commitment. The Cotonou Agreement foresaw the setting-up of a new reciprocal partnership for trade and development, but one that would maintain a significant asymmetry in market access commitments, leaving ACP countries considerable policy space for keeping in place selected tariffs vis-a-vis imports from the EU. In 2003 and 2004, formal regional negotiations were launched with West Africa, Central Africa, Eastern and Southern Africa, the Caribbean, southern Africa / SADC and the Pacific.
Four countries (Kenya, Uganda, Rwanda and Burundi) of the East African Community initially negotiated an Economic Partnership Agreement with the Eastern and Southern Africa EPA configuration and Tanzania negotiated with the SADC EPA configuration. The EAC composed of the five countries formed a separate negotiating group in August 2007. Since then, they negotiated as a bloc.
The relevant provisions of the Cotonou Agreement which provided for unilateral trade preferences for ACP countries expired on 31 December 2007. To bridge the gap for countries that were not yet in a position to apply EPAs, the EU set out transitional arrangements applying as from 1 January 2008 to products from the countries in question through the Council Regulation (EC) No. 1528/2007, the so-called Market Access Regulation (MAR). This regulation governed the EU import regime for the ACP countries that had initialled EPAs in 2007. It basically unilaterally anticipated the duty-free access that the EU offered in those agreements, pending their entry into force.
3 The ACP Group of States was founded by the Georgetown Agreement in 1975.

10
2.2. Objectives of the EPA
The declared objective of the parties when negotiating the agreement was broad, aiming at "fostering the smooth and gradual integration of the ACP States into the world economy with due regard for their political choices and development priorities, thereby promoting their sustainable development and contributing to poverty eradication in the ACP countries".4 In the EPA with the EAC, this overall objective has been broken down into a number of more specific aims:
• Contribute to economic growth and development through the establishment of a strengthened and strategic trade and development partnership consistent with the objective of sustainable development;
• Promote regional integration, economic cooperation and good governance in the EAC;
• Promote the gradual integration of the EAC into the world economy, in conformity with its political choices and development priorities;
• Foster the structural transformation of EAC economies, and their diversification and competitiveness by enhancing their production, supply and trading capacity;
• Improve EAC capacity in trade policy and trade related issues;
• Establish and implementing an effective, predictable and transparent regional regulatory framework for trade and investment in the EAC Partner States, thus supporting the conditions for increasing investment, and private sector initiative; and
• Strengthen the existing relations between the Parties on the basis of solidarity and mutual interest. To this end, consistent with their WTO rights and obligations, this
4 Cotonou Agreement, Article 34 §1.
Box 1: What is the EAC?
East Africa is a geographically and economically homogeneous region committed to regional integration. The East African Community (EAC) consists of Burundi, Rwanda, Tanzania, Uganda and Kenya.
The EAC established a Customs Union in 2005 which was fully-fledged with zero internal tariffs as from 2010. The EAC, in fast tracking its economic integration process, ratified a more far-reaching common market protocol in July 2010. In November 2013, EAC Members signed a protocol on a monetary union. The integration agenda of the EAC is strongly political in nature as its ultimate goal is to become a federation.
Full implementation is far from having been achieved though. Internal borders remain for the movement of goods (under the Single Customs Territory protocols adopted in 2013; imports into one EAC Partner State that move to another must pay the import duty and the exporter must claim a refund from the State in which the imports first entered into circulation). The EAC Partner States also have not abolished work permits to allow the free movement of labour. And internal standards and regulations have not been fully harmonized.

11
agreement shall enhance commercial and economic relations, support a new trading dynamic between the Parties by means of the progressive, asymmetrical liberalisation of trade between them and reinforce, broaden and deepen cooperation in all areas relevant to trade and investment.
12
3. Content of the EAC-EU EPA
3.1. Trade in Goods
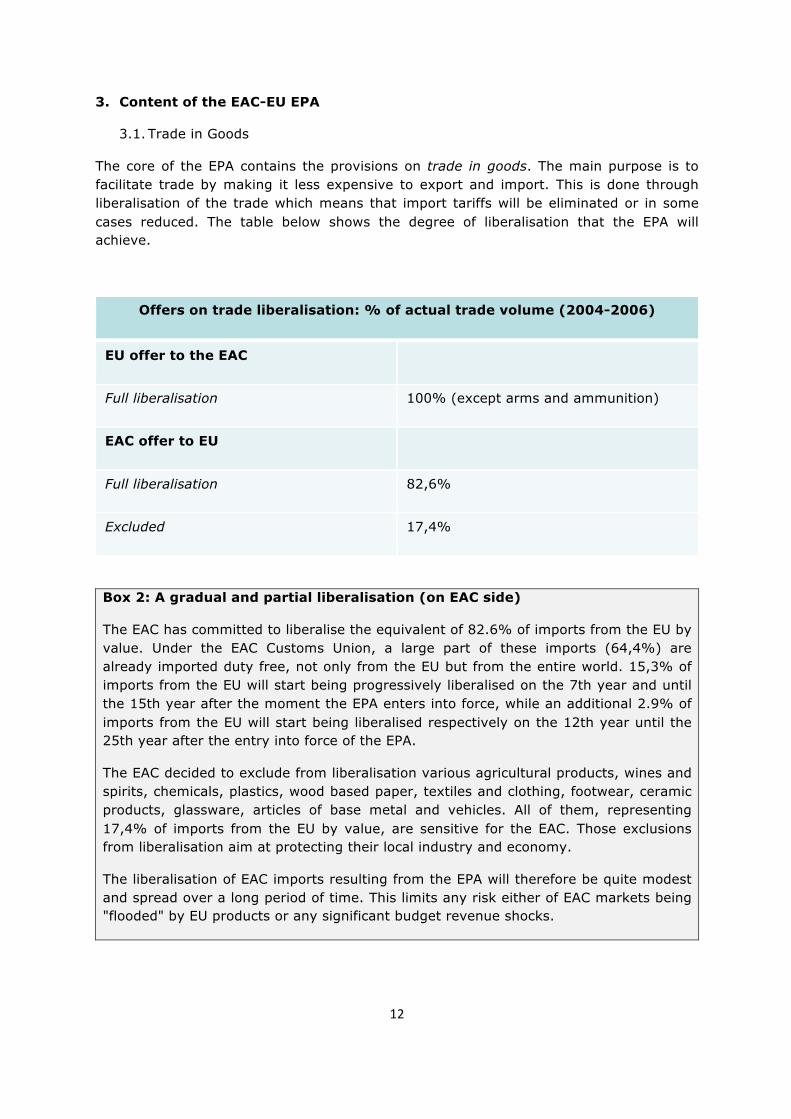
The core of the EPA contains the provisions on trade in goods. The main purpose is to facilitate trade by making it less expensive to export and import. This is done through liberalisation of the trade which means that import tariffs will be eliminated or in some cases reduced. The table below shows the degree of liberalisation that the EPA will achieve.
Offers on trade liberalisation: % of actual trade volume (2004-2006)
EU offer to the EAC
Full liberalisation 100% (except arms and ammunition)
EAC offer to EU
Full liberalisation 82,6%
Excluded 17,4%
Box 2: A gradual and partial liberalisation (on EAC side)
The EAC has committed to liberalise the equivalent of 82.6% of imports from the EU by value. Under the EAC Customs Union, a large part of these imports (64,4%) are already imported duty free, not only from the EU but from the entire world. 15,3% of imports from the EU will start being progressively liberalised on the 7th year and until the 15th year after the moment the EPA enters into force, while an additional 2.9% of imports from the EU will start being liberalised respectively on the 12th year until the 25th year after the entry into force of the EPA.
The EAC decided to exclude from liberalisation various agricultural products, wines and spirits, chemicals, plastics, wood based paper, textiles and clothing, footwear, ceramic products, glassware, articles of base metal and vehicles. All of them, representing 17,4% of imports from the EU by value, are sensitive for the EAC. Those exclusions from liberalisation aim at protecting their local industry and economy.
The liberalisation of EAC imports resulting from the EPA will therefore be quite modest and spread over a long period of time. This limits any risk either of EAC markets being "flooded" by EU products or any significant budget revenue shocks.

13
The EPA guarantees that all the EAC countries will have free access to the EU market (except arms and ammunition). This is not different from the situation today, but it is very different from how the situation would develop in the absence of the EPA. Kenya's exports would fall under GSP and MFN tariffs, with high risk of market loss – but thanks to the EPA its exports to the EU will continue to benefit from the duty-free quota-free access. For the four other EAC countries, it is also an important achievement, because thanks to the EPA, this free access will no longer depend on a unilateral policy that the EU can change at its discretion like Everything-but-Arms or GSP (the EPA is a treaty between two parties, not a unilateral scheme). This preferential treatment will not change even if an EAC State attains the economic development of a middle-income or advanced country.
Box 3: Why the four EAC members as LDCs join the EPA?
Tanzania, Uganda, Rwanda and Burundi are classified as least developed countries (LDCs). Under Everything-but-Arms, LDCs already have free market access to the EU. The EBA regime is very generous, but it is a scheme that remains at the EU’s discretion and is also meant to be temporary given its link to a country’s development. The EPA, by contrast, locks in the free access to the EU, because the access is laid down in a treaty between the parties. The EPA is also a reciprocal agreement. By opening their markets to a limited and well-balanced selection of European products, these countries will gain better access to intermediate products necessary to diversify their economies.
EPAs are about much more than just tariff liberalisation. EPAs aim at creating a real trade–for–development partnership covering technical barriers to trade, sustainable development, food safety standards, customs cooperation and more. But even in terms of pure market access, EPAs offer better conditions than Everything But Arms, such as for instance extended cumulation of origin at regional level. Simpler rules of origin also help exports in textiles, agriculture and fisheries.
The EPA creates joint institutions which provide a space of discussion between partners in order to solve trade issues. That space does not exist for EAC countries in their trade relations with the EU (the EU is only committed unilaterally through the EBA regime).
Finally, the four EAC LDCs are linked together and with Kenya in an ambitious integration project. The five formed a bloc which has already an established fully-fledged customs union. The five offered thus a single market access schedule that fitted to their common external tariffs. The decision to engage into regional negotiations of an EPA with the EU is the consequence of that regional integration agenda.
The EPA chapter on trade in goods also covers export duties. The parties have agreed that no new duties or taxes on exports shall be introduced. They have also agreed that the export duties currently applied shall not be increased. In exceptional circumstances, however, and if the EAC states can justify it for reasons of fostering the development of

14
domestic industry, or maintaining currency stability or protecting revenue, food security and environment, export duties may be temporarily introduced on a limited number of goods.
Finally, the EAC EU EPA also contains MFN clauses. The first can be found in the article on export duties and provides that exports to the EU will face the same treatment as exports to another major trading partner. The second MFN clause can be found in a general article on more favourable treatment. The principle of that clause is that if one party grants a more favourable treatment to a third party with respect to the goods covered by the EPA, it will grant the same treatment to the other party. It has however been agreed that this clause shall not apply in respect of trade agreements between the EAC Partner States with countries of the African, Caribbean and Pacific Groups, or other African countries and regions. This will foster further regional integration, one of the objectives of the EAC EU EPA. Further, the EAC Partner States, when they grant in respect of trade goods any more favourable treatment to another major trading economy, the EU and the EAC shall enter into consultation to see whether and how this more favourable treatment can be extended to the EU.
3.2. Development
The EAC EU EPA is a bilateral trade agreement between developed and developing countries with an explicit development objective. This is materialised through three pillars:
• trade rules that constitute a key contribution to the reform agenda and better business environment in the EAC Partner States,
• an "asymmetry" in the commitments to take into account the different level of development,
• the development assistance which revolves around the needs for the partner countries to respond to the first two pillars.
This kind of agreement is an integrated tool of trade and development that can boost trade between the parties and contribute substantially to the overall development of the EAC partners by strengthening their regional integration.
Through the agreement both the EU and the individual Member States commit to supporting the implementation of the EAC EU EPA through development cooperation. The EPA addresses the developmental needs of the EAC Partner States by increasing production and supply capacity, fostering structural transformation and competitiveness of their economies, enhancing their economic diversification and by adding value, in order to promote sustainable development and support regional integration.
To make this development cooperation a smooth process, the EPA already lists priorities and identifies possible interventions so that the allocation of funding will not have to be designed from scratch. The scale of the development assistance should not be underestimated. Funding allocation under the European Development Fund for the period of 2014-2020 potentially in support to EPA implementation in the EAC amounts to €1,4

15
billion from the national programmes mainly in agriculture, transport and energy. In addition the region has access to:
• €1 billion from the Eastern Africa-Southern Africa-Indian Ocean regional programme, which supports regional integration including trade facilitation and financing of infrastructure through blending.
• €600 million from the intra-ACP programme, which supports business environment and access to markets for micro and SMEs and increases access to finance for enterprises, in particular SMEs.
• €17,5 million allocated to support trade facilitation, Continental Free Trade Agreement, strengthening of customs and trade policy definition harmonisation and implementation and improving standards in SPS.
Besides this funding, the agreement offers a host of "asymmetries", i.e. provisions that are drafted to favour the EAC Partner States in recognition of the fact that the EU as a whole is more economically developed than its EPA partners. There are many such provisions but the most salient ones are the following:
• Asymmetric market access: as described above, the EU grants full market access to the EAC countries. In return, the EAC countries have to liberalise much less. EAC has to fully liberalise 82,6% of its trade volume with the EU within a long time period. Outside EPAs, the EU has never before offered full market access in another free trade agreement nor has it accepted such an asymmetry in market opening. It means that the EAC Partner States have been able to shield numerous sensitive products from liberalisation.
• Safeguards: Besides the flexibility that the EU has provided in terms of market access, the EAC members can also invoke safeguard measures, if needed. These safeguards are meant to protect countries from imports that increase to such an extent that it causes or threatens to cause injury to the domestic industry with particularly favourable conditions for its infant industry for a period going up to 15 years after the entry into force of the EPA.
• Asymmetric rules of origin: the EAC obtained more lenient rules for its products of interest to be exported to the EU than the EU for its exports to the EAC. This asymmetry reflects the needs of the EAC producers, who will be in a better position to comply with the conditions for exporting their products to the EU market.
• Cumulation of origin: cumulation allows producers to source inputs from various sources, transform them locally and still export them to the EU duty-free quota-free. For instance, to export canned fruit to the EU under preferential access, the fruit would be harvested in the exporting country and it would then also be canned in the same country: cumulation of origin is a concession that allows the fruit to be harvested in one EAC country, and then preserved and canned in another. This can be done without losing the preferential market access to the EU. This is just an example of how cumulation of origin works but EAC countries can benefit from such provisions not only within the EAC but also with the EU’s EPA, GSP and FTA partners.

16
3.3. Rules of Origin
Rules of origin are part of any free trade agreement leading to a preferential reduction of tariffs. In today's global economy, many sectors are characterised by successive steps of production organised in international value chains. As a result, final products are composed of components and inputs of various country origins. It is important, therefore, to distinguish the goods which qualify for the preferences agreed under the EPA (because they "originate" from the EU or the EAC), from those goods which do not.
Rules of origin distinguish between “wholly obtained” products and “substantially transformed” products and those which are considered not to originate from the country. For that purpose, the agreement defines:
• The conditions for products to be considered as wholly obtained in the EAC or in the EU. One can think of for instance mineral products extracted from their soil, live animals born and raised there, and so on.
• The types of working or processing operations considered as insufficient to confer the status of originating product. Removal of coverings or affixing of labels are examples of such insufficient processing operations.
• The types of working or processing operations considered as sufficient to confer the status of originating products ("substantial transformation"). Specific annexes define the applicable criteria per category of products (specific conditions). An example is the textile sector, where only "single transformation" is required. This means that origin is conferred by a single set of processing operations leading to clothing, such as spinning, weaving or assembly. This is in contrast to the previous "double transformation rule" whereby an operator would have to make yarn into fabric and fabric into clothing.
• Cumulation of origin, which is a derogation from the basic principle that a product should obtain originating status in a single country, means that producers in more than one country may jointly meet the requirements for a "substantial transformation". An example for canned fruit was given above. Under the Agreement, cumulation or origin is extended to the EU and the EAC, but also to other ACP States which apply an EPA or to the Overseas Countries and Territories associated with the EU (OCTs). Furthermore, new cumulation possibilities are allowed under certain conditions with the EU's GSP and FTA partners. This provision takes account of the fact that value chains extend across different zones: inputs can therefore be sourced from various countries without the risk of losing preferential treatment when exported to the EU. Rules of origin are therefore a key element for investment location decisions in the manufacturing sectors. In the long term, the geographical extension will contribute to a better integration of ACP countries in global value chains as well as the creation of value chains across ACP countries.

17
Box 5: Sustainable development in the EAC – EU EPA
The preamble of the EU-EAC EPA stipulates the object and purpose of the agreement. The seventh recital of the preamble states that parties agreed that their trade and economic cooperation shall aim at, inter alia, promoting their sustainable development. The ninth recital reaffirms that the EPA shall serve as an instrument of development and shall promote sustained growth. This indicates that sustainable development is one objective of the agreement, and this objective inspires the interpretation of the provisions throughout the EPA. Article 2 of the EPA recalls that the establishment of a strengthened and strategic trade and development partnership has to be consistent with the objective of sustainable development. In that regard, an explicit reference is made to the objectives and principles set out in the Cotonou Agreement. This covers as well the "essential and fundamental" elements set out in Article 9 of the Cotonou Agreement, i.e. human rights, democratic principles, the rule of law, and good governance. As such, it offers some of the strongest language on rights and sustainable development available in EU agreements. By way of an article commonly called the "non-execution clause" (Article 136), the agreement confirms that “appropriate measures” (as set out under the Cotonou Agreement) can be taken if any party fails to fulfil its obligations in respect of those elements. Suspension of trade benefits remains one such measure even if this will be considered an action of last resort. While a full sustainable development chapter is left for future discussions under the "rendez-vous clauses" (Article 3), the Committee of Senior Officials is already tasked with the function of monitoring and assessing the impact of the implementation of the agreement on the sustainable development of the parties. That task is facilitated by the work of the EPA Consultative Committee (civil society) which will also monitor the implementation of the EPA.

18
4. Overview of the economic and trade relations between the EU and the EAC
4.1. The economy of the East African Community
The five East African countries (Burundi, Kenya, Rwanda, Tanzania and Uganda) have a total population of about 150 million people with Burundi and Rwanda significantly smaller than Kenya, Tanzania and Uganda. Tanzania is the country with the largest population and territory, but Kenya's Gross Domestic Product (GDP) amounted to almost 46 billion euro in 2014, i.e. more than 40% of total EAC GDP. Together with Tanzania and Uganda, the top three economies represent more than 90% of total East African GDP. In contrast, Burundi's share is less than 2% with GDP (2 billion euro in 2014). From the East African Community, only Kenya is not classified as a Least Developed Country5. Rwanda, the second smallest country in terms of GDP and population, has had in the last five years the highest average growth rate.
Table 4.1: Overview of EAC economies, 2014
Country GDP, 2014 (Mn EURO)
Area (km²)
Ranka (GDP 2014)
Population 2014 (Millions)
GDP per capita, 2014 (EURO/capita)
Average GDP growth rateb (%)
Burundi 2,180 27.4 162 9.2 237 4.6
Kenya 45,869 581.3 75 43.0 1,067 6.0
Rwanda 5,940 26.3 145 11.0 540 7.1
Tanzania 36,198 945.2 87 46.7 774 6.7
Uganda 20,714 236.1 102 38.7 535 5.2
EAC 110,901 1.816.7 114c 148.7 746d 6.1e
Sources: IMF – World Economic Outlook 2016; Eurostat Note: (a) The rank column refers to the comparison of 191 countries based on 2014 GDP per capita figures; (b) The average GDP growth rate column is based on the simple average of annual GDP growth rates from 2010 to 2014; (c)-(e) Values in italics in the last row are averages (EAC average Rank, GDP per capita, Average GDP growth rate; (c) Simple average of EAC members' ranks; (d) EAC Average GDP per capita obtained by diving total EAC GDP by total EAC population; (e) Weighted average according to share of EAC countries from total EAC GDP.
In the period 2010-2015, the average annual GDP growth rate was slightly above 6% for EAC countries with relatively small differences between the fastest growing economy (Rwanda with 7.1%) and the slowest (Burundi with 4.6%).
As Table 4.2 indicates, East African countries score rather well among African countries in terms of global competitiveness as defined by the World Economic Forum Global 5 http://www.un.org/en/development/desa/policy/cdp/ldc/ldc_list.pdf

19
Competitiveness Index (GCI). The GCI analyses competitiveness along 12 pillars, including amongst others institutions, infrastructure, macroeconomic environment, health and education, goods and labour market efficiency, market size, and innovation with weights according to the development stage of each country. Out of 140 states ranked, Rwanda scores the highest from the East African Community according to the Global Competitiveness Index (58th/140).
Similarly, Rwanda tops the EAC group in the World Bank's Ease of Doing Business ranking (62nd/189) which incorporates issues such as "Registering Property", "Getting Credit", and "Trading Across Borders" (See Figure 4.1 and Box 4.1). In 2015 however, EAC countries rank on average 117th in the Doing Business Index (out of 189 countries) pointing to substantial margins for improvement. The most important challenges in the region are "Trading Across Borders" (average rank of 150/189), "Getting Electricity" (average rank of 136/189) and "Dealing With Construction Permits" (average rank of 128/189). Infrastructure-related obstacles to trade are highlighted in the World Bank's Logistics Performance Index as well, with average rank across EAC countries in 2014 at 100 out of 160.
Table 4.2: EAC competitiveness
Global Competitiveness Index Ranka (2015/2016)
Ease of Doing Business Rankb (2015)
Logistics Performance Index Rankc (2014)
Burundi 136 152 107
Kenya 99 108 74
Rwanda 58 62 80
Tanzania 120 139 138
Uganda 115 122 N/Ad
EAC simple average 106 117 100d
Source: (a) WEF: Rank out of 140 countries; (b) WB: Rank out of 189 countries; (c) WB: Rank out of 160 countries; (d) Data is not available for Uganda in the 2014 dataset, hence the EAC average does not include all EAC countries. Last available data from 2010 ranks Uganda 66th.

20
Figure 4.1: Ease of Doing Business, 2015
Box 4.1: Doing Business in EAC – the case of Rwanda
Rwanda scores well above the EAC average on competitiveness measures including the World Economic Forum's Global Competitiveness Index as well as the World Bank's Doing Business and Logistics Performance Indices despite having the second smallest economy in terms of GDP in the East African Community. Easy access to credit and positive financial market developments as well as strengthening institutions, especially vis-a-vis property rights provide Rwanda's competitive advantage whilst serious challenges remain in trading across borders and insufficient infrastructure, particularly with regards to electricity (The Economist 2012). Figure 1 shows that Rwanda seems to score particularly high in "registering properties" and "getting credit" and better than the others for "starting a business" and "paying taxes". Rwanda has made significant improvements in the following areas: - major leaps in Getting credit (moved from 13th to 4th in the world), - dealing with Construction permits (moved from 85th to 34th), - Resolving insolvency (moved from 137th to 101st). Rwanda’s distance from frontier metric (DTC) went up from 69.40 in 2014 to 70.47 in 2015.

21
4.2. EAC trade with the world
All countries of the East African Community are members of the World Trade Organization (WTO). In 2015, total EAC goods exports to the world amounted to more than 9.4 billion euro whereas EAC imports from the world, excluding intra-EAC trade, stood at 35.0 billion euro in the same year (Table 4.3). Overall, EAC imports have tripled in the last 10 years with exports only doubling. This implies a substantial worsening of the already negative EAC goods trade balance with the rest of the world to about 26.2 billion euro in 2015.
The majority of goods exports from the East African Community are directed to the EU market and other East African Community countries. EAC imports however are supplied increasingly by China and India, with the EU becoming the third largest trade partner in terms of East African Community imports in 2015. In 2012, the European Union was still the largest source of imports for EAC countries, indicating that the emergence of China and India as key EAC import partners is a rather recent phenomenon. Such patterns merely point to higher growth rates of EAC imports from China and India compared to that of imports from the EU, not to absolute decline in the East African's imports from the Europe. The East African Community's imports from the European Union in fact, have increased steadily in the past 10 years from 2.6 billion euro in 2006 to nearly 4.5 billion euro in 2015.
Table 4.3: East African Community's key trading partners in goods trade excluding intra-EAC trade (million EUR)
EAC Exports in goods
EAC Imports in goods
2006 2009 2012 2015 Share (a) 2006 2009 2012 2015 Share
(a)
EU 28 1,310 1,518 1,864 2,379 25.3%
China 799 1,642 3,860 10,834 30.4%
India 119 218 458 936 10.0% India 847 1,644 3,629 5,400 15.2%
USA 274 224 369 646 6.9% EU 28 2,593 2,806 3,905 4,463 12.5%
DRCb 153 246 404 541 5.8% UAEc 1,335 1,328 2,382 2,424 6.8%
UAEc 257 257 515 521 5.5% S. Africa 865 1,127 1,279 1,433 4.0%
China 148 180 405 498 5.3% Japan 595 757 994 1,369 3.8%
Pakistan 182 168 267 300 3.2% USA 502 701 946 1,207 3.4%
Japan 84 115 180 265 2.8% S.Arabia 481 451 999 1,110 3.1%
Egypt 116 116 206 217 2.3% Bahrain 297 244 556 899 2.5%
Russia 38 71 107 195 2.1% Malaysia 128 115 225 601 1.7%
World (ex-EAC)d
4,200 4,451 7,472 9,402 100% World (ex-EAC)d
11,104 13,636 24,736 35,627 100%
Source: IMF DOTS Note: (a) Shares calculated based on 2015 figures; (b) DRC is short for the Democratic Republic of Congo; (c) UAE stands for the United Arab Emirates; (d) World aggregation excludes intra-EAC trade.

22
In terms of sectoral trade, the majority of EAC exports to the EU are agricultural products (i.e. vegetables), whereas machinery and appliances, chemical products, and transport equipment are the most important sectors in EAC imports from the EU (tables A1 and A2 in Annex II and discussion in section 3.3.1). However, East African Community members increasingly import machinery and appliances (HS XVI) as well as base metals (HS XV) from China. In the recent years electrical and electronic equipment exports to EAC from China skyrocketed. Likewise, Indian exports of mineral products (HS V) have risen sharply since 2012, especially mineral fuels, oils and distillation products.
Total intra-EAC imports, slightly below 2.4 billion euro in 2015, represent about 6% of total EAC imports from the world. With regards to bilateral trade balance of EAC members within the group, Kenya is the only country with positive trade balance with each partner. Kenya is both the biggest exporter and the second smallest importer after Burundi (Table 4.4). Tanzania has a positive trade balance with each EAC country bilaterally except for Kenya, while Uganda has a trade surplus only with Rwanda and Burundi, and Rwanda has a surplus solely with Burundi. Finally, Burundi has a negative trade balance with all other EAC countries.
Table 1.4: Intra-EAC trade in 2015 (million euro)
Burundi imports
Kenya imports
Rwanda imports
Tanzania imports
Uganda imports EAC
Burundi exports - 0.3 4.9 1.5 8.6 15.3
Kenya exports 90.8 - 167.2 496.7 689.7 1,444.5
Rwanda exports 11.1 7.6 - 1.6 3.9 24.2
Tanzania exports 50.5 193.7 72.2 - 74.9 391.3
Uganda exports 44.5 184.0 223.9 45.0 - 497.4
EAC 196.9 385.6 468.2 544.8 777.1 2,372.6
Source: IMF DOTS
4.3. Trade relations between the EU and EAC
4.3.1. Trade in goods
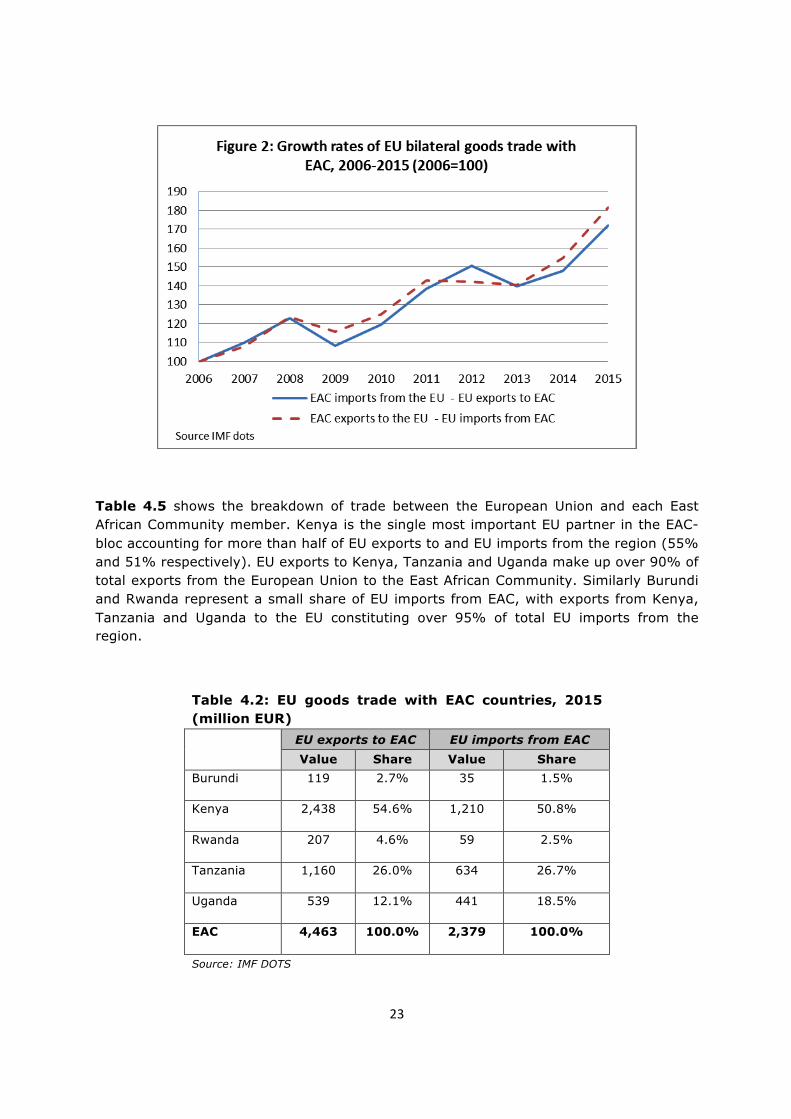
In the 2006-2015 period, EU-EAC goods trade has expanded substantially, with EU exports increasing from 2.6 billion EURO in 2006 to 4.5 billion EURO in 2015, and EAC exports rising from 1.3 billion EURO to 2.4 billion EUR in the past decade. As Figure 4.2 illustrates, EU exports to EAC have grown at a similar rate than EAC exports to the EU. The trade deficit of the East African Community with respect to the European Union slightly grew from 1.3 billion EUR in 2006 to 2.1 billion EUR in 2015.
23
Table 4.5 shows the breakdown of trade between the European Union and each East African Community member. Kenya is the single most important EU partner in the EAC-bloc accounting for more than half of EU exports to and EU imports from the region (55% and 51% respectively). EU exports to Kenya, Tanzania and Uganda make up over 90% of total exports from the European Union to the East African Community. Similarly Burundi and Rwanda represent a small share of EU imports from EAC, with exports from Kenya, Tanzania and Uganda to the EU constituting over 95% of total EU imports from the region.
Table 4.2: EU goods trade with EAC countries, 2015 (million EUR)
EU exports to EAC EU imports from EAC Value Share Value Share
Burundi 119 2.7% 35 1.5%
Kenya 2,438 54.6% 1,210 50.8%
Rwanda 207 4.6% 59 2.5%
Tanzania 1,160 26.0% 634 26.7%
Uganda 539 12.1% 441 18.5%
EAC 4,463 100.0% 2,379 100.0%
Source: IMF DOTS
24
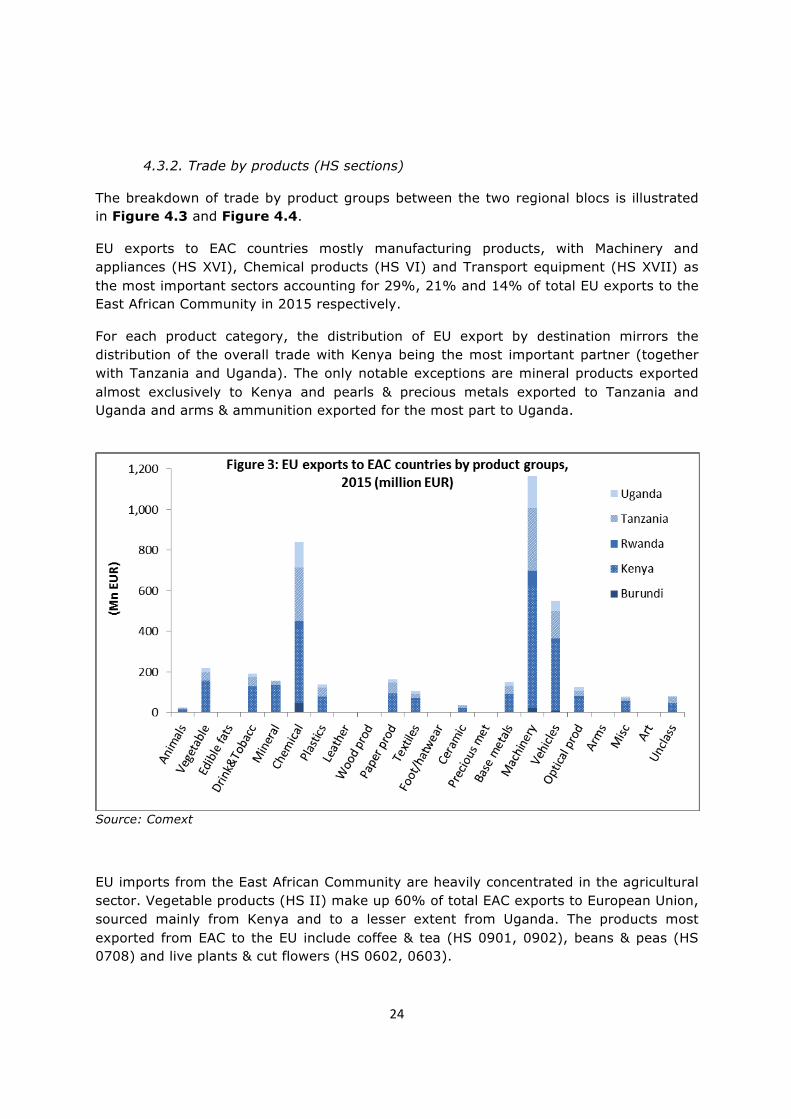
4.3.2. Trade by products (HS sections)
The breakdown of trade by product groups between the two regional blocs is illustrated in Figure 4.3 and Figure 4.4.
EU exports to EAC countries mostly manufacturing products, with Machinery and appliances (HS XVI), Chemical products (HS VI) and Transport equipment (HS XVII) as the most important sectors accounting for 29%, 21% and 14% of total EU exports to the East African Community in 2015 respectively.
For each product category, the distribution of EU export by destination mirrors the distribution of the overall trade with Kenya being the most important partner (together with Tanzania and Uganda). The only notable exceptions are mineral products exported almost exclusively to Kenya and pearls & precious metals exported to Tanzania and Uganda and arms & ammunition exported for the most part to Uganda.
Source: Comext
EU imports from the East African Community are heavily concentrated in the agricultural sector. Vegetable products (HS II) make up 60% of total EAC exports to European Union, sourced mainly from Kenya and to a lesser extent from Uganda. The products most exported from EAC to the EU include coffee & tea (HS 0901, 0902), beans & peas (HS 0708) and live plants & cut flowers (HS 0602, 0603).

25
Source: Comext
Tables A1 and A1 in the Annex II present the detailed product breakdown of EU trade with each EAC country.
4.3.3. EU preferential regime granted to EAC
All EAC countries except Kenya are Least Developed Countries and do not face tariffs when exporting to the EU market, for all products except arms. Kenya has been benefitting from the Market Access Regulation (MAR), not facing duties when exporting to the EU since 1 January 20086, with the exception of a short period from 1 October to 25 December 2014; Kenya had been temporarily removed from the MAR on 1st October 20147. On 24 December 20148, Kenya was reinserted in the list of countries benefiting from MAR as it concluded negotiations on an Economic Partnership Agreement on 16 October 2014.
In the absence of the EPA, Kenya would benefit from the GSP regime except for cut flowers which would be subject to MFN treatment due to Kenya's graduation for this sector.
The GSP regime is still preferential with zero duties on many products but it attracts duties (albeit lower than in MFN treatment) to quite a few products in particular
6 Market Access Regulation (MAR) http://eur-lex.europa.eu/LexUriServ/LexUriServ.do?uri=OJ:L:2007:348:0001:0154:EN:PDF 7 Regulation (EU) No 527/2013 of the European Parliament and of the Council of 21 May 2013 amending Council Regulation
(EC) No 1528/2007 as regards the exclusion of a number of countries from the list of regions or states which have concluded negotiations (OJ L 165, 18.6.2013, p. 59)
8 Regulation (EU) No 1387/2014 of 14/11/2014 (OJ 369, 24.12.2014, p.35)

26
agricultural products of interest to Kenya. For example for "Peas and beans", under GSP would face a tariff of 10.10% and for "Fish" of 20.50%.
Free access to the EU market is key for Kenya. A change of regime from duty-free quota-free to GSP would affect in total 184 tariff lines in 15 chapters (which would become subject to duties). This would be even more detrimental for Kenya's horticultural sector, which constitutes one of the main export product to the EU (see Figure 4 and Table A2) and for which the risk of losing the EU market is considerable since, under GSP and in the absence of the EPA, cut flowers will be graduated from GSP to MFN duties as from 1 January 2017 which are between 8.5% and 12%).
4.3.4. EAC tariff structure
The EAC has a Common External Tariff (CET) on its imports from third countries. The EAC CET has three band rates (for raw materials: 0%, intermediate products: 10% and finished goods: 25%), the latter percentage is fixed as the maximum although rates above 25% still apply to some "sensitive" products. This represents a significance decrease from what was previously the maximum in Kenya (35%) and Tanzania (40%), i.e. the EAC's main economies.
The EU is facing nearly 16% average tariff ranging by product group from 3% to more than 25%. The lowest tariffs are applied to the products that the EU is already exporting more (chemicals, machinery and motor vehicles) while the highest tariffs are on agricultural products but also on manufacturing products such as textile, footwear and glass articles.
Table 4.3: EAC tariff structure by product groups HS section Label Tariff ratea (%)
01 Live animals, animal products 25.5
02 Vegetable products 19.4
03 Animal or vegetable fats and oils 14.2
04 Foodstuffs, beverages, tobacco 21.4
05 Mineral products 4.8
06 Products of the chemical or allied industries 3.0
07 Plastics, rubber and articles thereof 10.6
08 Raw hides, skins and saddlery 14.3
09 Wood, charcoal, cork and articles thereof 16.1
10 Pulp of wood, paper and paperboard 11.8
11 Textiles and textile articles 20.7
12 Footwear, hats and other headgear 21.9

27
Table 4.3: EAC tariff structure by product groups HS section Label Tariff ratea (%)
13 Articles of stone, glass, ceramics 17.3
14 Pearls, precious metals and articles thereof 22.4
15 Base metals and articles thereof 10.5
16 Machinery and appliances 6.0
17 Transport equipment 7.1
18 Optical and photographic instruments 8.8
19 Arms and ammunition 25.0
20 Miscellaneous manufactured articles 22.6
21 Works of art, antiques 25.0
Total 15.6
Source: MADB Note: a Tariff rates are based on the simple average tariff rate on all lines within each section.
4.3.5. Trade in services
EAC countries have 1.2 billion euro positive trade balance in services with the rest of the world thanks to 8.8 billion euro of exports and 7.6 million euro of imports (Table 4.7).
Table 4.7: EAC trade in services (million EUR)
EAC with the world
EAC with the EU
EAC
exports EAC
imports EAC trade balance
EAC exports
EAC imports
EAC trade
balance 2010 5,677 4,915 +762
1,587 1,858 -271
2011 6,638 5,525 +1,113
1,625 1,900 -276
2012 7,839 6,111 +1,728
2,032 2,212 -180
2013 8,289 6,423 +1,866
1,941 2,410 -469
2014 8,864 7,599 +1,265
1,871 2,200 -329
Source: WTO (Prepared by DG TRADE)
The largest services exporters are Kenya (45% of total EAC exports of services), followed by Tanzania and Uganda (about 31% and 18% respectively). The biggest importers are Kenya, Uganda and Tanzania and Kenya (each accounting for slightly less than one third of total EAC imports of services – 31%, 29%, 28% respectively). Burundi and Rwanda
28
together account for less than 6% of total EAC services exports to the world and slightly more than 10% of total EAC services imports from the rest of the world.
The main services exported by EAC are travel and transportation (respectively 36% and 30% of total EAC services exports respectively). Transport is also the largest EAC import sector accounting for almost half of total EAC service imports from the world (46%), followed by travel (17%). These sectors are the most important import and export items of all EAC countries except for Burundi but also for Uganda and Rwanda which do not export so much transport services.
Burundi and Kenya are also exporters of telecom services which represent 22% and 13% of their total exports of services respectively.
Despite the surplus with the world, EAC countries have a small trade deficit with the EU (Table 7). The largest exporter of services to the EU is Kenya (51% of EAC exports in 2014), followed by Tanzania and Uganda (30% and 14% respectively). Similar picture for imports, Kenya imports 56% of all the services coming to the region from the EU, Tanzania 20% and Uganda 14%.
3.3.6. FDI
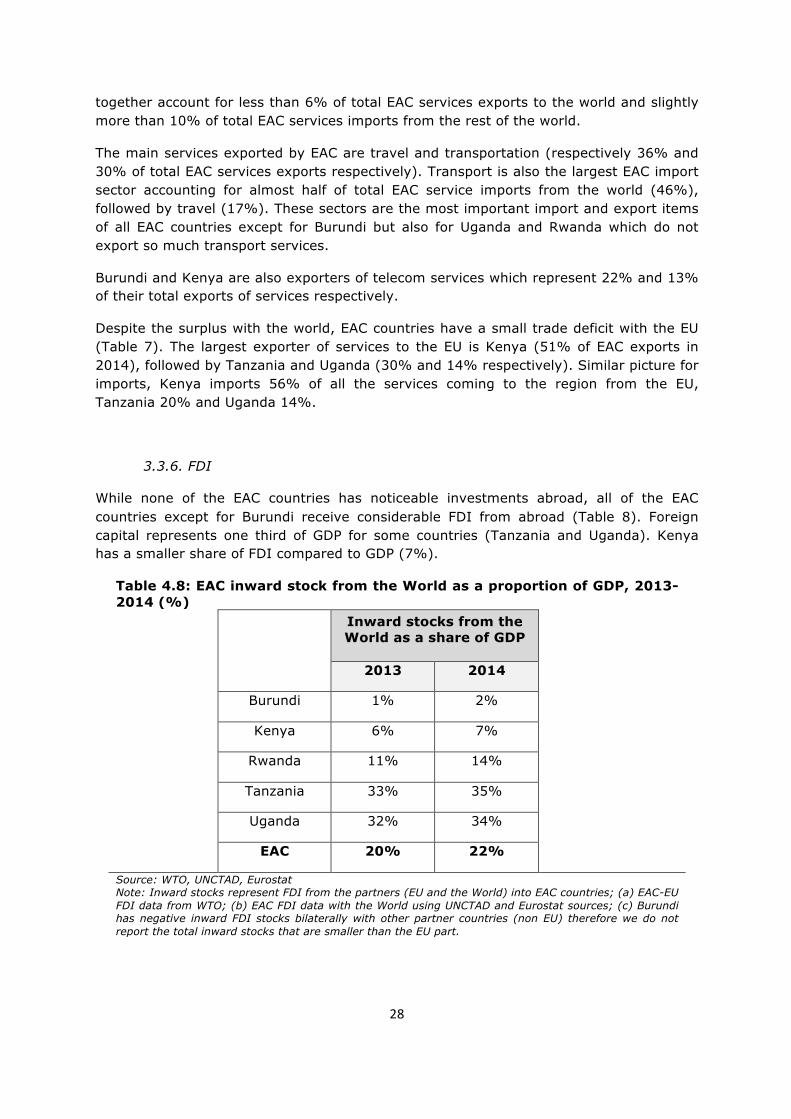
While none of the EAC countries has noticeable investments abroad, all of the EAC countries except for Burundi receive considerable FDI from abroad (Table 8). Foreign capital represents one third of GDP for some countries (Tanzania and Uganda). Kenya has a smaller share of FDI compared to GDP (7%).
Table 4.8: EAC inward stock from the World as a proportion of GDP, 2013-2014 (%)
Inward stocks from the World as a share of GDP
2013 2014
Burundi 1% 2%
Kenya 6% 7%
Rwanda 11% 14%
Tanzania 33% 35%
Uganda 32% 34%
EAC 20% 22%
Source: WTO, UNCTAD, Eurostat Note: Inward stocks represent FDI from the partners (EU and the World) into EAC countries; (a) EAC-EU FDI data from WTO; (b) EAC FDI data with the World using UNCTAD and Eurostat sources; (c) Burundi has negative inward FDI stocks bilaterally with other partner countries (non EU) therefore we do not report the total inward stocks that are smaller than the EU part.

29
The EU is a big investor in the region and the EU share of inward investments is particularly high in Kenya (80% in 2013 and 55% in 2014), followed by Tanzania (30%) and Rwanda (21%).
Table 4.9: EAC FDI stocks with the EU and the World, 2013-2014 (million EUR and %)
Inward stocks from the EUa
Inward stocks from the Worldb
Share of EU inward stock over total
2013 2014 2013 2014 2013 2014
Burundi 131 137 (c) (c) n/a n/a
Kenya 2,031 1,801 2,546 3,289 80% 55%
Rwanda 279 177 631 832 44% 21%
Tanzania 1,121 2,215 6,604 7,465 17% 30%
Uganda 1,170 1,224 11,198 12,806 10% 10%
EAC 4,731 5,554 20,990 24,429 23% 23%
Source: WTO, UNCTAD, Eurostat Note: Inward stocks represent FDI from the partners (EU and the World) into EAC countries; (a) EAC-EU FDI data from WTO; (b) EAC FDI data with the World using UNCTAD and Eurostat sources; (c) Burundi has negative inward FDI stocks bilaterally with other partner countries (non EU) therefore we do not report the total inward stocks that are smaller than the EU part.

30
5. Literature review
This chapter presents an overview of the studies in the literature on the economic impact of EPAs on the East African Community.
The most relevant work is the article by De Melo and Regolo (2014) that focuses directly on the impact on EAC of the EU-EAC EPA. They use Customs data and estimates small revenue and welfare impacts.
The authors start from the observation that the agreement will only bring marginal tariff reduction since most EAC members already have duty-free-quota-free access to the EU. However, this is not the case of Kenya, the biggest among EAC countries, which without the agreement would lose its QFTF access to the EU and move to GSP. For this country a proper counterfactual evaluation would be needed.
Quantitatively, they first calculate the duty losses on the basis of 2011 imports (corresponding to the tariff revenue EAC countries had in 2011 on the imports from the EU) and for Rwanda and Uganda on the basis of customs data. For these latter two countries they also estimate the same losses with a partial equilibrium model. This model accounts for the response of imports to the reduction of tariff but not for secondary effects such as the impact on GDP growth and consequently on the supply side of the economy and exports like general equilibrium models do. In all cases they find that the revenue losses are small (from 0.8% for Burundi to 3.3% for Tanzania and Kenya) and are accompanied by a small increase in welfare. Overall they highlight the small benefits deriving for EAC countries from the EPA agreement that covers only goods stressing that a deeper agreement (that would have also included services and FDI) would have been more beneficial.
Finally also the study by Mbithi et al (2015) uses a partial equilibrium model and assesses the impact of the EPA on EAC's imports of manufacturing products from the EU which without the agreement are subject to duties (EAC CET). They estimate an increase of EAC imports from the EU of 9% driven by increased consumption of EU goods that become cheaper. Since there is a substantial share of trade creation, they also find an increase in the consumer surplus and therefore in welfare. Of the five EAC countries, Kenya is likely to experience the largest gains in welfare followed by Tanzania, Uganda, Rwanda and Burundi.
All the studies reviewed show similar findings using similar modelling tools. They all fail to account for the counterfactual GSP scenario for Kenya and for general equilibrium effects deriving from liberalisation. Next chapter will present an analysis of the impacts of the EPA that will account for both.

31
6. Analysis of the potential economic effects of the tariff reductions set out in the EPA
The objective of this chapter is to assess the economic impact of the Economic Partnership Agreement between the European Union and the East African Community in terms of GDP (Gross Domestic Product), trade, output government revenue and poverty. It will first detail the modelling methodology, subsequently it will present the results of the economic assessment of the negotiated outcome, and finally it will summarize the modelling results.
6.1. Description of the methodology
The economic analysis is based on a dynamic multi-country multi-sector Computable General Equilibrium (CGE) model.9 Such models are designed to answer what-if questions by simulating the impact of certain changes in trade policy on macroeconomic variables such as income, prices, production and employment. These impacts are derived as differences between the policy scenarios and the dynamic baseline. The baseline scenario incorporates projections of the economic status-quo of the analysed economies, under the assumption that there are no specific changes in trade policy. The simulated scenarios, on the other hand, reflect the economic outcome of a policy change as a difference to the baseline. This set-up enables a straight-forward comparison between clearly distinguishable economic outcomes.
For the purposes of the present economic assessment, a variant of the Global Trade Analysis Project (GTAP) Computable General Equilibrium model is used with a recursive dynamic investment framework (based on a Monash-type investment function, Dixon and Rimmer 2002) and a poverty module. The gradual implementation of the EPA, i.e. gradual tariff reductions, necessitates the use of a dynamic version of the model, under which the model is being solved sequentially and the equilibrium is moved from one year to another.
Specific modelling features for the economic assessment of negotiated outcome of the EU-EAC EPA include:
• The construction of a GTAP-concorded Social Accounting Matrix (SAM) for Burundi, as the country is included in the "Rest of Africa" region in the GTAP-dataset;
9 The dynamic GTAP model (GDyn, Ianchovichina & McDougall, 2012) is a multi-sector, multi-region dynamic
general equilibrium model which extends the standard, comparative static version of the GTAP model (Hertel, 1997) by including international capital mobility, endogenous capital accumulation and adaptive expectations theory of investment in a recursive dynamics setting. Savings are treated as in the comparative static GTAP model where the representative household allocates regional income that would maximize per capita utility based on a Cobb–Douglas utility function complemented with non-homothetic preferences on the private consumption side. The Cobb–Douglas specification keeps the budget shares constant, implicitly assuming a constant marginal propensity to save of the household. Capital is assumed to be perfectly mobile across sectors determining a single rental price of capital that clears the market. As in most recursive dynamic models, each period's equilibrium determines the level of global savings and implicitly the aggregate amount of investment expenditure available in that specific period. International capital mobility is modelled using a disequilibrium approach that reconciles investment theory with empirical findings.

32
• Inclusion of a poverty module in the CGE model, (based on the GTAP poverty framework developed by Hertel et al. 2015) to facilitate the analysis of the agreement's impact on poverty;
More details on these modelling features can be found in Annex III
The simulations are based on the most recent version of Global Trade Analysis Project database (GTAP 9.0) with 2011 as base year. The database features 140 regions for all 57 GTAP commodities; regions and sectors are aggregated throughout the economic modelling as detailed in Annex IV, consistently with other EPA studies.10 Both the baseline and the EPA scenario are projected 25 years forward from the presumed implementation year of the agreement (2017) up to the year 2042 by using the IMF's World Economic Outlook (April 2016) and CEPII (Fouré et al 2012) forecasts for the evolution of macroeconomic variables . On top of the Agreement included in the GTAP (2011) dataset, the baseline also reflects Free Trade Agreements (FTAs) that have since entered into force or have been concluded: EU FTAs with Korea, Canada, West Africa, the Southern African Development Community (SADC), and Singapore.
It is important to reiterate that EAC members classified as Least Developed Countries (LDCs) - Burundi, Rwanda, Tanzania, and Uganda - fall under the EU's Everything But Arms (EBA) scheme and would remain eligible for the duty-free and quota-free access to the EU for all products with the exception of arms and ammunition even without the EPA. Therefore, the baseline for the above-mentioned EAC countries is modelled according to EBA provisions. Kenya however, has faced tariff levels according to the EU's Generalized Scheme of Preferences (GSP) since late 2014. In the absence of the EPA, Kenyan exports to the EU would continue to benefit from GSP11, as reflected in the baseline.
The economic effects of the EPA are first quantified based on the tariff dismantling schedule set out in the EPA.
In addition, also the impact of trade facilitation measures contained in the agreement is assessed and the methodology used and the main results are presented in Annex V. The quantification of the impact of trade facilitation is done using the OECD's Trade Facilitation Indicators (TFI) index. Improvements in partners TFI scores based on EPA commitments are converted into ad-valorem trade costs reductions and simulated as reductions in non-tariff barriers (NTBs) with a bilateral and a multilateral (spillover) component. The present analysis is limited to goods sector NTB reductions because the EPA defers liberalization of services NTBs as well as trade-related rules addressing sustainable development, competition policy, investment and private sector development, intellectual property rights, transparency in public procurement to further negotiations.
10 As for example The Economic Impact of the SADC EPA Group – EU Economic Partnership Agreement
(European Commission, June 2016) or The Economic Impact of the West Africa – EU Economic Partnership Agreement (European Commission, March 2016)
11 As of 1 January 2017, Live plants and floricultural products from Kenya will no longer be eligible for GSP-level tariffs and will instead face MFN treatment when exported to the EU (reference Commission Implementing Regulation 2016/330 http://trade.ec.europa.eu/doclib/docs/2016/march/tradoc_154349.pdf). The baseline accounts for the foreseen changes.

33
6.2. Impact of tariff reduction - Analysis of results
This section presents the main results, at macroeconomic and microeconomic level, of implementing tariff the reductions set out in the EPA. It is important to note that the results in this section refer to the EPA scenario compared to the baseline in 2042. For example, the "0.3 percent increase" in GDP shown in Table 6.1 for EAC means that in 2042, the GDP would be 0.3 percent higher with the EPA than without.
6.2.1 Macroeconomic effects
It is estimated that the tariff reduction in the EPA will have a positive impact on the real GDP and welfare of the region on average (0.3 percent and 0.2 percent respectively) as shown in Table 6.1. The indicator on welfare measures the change in utility for households and it takes into account the nominal income relative to the expenditure price index. The impact will also be positive although small for each EAC Member State and the gains in real GDP will go from 0.1 percent in Rwanda to 0.5 percent in Kenya.
As expected Kenya benefits from the agreement given that the counterfactual scenario for them would be facing GSP and MFN tariff on most of the products exported to the EU. However, the gains of the other EAC countries are also significant. These are mostly coming from the reduction of their import tariff which will make imported goods cheaper, the economy more efficient and competitive which will in turn increase exports. The simulations show that the gains in GDP correspond to increased consumptions and investments.12
Table 6.1 Macroeconomic Effects (EPA vs Baseline %)
GDP Welfare Total exports * Total imports *
EAC 0.3 0.2 1.11 0.88
Burundi 0.2 0.1 0.23 0.18
Kenya 0.5 0.6 0.86 0.90
Rwanda 0.1 0.0 0.18 0.23
Tanzania 0.3 0.0 0.45 0.31
Uganda 0.2 0.1 0.15 0.17
EU 0.0 0.0 0.05 0.05 Source: CGE simulations carried out for DG TRADE; Notes: All changes reported are compared to baseline values in 2042. Tariff only scenario (*) % change in values - excluding intra-EAC only for total "EAC"
For all EAC Member States and for EAC as a whole, the tariff reduction also brings an increase of both total exports and total imports in percentage terms. Total imports increase, but in a slightly smaller proportion than total exports.
Table A.3 in Annex V shows the impact of the implementation of trade facilitation measures together with the tariff reduction: the impacts on all the macroeconomic variables would be even higher.
12 By 0.13 percent and 0.47 percent respectively for the whole of EAC in the tariff only scenario.

34
6.2.2 EAC exports to the EU
The impact of the EPA on EAC exports to the EU (Table 6.2) is in line with the macroeconomic effects and shows a strong increase for Kenya (which benefits from the change from the GSP to the EPA) and a more moderate increase for LDCs in the region. For Burundi there is a small negative percentage change because instead of exporting more to the EU, the country redirects some of its exports (overall +0.23%) to other trade partners. This outcome is reasonable given that Burundi has already DFQF market access to the EU and the agreement does not change this.
Table 6.2 EAC exports to the EU (EPA vs Baseline %)
exports to the EU
EAC 5.9
Burundi -0.1
Kenya 11.9
Rwanda 0.4
Tanzania 0.4
Uganda 0.3 Source: CGE simulations carried out for DG TRADE; Notes: All changes reported are compared to baseline values in 2042. Tariff only scenario (*) % change in values - excluding intra-EAC only for total "EAC"
6.2.3 EAC exports by sectors
The efficiency gains that lead to the positive GDP impact of the EPA are mostly driven by a more efficient allocation of production and trade across sectors of the economy.
In a majority of sectors (22 out of 37), EAC exports are set to increase within 25 years of the entry into force of the EPA (Table 6.3). This is particularly the case of manufacturing and raw material sectors (11 out of 14 sectors) where overall exports increase by 0.8%. Agricultural and food sectors also increase on average by 3% but with more variation depending on the sectors. Most services sectors are due to increase (5 out of 7 sectors), but overall there is reallocation of exports from services (which are not covered by the EPA) to agriculture and industry sectors.
The sectors that are set to benefit more from the EPA are "Dairy products" and "Other food" and "Vegetables and Fruits" (22.9%, 11.5%, 1.9% increase respectively) when it comes to agriculture and food. Among those sectors, the "Other food" and "Vegetables and Fruit" sectors are the most economically relevant because they represent respectively 6% and 8% of EAC value added (output) as shown in Table A.3 in Annex V. The strong growth in the export of "Dairy products" does not have comparable economic relevance because this sector represents barely 1% of EAC value added (output).
For manufacturing the sectors that benefit most from the EPA are "Textiles" and "Wearing Apparel" (1.5% and 4.5% increase respectively) which together represent 6% of EAC value added (output). For the sectors where exports decrease, all variations are below 1.5%. However the decrease of some sectors' exports is more than compensated by the increase in other sectors and by the overall exports increase as shown above.

35
Table 6.3 Impact on EAC exports to the world by sector (EPA vs Baseline %) EPA's impact Agriculture and food +3.0
Rice 0.0 Cereals -1.5 Vegetables and Fruits +1.9 Oilseeds -0.6 Vegetable Oil -0.1 Sugar -0.3 Plant Fibres -0.1 Other Crops +1.5 Dairy products +22.9 Red Meat -0.6 White Meat -1.3 Cattle -1.2 Other Animal +0.1 Fisheries -0.5 Other Food +11.5 Beverages and Tobacco -0.1
Manufacturing and raw materials +0.8 Fossil Fuel +0.1 Other Mineral +0.1 Other Natural Resources -0.4 Textiles +1.5 Wearing Apparel +4.5 Leather Product +1.0 Wood Products -0.2 Paper Products 0.0 Chemicals +0.1 Metals +0.7 Motor Vehicles +0.4 Capital Goods +0.6 Electronics +0.5 Other Industries -0.1
Services -0.2 Utilities +0.7 Construction +0.4 Trade +0.3 Transportation +0.2 Business Services -0.7 Other services +0.3 Public Services -0.8
Source: CGE simulations carried out for DG TRADE; Notes: compared to baseline values in 2042. Tariff only
36
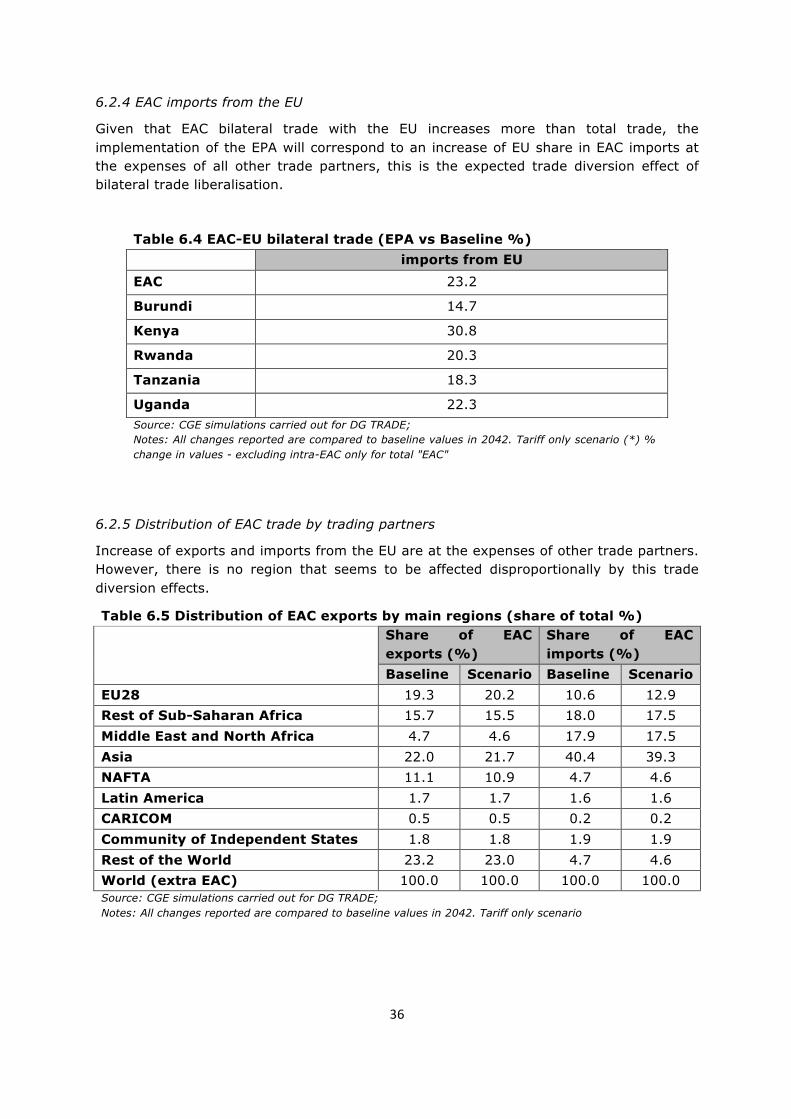
6.2.4 EAC imports from the EU
Given that EAC bilateral trade with the EU increases more than total trade, the implementation of the EPA will correspond to an increase of EU share in EAC imports at the expenses of all other trade partners, this is the expected trade diversion effect of bilateral trade liberalisation.
Table 6.4 EAC-EU bilateral trade (EPA vs Baseline %)
imports from EU
EAC 23.2
Burundi 14.7
Kenya 30.8
Rwanda 20.3
Tanzania 18.3
Uganda 22.3 Source: CGE simulations carried out for DG TRADE; Notes: All changes reported are compared to baseline values in 2042. Tariff only scenario (*) % change in values - excluding intra-EAC only for total "EAC"
6.2.5 Distribution of EAC trade by trading partners
Increase of exports and imports from the EU are at the expenses of other trade partners. However, there is no region that seems to be affected disproportionally by this trade diversion effects.
Table 6.5 Distribution of EAC exports by main regions (share of total %)
Share of EAC exports (%)
Share of EAC imports (%)
Baseline Scenario Baseline Scenario
EU28 19.3 20.2 10.6 12.9 Rest of Sub-Saharan Africa 15.7 15.5 18.0 17.5 Middle East and North Africa 4.7 4.6 17.9 17.5 Asia 22.0 21.7 40.4 39.3 NAFTA 11.1 10.9 4.7 4.6 Latin America 1.7 1.7 1.6 1.6 CARICOM 0.5 0.5 0.2 0.2 Community of Independent States 1.8 1.8 1.9 1.9 Rest of the World 23.2 23.0 4.7 4.6 World (extra EAC) 100.0 100.0 100.0 100.0 Source: CGE simulations carried out for DG TRADE; Notes: All changes reported are compared to baseline values in 2042. Tariff only scenario

37
6.2.6 Impact on poverty
Turning to the impacts of the EPA on poverty, these have been calculated following the approach described in Annex III using the static GTAP model. This model (which does not have endogenous investments) delivers slightly smaller impacts on GDP, trade and other variables than the dynamic version used for the main simulations, although the results fo in the same direction.13 The impacts are calculated on the percentage of the population living with less than 1.25 USD per day. The results on poverty reduction are mostly positive but very small (Table 6.7). Only in Kenya the impact is a bit higher, with a marginal reduction of the poverty headcount of 0.1 percent.
Table 6.6 Impact on poverty % change in the 1.25 USD per
day headcount Number of people out of poverty (on the basis of projections of poverty headcounts up to 2042) rounded off to thousands
Burundi -0.01 -1000
Kenya -0.10 -22000
Rwanda 0.00 0
Tanzania 0.00 0
Uganda 0.00 0
EAC5 -0.01 -23000 Source: CGE simulations carried out for DG TRADE; Notes: All changes reported are compared to baseline values in 2042. Tariff only scenario
6.2.7 Impact on government revenue
The impact of the EPA on the EAC countries’ government revenues is estimated in the CGE model so as to reflect both the direct effect of tariff elimination/reduction and the general equilibrium effects in terms of increased economic activity14.
For all five EAC Partner States, the implementation of the EPA corresponds to a reduction of revenues from excise taxes and duties, which remains moderate or even becomes positive when considering the impact on total revenues. In Kenya, the increased revenues from income taxes linked to the GDP gains, and the VAT from consumption increases, will more than compensate the revenue losses from the elimination of the duties. In the other EAC Member States, decrease in government revenues remains negative, though small.
The impact on total revenues is at the end of the liberalisation period. The EPA contains provisions on financial resources to cover transitionally the agreed losses of government revenues arising from elimination and or substantial reduction in customs tariffs.
13 For EAC as total the static version of the model gives an impact on GDP of the EPA tariff liberalisation of
0.06%, while the dynamics one gives an impact of 0.08%. 14 Changes in value-added tax (VAT) collections based on domestic consumption impacts, and changes in
income-driven taxes based on changes in output (assuming no further tax policy changes).

38
Table 6.7 Government Revenue
Impact on Government Revenues
Percentage change (%)
Burundi -0.70
Kenya +0.02
Rwanda -0.56
Tanzania -0.66
Uganda -1.09 Source: CGE simulations carried out for DG TRADE; Notes: All changes reported are compared to baseline values in 2042. Tariff only scenario
6.3. Impact of NTB reduction – additional simulations
The EPA aims at liberalising and facilitating trade between the EU and the EAC member states. This liberalisation and facilitation of trade included in the EPA can be considered as a reduction of Non-Tariff Barriers (NTBs). Obviously, NTBs that affect only intra-EAC trade are not directly impacted by the EPA, but the EPA may also have an impact on those intra-EAC NTBs (see box 7).
The assessment of the impact of the border facilitation measures included in the EPA is based on the Organization for Economic Cooperation and Development (OECD) Trade Facilitation Indicators (TFI) index, which provides a comprehensive quantitative comparison of specific trade facilitation measures in the various countries.
Additional simulations have been carried out on order to assess the impact of such NTB reduction. As shown in Tables 6.8 and 6.9, the impact of both tariff and NTB reduction is significantly higher than the impact of tariff reduction only.
The details of the methodology and the full set of results of the modelling on the impact of trade facilitation are shown in Annex V.
Table 6.8. GDP and Welfare (EPA vs Baseline %), comparison tariff only vs. tariff and NTB reduction
GDP Welfare Tariff only Tariff+NTBs Tariff only Tariff+NTBs
EAC 0.3 0.6 0.2 0.5 Burundi 0.2 0.4 0.1 0.3 Kenya 0.5 0.6 0.6 0.6 Rwanda 0.1 0.3 0.0 0.2 Tanzania 0.3 0.7 0.0 0.4 Uganda 0.2 0.7 0.1 0.5 Source: CGE simulations carried out for DG TRADE; Notes: All changes reported are compared to baseline values in 2042.
Table 6.9. Total trade (EPA vs Baseline %), comparison tariff only vs. tariff and NTB reduction
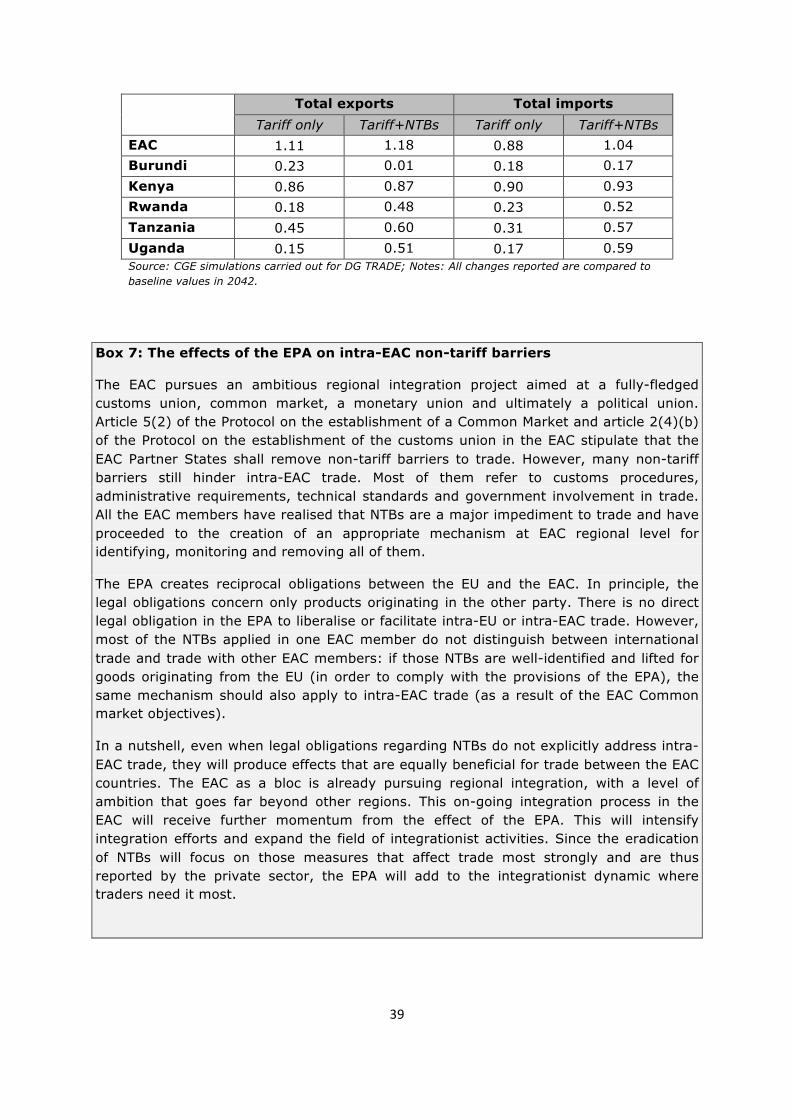
39
Total exports Total imports Tariff only Tariff+NTBs Tariff only Tariff+NTBs
EAC 1.11 1.18 0.88 1.04 Burundi 0.23 0.01 0.18 0.17 Kenya 0.86 0.87 0.90 0.93 Rwanda 0.18 0.48 0.23 0.52 Tanzania 0.45 0.60 0.31 0.57 Uganda 0.15 0.51 0.17 0.59 Source: CGE simulations carried out for DG TRADE; Notes: All changes reported are compared to baseline values in 2042.
Box 7: The effects of the EPA on intra-EAC non-tariff barriers
The EAC pursues an ambitious regional integration project aimed at a fully-fledged customs union, common market, a monetary union and ultimately a political union. Article 5(2) of the Protocol on the establishment of a Common Market and article 2(4)(b) of the Protocol on the establishment of the customs union in the EAC stipulate that the EAC Partner States shall remove non-tariff barriers to trade. However, many non-tariff barriers still hinder intra-EAC trade. Most of them refer to customs procedures, administrative requirements, technical standards and government involvement in trade. All the EAC members have realised that NTBs are a major impediment to trade and have proceeded to the creation of an appropriate mechanism at EAC regional level for identifying, monitoring and removing all of them.
The EPA creates reciprocal obligations between the EU and the EAC. In principle, the legal obligations concern only products originating in the other party. There is no direct legal obligation in the EPA to liberalise or facilitate intra-EU or intra-EAC trade. However, most of the NTBs applied in one EAC member do not distinguish between international trade and trade with other EAC members: if those NTBs are well-identified and lifted for goods originating from the EU (in order to comply with the provisions of the EPA), the same mechanism should also apply to intra-EAC trade (as a result of the EAC Common market objectives).
In a nutshell, even when legal obligations regarding NTBs do not explicitly address intra-EAC trade, they will produce effects that are equally beneficial for trade between the EAC countries. The EAC as a bloc is already pursuing regional integration, with a level of ambition that goes far beyond other regions. This on-going integration process in the EAC will receive further momentum from the effect of the EPA. This will intensify integration efforts and expand the field of integrationist activities. Since the eradication of NTBs will focus on those measures that affect trade most strongly and are thus reported by the private sector, the EPA will add to the integrationist dynamic where traders need it most.

40
6.4. Summary of modelling results
In synthesis, the simulations of the impact of the EPA on East and Central African economies point to a positive outcome. The impact (tariff reduction only scenario) will be positive for each EAC Member State and the gains in real GDP will go from 0.1 percent in Rwanda to 0.5 percent in Kenya by comparison to a baseline with no agreement. The gains in GDP are mostly deriving from cheaper imports boosting investments and consumption.
Total exports will also be positively affected as well as total imports. Total exports by the EAC increase more than total imports. EU bilateral exports are predicted to increase relatively more than EAC bilateral exports.
The agreement will also reduce, albeit only marginally, poverty in the region.
The import tariff reduction will have a moderate impact on excise duties and duties collection in all countries. In Kenya, the positive impact on GDP and consequent increase in income and consumption taxes will compensate for the revenue shortfall. In the other EAC Member States, decrease in government revenues remains negative, though small.
The above results are further improved account being taken of the impact of NTBs reduction.

41
References
De Melo, J. and J. Regolo (2014) "The African Economic Partnership Agreements with the EU: Reflections inspired by the case of the East African Community" Journal of African Trade, Vol 1 Issue 1, December
Dixon, P. B. and M.T. Rimmer, (2002) “Dynamic General Equilibrium Modelling for Forecasting and Policy: A Practical Guide and Documentation of MONASH.” Contributions to Economic Analysis 256.
Fouré, J., A. Benassy-Quere, and L. Fontagné. (2012) “The Great Shift: Macroeconomic Projections for the World Economy at the 2050 Horizon.” CEPII Working Paper 2012-03.
Hertel, T. W. ed. (1997). Global Trade Analysis: Modelling and Applications. Cambridge, UK: Cambridge University Press.
Hertel, T., M. Verma, M. Ivanic, E. Magalhaes, C. Ludena, and A.R. Rios. (2015). “GTAP-POV: A Framework for Assessing the National Poverty Impacts of Global Economic and Environmental Change.” GTAP Technical Paper 31.
Ianchovichina, E..and R. McDougall, (2012) "Theoretical structure of Dynamic GTAP", Dynamic Modeling and Applications for Global Economic Analysis, Vol. 13, Cambridge University Press
IMF, 2016. World Economic Outlook Database, April 2016. Washington D.C.: International Monetary Fund. https://www.imf.org/external/pubs/ft/weo/2016/01/weodata/index.aspx
Mbithi M. L., S. Omondi Gor and K. Otwori Osoro (2015) "Impact of economic partnership agreements: the case of EAC's manufactured imports from EU" International Journal of Business and Economic Development, Vol 3 Issue 2, July
Moïsé, Evdokia and Silvia Sorescu. 2013. “Trade Facilitation Indicators: The Potential Impact of Trade Facilitation on Developing Countries’ Trade.” OECD Trade Policy Papers 144.
Milner C., O. Morrissey and A. McKay (2005) "Some Simple Analytics of the Trade and Welfare Effects of Economic Partnership Agreements" Journal of African Economies, Vol 14 Issue 3, September
The Economist. “Business in Rwanda: Africa's Singapore?” The Economist, 25 February 2012.
World Bank. (2016) Global Income Dynamics Database (GIDD) available at http://econ.worldbank.org/WBSITE/EXTERNAL/EXTDEC/EXTDECPROSPECTS/0,,contentMDK:21909753~pagePK:64165401~piPK:64165026~theSitePK:476883,00.html
42
Annex I
List of acronyms
ACP Africa, Caribbean, Pacific
CGE Computable General Equilibrium
DFQF Duty-Free, Quota-Free
EAC East African Community
EBA Everything But Arms
EPA Economic Partnership Agreement
FEPA Framework Economic Partnership Agreement
FDI Foreign Direct Investment
FTA Free Trade Agreement
GDP Gross Domestic Product
GSP Generalised Scheme of Preferences
GTAP Global Trade Analysis Project
HS Harmonised System
IMF International Monetary Fund
IPR Intellectual Property Rights
LDC Least Developed Country
MAR Market Access Regulation
MFN Most Favoured Nation
OCT Overseas Countries and Territories
RIP Regional Indicative programme
SMEs Small and medium-sized enterprises
WTO World Trade Organisation

43
Annex II
Table A1. EU exports to EAC countries by product group, 2015 (million EUR)
HS sect. Section label Burundi Kenya Rwanda Tanzania Uganda
1 Live animals, animal products 0.21 13.85 1.08 5.90 3.09
2 Vegetable products 5.78 148.46 4.77 40.76 20.64
3 Animal or vegetable fats and oils 0.09 2.33 0.09 0.98 0.47
4 Foodstuffs, beverages and tobacco 4.47 119.12 7.26 44.60 17.04
5 Mineral products 0.17 133.19 0.96 18.64 4.95
6 Chemicals 46.37 370.36 32.85 264.80 125.04
7 Plastics, rubber 1.49 73.70 5.06 41.65 17.24
8 Raw hides, skins 0.01 1.10 0.08 0.34 0.29
9 Wood, charcoal 0.06 2.95 0.04 0.84 0.53
10 Pulp of wood, paper 1.83 89.55 3.84 53.57 13.86
11 Textiles 2.48 62.18 8.99 17.77 14.98
12 Footwear, hats 0.32 2.42 0.39 0.19 0.53
13 Stone, glass, ceramics 0.45 17.91 2.55 12.87 5.33
14 Pearls, precious metals 0.00 1.27 0.02 2.63 3.20
15 Base metals 2.00 82.26 8.45 39.74 18.04
16 Machinery and appliances 20.70 600.99 78.19 309.15 156.01
17 Transport equipment 10.06 337.44 17.08 135.17 51.21
18 Optical and photographic instruments 4.19 65.79 10.62 25.87 19.21
19 Arms 0.30 0.78 0.00 0.44 2.62
20 Miscellaneous manufactured articles 0.99 50.95 4.41 11.99 10.89
21 Art, antiques 0.00 0.22 0.02 0.20 0.10
22 Not classified 6.61 39.30 2.82 28.32 5.07
Source: Comext

44
Table A2. EU imports from EAC countries by product group, 2015 (million EUR)
HS sect. Section label Burundi Kenya Rwanda Tanzania Uganda
1 Live animals, animal products 0.10 16.13 0.00 85.95 59.75
2 Vegetable products 36.13 1,014.23 38.30 131.13 336.29
3 Animal or vegetable fats and oils 0.00 4.12 0.07 1.15 0.11
4 Foodstuffs, beverages and tobacco 0.05 125.35 0.01 232.95 62.00
5 Mineral products 0.72 26.93 22.09 78.15 0.53
6 Chemicals 0.01 3.68 0.05 52.51 0.10
7 Plastics, rubber 0.00 1.65 0.00 0.56 0.03
8 Raw hides, skins 1.69 46.58 0.38 2.40 11.77
9 Wood, charcoal 0.00 0.53 0.01 1.61 0.11
10 Pulp of wood, paper 0.01 0.15 0.16 0.04 0.97
11 Textiles 0.03 8.48 0.01 7.04 2.52
12 Footwear, hats 0.00 0.80 0.00 0.02 0.00
13 Stone, glass, ceramics 0.00 1.16 0.00 2.81 0.01
14 Pearls, precious metals 0.01 3.96 0.06 62.55 0.20
15 Base metals 0.00 4.84 1.48 19.77 5.16
16 Machinery and appliances 0.03 15.99 0.70 6.08 3.15
17 Transport equipment 0.00 25.14 0.08 0.86 0.34
18 Optical and photographic instruments 0.02 3.79 0.03 1.06 0.31
19 Arms 0.00 0.00 0.00 0.02 0.00
20 Miscellaneous manufactured articles 0.00 10.11 0.00 0.11 0.34
21 Art, antiques 0.00 0.48 0.01 0.68 0.07
22 Not classified 0.19 16.14 0.98 8.14 1.37
Source: Comext

45
Annex III
Construction of the Burundi Social Accounting Matrix
In the GTAP 9.0 dataset used for this anaysis, Burundi is not separately represented, but rather is part of the “Rest of Eastern Africa” (REA) region along with Comoros, Djibouti, Eritrea, Mayotte, Seychelles, Somalia, and Sudan. In terms of GDP, Burundi represents a small part of the total REA region, which is dominated by Sudan. Since the characteristics and response of this composite region to the EPA would not be reflective of Burundi’s response to the EPA, a pro-rated response would not be meaningful. Accordingly, we break out Burundi in the GTAP dataset from the REA, which becomes the “Rest of Rest of Eastern Africa” (RREA).
The GTAP modelling framework allows for the splitting of an existing region in the dataset using the SplitReg program. To replace the Burundi SAM, trade patterns, and the protection data applied by and facing Burundi the following datasets have been constructed: A GTAP-concorded, symmetric Input-Output (I-O) matrix for Burundi’s international imports; A GTAP-concorded, symmetric I-O matrix for Burundi’s domestic production; Burundi’s international trade data, by source/destination region; and Tariffs/export taxes/transportation margins associated with Burundi international flows.
This required adjusting the Burundi National Accounts data and an I-O table (produced at a very aggregate level) to the required GTAP-sector-concorded format15 by using additional data – in particular, trade data – to disaggregate the rudimentary Burundi I-O matrices. Once the required datasets are estimated, they are used to incorporate Burundi as a separate region in the GTAP database. The RREA is the residual obtained by subtracting the Burundi data from the corresponding original REA data
With the revised dataset, each of the countries in East Africa is thus represented separately.
Poverty Analysis Framework
The analysis of the impact on poverty of the EU-EAC EPA are based on a modified version of the static GTAP model adapted to incorporate a nested poverty module for Uganda (as developed by Hertel et al., 2015).16 The impacts for Uganda are used to infer impacts for the other EAC member states based on the available data.
Undertaking this poverty analysis requires using the results of household survey to identify poor households, to estimate their prevalence, to understand where they earn their income in order to classify them by earnings strata, and to estimate the responsiveness of poverty headcounts to income changes in each stratum. For the survey information this analysis draws mainly from Hertel, et al. (2015). Uganda is the only EAC member state currently represented in the GTAP poverty database. Inferences concerning the impact on the other EAC Member States is based on the results for Uganda, cross-referencing available information from the World Bank Global Income Dynamics Database (GIDD, 2016), which has relatively complete information for four of the five EAC Member States, although quite dated, and a recently completed Rwandan Integrated Household Living Conditions Survey, which covers the period October 2013-October 2014.
15 National accounts data are available at ISTEEBU, Direction Générale (2014) . Burundi I-O table is available at ISTEEBU
(2010). 16 No modified version of the DYN GTAP model has been developed to study the impact on poverty.
46
Following Hertel et al. (2015: 6-7), the poverty analysis generated in the GTAP framework relies on simulating household welfare at the poverty line for different segments (strata) of the population.
For any change in commodity prices that might results from a trade liberalisation, it is possible to compute the expenditure required to allow a household to remain at the initial level of utility. Hertel et al. (2015) refer to this required change in expenditure as the change in the “true cost of living at the poverty line.” Using this true cost of living, the nominal income change arising out of the new factor prices can be deflated to obtain the change in real income by stratum. This change in real income coupled with information about the stratum elasticity of poverty headcount with respect to real income, enables the model to predict changes in poverty headcount by stratum.

47
Annex IV
Regional aggregation
The regional aggregation is chosen to be consistent with other EPA studies: accordingly, it features the following regions:
§ the EU28, § the five EAC member states represented separately: Burundi, Kenya, Rwanda,
Tanzania, Uganda § the Rest of Sub-Saharan Africa § Middle East and North Africa (MENA) § Asia § NAFTA § Latin America § CARICOM § Community of Independent States § the Rest of the World.
Sectoral aggregation
Description GTAP Sectors Description GTAP Sectors 1 Rice 1 (PDR); 23 (PCR) 20 Textiles 27 (TEX) 2 Cereals 2 (WHT); 3 (GRO) 21 Wearing Apparel 28 (WAP) 3 Vegetables and
Fruits 4 (V_F) 22 Leather Product 29 (LEA)
4 Oilseeds 5 (OSD); 23 Wood Products 30 (LUM) 5 Vegetable Oil 21 (VOL) 24 Paper Products 31 (PPP) 6 Sugar 6 (C_B); 24 (SGR) 25 Chemicals 33 (CRP) 7 Plant Fibres 7 (PFB); 26 Metals 35 (I_S); 36
(NFM); 37 (FMP) 8 Other Crops 8 (OCR) 27 Motor Vehicles 38 (MVH) 9 Dairy products 11 (RMK);22 (MIL) 28 Capital Goods 39 (OTN); 41
(OME) 10 Red Meat 19 (CMT) 29 Electronics 40 (ELE) 11 White Meat 20 (OMT) 30 Other Industries 42 (OMF) 12 Cattle 9 (CTL); 31 Utilities 43 (ELY); 44
(GDT); 45 (WTR) 13 Other Animal 10(OAP);12 (WOL) 32 Construction 46 (CNS) 14 Fisheries 14 (FSH) 33 Trade 47 (TRD) 15 Other Food 25 (OFD) 34 Transportation 48 (OTP); 49
(WTP); 50 (ATP) 16 Beverages and
Tobacco 26 (B_T) 35 Business
Services 51 (CMN); 52 (OFI); 53 (ISR); 54 (OBS)
17 Fossil Fuels 15(COA);16 (OIL); 17(GAS);32 (P_C);
36 Other services 55 (ROS); 57 (DWE)
18 Other Mineral 18(OMN);34(NMM) 37 Public Services 56 (OSG) 19 Other Natural
Resources 13 (FRS);
Note: GTAP sector 11 “raw milk” is included in EPA sector “Dairy products” whereas in the West Africa EPA study it is included with GTAP sector 9 “cattle”; as well, GTAP sector 18 “other mineral resources” is included in the EPA sector “Other Mineral” whereas in the West Africa study it is included in the EPA sector “Other Natural Resources.

48
Annex V
Reduction in Non-Tariff Barriers to Goods Trade: the impact of trade facilitation measures
Methodology
The assessment of the impact of the border facilitation measures included in the EPA is based on the Organization for Economic Cooperation and Development (OECD) Trade Facilitation Indicators (TFI) index, which provides a comprehensive quantitative comparison of specific trade facilitation measures in the various countries.
Using the structure of the OECD TFO index, Table A.1 shows for each sub-measure if this is included in the EAC Treaty for intra-EAC trade, in the WTO Trade Facilitation agreement e measure and in the EPA by comparing the clauses in the three agreements.
Table A.1: Comparison of EPA Trade Facilitation Measures to WTO TFA and EAC Category ID Meas. Description EAC WTO TFA EPA Information Availability LI_SSA-A 1 A.1 Establishment of a national customs website 1.2 LI_SSA-A 2 A.2 Publication of rate of duties 7(3)(a) 1.2 26(a) and (d) LI_SSA-A 3 A.3 Establishment of enquiry points 1.3.1 LI_SSA-A 4 A.4 Possibility to ask questions to customs 1.3.1 26(a) and (d) LI_SSA-A 5 A.5 Information on import and export procedures 7(3)(a) 1.1.1 (a) 26(a) and (d) LI_SSA-A 6 A.6 Procedures of border agencies 7(3)(a) 1.1.1 (a) 26(a) and (d) LI_SSA-A 7 A.7 Procedures published at least xx days before
entry into force 2.1.1
LI_SSA-A 8 A.8 Publication of agreements with any country or countries relating to the above issues
1.1.1 (i)
LI_SSA-A 9 A.9 Publication of decisions and examples of customs classification
1.1.1 (d)
LI_SSA-A 10 A.10 Transparency of government policymaking 23(1)(c) Involvement of the Trade Community LI_SSA-B 11 B.11 Communication of policy objectives 2.2 LI_SSA-B 12 B.12 Consultations between traders and government 2.2 and 2.3 26(b) LI_SSA-B 13 B.13 Targeted stakeholders 2 LI_SSA-B 14 B.14 Adoption of public comments 2 Advance Rulings LI_SSA-C 15 C.15 Issuance of advance rulings 3.1 LI_SSA-C 16 C.16 Publication of necessary information on advance
rulings 3.1
LI_SSA-C 17 C.17 Number of advance rulings requests (total) 3.1.7 LI_SSA-C 18 C.18 Length of time for which the advance ruling is
valid (duration) 3.1.3
LI_SSA-C 19 C.19 Publication of average issuance time 3.1.4(b) LI_SSA-C 20 C.20 Publication of advance rulings of general
interest 3.1.6
LI_SSA-C 21 C.21 Possibility to request a review of an advance ruling or its revocation or modification
3.1.5
LI_SSA-C 22 C.22 Refusal to issue or revocation of advance ruling are motivated
3.1.3bis
Appeal Procedures LI_SSA-D 23 D.23 Publication of information on procedural rules
for appeal 1 24(3)(b)
LI_SSA-D 24 D.24 Judicial appeal procedures 4.1 24(3)(b) LI_SSA-D 25 D.25 Time limit for deciding such appeals LI_SSA-D 26 D.26 Availability of information on the motives of the
administration’s decisions 4.1.5
LI_SSA-D 27 D.27 Efficiency of legal framework in challenging regulations
LI_SSA-D 28 D.28 Judicial independence 4.1 LI_SSA-D 29 D.29 Equality of treatment between national and 4.3 24(3)(b)

49
Category ID Meas. Description EAC WTO TFA EPA foreign actors in commercial disputes
LI_SSA-D 30 D.30 Extent of implementation and speed of court rulings in commercial matters
Fees and Charges LI_SSA-E 31 E.31 Publication of fees and charges 6.1.4 LI_SSA-E 32 E.32 Evaluation of fees and charges 6.1.3 24(2)(h) LI_SSA-E 33 E.33 Total fees and charges collected (number and
diversity)
LI_SSA-E 34 E.34 Fees for customs services during normal working hours
Formalities – Documents LI_SSA-F 35 F.35 Use of copies 10.2(1)and
10.2(2)
LI_SSA-F 36 F.36 International standards compliance 6(b) 10.3.5 23(1)(d),24(1) and 25(7)
LI_SSA-F 37 F.37 Number of documents for import LI_SSA-F 38 F.38 Number of documents for export LI_SSA-F 39 F.39 Time to prepare documents for import (days) LI_SSA-F 40 F.40 Time to prepare documents for export (days) Formalities – Automation LI_SSA-G 41 G.41 Percentage of procedures that can be done
electronically (out of the total number of import/export/transit procedures)
LI_SSA-G 42 G.42 Use of risk management 7.3 24(2)(d) LI_SSA-G 43 G.43 IT systems capable of accepting EDI (electronic
data interchange) and exchanging data electronically
LI_SSA-G 44 G.44 Availability of full-time (24/7) automated processing for customs agencies
LI_SSA-G 45 G.45 Quality of telecommunications and IT Formalities – Procedures LI_SSA-H 46 H.46 Single window 10.4.1 24(2)(c) LI_SSA-H 47 H.47 Publication of average clearance time 7.5.1 LI_SSA-H 48 H.48 Clearance time (days) LI_SSA-H 49 H.49 Implementation of pre-arrival processing 7.1.1 24(2)(d) LI_SSA-H 50 H.50 Percent of physical inspections 7.3 LI_SSA-H 51 H.51 Physical inspections as regards to perishable or
non-perishable goods
LI_SSA-H 52 H.52 Efficiency of customs and delivery of imports LI_SSA-H 53 H.53 Efficiency of customs and delivery of exports LI_SSA-H 54 H.54 Percentage of post-clearance audits (PCAs)
carried out (out of the total of yearly transactions)
7.4
LI_SSA-H 55 H.55 Separation of release from final determination and payment of customs duties
7.2.1
LI_SSA-H 56 H.56 Treatment of perishable and non-perishable goods concerning the separation of release from clearance
9
LI_SSA-H 57 H.57 Elimination of pre-shipment inspection 10.5 24(2)(i) LI_SSA-H 58 H.58 Authorized operator (AO) programmes 7.6 LI_SSA-H 59 H.59 Simplification of procedures (time) LI_SSA-H 60 H.60 Simplification of procedures (cost) LI_SSA-H 61 H.61 Adjustment of working hours of customs
personnel to commercial needs
LI_SSA-H 62 H.62 Requirement for clearance by a third-party customs broker
24(2)(j)
Cooperation – Internal LI_SSA-I 63 I.63 Cooperation between agencies on the ground 6(c) 9.1 23(1)(e) LI_SSA-I 64 I.64 Control delegation at the national level 9.2 23(1)(e) LI_SSA-I 65 I.65 Regular meetings are held (including training
seminars) 6(g) 29
Cooperation – External LI_SSA-J 66 J.66 Alignment of working days and hours with other
neighbouring countries at border crossings 8.2
LI_SSA-J 67 J.67 Alignment of procedures and formalities with other neighbouring countries at border
8.2

50
Category ID Meas. Description EAC WTO TFA EPA crossings
LI_SSA-J 68 J.68 Development and sharing of common facilities with other neighbouring countries at border crossings
8.2
LI_SSA-J 69 J.69 Joint controls with other neighbouring countries at border crossings
8.2
Governance and Impartiality LI_SSA-L 70 L.70 Clearly established and transparent structures
and functions
LI_SSA-L 71 L.71 Establishment of a code of conduct LI_SSA-L 72 L.72 Implementation and transparency of sanctions
against misconduct 24(2)(f)
LI_SSA-L 73 L.73 Ethics policy LI_SSA-L 74 L.74 Clear provisions for the financing of the
customs administration
LI_SSA-L 75 L.75 Internal systems audit function LI_SSA-L 76 L.76 Publication of an annual customs report LI_SSA-L 77 L.77 Irregular payments and bribes Source: Calculations by BKP consulting for DG TRADE
According to this comparison, the EPA improves upon the EAC Treaty, but is less ambitious than the WTO TFA. However, the EPA does improve upon the TFA in a few areas that are additional to those in the EAC and WTO TFA. 17
Consequently, using the OECD TFI scores it is possible to calculate the improvements of the TF Indexes for each EAC Member corresponding to the implementation of the EPA (in addition to the already agreed WTO TFA). The results are presented in Panel A of Table A.2. The changes will have no impact on Kenya, but they will reduce trade costs in the other EAC Member States by significant amounts.
Such trade facilitation measures like two transparency measures will potentially have multilateral effects. To reflect this, an additional MFN spillover effect has been simulated for the transparency measure, but not for the measure on customs brokers, as that would most likely amount to unilateral liberalization.
To evaluate the ad valorem trade cost reductions implied by the above percentage changes in the TFI scores, the estimates of the impact of reducing the TFI through full implementation of the TFA developed by Moïsé and Sorescu (2013) have been used. These are not available on an individual country basis, but such estimates suggest that the TFI factors account for about 14.5% of trade costs, as measured by the World Bank’s Trade Cost data. Panel B of Table A.2 shows the results of using these estimates to rescale the trade cost reductions deriving from TF measures included in the EPA. Trade costs are lower for all EPA members except Kenya. These trade cost reductions are applied to all EAC trade (except for the customs broker element, which applies only to EAC-EU trade).
Table A.2: Impacts on EPA Impacts on EAC Members’ Trade Costs 17 Some EPA measures go beyond the WTO TFA and are not included in the TFI. For example, EPA Article 28 on Harmonization
of Customs Standards at Regional Level states that: “The Parties acknowledge and recognize the importance of consolidating the harmonization of customs standards and trade facilitation measures at regional level, including the initiation of reforms in the field of customs and trade facilitation where necessary.” However, there is no binding language, nor are there clear commitments therefore it is not possible to assign a specific value to this measure.

51
EPA Burundi Kenya Rwanda Tanzania Uganda Panel A: TF Index reductions Transparency of government policymaking
23(1)(c)
0.1 0 0 0.1 0
Requirement for clearance by a third-party customs broker
24(2)(j) 0 0 0 0.118 0
Implementation and transparency of sanctions against misconduct
24(2)(f) 0.25 0 0.25 0.25 0.25
Change in TFI (EAC-EU) 0.35 0 0.25 0.468 0.25 Change in TFI (EAC-extra-EU)
0.35 0 0.25 0.35 0.25
% Change in TFI (EAC-EU) 4.55% 0 3.49% 5.50% 3.49% % Change in TFI (EAC-extra-EU)
4.55% 0.00% 3.49% 4.11% 3.49%
Panel B: Ad-valorem trade costs reductions (*) EPA trade cost reduction for EAC-EU Trade (%)
0.66 0.00 0.51 0.80 0.51
EPA trade cost reduction for EAC-extra-EU trade (%)
0.66 0.00 0.51 0.60 0.51
Source: Calculations by BKP consulting; Notes: this attribution of impacts is on a commitment basis and not on an applied basis; (*) on the basis of estimates by Moïsé and Sorescu, 2013
Table A.3 Distribution of EAC Value added (output) by sector, in 2016 share of sector in total value added
Rice 1.15 Cereals 4.20 Vegetables and Fruits 8.18 Oilseeds 2.37 Vegetable Oil 0.35 Sugar 0.94 Plant Fibres 0.21 Other Crops 4.18 Dairy products 0.97 Red Meat 1.09 White Meat 0.53 Cattle 1.65 Other Animal 0.60 Fisheries 0.94 Other Food 5.97 Beverages and Tobacco 4.19 Fossil Fuel 1.96 Other Mineral 2.56 Other Natural Resources 1.85 Textiles 0.41 Wearing Apparel 0.47
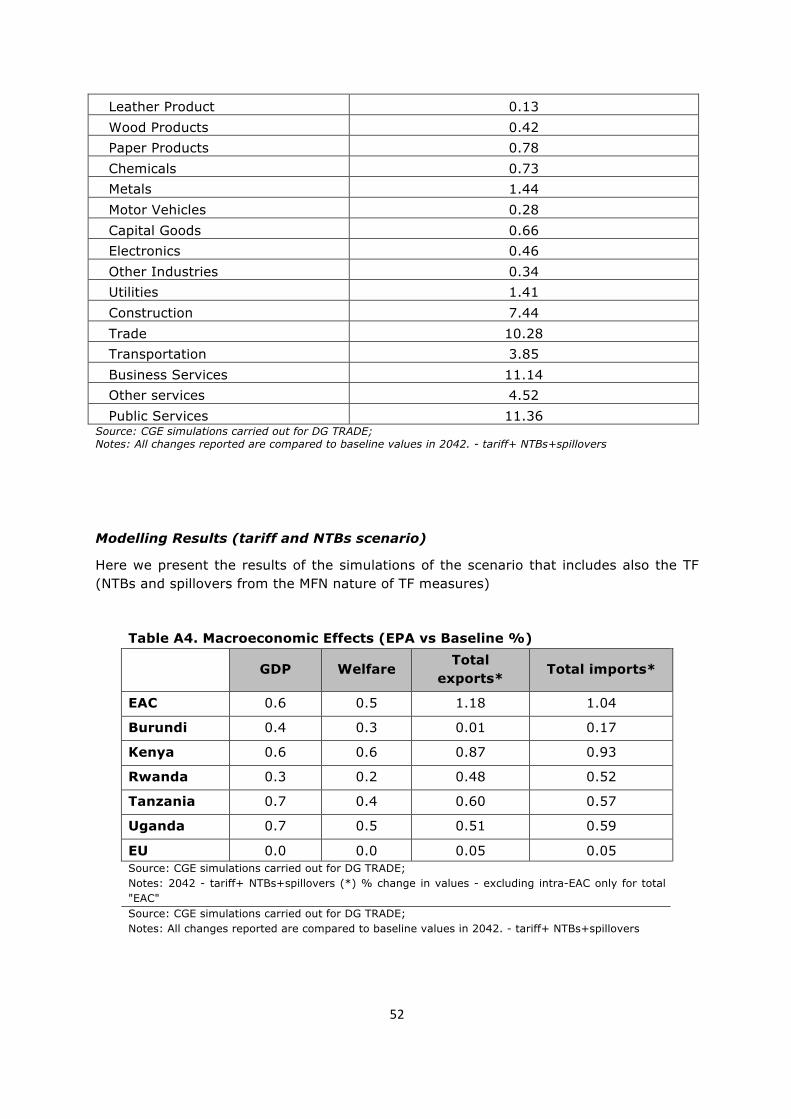
52
Leather Product 0.13 Wood Products 0.42 Paper Products 0.78 Chemicals 0.73 Metals 1.44 Motor Vehicles 0.28 Capital Goods 0.66 Electronics 0.46 Other Industries 0.34 Utilities 1.41 Construction 7.44 Trade 10.28 Transportation 3.85 Business Services 11.14 Other services 4.52 Public Services 11.36
Source: CGE simulations carried out for DG TRADE; Notes: All changes reported are compared to baseline values in 2042. - tariff+ NTBs+spillovers
Modelling Results (tariff and NTBs scenario)
Here we present the results of the simulations of the scenario that includes also the TF (NTBs and spillovers from the MFN nature of TF measures)
Table A4. Macroeconomic Effects (EPA vs Baseline %)
GDP Welfare Total
exports* Total imports*
EAC 0.6 0.5 1.18 1.04
Burundi 0.4 0.3 0.01 0.17
Kenya 0.6 0.6 0.87 0.93
Rwanda 0.3 0.2 0.48 0.52
Tanzania 0.7 0.4 0.60 0.57
Uganda 0.7 0.5 0.51 0.59
EU 0.0 0.0 0.05 0.05 Source: CGE simulations carried out for DG TRADE; Notes: 2042 - tariff+ NTBs+spillovers (*) % change in values - excluding intra-EAC only for total "EAC" Source: CGE simulations carried out for DG TRADE; Notes: All changes reported are compared to baseline values in 2042. - tariff+ NTBs+spillovers
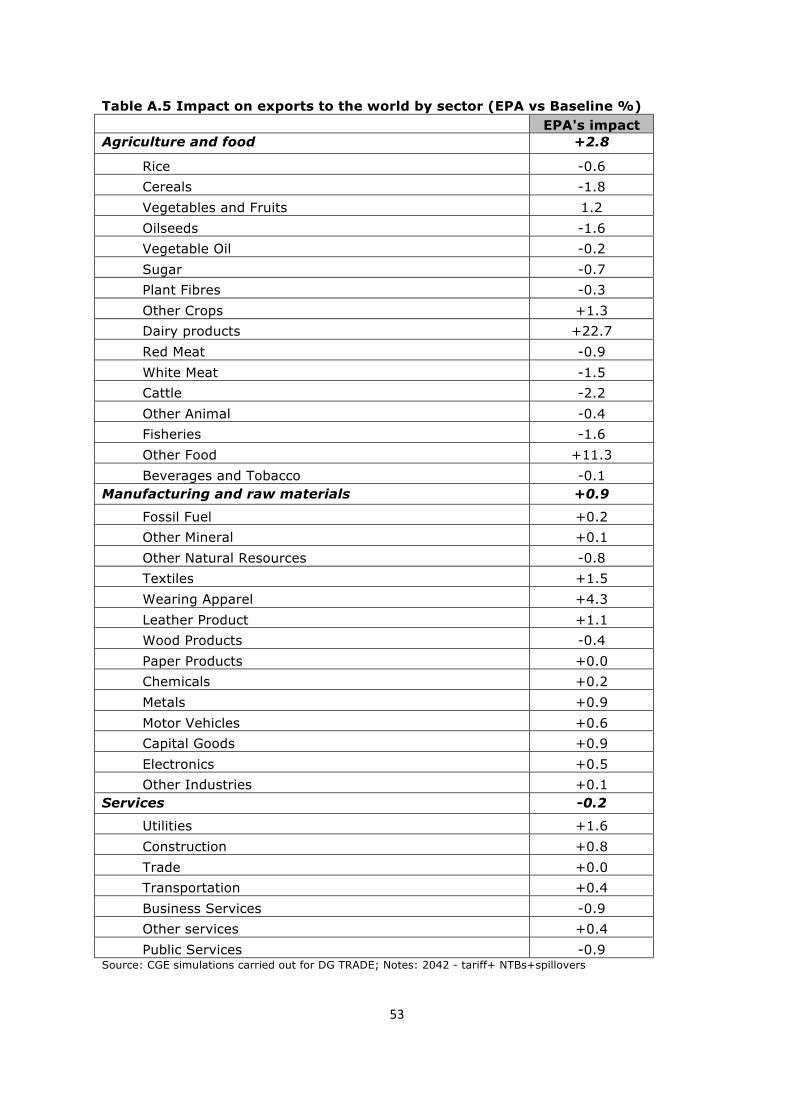
53
Table A.5 Impact on exports to the world by sector (EPA vs Baseline %) EPA's impact Agriculture and food +2.8
Rice -0.6 Cereals -1.8 Vegetables and Fruits 1.2 Oilseeds -1.6 Vegetable Oil -0.2 Sugar -0.7 Plant Fibres -0.3 Other Crops +1.3 Dairy products +22.7 Red Meat -0.9 White Meat -1.5 Cattle -2.2 Other Animal -0.4 Fisheries -1.6 Other Food +11.3 Beverages and Tobacco -0.1
Manufacturing and raw materials +0.9
Fossil Fuel +0.2 Other Mineral +0.1 Other Natural Resources -0.8 Textiles +1.5 Wearing Apparel +4.3 Leather Product +1.1 Wood Products -0.4 Paper Products +0.0 Chemicals +0.2 Metals +0.9 Motor Vehicles +0.6 Capital Goods +0.9 Electronics +0.5 Other Industries +0.1
Services -0.2
Utilities +1.6 Construction +0.8 Trade +0.0 Transportation +0.4 Business Services -0.9 Other services +0.4 Public Services -0.9
Source: CGE simulations carried out for DG TRADE; Notes: 2042 - tariff+ NTBs+spillovers

54
Table A.6 Impact on poverty
% change in the 1.25
USD per day headcount Number of people out of poverty (on the
basis of projections of poverty headcounts up to 2042) rounded off to thousands
Burundi -0.02 -2000 Kenya -0.10 -22000
Rwanda 0.00 0 Tanzania -0.02 -4000 Uganda 0.01 2000
EAC5 -0.02 -26000 Source: CGE simulations carried out for DG TRADE; Notes: All changes reported are compared to baseline values in 2042. - tariff+ NTBs+spillovers
Table A.7 Government Revenue
Impact on Government Revenues
Percentage change (%) Burundi -0.69
Kenya +0.07
Rwanda -0.20
Tanzania -0.39
Uganda -0.62 Source: CGE simulations carried out for DG TRADE; Notes: All changes reported are compared to baseline values in 2042. - tariff+ NTBs+spillovers
