east and southeast asian nies: 1. achievements of these economies world bank, 1993. the east asian...
Post on 21-Dec-2015
220 views
TRANSCRIPT

EAST AND SOUTHEAST ASIAN
NIEs: 1


Achievements of these economies
World Bank, 1993.The East Asian
Miracle
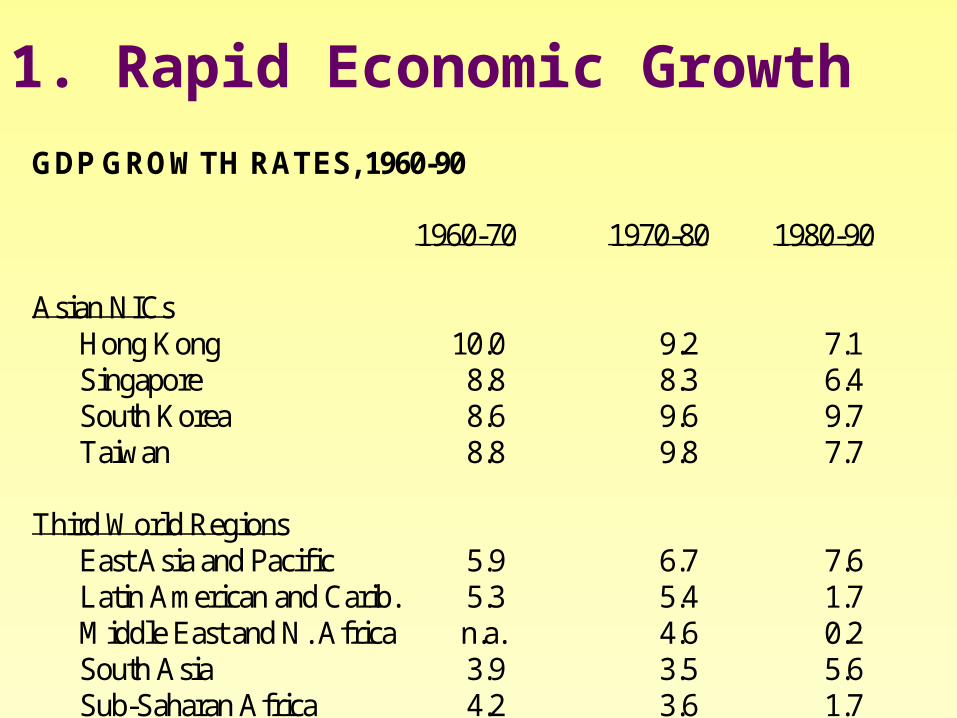
GDP GROWTH RATES, 1960-90
1960-70 1970-80 1980-90
Asian NICsHong Kong 10.0 9.2 7.1Singapore 8.8 8.3 6.4South Korea 8.6 9.6 9.7Taiwan 8.8 9.8 7.7
Third World RegionsEast Asia and Pacific 5.9 6.7 7.6Latin American and Carib. 5.3 5.4 1.7Middle East and N. Africa n.a. 4.6 0.2South Asia 3.9 3.5 5.6Sub-Saharan Africa 4.2 3.6 1.7
1. Rapid Economic Growth
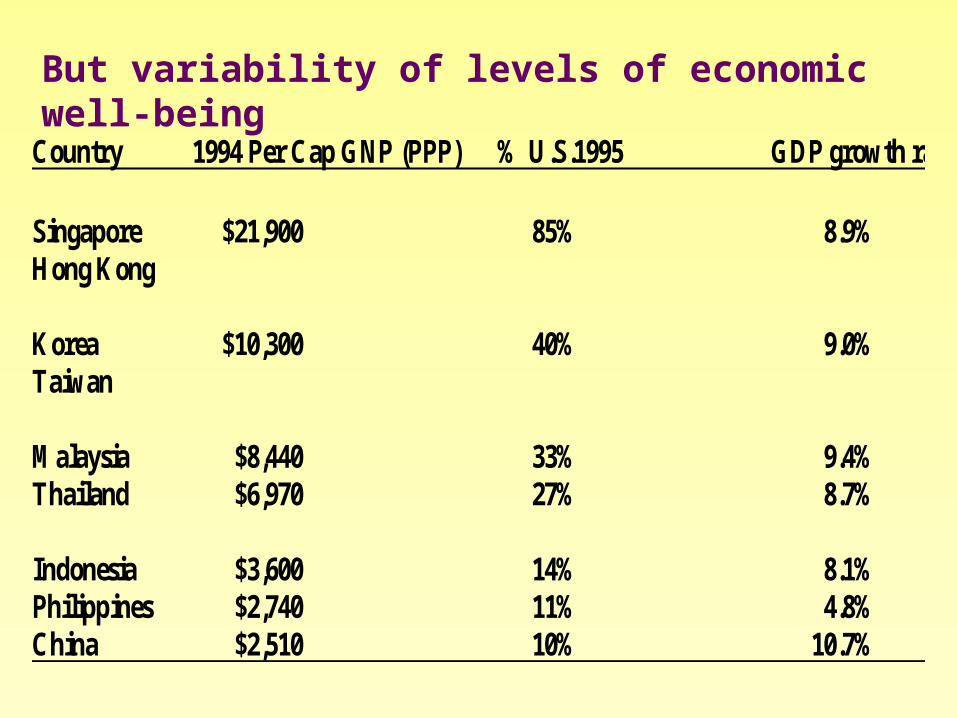
Country 1994 Per Cap GNP (PPP) % U.S.1995 GDP growth rate
Singapore $21,900 85% 8.9%Hong Kong
Korea $10,300 40% 9.0%Taiwan
Malaysia $8,440 33% 9.4%Thailand $6,970 27% 8.7%
Indonesia $3,600 14% 8.1%Philippines $2,740 11% 4.8%China $2,510 10% 10.7%
But variability of levels of economic well-being
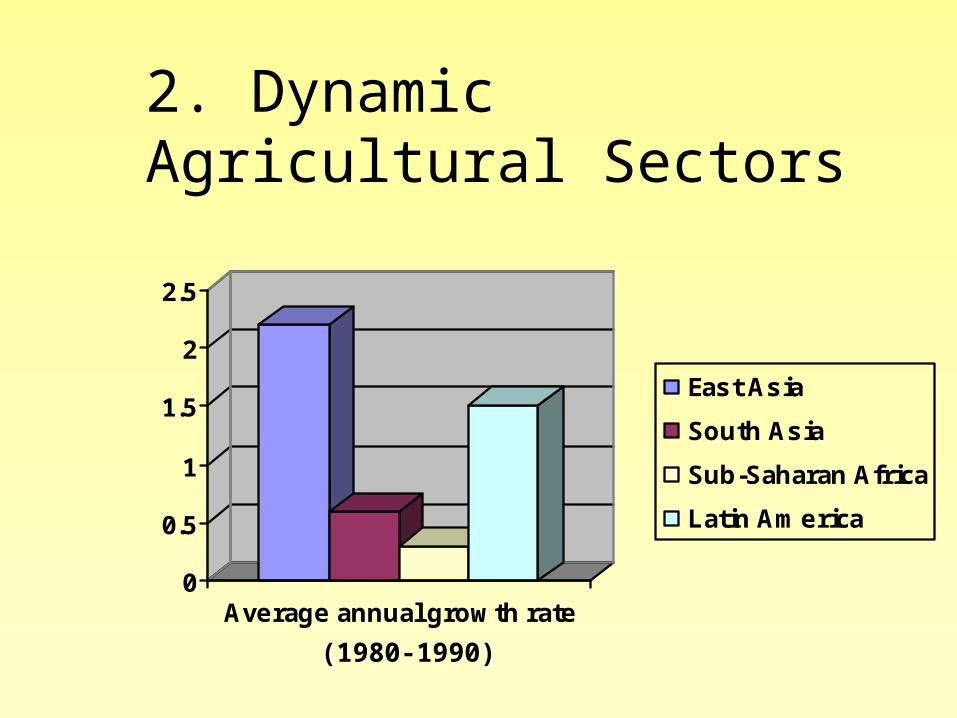
2. Dynamic Agricultural Sectors
0
0.5
1
1.5
2
2.5
Average annual growth rate
East Asia
South Asia
Sub-Saharan Africa
Latin America
(1980-1990)

3. Rapid Export GrowthGROWTH RATE OF EXPORTS, 1965-1990
Average annual growth rate of exports1965-80 1980-90
Asian NICsHong Kong 9.1 6.2Singapore 4.7 8.6South Korea 27.2 12.8Taiwan 18.9 12.1
Third World RegionsEast Asia and Pacific 8.5 9.8Latin America and Carib. -1.0 3.0Middle East and N. Africa 5.7 -1.1South Asia 1.8 6.8Sub-Saharan Africa 6.1 0.2
01020304050607080
1965 1980 1990 1965 1980 1990
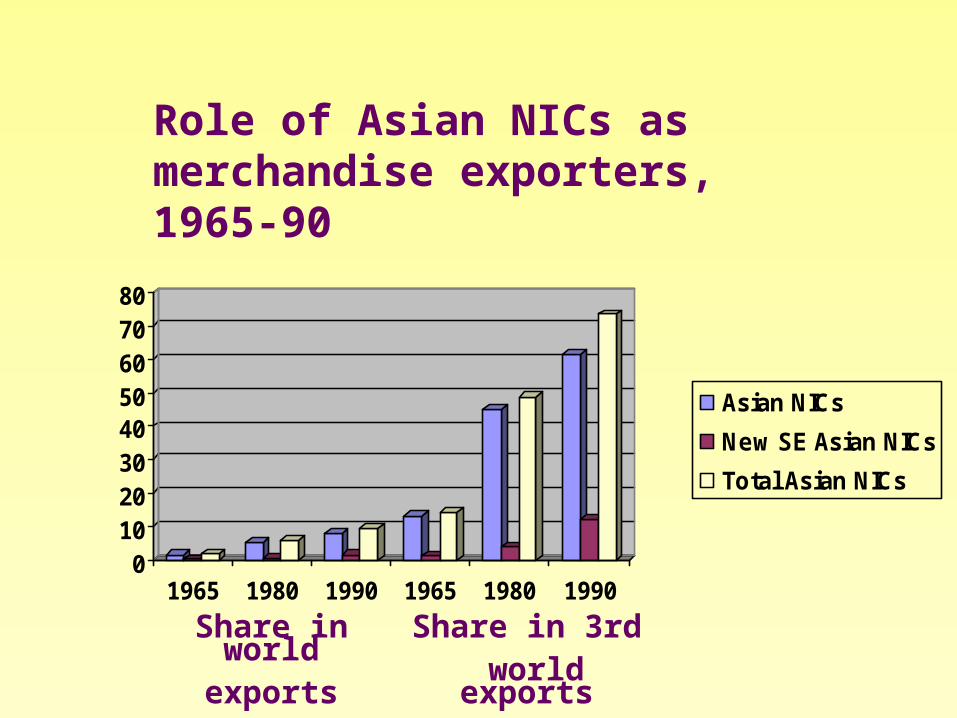
Asian NICs
New SE Asian NICs
Total Asian NICs
Share in world
exports
Share in 3rd world
exports
Role of Asian NICs as merchandise exporters, 1965-90

0
2
4
6
8
10
12
14
16
18
1973 1980 1990 1997
Germany
United States
Japan
France
U.K.
Asian NICs (4areas)
Leading merchandise exporters,
1973-97 (share of the world)
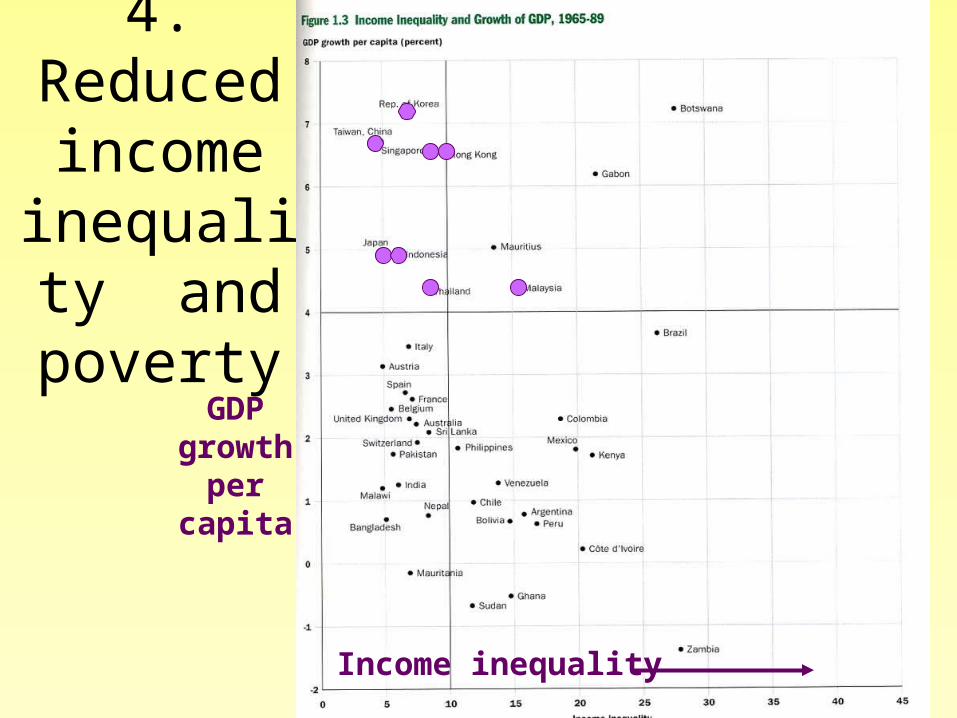
4. Reduced income
inequality and
povertyGDP
growth per
capita
Income inequality
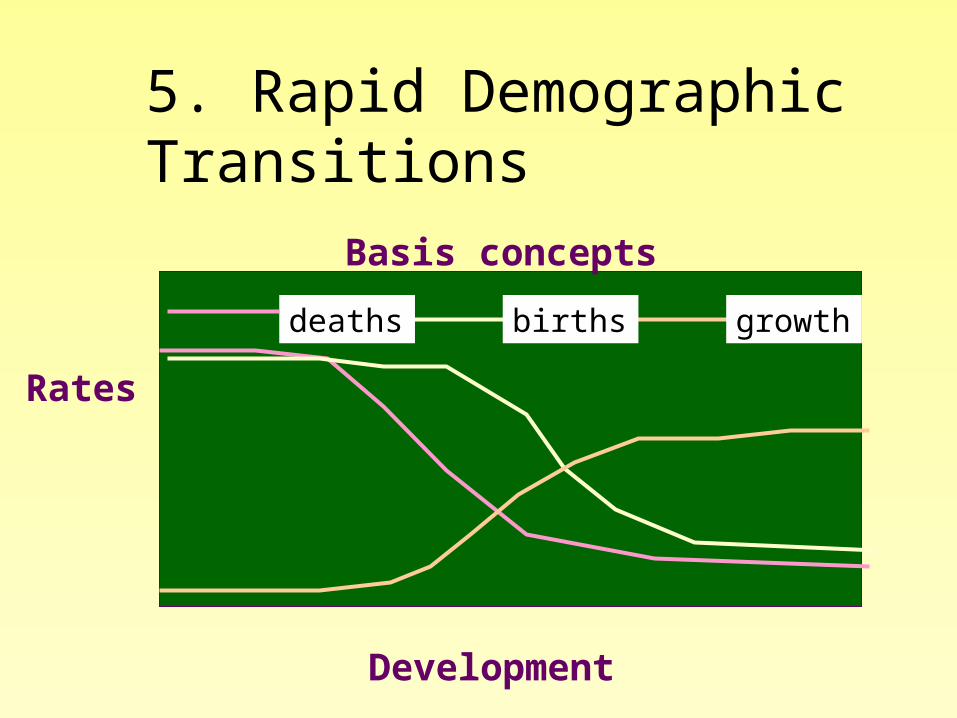
5. Rapid Demographic Transitions
Development
Rates
Basis concepts
deaths births growth
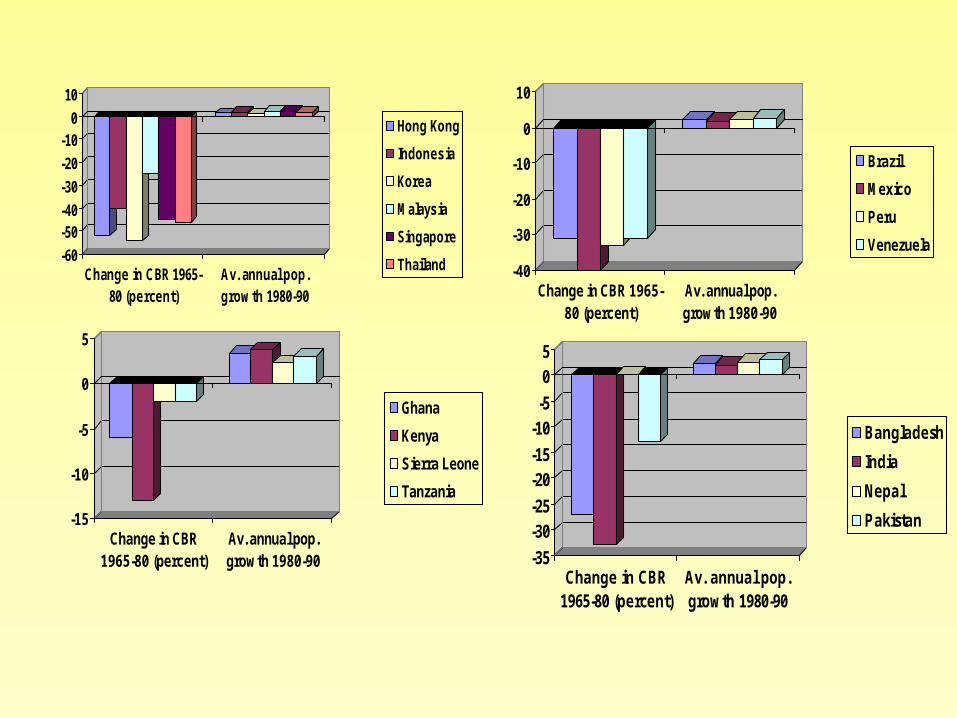
-60
-50-40
-30
-20
-100
10
Change in CBR 1965-80 (percent)
Av. annual pop.growth 1980-90
Hong Kong
Indonesia
Korea
Malaysia
Singapore
Thailand -40
-30
-20
-10
0
10
Change in CBR 1965-80 (percent)
Av. annual pop.growth 1980-90
Brazil
Mexico
Peru
Venezuela
-15
-10
-5
0
5
Change in CBR1965-80 (percent)
Av. annual pop.growth 1980-90
Ghana
Kenya
Sierra Leone
Tanzania
-35
-30-25
-20-15
-10-5
05
Change in CBR1965-80 (percent)
Av. annual pop.growth 1980-90
Bangladesh
India
Nepal
Pakistan

6. High Investment and Savings Rates
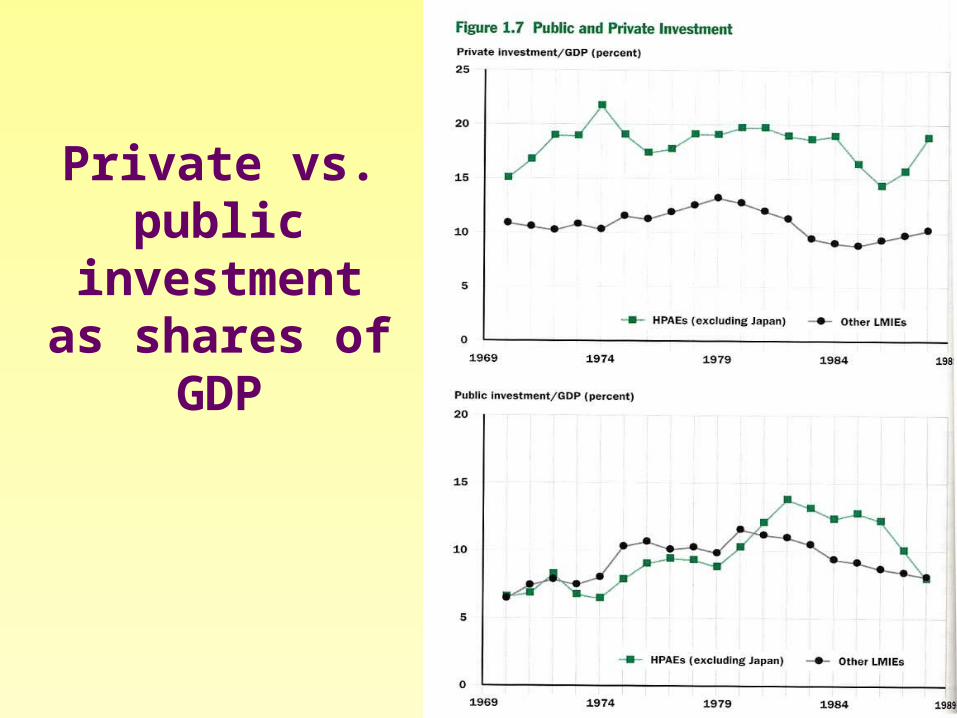
Private vs. public
investment as shares of
GDP
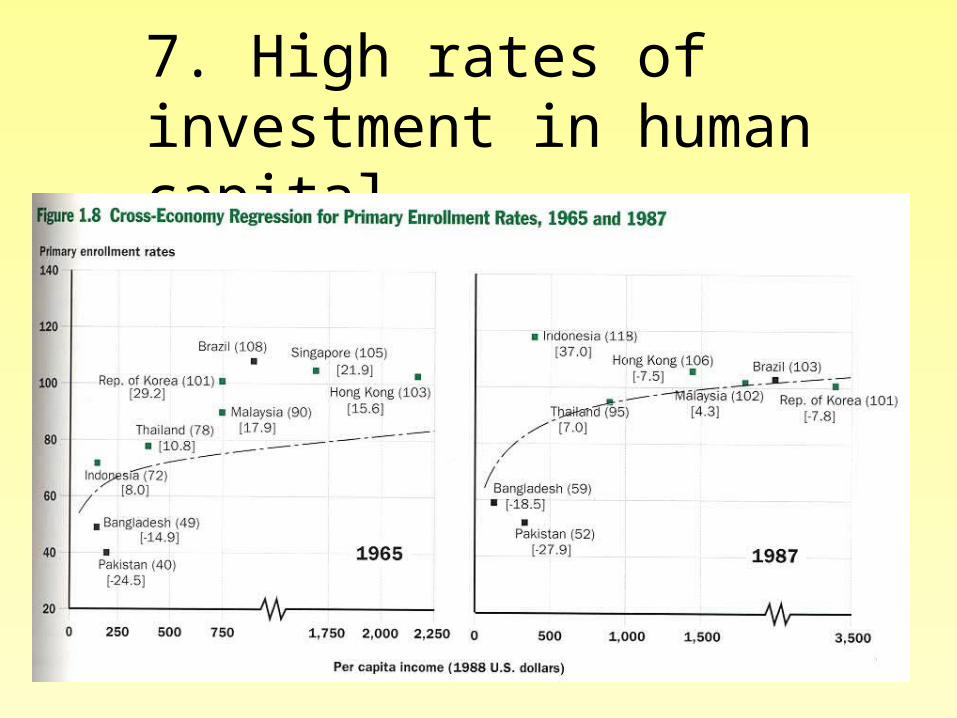
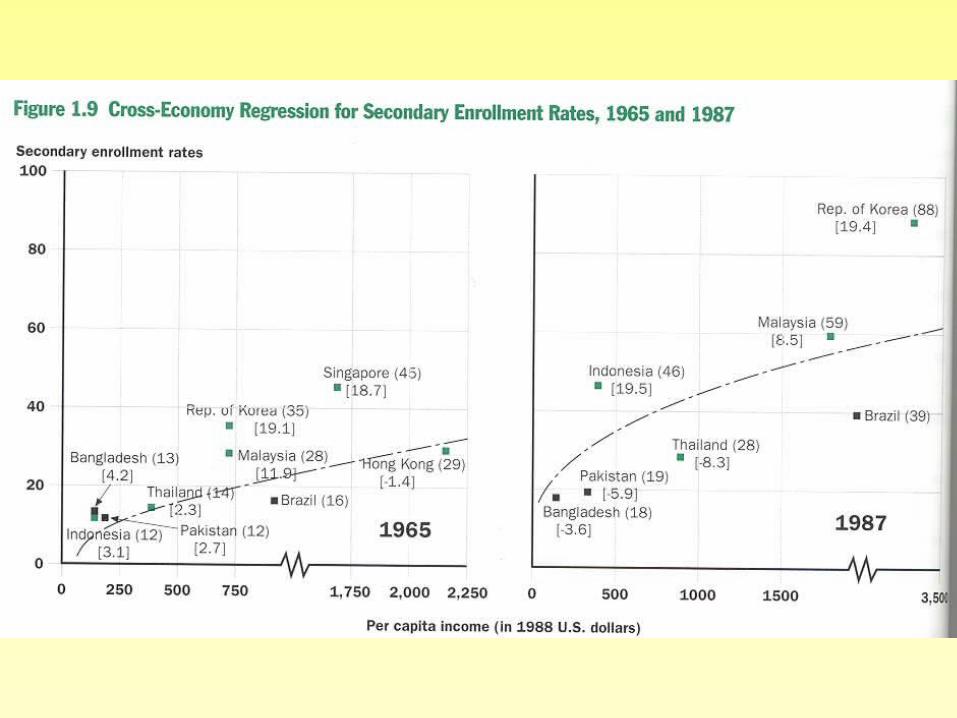
7. High rates of investment in human capital

The productivity growth issue
• Sources of productivity growth– accumulations of physical and human
capital– total factor productivity growth
attributable to:• better technology• organization• gains from specialization etc.
• World Bank position

Paul Krugman’s position• Growth is primarily due to accumulations
of physical and human capital• e.g. Singapore 1966-1990
– employed share of population rises from 27% to 51%
– 1966--more than 50% of workers have no formal education; by 1990 2/3 have completed secondary education
– investment as share of output goes from 11% to more than 40%

Alternative perspectives on the East Asian Miracle ( I recommend: John Brohman. 1996. Postwar development in
the Asian NICs: Does the neoliberal model fit reality?)

The Neoliberal Interpretation• Market regulation thesis
– eliminated restrictions on international trade
– deregulated financial sector– privatized state enterprises– created unregulated labor market
• export-oriented industrialization– based comparative advantage of low cost
labor

Criticisms of the Neoliberal Interpretation• Except for Hong Kong, substantial state
intervention– Taiwan: state ownership– Singapore: public monopolies and
parastatals– Korea: encouragement of chaebol
• guided market economies (like Japan)• substantial initial protection of strategic
industrial sectors

Ignores key historical factors•Role of Japan in early 20th C• role of U.S. in mid 20th C
– much assistance– tolerated early import
substitution policy
• role of Japanese corporations in 1970s