east coast vs. west coast: a documentation of model forecast failures for eta, nam, gfs, gem, and...
Post on 15-Jan-2016
216 views
TRANSCRIPT

East Coast vs. West Coast: A Documentation of Model Forecast
Failures for Eta, NAM, GFS, GEM, and ECMWF
Garrett WedamLynn McMurdie, Cliff Mass
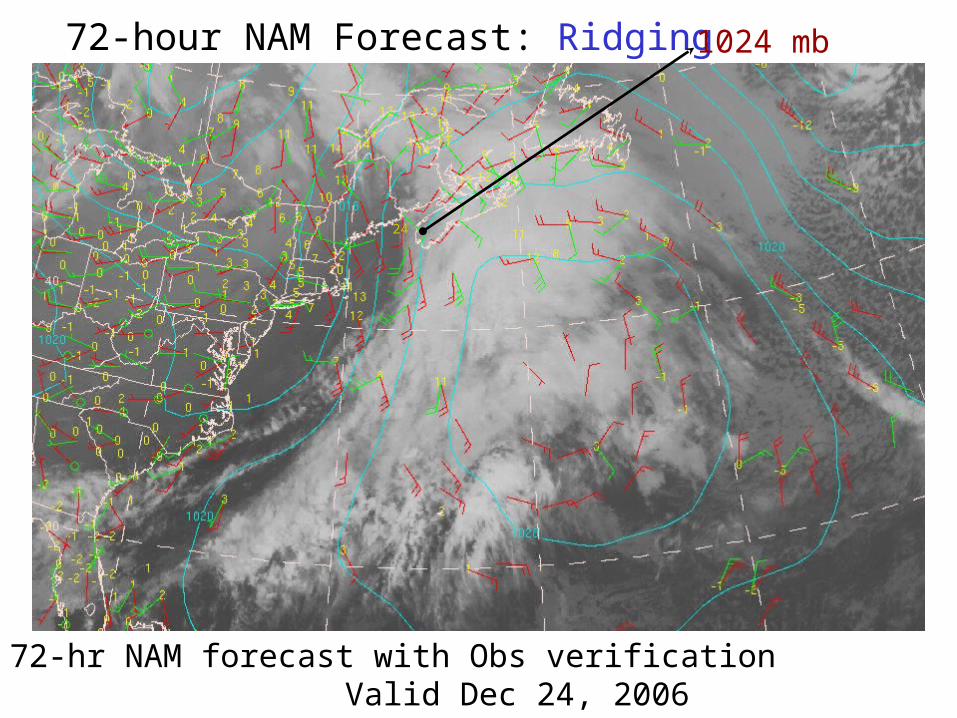
72-hour NAM Forecast: Ridging 1024 mb contour
72-hr NAM forecast with Obs verification Valid Dec 24, 2006
24
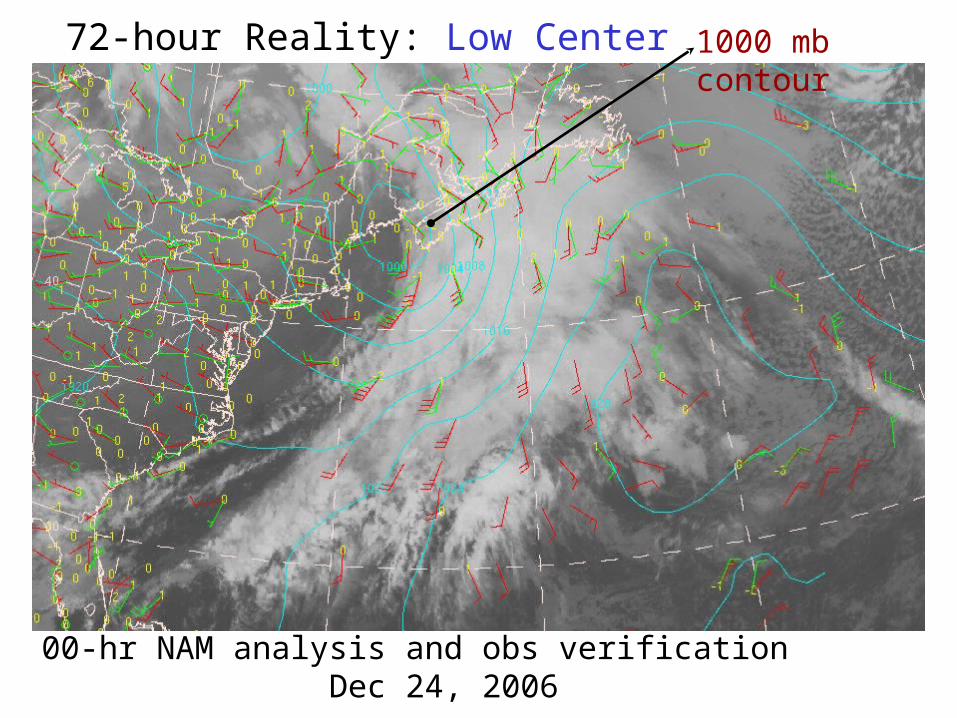
72-hour Reality: Low Center
00-hr NAM analysis and obs verification Dec 24, 2006
1000 mb contour

• 72-hour forecast errors– Eta/NAM: 24.1 mb
– CMC-GEM: 14.4 mb
– ECMWF: 10.0 mb
– GFS: 3.2 mb
• 48-hour forecast errors– Eta/NAM: 13.7 mb
– CMC-GEM: 9.1 mb
– ECMWF: 7.6 mb
– GFS: 1.5 mb
• 24-hour forecast errors– Eta/NAM: 4.7 mb
– CMC-GEM: 2.4 mb
– ECMWF: 2.7 mb
– GFS: -0.2 mb
GFS 72-hour forecast verifying 12-26
Verifying buoy
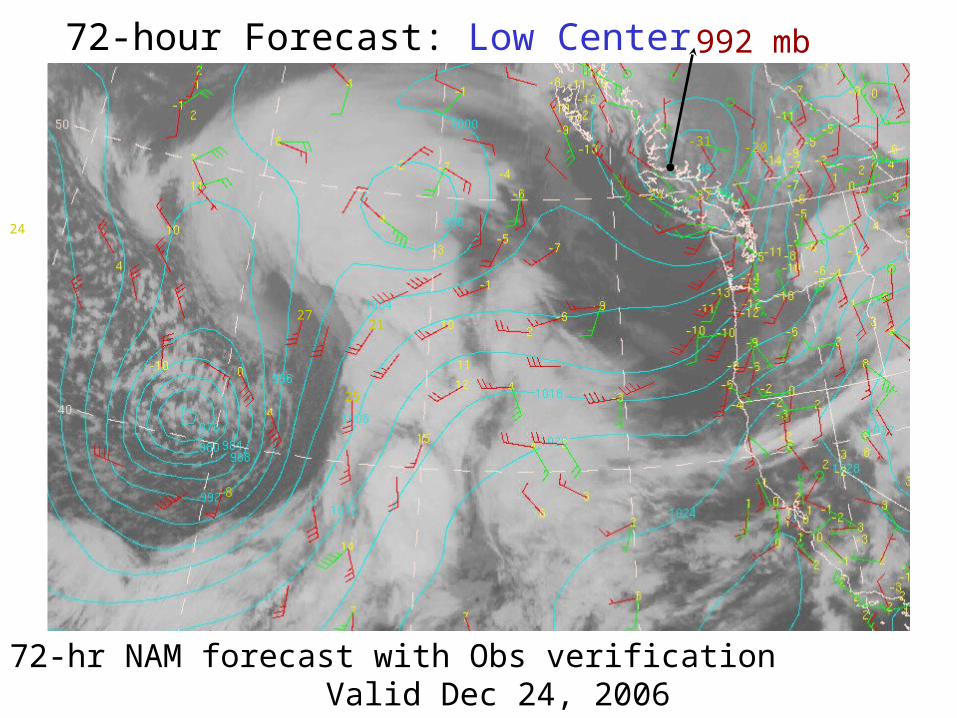
72-hour Forecast: Low Center
72-hr NAM forecast with Obs verification Valid Dec 24, 2006
992 mb contour
24
-24
-20
-27
-31
27
25
21
-8
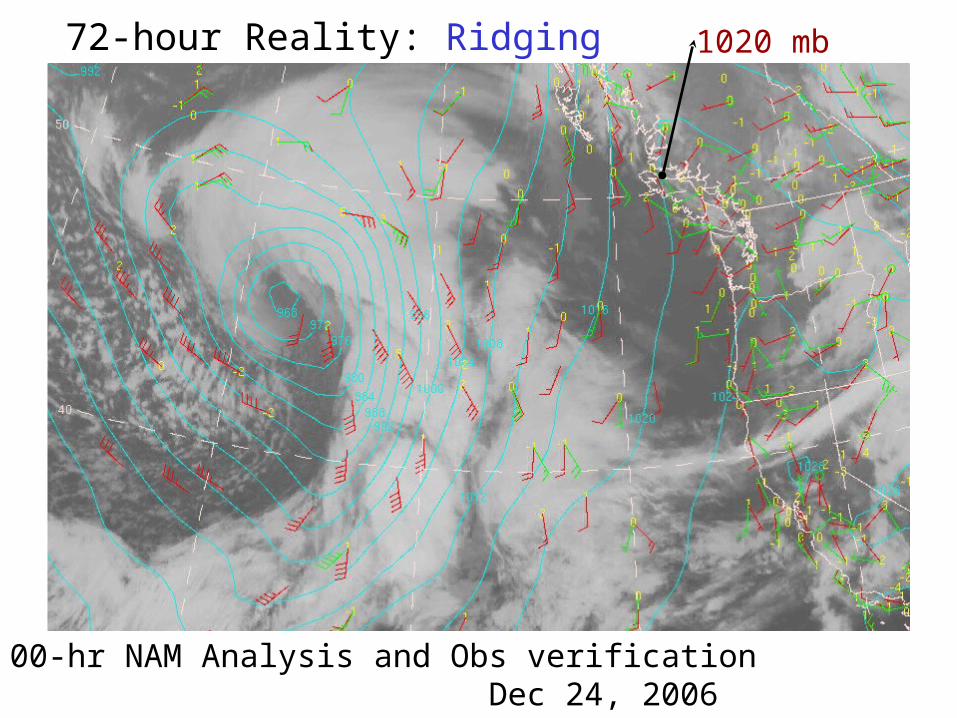
72-hour Reality: Ridging
00-hr NAM Analysis and Obs verification Dec 24, 2006
1020 mb contour

Method
• Directly compare observations to interpolated model forecasts
• Emphasize East and West Coasts– Buoys eliminate terrain effects
• Emphasize Sea Level Pressure comparisons– SLP is good indicator of model performance (i.e., storm
strength and location can be defined and compared using SLP)
– Insufficient off-coast upper-level observations

Method
• Useful Tools for Comparing Forecast Skill
– Mean Absolute Error (MAE)
– Mean Error, or Bias (ME)
– Frequency of Errors which exceed an arbitrary “Large Error” criterion (different for 24, 48, 72-hr forecasts)
– Timelines of said “Large Errors” to cross-reference failure dates between models
– Error Histograms to compare distributions and sizes of largest errors
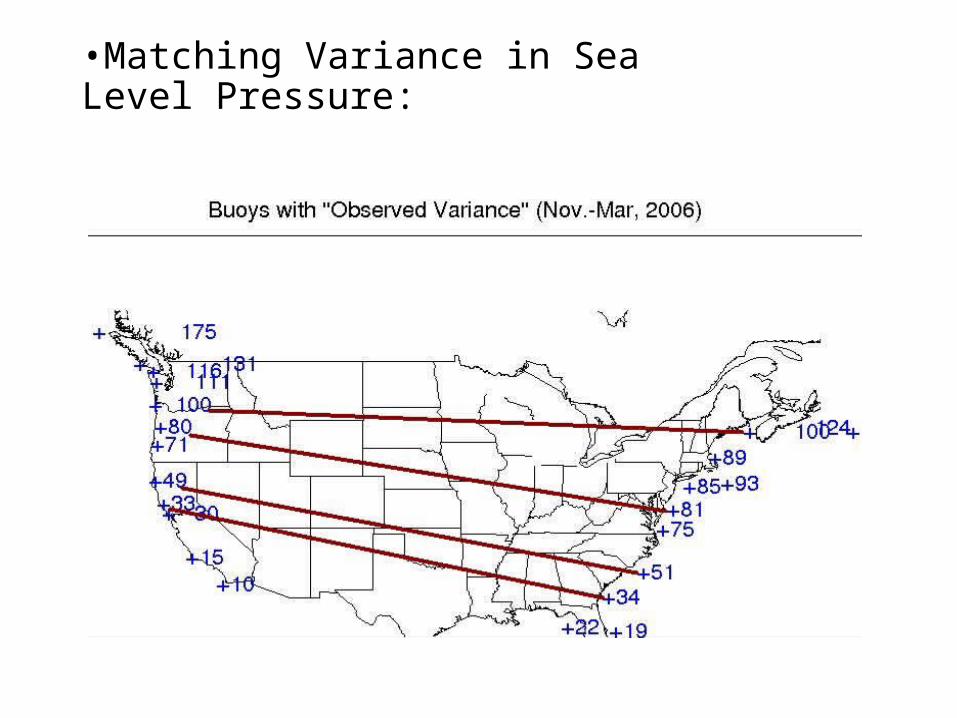
•Matching Variance in Sea Level Pressure:

Eta to WRF-NAM operational switchover
> 7 mb
> 5 mb
> 3 mb
West Coast: Number of Large Errors by model and month

East Coast: Number of Large Errors by model and month
CMC - GEM major model update. Included: increase in vertical and horizontal resolution, new physics scheme, decreased time step, data assimilation changes
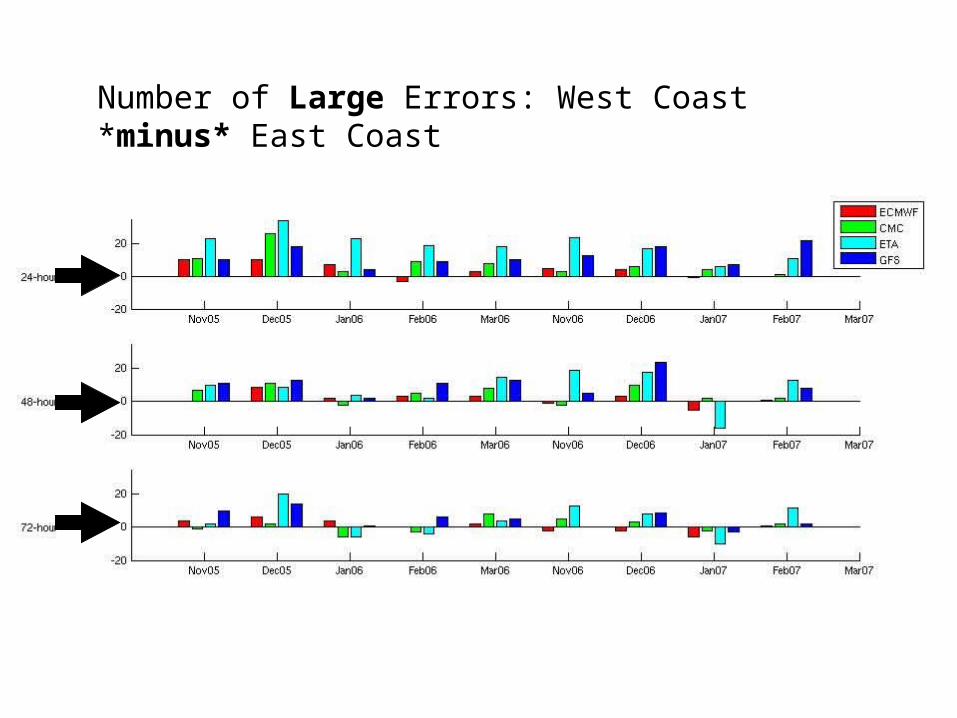
Number of Large Errors: West Coast *minus* East Coast
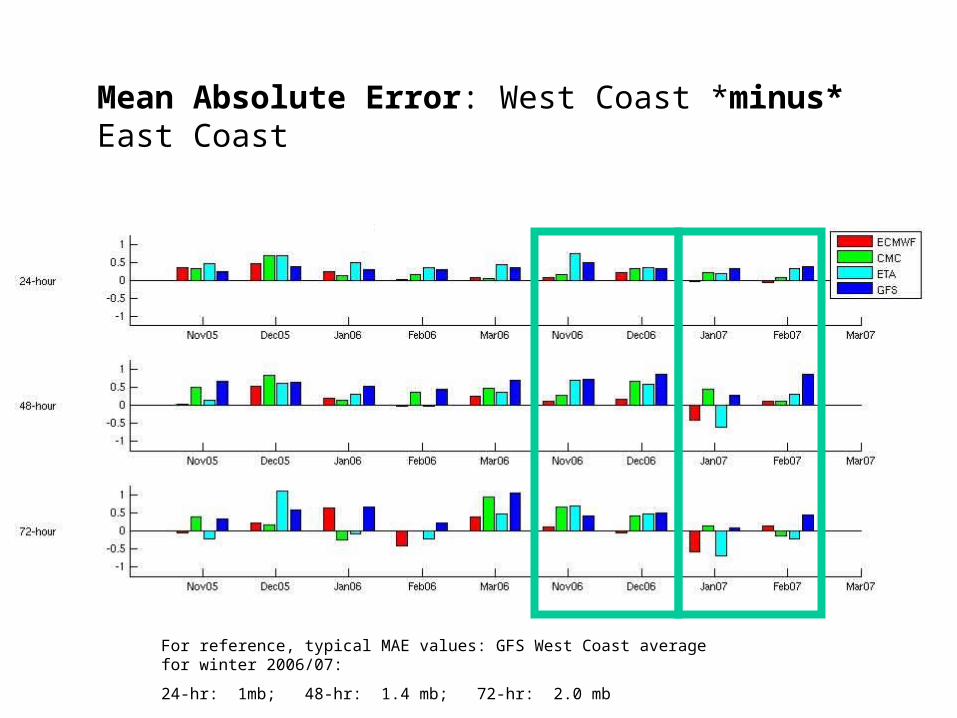
Mean Absolute Error: West Coast *minus* East Coast
For reference, typical MAE values: GFS West Coast average for winter 2006/07:
24-hr: 1mb; 48-hr: 1.4 mb; 72-hr: 2.0 mb

Comparing models: East Coast Mean Absolute Error *Standardized* to ECMWF
CMC – GEM update
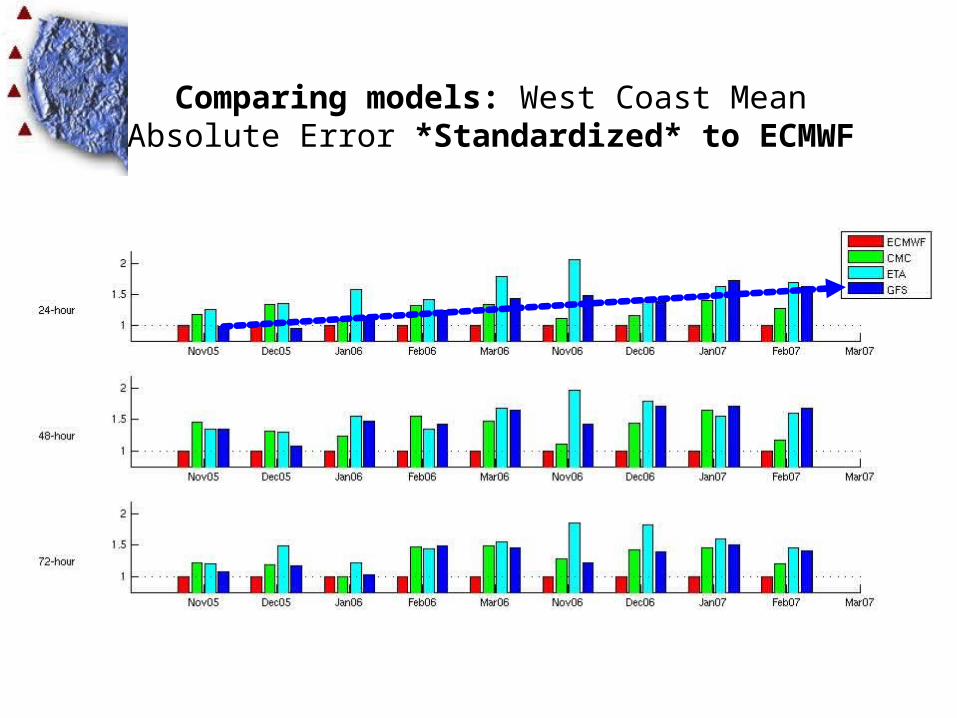
Comparing models: West Coast Mean Absolute Error *Standardized* to ECMWF

Results
• Comparing models: ECMWF generally outperforms and NAM underperforms others. There are indications that a CMC-GEM model update significantly improved some forecasts, and that GFS has not performed as well this season as the past season.
• More “forecast bust” events occur on the West than East Coast for 24, 48, and 72 hour forecasts
• The East Coast is better forecast in terms of MAE in sea level pressure
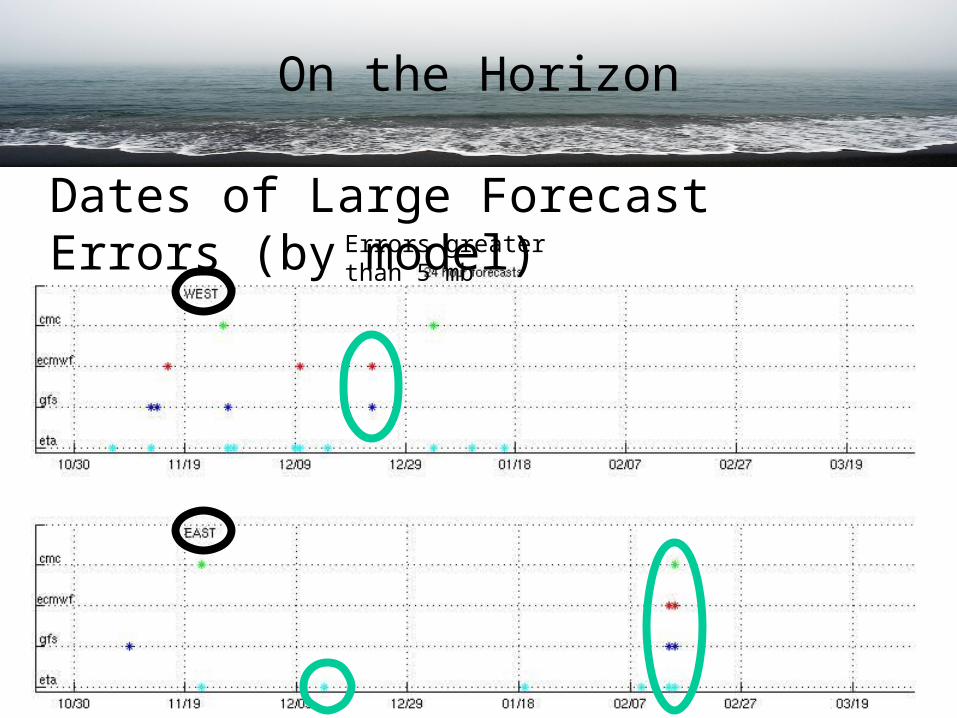
Dates of Large Forecast Errors (by model)Errors greater than 5 mb
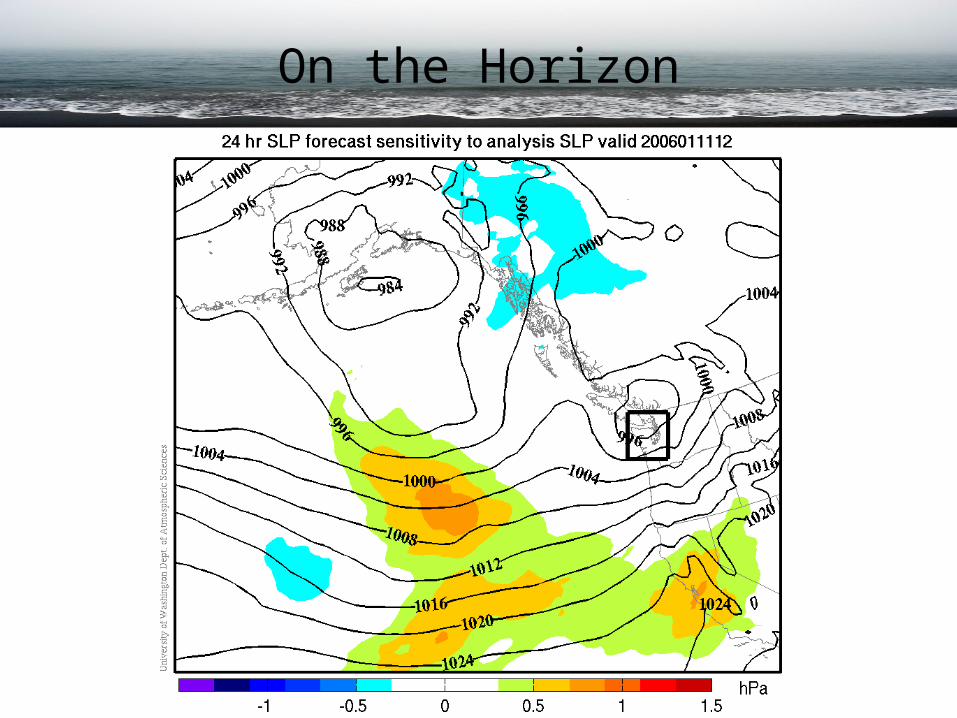
On the Horizon
On the Horizon
•Forecast Failures can be a result of initialization errors, insufficient “realism” of the model, and other model inadequacies. Knowing the most common causes of failure for high-impact forecast failures can help determine policy: do we invest more in improving models or in a new observation buoy?
•One cause of failure is High Model Sensitivity…
On the Horizon
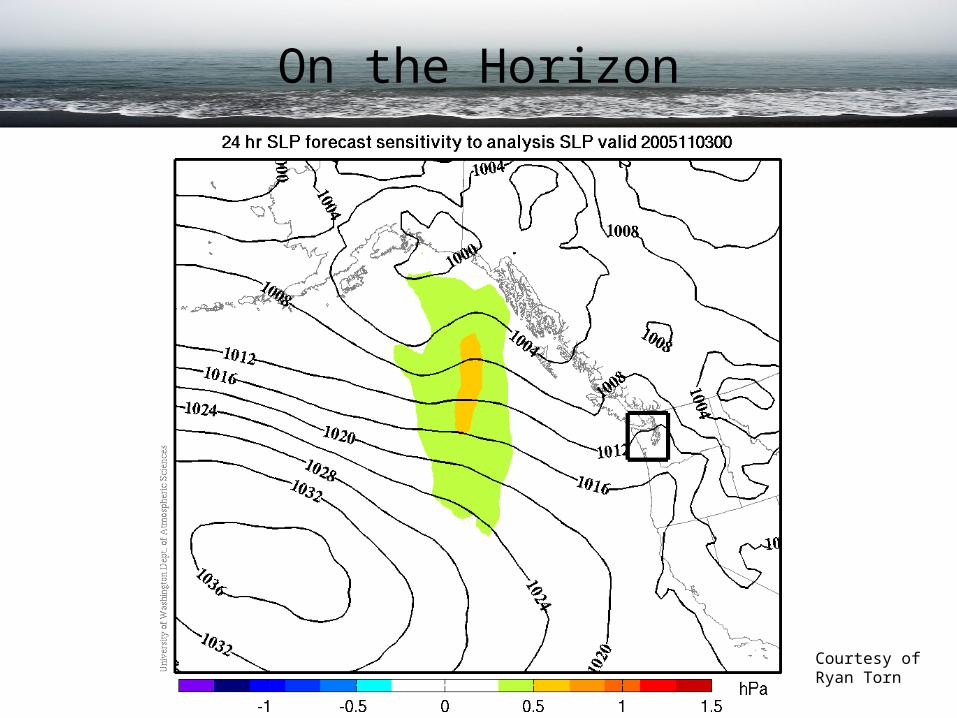
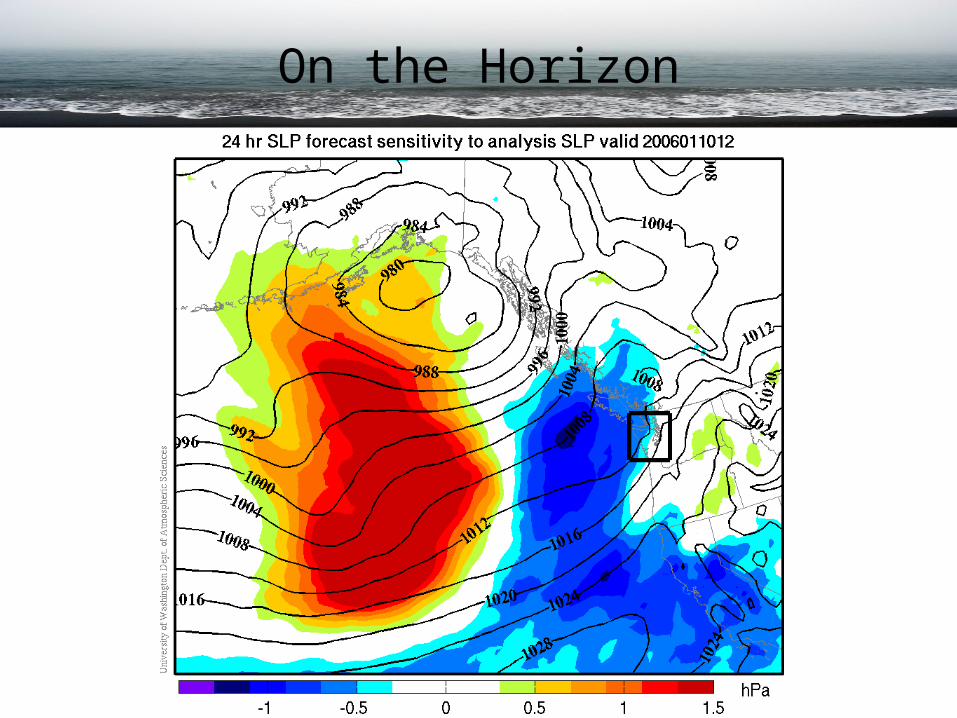
Courtesy of Ryan Torn

On the Horizon
On the Horizon
On the Horizon

On the Horizon

On the Horizon
•Thirty-four of 420 forecasts showed the highest sensitivity
•Nineteen of the 34 “sensitive” cases (55%) resulted in multiple models meeting “large error criterion”
•Compare to: 10-20% of all forecasts result in multiple models meeting “large error criterion”
motivates a more formal investigation!

On the Horizon
Picture from fijaciones.org
Are Two Winters Representative? Currently adding data from 2004/05 and remainder of 2006/07 to further examine year-to-year variability in forecast skill
What About The Rest of the Country? And Beyond? Will examine open-ocean buoys, and land sites; over land will use 850 mb observations instead of SLP
What Are the Features of “Busts”: Forecast failures with high impacts on people still occur. What are their features? And why do some models fail when others don’t?

East Coast vs. West Coast: A Documentation of Model Forecast
Failures for Eta, NAM, GFS, GEM, and ECMWF
Garrett WedamLynn McMurdie, Cliff Mass
Thank You!