east new york brooklyn - welcome to nyc.gov · background located in northeast brooklyn, east new...
TRANSCRIPT
COMMERCIAL DISTRICT NEEDS ASSESSMENT
Cypress Hills LDCHighland Park CDCLDC of East New York
in partnership
with
Commercial District Needs Assessment
EAST NEW YORKBROOKLYN

Background Located in northeast Brooklyn, East New York is a diverse and growing neighborhood that is centrally located between Downtown Brooklyn, Downtown Jamaica, and JFK International Airport. East New York and its neighboring communities of Brownsville, Cypress Hills, and Ocean Hill were once part of the town of New Lots before being annexed by Brooklyn in the late 19th century. This shared neighborhood history and the merging of local and regional rail lines and roadways at Broadway Junction makes East New York an intersection of culture and commerce. With strong roots in manufacturing, East New York was once deemed Brooklyn’s “Little Pittsburgh” due to its many steel fabrication and other industrial businesses in the early twentieth century. Freight and passenger rail lines running along Van Sinderen Avenue led to the development of warehouses, factories, and lofts that are still visible in what is now known as the East New York Industrial Business Zone (IBZ) and the East Brooklyn Business Improvement District (BID). Spanning 40 blocks, the East New York IBZ remains a local economic engine that is currently home to 250 businesses and 3,000 jobs. Adjacent to the IBZ and East New York’s commercial corridors is Broadway Junction, a major entry and transfer point for the East New York commercial district. The Junction is a distinguishable transportation hub, connecting five subway lines (A/C/J/Z/L) and multiple MTA bus routes, in addition to acting as a regional connector to the greater metropolitan area via the Long Island Railroad and the Jackie Robinson Parkway. East New York is served by four main commercial corridors. Atlantic Avenue, one of Brooklyn’s busiest thoroughfares, is currently lined with a mix of manufacturers, fast-food, depots, and automotive businesses that serve a regional customer base. Pitkin and Liberty Avenues currently have limited retail continuity and are defined by concentrations of commercial, residential, industrial, and religious uses, interspersed across the two corridors. Fulton Street, located under the elevated J/Z train, is home to a vibrant mix of local retail, where East New York residents frequent the corridor to dine at authentic cultural and ethnic restaurants and purchase household goods, and hair and beauty services.
Neighborhood Demographics
The East New York community is composed of a rich agglomeration of cultures. Historically a center of commerce to vibrant immigrant communities, East New York is now home to more than 79,566 residents and a growing community of African and Caribbean Americans, Bangladeshis, Dominicans, and Puerto Ricans. There are numerous houses of worship located throughout East New York, which also add to the neighborhood’s unique urban fabric. Despite challenges of lower incomes and higher unemployment compared to the New York City average, there are many community-based organizations that actively invest in the social and economic development of East New York and its residents, creating invaluable social capital for building a more resilient and equitable future.
Future Opportunities
As a result of the 2016 approval of the East New York Neighborhood Plan and rezoning proposal, the City of New York has committed $267 million in neighborhood investments to promote affordable housing, economic development, and improved community resources in East New York. Specific commitments include the development of a new school, community and childcare centers, programs to strengthen the IBZ, and other infrastructure improvements. The rezoning, which is projected to add an estimated 5,800 housing units and more than 400,000 square feet of new commercial space over the next 15 years, will provide a more diverse mix of retail for residents and new spaces for small businesses and entrepreneurs to grow and thrive.
ABOUT EAST NEW YORK
The Neighborhood 360° program was created by the NYC Department of Small Business Services to identify, develop, and launch commercial revitalization projects in partnership with local stakeholders. Through proactive planning and targeted investments, Neighborhood 360° supports projects that strengthen and revitalize the streets, small businesses, and community-based organizations that anchor New York City neighborhoods.
The Neighborhood 360° Commercial District Needs Assessment (CDNA) highlights a neighborhood’s existing business landscape and consumer characteristics.
This CDNA features the Fulton Street, Atlantic Avenue, Liberty Avenue, and Pitkin Avenue commercial corridors in East New York, and was conducted in partnership with the Cypress Hills Local Development Corporation, Highland Park Community Development Corporation, and the Local Development Corporation of East New York between December 2015 and May 2016.
Key issues and opportunities identified through this assessment will help prioritize SBS-supported, local investments, and serve as an informational and marketing resource for the neighborhood.
In This Report
Existing conditions, business data, and qualitative depictions of the neighborhood were gathered from more than 239 surveys and various stakeholder meetings with neighborhood merchants, shoppers, workers, property owners, and residents.
Jump to...
Key FindingsBusiness InventoryWhat Merchants SayBusiness Outlook What Shoppers SayPhysical EnvironmentData Appendix
4-56
7, 10-1112-139, 13
14-1516-19
See more on page 17
See more on page 5
2 Neighborhood 360° Commercial District Needs Assessment

Assessed Commercial Corridors Public Facilities
Business Improvement Districts (BIDs) Noteworthy Sites
Industrial Business Zones (IBZs) Community Markets
3
2
NEIGHBORHOOD CONTEXT
1
Cypress HillsYouth Market
Cypress HillsLibrary Branch
ArlingtonLibrary Branch
Pitkin VerdeFarmers Market
BrownsvilleLibrary Branch
Workforce1Career Center
African Burial GroundNew LotsLibrary Branch
Mrs. Maxwell’sBakery
Borden DairyFactory
East New YorkFarmers Market
Magistrate’s Court
2
1
3
4Z
J
J
L
L
A
A
C
C
3
East New York
Cypress Hills
Brownsville
Ocean Hill
Broadway Junction
Highland Park
The Evergreens Cemetery
City Line Park
PITKIN AVENUE
LIBERTY AVENUE
ATLANTIC AVENUE
FULTON STREET
GLENMORE AVENUE
JAMAICA AVENUEELD
ERT LA
NE
EUC
LID AVEN
UE
PENN
SYLVAN
IA AVENU
E
EAST B
RO
OK
LYN B
ID
PITKIN AVENUE BID
Queens
0 0.5 10.25 Miles
Cypress Hills Local Development Corporation
Cypress Hills Business Partners
East Brooklyn Business Improvement District
East New York Restoration Local Development Corporation
Local Development Corporation of East New York
Merchant and Business Groups
East New York
Points of Interest Notable Places
1
Mrs. Maxwell’s Bakery Borden Dairy Factory
Brooklyn Public Library - Arlington Branch New Lots African Burial Ground
4
Broadway JunctionHighland Park
3East New York
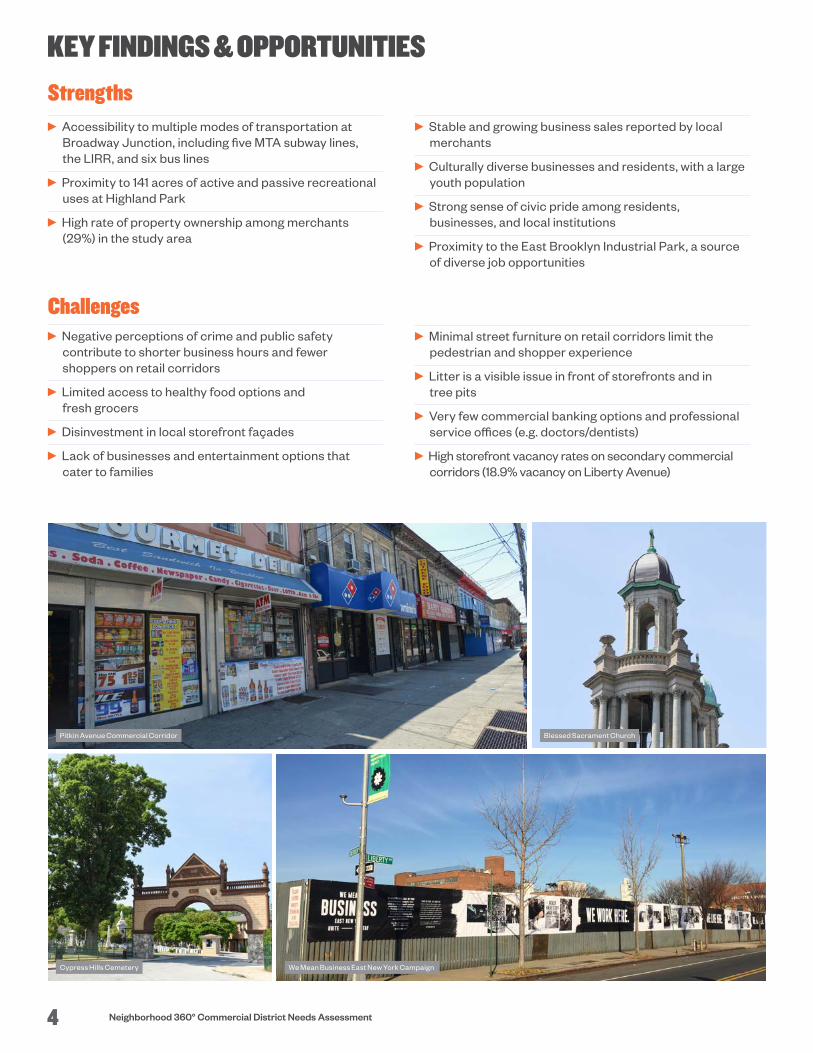
Stable and growing business sales reported by local merchants
Culturally diverse businesses and residents, with a large youth population
Strong sense of civic pride among residents, businesses, and local institutions
Proximity to the East Brooklyn Industrial Park, a source of diverse job opportunities
Challenges Negative perceptions of crime and public safety
contribute to shorter business hours and fewer shoppers on retail corridors
Limited access to healthy food options and fresh grocers
Disinvestment in local storefront façades
Lack of businesses and entertainment options that cater to families
Minimal street furniture on retail corridors limit the pedestrian and shopper experience
Litter is a visible issue in front of storefronts and in tree pits
Very few commercial banking options and professional service offices (e.g. doctors/dentists)
High storefront vacancy rates on secondary commercial corridors (18.9% vacancy on Liberty Avenue)
Pitkin Avenue Commercial Corridor Blessed Sacrament Church
Cypress Hills Cemetery We Mean Business East New York Campaign
KEY FINDINGS & OPPORTUNITIESStrengths
Accessibility to multiple modes of transportation at Broadway Junction, including five MTA subway lines, the LIRR, and six bus lines
Proximity to 141 acres of active and passive recreational uses at Highland Park
High rate of property ownership among merchants (29%) in the study area
4 Neighborhood 360° Commercial District Needs Assessment

East New York
Opportunities Utilize grassroots partnerships, educational campaigns,
and targeted interventions to keep streets, sidewalks, and storefronts clean of litter and graffiti
Recruit diverse, family-oriented businesses to enhance the daily shopping experience for East New York families
Facilitate “shop & buy local” connections between East New York IBZ businesses, local retailers, and future mixed-use developments
Develop district-wide marketing campaigns, programming, and events that highlight the neighborhood’s unique restaurants, arts / cultural groups, historical landmarks, and specialized goods
Organize merchants within the commercial district to advocate for business needs, access support services, and shepherd inclusive commercial revitalization efforts
Optimize East New York’s connectivity advantages through district-wide wayfinding / signage that better links commercial corridors with transit
Maximize the social capital of East New York by building the capacity of community-based organizations
Animate underutilized public spaces and identify locations for street furniture placement
Cypress Hills Youth Market Broadway Junction Subway Entrance
We Mean Business Campaign Hand on Blue Mural, Fulton Street
What’s Next?To address these key findings and opportunities, Neighborhood 360° Grants will be made available by SBS to not-for-profit organizations.
For more information, visit: nyc.gov/neighborhood360
5

Bars / Lounges & Liquor Stores
Pharmacies and Drug Stores
Full-Service Restaurants
Pawn Shops, Cash Advance, & Money Transfer Services
Gas Stations
Hotels, Gyms, & Self-Storage
Ambulatory Health Care Services
Commercial Banks
Transportation & Warehousing
Other Miscellaneous Store Retailers
Management, Consulting, & Other Professional Services
Travel Agencies & Cellphone Stores
Apparel, Shoes, & Jewelry Stores
Daycare Services, Schools, & Public Administration
Thrift Shops & Discount Stores
Tax Prep, Real Estate Leasing & Legal Services
Dry Cleaning & Laundry Services
Food Markets & Grocery Stores
Hardware, Furniture & Household Appliance Stores
Delis / Bodegas & Convenience Stores
Religious Organizations & Houses of Worship
Construction, Manufacturing & Wholesale Businesses
Fast Food & Snack Shops
Beauty / Nail Salons & Barbershops
Automotive BusinessesVacant
77
89
74
68
58
53
3634
29
28
27
27
18
18
17
17
15
15
14
1413
11
9
8
7
3
BUSINESS LANDSCAPE: EAST NEW YORK
802Total Number of Storefronts
11%Storefront Vacancy*
Business Inventory
Storefront & Retail Mix*Note: In 2015, New York City’s 69 Business Improvement Districts reported an average ground floor vacancy rate of 8.3% and median ground floor vacancy of 5.6% (SBS BIDs Trends Report, 2015).
Atlantic Avenue Corridor Liberty Avenue CorridorFulton Street Corridor
Business inventory and retail mix data shown opposite were gathered by Cypress Hills Local Development Corporation, Highland Park Community Development Corporation, and the Local Development Corporation of East New York through a comprehensive area inventory of storefront businesses located along Fulton Street, Atlantic Avenue, Liberty Avenue, and Pitkin Avenue between Pennsylvania Avenue and Eldert Lane (December 2015 to May 2016).
Despite the expansive service offerings in East New York, the community is severely lacking in access to professional services (e.g. doctor’s and dentist’s offices) and commercial banking options.
6 Neighborhood 360° Commercial District Needs Assessment

Source: Based on 239 merchant surveys conducted by Cypress Hills Local Development Corporation, Highland Park Community Development Corporation, and the Local Development Corporation of East New York in Winter 2016.
What We’ve Heard from East New York Merchants
How many years have you been in business here?
0
10
20
30
40
50
21+11–206–103–50–2
18%20% 21% 21% 20%
Years in Business
Bus
ines
ses
What changes need to occur to bring more people to your shop or use your services?
Safety
Sanitation
Storefront improvements
Parking
Better landscaping
Business-to-business communication
Community events
% Merchant Responses
25%
18%
16%
15%
13%
8%
5%
14Mean
8Median
5Mode
Do you own or rent your property?
70%Rent
29%Own
1%No response
How many employees do you have?
5Mean
3Median
2Mode
Over the past year, has your business improved, stayed the same, or decreased?
22%Improved
54%Stayed the Same
23%Decreased
1%Fluctuated
What kinds of resources would help you grow your business?
Financing
Marketing support
Space improvements
New equipment
Legal support
Assistance with regulatory compliance
Training for staff
% Merchant Responses
28%
27%
22%
13%
6%
3%
3%
7East New York
Renovated East New York Business District Signage

BUSINESS LANDSCAPE: EAST NEW YORK
What are the most pressing needs on the corridor?
“Need for additional retail.”
“I love that it’s a busy location, attracts a lot of people going through here.”
“Better streetscapes to improve pedestrian experience.”
“Atlantic Avenue needs more diverse restaurants, food markets, and retail spaces.”
“Big dynamic avenue.”
“Security.”
“Public transportation nearby main thoroughfare.”
“The combination of retail and residential. I think the project [Neighborhood 360°] will help foot traffic. Shoppers and residents make the corridor more friendly.”
“More traffic lights and evening lighting.”
What do you like about the commercial corridor?
“There is a lot of commercial traffic that we can connect with. It is a vibrant commercial community. We are centralized in the 5 boroughs. Can go anywhere.”
“It has great potential.”
What We’ve Heard from East New York Merchants
8 Neighborhood 360° Commercial District Needs Assessment

What We’ve Heard from East New York Shoppers
What would you suggest to improve the commercial district for residents, pedestrians, and shoppers?
“Ensuring more safety with more street lighting.”
“Better street lighting at night, trash cans on the train platforms, affordable parking.”
“Diversity in food options, greenscape, park benches, sanitation.”
“Diversity in food and commercial offerings, improve the cleanliness of sidewalks. Protections for minority-owned small businesses when the community becomes more diverse.”
“More youth-friendly spaces and healthy food choices.”
“More banks, food choices, and retail stores.”
“Unity among business owners to improve the commercial district – street lighting, green areas, parks, community events.”
“Community spirit-building events, like street fairs and concerts. More wealth building seminars, community outreach, and networking events... so the community can get to know one another and build relationships.”
“More street lights for late night pedestrians.”
9East New York

Source: Based on 45 Atlantic Avenue merchant surveys conducted by the LDC of East New York and 103 Fulton Street merchant surveys conducted by Cypress Hills LDC in Winter 2016.
10 Neighborhood 360° Commercial District Needs Assessment
Most Common Businesses
52
21
20
14
10Tax Prep, Real Estate Leasing, & Legal Services
Religious Organizations & Houses of Worship
Hardware, Furniture, & Household Appliance Stores
Construction, Manufacturing, & Wholesale Businesses
Automotive Businesses
Long-Standing Businesses
East New York Hardware (2753 Atlantic Ave.)
Elm Plumbing (2764 Atlantic Ave.)
City National Bank (2815 Atlantic Ave.)
Years
96
70
15
Business Inventory
Do you own or rent your property?
62%Rent
38%Own
229Total Storefronts
10%Storefront Vacancy
Atlantic Commercial Storefront
What We’ve Heard from Atlantic Avenue Merchants
What We’ve Heard from Fulton Street Merchants
Most Common Businesses
42
39
21
20
17Apparel, Shoes, & Jewelry Stores
Laundromats & Dry Cleaners
Food Markets & Grocery Stores
Fast Food & Snack Shops
Beauty / Nail Salons & Barbershops
Long-Standing Businesses
Crane Cooling Corporation (2849 Fulton St.)
Cypress Plumbing & Heating Supply Co (3304 Fulton St.)
Cypress Hills Senior Center (3208 Fulton St.)
Angela’s Pizzeria (3435 Fulton St.)
Naya Super Dry Cleaners (2816 Fulton St.)
Years
65
50
44
44
40
Business Inventory
Do you own or rent your property?
75%Rent
25%Own
346Total Storefronts
11%Storefront Vacancy
Fulton Street Commercial Storefronts
City National Bank was developed in 1971 as a response to the economic disparity faced by African Americans in Newark, New Jersey. Its mission is to make credit and banking services accessible to historically marginalized communities. Today, City National Bank has a branch on Atlantic Avenue serving the greater East New York community.

Source: Based on 50 Liberty Avenue merchant surveys and 41 Pitkin Avenue merchant surveys conducted by Highland Park Community Development Corporation in Winter 2016.
11East New York
Long-Standing Businesses
Joe’s Pizzeria & Restaurant (1121 Liberty Ave.)
Louise’s Furniture & Flea Market (450 Liberty Ave.)
Liberty Grand Caffe (1170 Liberty Ave.)
City Line Party (1154 Liberty Ave.)
S&D Kids (1145 Liberty Ave.)
Most Common Businesses
14
11
10
10
5Beauty / Nail Salons & Barbershops
Delis, Bodegas, & Convenience Stores
Religious Organizations & Houses of Worship
Automotive Businesses
Construction, Manufacturing, & Wholesale Businesses
Years
37
35
34
32
32
Long-Standing Businesses
810 Car Service Corp. (2672 Pitkin Ave.)
Sampson Funeral Services, Inc. (2601 Pitkin Ave.)
CG’s Hardware Store (2376 Pitkin Ave.)
Liriano’s Tire Shop (2371 Pitkin Ave.)
Most Common Businesses
25
21
19
13
5
Pitkin
Child & Daycare Services
Fast Food & Snack Shops
Beauty / Nail Salons & Barbershops
Religious Organizations & Houses of Worship
Delis, Bodegas & Convenience Stores
Years
53
38
35
33
What We’ve Heard from Liberty Avenue Merchants
What We’ve Heard from Pitkin Avenue Merchants
Business Inventory
Do you own or rent your property?
68%Rent
29%Own
3%No response
137Total Storefronts
7%Storefront Vacancy
Pitkin Avenue Commercial Storefronts
Business Inventory
Do you own or rent your property?
70%Rent
30%Own
90Total Storefronts
19%Storefront Vacancy
Liberty Avenue Commercial Storefronts

$104.5M $49.3M
$36.6M $32.1M
$30.7M $21.5M
$16.5M $14.1M
$10.4M $9.6M $9.4M $9.1M
$7.7M $5.6M $4.5M $4.4M $3.7M $3.1M
-$1.6M-$2.4M-$3.8M-$4.1M-$4.6M-$12.2M-$34.1MGrocery Stores
Limited-Service Eating PlacesBeer, Wine & Liquor Stores
Book, Periodical & Music StoresFurniture Stores
Auto Parts, Accessories & Tire StoresDrinking Places (Alcoholic Beverages)
FloristsUsed Merchandise Stores
Office Supplies, Stationery & Gift StoresSpecial Food Services
Lawn/Garden Equip. & Supply StoresJewelry, Luggage & Leather Goods Stores
Specialty Food StoresOther Miscellaneous Store Retailers
Shoe StoresHome Furnishings StoresFull-Service Restaurants
Bldg Material & Supplies DealersHealth & Personal Care Stores
Sporting Goods/Hobby/Musical Instr. StoresGasoline Stations
Other General Merchandise StoresClothing Stores
Department Stores Excluding Leased Depts.
BUSINESS OUTLOOK
Retail Leakage & Surplus
Local businesses make
$1.06Beach year in retail sales
Every year,
$591.0Mis spent outside
the neighborhood
Residents spend
$1.65B each year in
goods and services
LeakageSurplus $0
East New York Retail Opportunity
Source: ESRI and Infogroup, August 2016.
Retail leakage and surplus is the difference between estimated spending by local residents on retail goods and estimated sales by local retail businesses. Retail leakage occurs when consumer demand exceeds retail supply in a designated trade area. On the chart, a positive value indicates leakage of retail sales and represents net consumer spending that is being captured by retailers outside of the trade area. Retail surplus occurs when retail supply exceeds consumer demand in a designated trade area. On the chart, a negative value indicates a surplus of retail sales and may signify a market where retailers are drawing customers from outside the trade area.
12 Neighborhood 360° Commercial District Needs Assessment
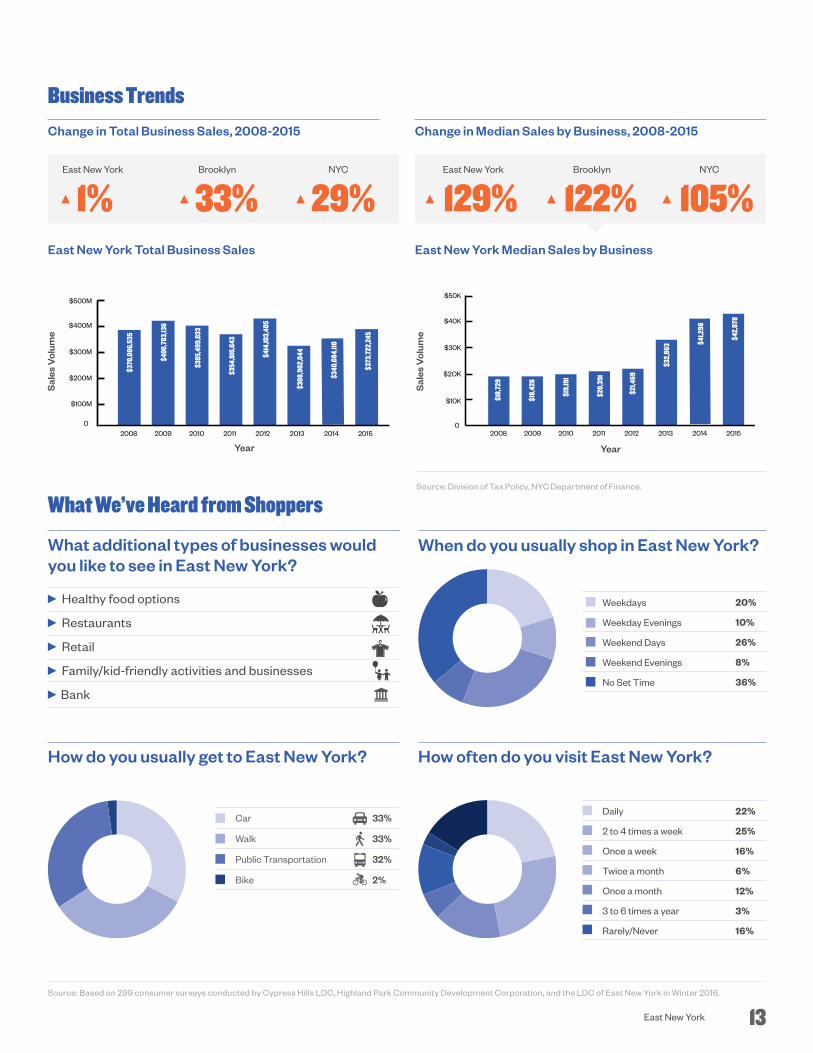
East New York Brooklyn NYC
1% 33% 29% East New York Brooklyn NYC
129% 122% 105%
How often do you visit East New York?
Daily
2 to 4 times a week
Once a week
Twice a month
Once a month
3 to 6 times a year
Rarely/Never
22%
25%
16%
6%
12%
3%
16%
When do you usually shop in East New York?
Weekdays
Weekday Evenings
Weekend Days
Weekend Evenings
No Set Time
20%
10%
26%
8%
36%
What additional types of businesses would you like to see in East New York?
Healthy food options
Restaurants
Retail
Family/kid-friendly activities and businesses
Bank
Business Trends
What We’ve Heard from Shoppers
Source: Based on 299 consumer surveys conducted by Cypress Hills LDC, Highland Park Community Development Corporation, and the LDC of East New York in Winter 2016.
Change in Total Business Sales, 2008-2015 Change in Median Sales by Business, 2008-2015
0
$100M
$200M
$300M
$400M
$500M
$370
,086
,535
$406
,783
,136
$385
,499
,033
$354
,816
,643
$414
,103,
405
$308
,902
,044
$373
,722
,245
$340
,684
,110
2009 2010 2011 2012 2013 2014 201520080
$10K
$2OK
$30K
$40K
$50K
2009 2010 2011 2012 2013 2014 20152008
$18,
729
$18,
426
$19,
191
$20,
391
$21,4
69
$32,
863
$42,
878
$41,2
98
East New York Median Sales by BusinessEast New York Total Business Sales
Year Year
Sal
es V
olum
e
Sal
es V
olum
e
Car
Walk
Public Transportation
Bike
33%
33%
32%
2%
How do you usually get to East New York?
Source: Division of Tax Policy, NYC Department of Finance.
13East New York

Fulton Street
Poor perception of public safety between Eldert Lane and Chestnut Street due to the high number of vacant storefronts
No benches or other seating amenities located on the 35 block corridor
No trees along the Fulton Street corridor due mainly to the elevated train. Opportunities do exist for installation of planters and lower-scale greenery
Insufficient street lighting under the elevated subway
Atlantic Avenue
Presence of auto businesses restricts roadside parking and pedestrian movement
Only three standing bus shelters exist along Atlantic Avenue’s 30 active bus stops
Observations
Liberty Avenue
High concentrations of graffiti
Presence of scrap yards and building scaffolding create perception of the corridor being unsafe and in disrepair
Liberty Avenue and Logan Street is a very active block surrounded predominantly by residential uses. At this intersection, the overall street conditions are above average
Absence of seating and other street furniture limits the use of the corridor by local senior citizens
Pitkin Avenue
Absence of seating, street furniture, and bus stop shelters along the corridor
A new bike lane runs along the majority of Pitkin Avenue between Pennsylvania Avenue and Fountain Avenue
PHYSICAL ENVIRONMENT
Good Conditions Average Conditions Poor Conditions
Streetscape Conditions
1
2
3
4
5
East New York
Cypress Hills
Brownsville
Ocean Hill
Broadway Junction
Highland Park
The Evergreens Cemetery
City Line Park
PITKIN AVENUE
LIBERTY AVENUE
ATLANTIC AVENUE
FULTON STREET
GLENMORE AVENUE
JAMAICA AVENUE
ELDER
T LAN
E
EUC
LID AVEN
UE
PENN
SYLVAN
IA AVENU
E
Queens
Streetscape conditions depicted above represent a block-by-block analysis of physical observations including street lighting, street furniture, tree conditions, perceptions of safety, trash management, graffiti and signs of vandalism, parks, and plazas.
1 3
4
5
2
0 0.5 10.25 Miles
14 Neighborhood 360° Commercial District Needs Assessment

Vacant Lot Assessed Commercial Corridors Vacant Storefronts
Fulton Street Fulton Street Liberty Avenue
Liberty Avenue Pitkin Avenue Pitkin Avenue
Storefront Vacancies
Pennsylvania Avenue
Atlantic Avenue
Liberty Avenue
Fulton Street
Pitkin Avenue
Eldert LaneHighland Park
City Line Park
Blake Avenue
Crescent Street
LIRR Atlantic
East Brooklyn BID
Pitkin BID
East New York
Ocean Hill
Brownsville
Cypress HillsCity Line
Queens
Observations
An analysis of 802 storefronts along Fulton Street, Atlantic Avenue, Liberty Avenue, and Pitkin Avenue revealed that 40% of storefronts are in poor condition, 36% are in average condition, and 24% are in good condition.
0 0.5 10.25 Miles
15East New York

ATLANTIC AVENUEFULTON STREET
PITKIN AVENUE
LIBERTY AVENUE
The Evergreens Cemetery
Highland Park
City Line Park
East New York
Cypress Hills
Brownsville
Ocean Hill
Broadway Junction
Queens
Study Area Boundaries
DATA APPENDIX
Population Density (per square mile)
40,719 East New York
Brooklyn
New York City
50,025
27,027
Total Population
79,566 East New York
Brooklyn
New York City
2,539,789
8,268,999
Average Household Size
3.3 East New York
Brooklyn
New York City
2.7
2.6
Area Demographics
0 0.5 10.25 Miles
Assessed Commercial CorridorsPrimary data on East New York storefront businesses presented on pg. 6-7, 10-11 was gathered along Fulton Street, Atlantic Avenue, Liberty Avenue, and Pitkin Avenue between Pennsylvania Avenue and Eldert Lane.
East New York Context AreaDemographic and employment data from pg. 16-17 represents the population within the East New York neighborhood study area.
Trade Area Retail leakage, surplus, and retail opportunity data on pg. 12 corresponds with the 0.75 mile trade area.
Car Ownership
41% East New York
Brooklyn
New York City
43%
45%
Commuting Patterns
8,869 Work in East New York, live elsewhere
868 Live & Work in East New York
30,278 Live in East New York, work elsewhere
8,869 30,278868Work Live
16 Neighborhood 360° Commercial District Needs Assessment

Local Residents’ Employment Jobs Located in East New York
Foreign-Born Population
39% East New York
Brooklyn
New York City
38%
37%
Median Age
30.4 East New York
Brooklyn
New York City
34.2
35.6
Race / Background East New York BK NYC
Under 5 Years
5–14 Years
15–24 Years
25–44 Years
45–64 Years
65+ Years
Population Age East New York BK NYC
9%
16%
18%
28%
22%
8%
7%
13%
14%
31%
24%
12%
7%
11%
14%
31%
25%
12%
Educational Attainment East New York BK NYC
Income
Median Household Income
$35,485 East New York
Brooklyn
New York City
$46,085
$52,259
Pop. Below Poverty Line
33% East New York
Brooklyn
New York City
23%
20%
Employment
Unemployment*
12.3% East New York
Brooklyn
New York City
10.9%
10.6%
Population in Labor Force
56% East New York
Brooklyn
New York City
62%
63%
DATA APPENDIX
Local Jobs and Employment
Sources: U.S. Census Bureau, 2009-2013 Amercian Survey and 2014 OntheMap Application.
Area Demographics
36%
24%
10%
9%
5%
5%
4%
3%
3%
1%
0%
*Note: The unemployment rate is 5.2% for Brooklyn and 5.1% for New York City as of June 2016 (NYSDOL); updated neighborhood-level data for East New York is not available.
Hispanic or Latino (of any race)
White alone
Black or African American alone
Asian alone
Native Hawaiian and Other Pacific Islander
American Indian and Alaska Native alone
Some other race alone
Two or more races
47%
3%
43%
5%
0%
0%
1%
1%
20%
36%
32%
11%
0%
0%
0%
1%
29%
33%
23%
13%
0%
0%
1%
1%
12th Grade or Less, No Diploma
High School Graduate
Some College, No Degree
Associate’s Degree
Bachelor’s Degree
Graduate or Professional Degree
29%
39%
15%
6%
8%
3%
22%
27%
14%
6%
19%
12%
20%
25%
15%
6%
20%
14%
17East New York
Educational Services, Health Care, Social Assistance
Retail Trade
Professional, Scientific, & Technical Services
Accommodation, Food Services, Arts, Entertainment
Transportation, Warehousing, Utilities
Other
Construction
Finance, Insurance, Real Estate
Manufacturing
Public Administration
Wholesale Trade
28%
12%
11%
10%
9%
8%
7%
5%
4%
4%
2%
Transportation, Warehousing, Utilities
Educational Services, Health Care, Social Assistance
Retail Trade
Other
Manufacturing
Accommodation, Food Services, Arts, Entertainment
Wholesale Trade
Construction
Finance, Insurance, Real Estate
Professional, Scientific, & Technical Services
Public Administration

Average Weekday Subway Ridership (2015)
11,014 Euclid Ave. station
9,251 Broadway Junction station
7,133 New Lots Ave. station
6,997 Pennsylvania Ave. station
5,073 Crescent St. station
MTA Annual Bus Ridership (2015)
13,226,183 B6
7,267,716 B15
3,205,785 B25
2,787,584 Q24
2,767,094 B83
BM5
BK15
BK6BK20
BK13BK25
BK14BK83Q
24Q
56
BK84
BK13
Q24
Q7
BK15BM
5BK13
Q56
BK
15
Q8
BK14
BK6BK84
LIRR
BK20BK83
BK25
BK
12
Q7
Q8
LIRR
Z
Z
J
J
L
L
A
A
C
C
3
East New York Transportation
Vehicular Traffic (2014)
44,988 Average daily vehicles at Atlantic Avenue between Pennsylvania Avenue and Norwood Avenue
71,980 Average daily vehicles at Jackie Robinson Parkway and Jamaica Avenue
39,773 Average daily vehicles at Conduit Boulevard and Atlantic Avenue
36,204 Average daily vehicles at Pennsylvania Avenue between Jamaica Avenue and Atlantic Avenue
30,155 Average daily vehicles at Pennsylvania Avenue between Atlantic Avenue and New Lots Avenue
Bus Routes
13 Total MTA Bus Routes
1 Express Bus Route BM5
East New York Transporation
Bus Routes Bicycle Lanes Long Island Rail Road (LIRR) NYC Subway
DATA APPENDIX
Sources: MTA 2015; NYC DOT May, 2016; NY State DOT, 2014 Annual Average Daily Traffic data.
A
A
J
J
C
C
Z
Z
L
3
3
18 Neighborhood 360° Commercial District Needs Assessment

Neighborhood 360 Fellowship Host Organization, awarded to the Cypress Hills Local Development Corporation, 2016.
House Call Business Retention Program for Small & Growing Businesses, Avenue NYC business retention grant of $35,000 awarded to the Local Development
Corporation of East New York, 2015.
Identity Design Action: East New York. We Mean Business, Unite to Stay, Neighborhood Challenge merchant organizing grant of $60,000 awarded to AIGA/NY
and the Local Development Corporation of East New York, 2015.
Retail Ready Events and Business Prospecting, Avenue NYC business attraction grant of $30,000 awarded to the Local Development Corporation of
East New York, 2014.
Retail Market Analysis/Retail Recruitment Campaign, Avenue NYC business attraction grant of $45,000 awarded to the Local Development Corporation of East
New York, 2013.
Pitkin Avenue Business Group, Avenue NYC merchant organizing grant of $30,000 awarded to the Cypress Hills Local Development Corporation, 2012.
East Brooklyn Ready for Business Campaign, Avenue NYC business attraction grant of $25,000 awarded to the Local Development Corporation of East New York, 2012.
Pitkin Avenue Business Group, Avenue NYC merchant organizing grant of $20,000 awarded to the Cypress Hills Local Development Corporation, 2011.
Lots Happenin’ Artists & Vendors Showcase, Avenue NYC placemaking grant of $20,000 awarded to the Cypress Hills Local Development Corporation, 2011.
Recent SBS Investments in the Neighborhood
Existing Plans & Studies Dinsmore-Chesnut Community Visioning Report, NYC Housing Preservation & Development, 2016 (in progress).
East New York Industrial Business Zone Plan, NYC Economic Development Corporation, 2016.
East New York Neighborhood Plan, NYC Department of City Planning, 2016.
East New York Neighborhood Rezoning Community Plan, Cypress Hills Local Development Corporation, 2015.
Highland Park - East New York Transportation Study, NYC Department of Transportation, 2015.
Sustainable Communities - East New York, NYC Department of City Planning, 2014.
SourcesESRI Infogroup, Inc. August 2016 ESRI Retail MarketPlace Profile.
Infogroup, Inc. 2016. From ReferenceUSA database.
Metropolitan Transportation Authority. 2015. Average Weekday Subway Ridership and Annual Bus Ridership.
NYS Department of Labor. June 2016. Unemployment Rate Rankings by County.
NYS Department of Transportation. 2014 Annual Average Daily Traffic, using Traffic Data Viewer.
NYC Department of Finance, Division of Tax Policy, using data from NYS Department of Taxation and Finance. Business sales are reported by tax year, which runs from March 1st to February 28th. Sales data are compiled from sales tax returns, which are rolled up by tax filer within a year, excluding returns with negative sales amounts. For each year, each tax filer is reported according to the address listed on their latest return. Large outliers were removed.
NYC Department of Small Business Services. Fiscal Year 2015. Business Improvement Districts Trends Report.
NYC Department of Transportation. May 2016. Bi-Annual Pedestrian Counts.
U.S. Census Bureau. 2014. OnTheMap Application. Longitudinal-Employer Household Dynamics Program (LEHD). Commuting Pattern data is representative of LEHD Origin-Destination Employment Statistics for the second quarter of 2014. LEHD data is based on different administrative sources, primarily Unemployment Insurance (UI) earnings data and the Quarterly Census of Employment and Wages (QCEW), and other censuses/surveys. In this context, only the highest paying job that is held over two consecutive quarters by an individual worker is counted toward worker flows into, out of, and within the context area.
U.S. Census Bureau. American Community Survey, 2013 American Community Survey 4-Year Estimates, using NYC Census FactFinder. East New York Census Tracts: 1146, 1150, 1152, 1156, 1158, 1160, 1162, 1164, 1166, 1168, 1170, 1172.01, 1172.02, 1192, 1194, 1176.02, 1178, 1190, 1196, 1144, 1174, 1176.01, 1198, 1184, 1200, 1142.01, 1186.
Photo Credits: ©Cypress Hills Local Development Corporation: Raquel Olivares, Viarlenis Acosta. Highland Park Community Development Corporation: Shakeena Smith. The Local Development Corporation of East New York: Joel Oporta. 3X3 Design. NYC Department of Parks and Recreation. NYC Economic Development Corporation.
19East New York

We would like to recognize and thank the following individuals and organizations for their contributions to the development of the East New York Commercial District Needs Assessment:
Brooklyn Borough President Eric AdamsNYC Council Member Rafael EspinalBrooklyn Community Boards 5 and 16Cypress Hills Local Development CorporationHighland Park Community Development Corporation The Local Development Corporation of East New York The Coalition for Community AdvancementLocal Initiatives Support Corporation (LISC)Atlantic Avenue, Fulton Street, Liberty Avenue, and Pitkin Avenue MerchantsEast New York Shoppers and Residents
The NYC Department of Small Business Services helps unlock economic potential and create economic security for all New Yorkers by connecting New Yorkers to good jobs, creating stronger businesses, and building a fairer economy in neighborhoods across the five boroughs.
ACKNOWLEDGMENTS
ABOUT SBS
nyc.gov/neighborhood360