ece/ces/ · and gerardo durand alcántara (mexico), leo hiemstra (netherlands), ann lisbet brathaug...
TRANSCRIPT

UNITED NATIONS ECONOMIC COMMISSION FOR EUROPE
Guide to Measuring
Global Production
UNITED NATIONS
NEW YORK AND GENEVA, 2015

NOTE The designations employed and the presentation of material in this publication do not imply the
expression of any opinion whatsoever on the part of the Secretariat of the United Nations concerning the legal status of any country, territory, city or area, or of its authorities, or concerning
delimitation of its frontier or boundaries. ECE/CES/38
Guide to Measuring Global Production
iii
Preface Ever increasing globalization has challenged our ability to fully understand the national and international macro-economic story for many decades. A feature of these developments has been the extended reach of international production and supply chains, whether these relate to the production of automobiles, bicycles, pharmaceuticals or elements of the information and communications technology industries.
Many global production chains consist of separate companies that specialize in producing particular components of a given final product. This is very evident in the automotive or bicycle industry. Often, in global production we find a whole series of affiliates, subsidiaries and branches of the same multinational enterprise linked together in a global production chain. It is this type of international corporate structure that the Guide to Measuring Global Production mainly concerns itself with.
Developments in global production have amplified international trade in intermediate and final goods and also in services inputs and products. This has occurred as a result of fragmentation of the production process across the globe. For example in 1978, China’s total imports and exports of USD 20.6 billion ranked 32nd among all nations and accounted for less than one per cent of global trade. In 2010, China’s total merchandise trade exceeded USD 3 trillion, 143 times the level of 1978. China now accounts for 10.4 per cent and 9.1 per cent of global exports and imports respectively, making it the world’s largest commodity exporter and the second largest commodity importer.
This Guide follows in the steps of the guide on the Impact of Globalization on National Accounts, albeit with a greater focus on the behaviour of multinational enterprises that engage in global production. The guidance and discussion are set in the context of the international accounting standards of the System of National Accounts 2008 and the sixth edition of the International Monetary Fund’s Balance of Payments and International Investment Position Manual. Effectively the Guide shines a light through the sometimes opaque structures of multinational enterprises through the following:
a) Providing a conceptual framework for understanding the structures, ownership and in particular the significance of intangibles such as patents and the related royalty service flows;
b) Providing practical guidance on an entire range of challenges when dealing with resident multinational enterprises who are members of global production and distribution chains;
c) Presenting concrete examples and best practices from different countries in producing statistics on global production;
d) Providing a discussion on recent initiatives such as the work of the Organisation for Economic Co-operation and Development and the World Trade Organization on measuring trade in value added;
e) Setting out a programme for future work and research.
The preparation of the Guide was a truly global effort with contributions from across the world from both international organizations and individual countries. The work leading to the Guide has been presented at many international meetings such as UNECE/Eurostat/OECD Group of Experts on National Accounts, OECD Working Party on National Accounts, IMF Committee on Balance of Payments Statistics, Intersecretariat Working Group on National Accounts, Advisory Expert Group on National Accounts, International Association for Research in Income and Wealth, Association de Comptabilité National (French National Accounting Association) and Expert Group on International Economic and Social Classifications. To everyone who contributed to the debate I would like to say thank you for your contributions.
Michael Connolly
Chair of the Task Force on Global Production


Guide to Measuring Global Production
v
Background In recent years, significant steps have been taken to improve international accounting standards of national accounts and balance of payments with respect to recording transactions of enterprises participating in global production. These steps include strengthening the harmonization of the System of National Accounts 2008 (2008 SNA) and International Monetary Fund’s (IMF) Balance of Payments and International Investment Position Manual, sixth edition (BPM6), recording imports and exports on a strict change of ownership basis and giving guidance on the treatment of merchanting.
These changes highlight the fact that capturing the activities of global production is a challenging aspect of macro-economic statistics. The transfer of ownership principle brings to the surface measurement issues that were previously concealed when compiling accounts according to the old guidelines. The new standards are brought in line with several aspects of globalization but also bear many measurement challenges. These challenges triggered new conceptual and measurement issues, which are addressed in this Guide to Measuring Global Production (hereafter “the Guide”). The purpose of the Guide is to support the implementation of the updated international standards in respect of the treatment of global production and thereby enhance international comparability.
Global production has evolved and now encompasses a broad range of business arrangements and organizational forms. Today, multinational enterprises (MNE) account for a large share of international trade between countries. National statistical institutes (NSI) need to keep track of the changing forms of global production and their effects on international trade relationships. It is important to identify best practices developed by countries and agree internationally on the practical guidelines needed to foster international comparability.
In 2007, the Conference of European Statisticians (CES) established a Group of Experts on the Impact of Globalization on National Accounts, which was jointly organized by United Nations Economic Commission for Europe (UNECE), Statistical Office of the European Union (Eurostat) and Organisation for Economic Co-operation and Development (OECD). In 2011, the findings of this expert group were published in a statistical guide called The Impact of Globalization on National Accounts (hereafter “the Globalization Guide”)1.
In the course of drafting the chapters of the Globalization Guide on “Goods sent abroad for processing” (Chapter 5), “Merchanting” (Chapter 6) “International transactions in intellectual property products” (Chapter 7) and “Measurement issues associated with administrative trade data and globalization” (Chapter 9), quite some attention was paid to the phenomenon of global manufacturing. At a late stage in the drafting process, it was decided that the issue of global manufacturing deserved a chapter of its own (Chapter 8). Although, in a short period of time, many aspects of global manufacturing were discussed and presented in this chapter, some important issues were not dealt with sufficiently and needed further attention.
The CES consultation of the Globalization Guide identified as a major priority for the future research agenda work on conceptual and practical aspects of global manufacturing arrangements in relation to the implementation of the new global standards, 2008 SNA and BPM6. In June 2011, the CES approved the Globalization Guide, including the proposed future work. Against this background, the CES Bureau asked Statistics Netherlands to conduct an in-depth review of global manufacturing.
The subsequent consultation at the CES Bureau and the UNECE Steering Group on National Accounts stressed the importance of the issues raised in the in-depth review. As a result the CES Bureau established a Task Force on Global Production (TFGP) to elaborate the conceptual and measurement issues related to global manufacturing. The Steering Group also pointed out that, rather than global manufacturing, the research should focus on global production arrangements more generally to recognize the importance of the production of services and transactions in intellectual property products (IPP). Furthermore, United Nations Statistics Division (UNSD) and OECD highlighted the support of the Inter Secretariat Working Group on National Accounts (ISWGNA) for further work on global production arrangements as part of the global effort to develop implementation guidance for the 2008 SNA.
The objectives of the TFGP were twofold. The first goal was to develop guidance on a number of unresolved conceptual issues arising from the 2008 SNA and BPM6 in relation to global production. The second goal was to develop further guidance on aspects of practical implementation. To do so the TFGP studied the existing practices of countries in relation to various types of global production arrangements.
1 UNECE, Eurostat and OECD: The Impact of Globalization on National Accounts (United Nations, New York and Geneva, 2011)
Guide to Measuring Global Production
vi
Conceptual issues requiring further guidance included the classification of so-called factoryless goods producers (FGP) and other units active in global production chains and the identification of ownership of assets, including IPPs, in global production chains and MNEs.
The work on practical issues focused on the measurement of IPPs in global production chains, recording of imports and exports on a change of ownership basis (following 2008 SNA and BPM6 principles) instead of a cross-border recording (as followed in merchandize trade statistics), prorating of the activities of multiterritory enterprises, treatment of quasi-transit trade and merchanting of services.
The work of the TFGP related to that of several other expert groups. As mentioned before, the TFGP followed up on the work of the Joint UNECE/Eurostat/OECD Group of Experts on the Impact of Globalization on National Accounts and the current Guide can be seen as a logical extension of the Globalization Guide. In addition, TFGP cooperated closely with the Eurostat Task Force on Goods Sent Abroad for Processing and benefitted substantially from experiences of the European Union member countries. Further, in this Guide, reference is made to the report of the European Central Bank (ECB)/Eurostat/OECD Task Force on Head Offices, Holding Companies and Special Purpose Entities. OECD and World Trade Organization (WTO) work on developing a database of Trade in Value Added (TiVA) indicators provides an example of an area of economic analysis, closely linked to recommendations of TFGP. The Guide benefited also from the findings of other international initiatives which are referenced in the respective chapters.

Guide to Measuring Global Production
vii
Acknowledgements This Guide is the result of the joint work of the members of the Task Force on Global Production, composed of Michael Connolly (Chair, Ireland), Mark de Haan (Editor, Netherlands), Patrick O’Hagan (Canada), Johanna Pakarinen, Eeva Hamunen and Paula Koistinen-Jokiniemi (Finland), Soli Peleg (Israel), Ludovico Bracci (Italy), Francisco Guillén Martín and Gerardo Durand Alcántara (Mexico), Leo Hiemstra (Netherlands), Ann Lisbet Brathaug (Norway), Monica Nelson Edberg, Michael Wolf and José Camacho (Sweden), Dylan Rassier and Brent Moulton (United States), Henk Nijmeijer, Matthias Ludwig and Pekka Alajääskö (Eurostat), Ralph Kozlow and Cornelia Hammer (IMF), Jennifer Ribarsky and Nadim Ahmad (OECD), Carsten Boldsen, Tihomira Dimova, Rami Peltola and Zeynep Orhun (UNECE), Herman Smith and Ronald Jansen (UNSD), Andreas Maurer and Joscelyn Magdeleine (WTO).
Each chapter was drafted by a lead author and subsequently reviewed by the Task Force members. The lead authors of the Guide were: Patrick O’Hagan (Canada), Michael Connolly (Ireland), Soli Peleg (Israel), Mark de Haan (Netherlands), Ann Lisbet Brathaug (Norway), Dylan Rassier (United States), Ralph Kozlow and Cornelia Hammer (IMF), Jennifer Ribarsky and Nadim Ahmad (OECD), Rami Peltola (UNECE), Andreas Maurer and Joscelyn Magdeleine (WTO). Their willingness to undergo the stress-testing of their work by the other members of the Task Force, by the editor and by various international meetings is a testament to their commitment and enthusiasm for this project.
Mark de Haan (Netherlands) was responsible for the substantive editing of the Guide and produced several of the issue papers to facilitate consultations at various fora. His work was absolutely vital and his contributions have questioned, informed and generally stimulated the discussions in the Task Force.
In addition to the Task Force members the following experts provided valuable inputs for the development of individual chapters: David Kelly (Ireland), Ziv Gorodisky (Israel), Stefano Menghinello (Italy), Gerard Eding (Netherlands), Sanjiv Mahajan, Simon Humphries and Robin Lynch (United Kingdom), Daniela Comini (Eurostat), Peter van de Ven and Fabienne Fortanier (OECD).
The Guide includes a number of useful examples and case studies by: Australia, Canada, China, China/Hong Kong SAR, Czech Republic, Finland, France, Hungary, Ireland, Israel, Italy, Kyrgyzstan, Mexico, Netherlands, New Zealand, Norway, Philippines, Republic of Korea, Sweden, United States, Eurostat, IMF and OECD.
The following countries and territories provided comments in the global consultations that were important for the finalization of the Guide: Albania, Angola, Armenia, Australia, Austria, Belarus, Belgium, Bulgaria, Canada, China/Hong Kong SAR, China/Macao SAR, Colombia, Croatia, Czech Republic, Denmark, Finland, France, Georgia, Germany, Hungary, Ireland, Israel, Italy, Japan, Kazakhstan, Kuwait, Latvia, Lithuania, Malaysia, Mexico, Montenegro, Montserrat, Netherlands, Norway, Peru, Philippines, Poland, Qatar, Republic of Moldova, Romania, Russian Federation, Singapore, Slovakia, Slovenia, State of Palestine, South Sudan, Sudan, Sweden, Switzerland, The former Yugoslav Republic of Macedonia, Turkey, United States, Uruguay, Venezuela, Zimbabwe, Afristat, Eurasian Economic Commission, Eurostat, IMF, OECD, United Nations Economic and Social Commission for Asia and the Pacific, United Nations Statistics Institute for Asia and the Pacific and WTO.
Lidia Bratanova, Director of the UNECE Statistical Division and Carsten Boldsen, Head of Economic Statistics, provided critical support through the life of the project. Tihomira Dimova and Rami Peltola, from the National Accounts’ team brought together the diverse contributions to the Guide, organized the meetings and the international consultations, and assisted in finalizing the Guide. Oleksandr Svirchevskyy, set up and maintained the wiki platform of the Task Force.


Contents
ix
Contents Preface ......................................................................................................................................................... iii
Background .................................................................................................................................................. v
Acknowledgements ................................................................................................................................... vii
Contents ....................................................................................................................................................... ix
List of abbreviations and acronyms ........................................................................................................ xi
Chapter 1 Introduction .............................................................................................................................. 1
Global production ............................................................................................................................................................................................ 1 Structure of the Guide .................................................................................................................................................................................... 1 Global supply, value and production chains ......................................................................................................................................... 2 Organization of production arrangements ........................................................................................................................................... 5
Chapter 2 Typology of global production arrangements .................................................................... 7
Introduction ........................................................................................................................................................................................................ 7 Typology of global production arrangements ..................................................................................................................................... 7 Case A: Transformation of materials owned by a domestic principal ........................................................................................ 8 Case B: Merchanting .................................................................................................................................................................................... 13 Case C: Factoryless goods producers ................................................................................................................................................... 14 Services related global production arrangements .......................................................................................................................... 18 Case D: Fragmenting part of the production of services, IPPs ................................................................................................... 19 Case E: Fragmenting part of the production of services, excluding IPPs .............................................................................. 19 Case F: Subcontracting production of services................................................................................................................................. 19 An alternative view on factoryless goods producers ..................................................................................................................... 20 Conclusions and recommendations ...................................................................................................................................................... 26
Chapter 3 Principles of economic ownership inside the multinational enterprise ........................ 29
Introduction ..................................................................................................................................................................................................... 29 Guidance in the international statistical standards ......................................................................................................................... 29 Business accounting practice ................................................................................................................................................................... 34 A selection of complex cases ................................................................................................................................................................... 37 Conclusions and recommendations ...................................................................................................................................................... 41
Chapter 4 Ownership of intellectual property products inside global production ....................... 43
Introduction ..................................................................................................................................................................................................... 43 A brief overview of existing guidance .................................................................................................................................................. 43 Determining stocks and flows of IPPs: a review of data sources .............................................................................................. 44 Determining the economic ownership of IPPs ................................................................................................................................. 48 Conclusions and recommendations ...................................................................................................................................................... 54
Chapter 5 Measuring global production: data sources and compilation challenges .................... 55
Introduction ..................................................................................................................................................................................................... 55 Goods sent abroad for processing (Case A) ...................................................................................................................................... 56 Merchanting (Case B) .................................................................................................................................................................................. 72 Factoryless goods manufacturing (Case C) ........................................................................................................................................ 78 A review of data sources ............................................................................................................................................................................ 82
Contents
x
Conclusions and recommendations ...................................................................................................................................................... 84
Chapter 6 Large and complex enterprises units ................................................................................. 87
Introduction ..................................................................................................................................................................................................... 87 Background ..................................................................................................................................................................................................... 87 Operation of the large and complex enterprises units ................................................................................................................. 89 Conclusions and recommendations .................................................................................................................................................... 100 Annex 6.1 – Questionnaire on the operation of large and complex cases units ............................................................. 102
Chapter 7 Measuring trade in value added ....................................................................................... 105
Introduction ................................................................................................................................................................................................... 105 Key principles of TiVA ............................................................................................................................................................................... 106 The need for TiVA ....................................................................................................................................................................................... 106 Early evidence from the OECD-WTO database .............................................................................................................................. 108 Estimating trade in value added ........................................................................................................................................................... 114 Data requirements of global input-output tables ......................................................................................................................... 115 Input-output related accounting issues ............................................................................................................................................ 116 Beyond TiVA .................................................................................................................................................................................................. 118
Chapter 8 Multiterritory enterprises ................................................................................................... 123
Introduction ................................................................................................................................................................................................... 123 Conceptual background ........................................................................................................................................................................... 123 Case studies ................................................................................................................................................................................................... 125 Challenges with regard to source statistics ..................................................................................................................................... 135 Recommendations ...................................................................................................................................................................................... 136
Chapter 9 Measurement issues associated with quasi-transit trade and similar phenomena ... 139
Introduction ................................................................................................................................................................................................... 139 Background ................................................................................................................................................................................................... 140 Application of BPM6 and 2008 SNA to quasi-transit trade ...................................................................................................... 141 Recording of related phenomena ........................................................................................................................................................ 144 Conclusions and recommendations .................................................................................................................................................... 146
Chapter 10 Merchanting of services ................................................................................................... 147
Introduction ................................................................................................................................................................................................... 147 Related concepts in existing international guidelines ................................................................................................................. 147 Exploring the concepts ............................................................................................................................................................................. 148 Recording merchanting of services on a gross or a net basis ................................................................................................. 151 Concluding remarks ................................................................................................................................................................................... 153
Chapter 11 Conclusions and recommendations for future work ................................................... 155
Introduction ................................................................................................................................................................................................... 155 Key conclusions and recommendations ............................................................................................................................................ 155 Organization of future work ................................................................................................................................................................... 158 Proposed list of action points addressing future research ........................................................................................................ 159

List of abbreviations and acronyms
xi
List of abbreviations and acronyms AEDS Automated Export Data Documentation System (Philippines)
ASIES Annual Survey of Imports and Exports of Services (Hong Kong)
APEC Asia-Pacific Economic Cooperation
ARTS Annual Retail Trade Survey (U.S.)
AWTS Annual Wholesale Trade Survey (U.S.)
BE-10 Benchmark Survey of U.S Direct Investment Abroad
BE-10A Benchmark Survey of U.S. Direct Investment Abroad for U.S. parents that are not banks
BE-120 Benchmark Survey of Transactions in Selected Services and Intellectual Property Products with Foreign Persons (U.S.)
BEA Bureau of Economic Analysis (U.S.)
BEC Classification by Broad Economic Categories
BERD Business expenditure on R&D
BEPS Base Erosion and Profit Shifting
BOC Bureau of Customs (Philippines)
BOP Balance of payments
BPM5 Balance of Payments Manual, fifth edition
BPM6 Balance of Payments and International Investment Position Manual, sixth edition
BRICS Brazil, Russian Federation, India, China and South Africa
BSP Central Bank of the Philippines
CES Conference of European Statisticians
CIF Cost, insurance and freight
CIS Commonwealth of Independent States
CIS-STAT Interstate Statistical Committee of the Commonwealth of Independent States
COMTRADE UN Commodity Trade Statistics databse (a repository of official trade statistics and relevant analytical tables)
COS Company Organization Survey (U.S.)
CPA Classification of Products by Activities
CPC Central Product Classification
CSO Central statistics (or statistical) office
DA Designated Authorities (Timor Sea)
DI Direct investment
EA Euro area
EBOPS Extended Balance of Payments Services Classification
EC European Commission
ECB European Central Bank
ED Export Declarations (Philippines)
EGR EuroGroups Register
EIN Single employer identification number (U.S.)
List of abbreviations and acronyms
xii
EMEA European, Middle Eastern and African
ESA European System of National and Regional Accounts
ESS European Statistical System
ESSnet European Statistical System network
EU European Union
EUR Euro (currency)
FATS Foreign Affiliates Statistics
FDI Foreign direct investment
FDIR Foreign direct investment relationship
FEIS International Transactions Reporting System in the Republic of Korea
FGP Factoryless goods producer
FOB Free on board
FRS Financial Reporting Standard
GAAP Generally Accepted Accounting Principles
GDP Gross domestic product
GFP Goods for processing
GNI Gross national income
GTAP Global Trade Analysis Project
GVC Global value chain
HS Harmonized System
IAC Inter-Agency Committee (Philippines)
IAC-TRS Inter-Agency Committee on Trade Statistics (Philippines)
IAS International Accounting Standards
IASB International Accounting Standards Board
ICT Information and communication technology
ID Identification
IDC Integrated data collection
IDE-JETRO Institute of Developing Economies - Japan External Trade Organization
IEIRD Import Entry and Internal Revenue Declaration (Philippines)
IFRS International Financial Reporting Standards
IMMEX Manufacturing, Maquila and Export Service Industry
IMF International Monetary Fund
IMTS International Merchandise Trade Statistics
INEGI National Institute of Statistics and Geography (Mexico)
IO Input-output
IPP Intellectual property product
ISIC International Standard Industrial Classification of All Economic Activities
ISWGNA Inter-Secretariat Working Group on National Accounts
ITRS international transactions reporting system
JPDA Joint Petroleum Development Area (Timor Sea)

List of abbreviations and acronyms
xiii
LCU Large and complex enterprises units
MEETS EU framework on Modernization of European Enterprise and Trade Statistics
MNE Multinational enterprise
MSITS Manual on Statistics of International Trade in Services
NACE Statistical Classification of Economic Activities in the European Community (French acronym)
NEDA National Economic and Development Authority (Philippines)
n.i.e. Not included elsewhere
NSCB National Statistical Coordination Board (Philippines)
NSI National statistical institute
NSC National Statistical Committee of the Kyrgyz Republic
OECD Organisation for Economic Co-operation and Development
ONS Office for National Statistics (UK)
OP Outward processing
P&A Processing and assembling
PIM Processing with imported materials
PPI Producer price index
PPIM Producer Price Index Manual
PRODCOM Classification of manufactured goods in the European Community (French acronym)
PSCC Philippine Standard Commodity Classification
QSMTA Quarterly Survey of Merchanting and Other Trading Activities (Hong Kong)
R&D Research and development
ROW Rest of the world
SAR Special Administrative Region
SEIPI Semi-conductors and Electronics Industries of the Philippines
SITC Standard International Trade Classification
SITCS International trade in commercial services surveys
SITS Statistics of International Trade in Services
SNA System of National Accounts
SPE Special purpose entity
TFGP Task Force on Global Production
TEC Trade by enterprise characteristics
TiVA Trade in value added
UNECE United Nations Economic Commission for Europe
UNESCO United Nations Educational, Scientific and Cultural Organization
UNSD United Nations Statistics Division
USD United States Dollar
VAR Value added ratio
VAT Value added tax
WIOD World Input-Output Database
WTO World Trade Organization
List of abbreviations and acronyms
xiv
XML Extended mark-up language
XBRL Extended business reporting language
Introduction
1
Chapter 1 Introduction Global production 1.1 Globalization has created new opportunities and competitive challenges driving producers to seek more efficient ways to manufacture their products. It has become increasingly common for producers seeking more efficient means of production to divide the traditional vertically integrated production model into stages or tasks (known as fragments), which allows producers to outsource part of their production process. When the resulting production arrangement is divided across different countries the measurement challenges facing statisticians increase dramatically.
1.2 Several economic driving forces have led to fragmentation of production assigned to specialized establishments, both foreign and domestic. Improvements in information technology have allowed firms to relocate production to new and often distant locations. International cost differences, such as lower relative wage costs and lower trade and transport costs, improved logistics, differences in taxation, improved intellectual property rights protection and contract enforcement have facilitated the creation of global supply chains and global value chains.2
1.3 The latest revisions to the international statistical standards, the System of National Accounts 2008 (2008 SNA) and the Balance of Payment and International Investment Position Manual, sixth edition (BPM6), have introduced many changes in order to better reflect aspects of globalization. The key purpose of this Guide to Measuring Global Production (hereafter the Guide) is strengthening the practical and conceptual guidance given to national accountants and balance of payments compilers in the area of global production. It also addresses some new globalization phenomena and the associated conceptual challenges as well as emerging data needs for explaining the macro-economic consequences of globalized production processes.
1.4 The next section provides an overview of the guide. The remaining sections of this chapter focus on the concepts of global supply, value and production chains and review how enterprises organize their
2 United States (U.S.) International Trade Commission “Economic Effects of U.S. Import Restraints, Special Topic: Global Supply Chains,” August 2011.
production arrangements. This discussion is the starting point for the presentation of the typology of global production arrangements in Chapter 2.
Structure of the Guide 1.5 The purpose of the Guide is to help the compilers of national accounts and balance of payments to understand the impact of global production on related statistics. It aims to provide:
• Clarity on several unresolved conceptual issues related to global production;
• Support on the measurement aspects of global production.
1.6 The Guide draws as much as possible on national experiences, which are highlighted in the various country case studies presented throughout the different chapters. Chapters 2-4 mainly deal with conceptual issues while the subsequent chapters focus more on the measurement challenges.
1.7 A typology of global production arrangements is presented in Chapter 2. This typology is helpful in identifying how much explicit coordination takes place, which can be an indication of how much control (and the associated risk) a lead enterprise has over the production process. This information is required for national accountants and balance of payments compilers to understand the nature of transactions taking place inside global value chains. This chapter also contains a discussion on factoryless goods producers (FGP), i.e. those companies that have outsourced all aspects of material transformation but own the intellectual property products (IPP) concerned. Accounting for FGPs poses specific accounting problems which are related to their economic classification and the treatment of international transactions in which they are engaged.
1.8 The principles of economic ownership within global production arrangements are discussed in Chapter 3. One specific issue dealt with in this chapter is how to best approximate the international transactions occurring inside an multinational enterprise (MNE). This is particularly relevant given that ownership relations may imply that affiliated companies do not always act autonomously.
1.9 Chapter 4 extends the discussions on economic ownership to the ownership of IPPs and related transactions inside global value chains and MNEs. This
Introduction
2
chapter presents a decision tree and guidance on defining economic ownership of IPPs and related transactions within various global production arrangements.
1.10 Chapter 5 elaborates on the measurement challenges of selected types of global production arrangements: goods sent abroad for processing, merchanting and factoryless goods production. The chapter systematically reviews the data items needed to account for the components of the production accounts and international trade flows of these three global production arrangements. It also reviews possible data sources that may support their recording. Chapter 5 illustrates that measuring global production can be highly data and resource demanding. The statistical offices that managed to set up satisfactory data collection systems have typically done so through dedicated surveys e.g. for goods sent for processing or merchanting related activities. Present experience shows that existing information from registers, business accounts, big data, etc. does not always provide the right answers, which implies that additional surveys are still needed. Sharing data between national statistical institutes (NSI) of individual countries may be helpful in obtaining a clear view on global production arrangements.
1.11 In recent years, several NSIs have established so-called large and complex enterprises units (LCU) to collect data on MNEs and other complex enterprises and analyze the consistency of these data. Their experience with observing and measuring global production is presented in Chapter 6. Based on the responses of a survey obtained from eight NSIs, the chapter examines the similarities and differences in the operation of LCUs. These units appear to play a crucial role in dealing with some of the most complex aspects of global production.
1.12 An area of economic analysis, closely related to global production, is the measurement of global value chains and the value added content of international trade. The discussion o.n trade in valued added is presented in Chapter 7. This chapter also discusses issues related to input-output tabulations and modelling. The trade in value added analysis helps to detail genuine trade dependencies of a country in terms of value added or job creation, a picture that remains largely concealed when looking at gross import or export flows. This analysis will tremendously benefit from the comprehensively, correctly recorded global production arrangements in the national accounts and balance of payments in such a way that asymmetries in recording international transactions from one country to another are eliminated as far as possible.
1.13 Measurement issues related to recording of multiterritory enterprises (not the same as multinational enterprises) in national and international accounts are introduced in Chapter 8. Based on a range of real life examples, this chapter provides practical guidance on
how to assign the economic activities of multiterritory enterprises, and similar kinds of enterprises, to individual economic territories.
1.14 Chapter 9 discusses statistical measurement issues associated with so-called quasi-transit trade and similar phenomena. Quasi-transit trade occurs when goods enter an economy and are declared as imports for customs purposes at values that differ from those that are declared when the goods leave the same economy, without the transit economy having acquired ownership of the good. This phenomenon is most relevant in customs unions.
1.15 Chapter 10 extends the notion of merchanting (of goods) to the domain of services and investigates the role of arrangers or intermediaries of international service transactions. This chapter follows up on previous, but rather brief, discussions in BPM6, Manual on Statistics of International Trade in Services (MSITS) 2010 and the Guide on the Impact of Globalization on National Accounts (hereafter Globalization Guide). The conclusions in this chapter are tentative as the obtained evidence on the international services arrangers is still rather limited; however, a number of areas for further research are proposed.
1.16 Each chapter of the Guide ends up with concrete recommendations in relation to the reviewed aspect of global production. Chapter 11 summarizes the main conclusions, recommendations and proposals for future research identified in the previous chapters of the Guide.
Global supply, value and production chains 1.17 The terms global supply chain, global value chain and global production chain are used when discussing globalization and the fragmenting of production across countries. Sometimes they are used interchangeably, but they are not exactly the same concepts. This section discusses these concepts.
1.18 A supply chain is a system of organization, technology, activities, information and resources involved in moving a good or service from supplier to customer. A supply chain can be within an enterprise, between enterprises in a local economy, or among a group of countries. The supply chain is a network where the activities involved can be grouped using the traditional broad stages of production from upstream research and development (R&D) and design, through manufacturing, to downstream logistics, marketing and sales. The complexity of the supply chain and the business relationship between the various stages can vary by industry and enterprise. A global supply chain consists of a worldwide network of these activities.
1.19 Figure 1.1 provides a simple illustration of fragmented production. It shows a schematic overview of the different stages in the production process of a

Introduction
3
Figure 1.1 Illustration of fragmented production
Source: United States (U.S.) International Trade Commission compilation
good, from its design and processing of raw materials up to the final stages related to retail and customer service. Supply chain management may cover the whole chain as reflected in the figure, or specific parts of it. Similarly, some stages of the chain may be controlled by a parent company whose affiliates are responsible for certain other stages in the supply chain.
1.20 In the R&D and design stage an intangible asset is created that is later used as an input in making the good. The R&D and design can be used by the same enterprise to produce the good on its own account or can be provided to a supplier that produces the good.
1.21 Supply management may consist of several specific functions such as quality control, marketing, logistics and financial services, which are highlighted in Figure 1.1. Although this figure only shows financial services being provided at the R&D/design stage, in reality financial services can be provided at several stages in the supply chain. For example, leasing and consumer credits can be provided at the retail/delivery stage.
1.22 A value chain refers to the value added activities required to bring a good or service from its conception, design, production, marketing, distribution
and support to final customers.3 It is the value added to the good or service at each stage of the network. Similar to the supply chain, the complexity of the value chain and the business relationship between the various stages can vary by industry and enterprise. A value chain can be between enterprises in a local economy or span enterprises across a group of countries.
1.23 One may conclude that global value chains are particularly the object of analysis in the context of global production. The proper identification of value added in each step of the chain is fundamental to national accounting, particularly when the chain overlaps several countries. Similarly, the concept of global value chain corresponds closely to the analysis of trade in value added as presented in Chapter 7.
1.24 A production chain refers to linkages within or among groups of enterprises for producing specific goods or services. It represents how lead enterprises arrange their particular network of suppliers to produce a given good or service. The lead enterprise exerts certain control over the production process; its level
3 Asian-Pacific Economic Cooperation (APEC) Policy Support Unit, issues paper no.1 “Concepts and Trends in Global Supply, Global Value and Global Production Chains” May 2012

Introduction
4
Figure 1.2 Global value/supply/production chains
Source: APEC Policy Support Unit, issues paper no.1 “Concepts and Trends in Global Supply, Global Value and Global Production Chains” *Traditionally, conception, design and product development are controlled by the lead firm; nowadays, some of these activities are outsourced to other firms. **The players in global production/supply/value chain include domestic and foreign firms. depends on the kind of global production arrangement being followed. Control may relate to access to key resources and managing key activities, such as product design, international brands and access to final customers.4 A production chain becomes global when the linkages fragment across countries.
1.25 Figure 1.2 illustrates the network structure of global supply chains, global value chains and global production chains. The structure of global supply and value chains are similar. However, the focus of global supply chains is on the movement of goods and services through the various stages of the network whereas the focus of global value chains is on the creation of value in the various places (or countries) in the network. Global production chains focus on the production of goods and services and typically end at the point after the goods and services have been produced for the lead enterprise.
1.26 Figure 1.2 shows the interaction of the lead firm or enterprise, the suppliers, the distribution outlets and the consumer. The lead firm, the principal, normally exerts some amount of control and contributes market knowledge, intellectual property, system integration and cost management skills. The lead firm’s brand name usually reflects its reputation for quality, innovation and customer service.
1.27 Multiple levels of suppliers may be needed by the lead firm for producing its specific goods or services. The lead firm works directly with the first-tier supplier. The first-tier supplier generally provides design and innovation capabilities. The second-tier supplier is an entity that supplies directly to the first-tier supplier 4 APEC, see footnote 3.
without supplying directly to the lead firm. Raw materials are generally supplied by the end-tier supplier.
1.28 Figure 1.2 also highlights that global production arrangements constitute much more than simply a sequence of interlinked markets. The information streams required to connect the principal (the lead firms coordinating the tasks) and suppliers is vital. Technology, knowledge management and the exchange of intellectual property play a vital role in global production chains.
1.29 As illustrated in the above presented figures both the supply and value chain capture the stage of distribution and marketing, while the production chain ends just before this stage. Many of the global production arrangements discussed in this Guide are also related to distribution activities. This is one of the reasons why the scope of the task force´s work was extended from global manufacturing to cover the broader set of activities associated with global production.
1.30 One particular case of global production discussed in detail in this Guide is merchanting. Under this arrangement an entity buys products from a supplier abroad and resells it to a customer abroad, without further transformation of the products. Chapters 2 and 3 explain that merchanting can exist in close connection to other forms of global production. In other words, generally speaking the scope of the Guide corresponds better with that of global supply and value chains than to production chains only.
Introduction
5
Organization of production arrangements 1.31 The increased fragmentation of production and trade through supply chains is in large part due to enterprises’ aim to focus on their core competencies and competitive advantages. The focus may be on innovation and product strategy, marketing and the highest value added segments of manufacturing and services, therefore reducing the direct ownership over “non-core” tasks such as ancillary services and volume production.
1.32 Outsourcing refers to service or manufacturing activities that are contracted out to unrelated firms located either in the home country or abroad and is generally meant to be applicable to those activities that were once in-house functions. In the case of factoryless goods production, the term outsourcing may be used more broadly to refer to activities that are contracted out but were never part of in-house functions. Offshoring originally referred to service or manufacturing activities within the supply chain that are carried out by affiliates located in foreign countries. However, offshoring is now commonly used more broadly to refer to activities done abroad through both foreign affiliates and independent contractors. The provision of service or manufacturing activities by a domestic firm to a firm abroad is known as inshoring.5
1.33 Enterprises are continually evaluating which tasks to perform in-house, which tasks to outsource, and if and where offshoring may be advantageous. Whether an enterprise chooses an affiliated or independent firm is partly determined by the nature and maturity of the product. If the product is new and embodies substantial intellectual property, enterprises may be less likely to offshore tasks, or to hand over tasks to unaffiliated companies. This may be due to the risk that intermediate goods may not be made to exact specifications but may also reflect concerns about enforcement of contractors or property rights abroad.6 Once a product is more standardized, firms are more likely both to offshore tasks and to do so using independent contractors.
1.34 Gereffi et al. (2005) formalize this in three dimensions that help understand how production arrangements are organized and which tasks are likely to be performed in-house and which tasks are likely to be outsourced.7 These include the complexity of
5 U.S. International Trade Commission “Economic Effects of U.S. Import Restraints, Special Topic: Global Supply Chains”, August 2011.
6 U.S. International Trade Commission
7 Gereffi, G., J. Humphrey & T. Sturgeon (2005) “The governance of global value chains”, Review of International Political Economy, 12:1.
information and knowledge required for the transactions (product and process specifications), the degree to which this complexity can be mitigated through codification and the extent to which suppliers have the necessary capabilities to meet buyers’ requirements.
1.35 Depending on the exact scores on these dimensions, different types of business relationships may arise among participants in a value chain. These go beyond the traditionally distinguished “market” (i.e. arm’s length transactions) and “hierarchy” (i.e. direct ownership) (Williamson, 1975),8 and may involve a wide variety of governance types ranging from the lead enterprise exerting little control over the production process to the lead enterprise exerting (nearly) full control.
1.36 An important example of such a governance type category is captive production. In this situation an unaffiliated contract manufacturer is engaged by a single principal and is entirely dependent on this relationship to obtain work for its plant or plants. In such scenarios, control exerted by a principal on a captive unaffiliated contract manufacturer can be practically the same as the control exerted by the MNE parent on its affiliate in a direct investment relationship, which means that the difference between an affiliate and an unaffiliated contract manufacturer can be very unclear.
1.37 This chapter is a brief introduction into global supply, value and production chains, and into general features of global production arrangements. Chapter 2 continues with the presentation of a typology of different global production arrangements. The typology provides an indication of the amount of coordination and control within a production arrangement and helps understand the kinds of transactions taking place within the scope of global production. Many of the specific characteristics highlighted in this typology and the accompanying examples are discussed in greater detail in subsequent chapters. As such, the typology discussion in Chapter 2 could be used as a roadmap that may guide readers to issues of specific interest as presented in the subsequent chapters of the Guide.
8 Williamson, O. (1975) Markets and Hierarchies, Analysis and Antitrust Implications, New York: Free Press.


Typology of Global Production Arrangements
7
Chapter 2 Typology of global production arrangementsIntroduction
This chapter provides a typology of global production arrangements. The typology supports the proper breakdown of economic activities along the global supply chain on a country-by-country basis. Guidance on the recording of each type of global production arrangement is provided in the chapters that follow. This typology can be helpful in identifying how much explicit coordination takes place, which can be an indication of how much control (and the associated risk) a lead enterprise has over the production process. This information is required for national accountants and balance of payments compilers to understand the nature of transactions taking place inside global value chains. For each product or asset flow observed inside global value chains, it must be decided whether a change of economic ownership takes place. The principles of economic ownership are further explored in Chapters 3 and 4. This chapter discusses the various kinds of economic relationships that may exist between a principal, or leading enterprise, and other units, such as producers on a fee or contract basis (referred to as contractors), participating in the global value chain.
The typology aims to strengthen international comparability by providing guidance to national compilers on the proper breakdown of the activities along the global production chain. However, the analysis of real-life cases may be blurred by different arrangements that may be brought together into one global value chain. At the same time, multinational enterprises (MNE) may rearrange their global production from one day to another. The various country case studies in this Guide illustrate real life complexities.
The following section presents the typology of global production arrangements, including a sequence of numerical examples to illustrate their main characteristics in accounting terms. The next section (An alternative view on factoryless goods producers) focuses on one specific global production arrangement, namely those managed by so-called factoryless goods producers (FGP). The nature of FGPs in terms of their economic activity classification, and in terms of their role in the global value chain, requires further examination as the current accounting standards (cf. International Standard Industrial Classification of All Economic Activities Revision 4 (ISIC Rev.4), System of National
Accounts 2008 (2008 SNA), Balance of Payment and International Investment Position Manual, sixth edition (BPM6)) do not provide specific guidance with regard to this category of global producers. This section suggests a treatment of FGPs that should be further tested with real life examples in order to inform future revisions of the accounting standards. The last section winds up with conclusions and recommendations.
The typology is established on the basis of examined actual cases. It is likely that ongoing research will lead to a further expansion of the arrangements presented in the typology. For example, agricultural, fishery and mining production in the developing world have also become part of the operations of MNEs. There are cases where land is simply leased out for purposes of agricultural production and the entire harvest is directly shipped to the country holding the lease. Similarly, small island states have been issuing fishing licenses to foreign vessels, which fish in their waters but sell fish in international markets as frozen or processed. The accounting aspects of such arrangements have not been examined by the Task Force on Global Production (TFGP). There are also new arrangements in the area of services that are expected to evolve in the future and will benefit from further examination.
Typology of global production arrangements
Global production arrangements may be set up and managed in various ways. Sometimes the chain follows the organizational structure of a MNE. Alternatively the chain may include a number of unaffiliated companies. A principal is usually the organizing and controlling company of such arrangements. The unaffiliated contractors may become quite dependent on their relationship with the principal. Under such circumstances the difference between an affiliated and an unaffiliated contractor can be very unclear. The control exerted by a principal on a captive unaffiliated contractor can be practically the same as the control exerted by the MNE parent in a direct investment relationship on its affiliate. One difference is perhaps that unaffiliated contractors may supply their output to more than one principal.
Two key features of a dependant relationship are that the principal (a) controls the specifications of

Typology of Global Production Arrangements
8
the output of the contractor and (b) usually plays a leading role in intellectual property product (IPP) management. Global production arrangements constitute much more than simply a sequence of interlinked markets. As illustrated in Figure 1.2, production chains are importantly characterized by the information streams required to connect principals, the lead firms coordinating the tasks and suppliers. This knowledge aspect of global production chains clearly has a linkage to management of the supply chain and exchange of intellectual property. The principles of ownership and management of intellectual property are further discussed in Chapter 4.
This section will focus on several types of global production arrangements where a lead enterprise arranges their particular network of suppliers to produce a given good or service. The typology discusses the different types of global value chains and translates these into the current interpretation of the international standards. In reading this section it will become clear that further consideration may be necessary on some aspects of the various global production arrangements and later chapters will address these issues.
The main objectives of developing this typology are the following. Firstly, it supports the proper breakdown of economic activities along the global production process on a country-by-country basis. Secondly, it helps in assigning the kind of economic activity of a principal (an enterprise that exerts a certain level of control over the production process) and a supplier (contractors, goods producers and other participating units in the global production process). Thirdly, the typology assists in identifying the economic ownership of inputs, outputs and intellectual property for the activities along the production process. Fourthly, the typology helps identify the type of output (goods, trade margins, services) of the participating units in the global production arrangement.
To better understand the various types of global production arrangements it is useful to look at the entire production process from the viewpoint of the domestic entity. This could be the principal, a contract producer or any other provider inside the global value chain. For national accounting purposes, it is important to identify the economic activity of each of the participating units in the production chain as well as the value added of each unit. The typology presented in this section uses the ISIC Rev.4 as the industry classification system that groups producing units into detailed industries based on similarities in the economic activity, taking into account the characteristics of outputs, inputs, process and technology of production.
To better understand the nature of a production activity and the output it generates, e.g. a good or service, it is also important to identify each entity’s involvement in terms of ownership of the material inputs, intellectual property and outputs at each stage of the production process.
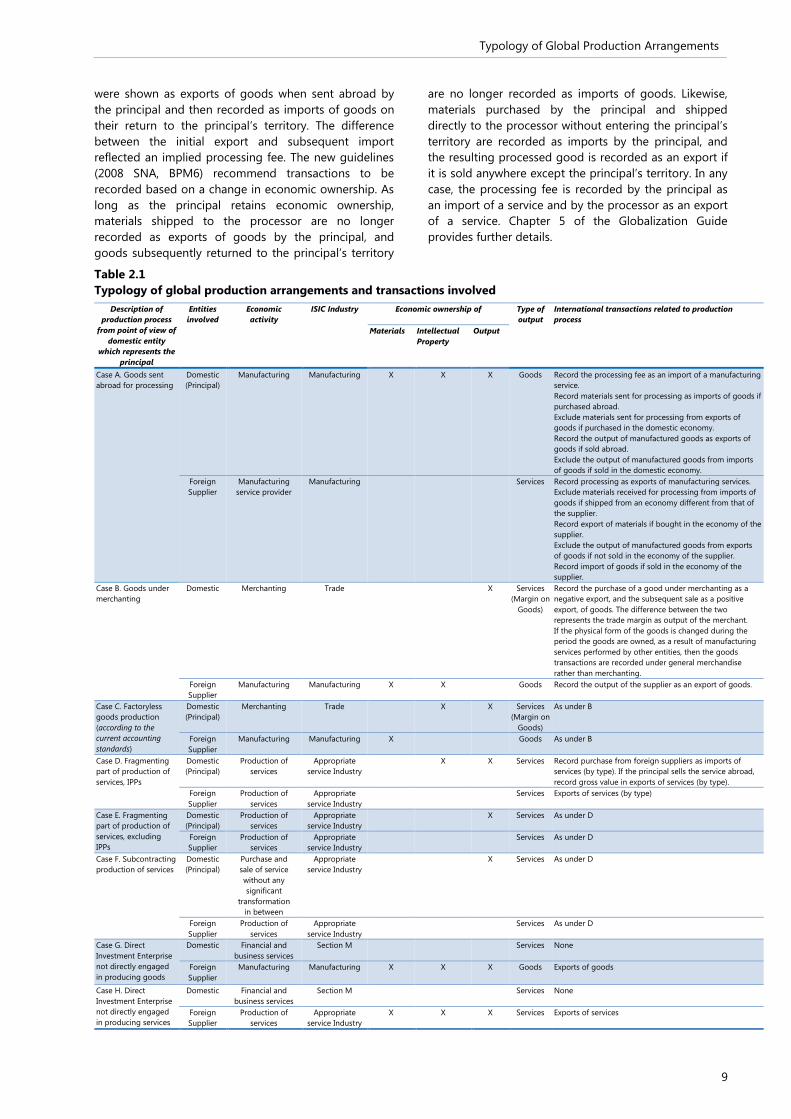
Table 2.1 describes global production arrangements for producing goods and services from the viewpoint of the domestic entity and reflects the various combinations of economic ownership of the inputs and outputs in the production process. To address the various boundary issues of global production arrangements, all combinations of economic ownership are discussed. The table also addresses cases where no lead enterprise can be identified.
The table indicates the economic engagement between the principal and the supplier in terms of production and does not necessarily designate direct investment relationships. In other words, the supplier may, or may not, be owned by the principal. The table assumes that economic ownership of the materials, the intellectual property and output can be assigned to either the principal or the supplier. In practice this may be a difficult task. Chapters 3 and 4 of this guide address the principles of economic ownership of materials and intellectual property, respectively.
The identification of the economic ownership of inputs, outputs and intellectual property is not only important for determining the type of economic activity in terms of industry classification of the entities engaged in global production but also for the type of output the unit produces (e.g. a trade margin or a manufactured product) and how the international trade flows related to global production should be recorded.
The following subsections provide simple examples of the global production arrangements presented in Table 2.1. All cases describe global production arrangements where the principal is located in one country and the supplier in another country. All cases are illustrated with the help of an “athletics shoe manufacturing” example.
Case A: Transformation of materials owned by a domestic principal
Under this global production arrangement the domestic principal owns the materials and purchases manufacturing services from a foreign supplier to transform the physical inputs into another product. Over the course of the transformation process, the principal maintains economic ownership of the processed raw materials or semi-manufactured goods as well as the goods after processing. This arrangement is also referred to as “goods sent abroad for processing” (2008 SNA) or “manufacturing services on physical inputs owned by others” (BPM6).
Between the System of National Accounts 1993 (1993 SNA) and the 2008 SNA (and Balance of Payments Manual, fifth edition (BPM5) and BPM6) there has been a fundamental change in the treatment of goods for processing without a change of ownership. According to the former standards (1993 SNA, BPM5), transactions had to be recorded on a cross-border basis, which resembled an imputed change of ownership. Materials
Typology of Global Production Arrangements
9
were shown as exports of goods when sent abroad by the principal and then recorded as imports of goods on their return to the principal’s territory. The difference between the initial export and subsequent import reflected an implied processing fee. The new guidelines (2008 SNA, BPM6) recommend transactions to be recorded based on a change in economic ownership. As long as the principal retains economic ownership, materials shipped to the processor are no longer recorded as exports of goods by the principal, and goods subsequently returned to the principal’s territory
are no longer recorded as imports of goods. Likewise, materials purchased by the principal and shipped directly to the processor without entering the principal’s territory are recorded as imports by the principal, and the resulting processed good is recorded as an export if it is sold anywhere except the principal’s territory. In any case, the processing fee is recorded by the principal as an import of a service and by the processor as an export of a service. Chapter 5 of the Globalization Guide provides further details.
Table 2.1 Typology of global production arrangements and transactions involved
Description of production process
from point of view of domestic entity
which represents the principal
Entities involved
Economic activity
ISIC Industry Economic ownership of Type of output
International transactions related to production process
Materials Intellectual Property
Output
Case A. Goods sent abroad for processing
Domestic (Principal)
Manufacturing Manufacturing X X X Goods Record the processing fee as an import of a manufacturing service. Record materials sent for processing as imports of goods if purchased abroad. Exclude materials sent for processing from exports of goods if purchased in the domestic economy. Record the output of manufactured goods as exports of goods if sold abroad. Exclude the output of manufactured goods from imports of goods if sold in the domestic economy.
Foreign Supplier
Manufacturing service provider
Manufacturing Services Record processing as exports of manufacturing services. Exclude materials received for processing from imports of goods if shipped from an economy different from that of the supplier. Record export of materials if bought in the economy of the supplier. Exclude the output of manufactured goods from exports of goods if not sold in the economy of the supplier. Record import of goods if sold in the economy of the supplier.
Case B. Goods under merchanting
Domestic Merchanting Trade X Services (Margin on
Goods)
Record the purchase of a good under merchanting as a negative export, and the subsequent sale as a positive export, of goods. The difference between the two represents the trade margin as output of the merchant. If the physical form of the goods is changed during the period the goods are owned, as a result of manufacturing services performed by other entities, then the goods transactions are recorded under general merchandise rather than merchanting.
Foreign Supplier
Manufacturing Manufacturing X X Goods Record the output of the supplier as an export of goods.
Case C. Factoryless goods production (according to the current accounting standards)
Domestic (Principal)
Merchanting Trade X X Services (Margin on
Goods)
As under B
Foreign Supplier
Manufacturing Manufacturing X Goods As under B
Case D. Fragmenting part of production of services, IPPs
Domestic (Principal)
Production of services
Appropriate service Industry
X X Services Record purchase from foreign suppliers as imports of services (by type). If the principal sells the service abroad, record gross value in exports of services (by type).
Foreign Supplier
Production of services
Appropriate service Industry
Services Exports of services (by type)
Case E. Fragmenting part of production of services, excluding IPPs
Domestic (Principal)
Production of services
Appropriate service Industry
X Services As under D
Foreign Supplier
Production of services
Appropriate service Industry
Services As under D
Case F. Subcontracting production of services
Domestic (Principal)
Purchase and sale of service without any significant
transformation in between
Appropriate service Industry
X Services As under D
Foreign Supplier
Production of services
Appropriate service Industry
Services As under D
Case G. Direct Investment Enterprise not directly engaged in producing goods
Domestic Financial and business services
Section M Services None
Foreign Supplier
Manufacturing Manufacturing X X X Goods Exports of goods
Case H. Direct Investment Enterprise not directly engaged in producing services
Domestic Financial and business services
Section M Services None
Foreign Supplier
Production of services
Appropriate service Industry
X X X Services Exports of services
Typology of Global Production Arrangements
10
Consider a principal engaged in making athletic shoes. The production of the shoe can be divided into three main parts: (1) the top of the shoe, called the upper; (2) the midsole, the most important part of this athletic shoe because it is the part that cushions and protects the foot; and (3) the outsole. Suppose the principal created a new innovative design that cushions the foot and provides for better athletic performance. The principal produces the newly designed midsole at its domestic manufacturing plant. However, the principal decides that it is more cost effective to send the midsole and the other materials (the upper and the outsole) it has manufactured to another country for final assembly. There is no change in ownership of the various parts of the shoe sent abroad for further processing. The principal simply pays a processing fee to the supplier to assemble the shoe. The shoe is marketed and sold by the principal, so it owns the output and receives the revenue. The principal may or may not take physical possession of the final output. The output could be shipped directly from the processor to the final buyer in the principal’s country; the output could remain in the processor’s country; or the output could be shipped directly to another country.
The key points of this arrangement are that the supplier only receives a processing fee which is not the full value of the final good but represents the reward for assembling the shoe. The principal is the economic owner of the materials, the intellectual property (the innovative design of the midsole) and the output.
Following ISIC Rev.4 both the principal and supplier are classified in the manufacturing industry. The principal reports as output the revenue it received from selling the shoes at full value. The production account of the processor records only the revenue it received from the contract work (not an imputed value for the shoe) as output of manufacturing services.
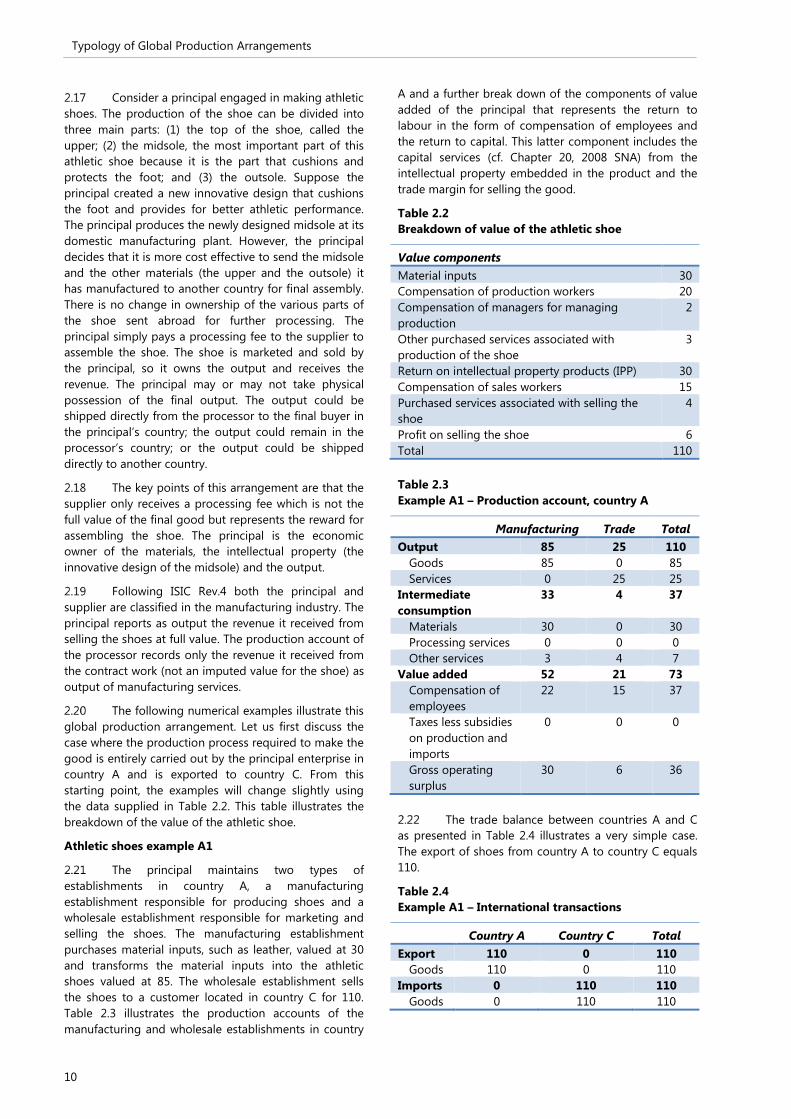
The following numerical examples illustrate this global production arrangement. Let us first discuss the case where the production process required to make the good is entirely carried out by the principal enterprise in country A and is exported to country C. From this starting point, the examples will change slightly using the data supplied in Table 2.2. This table illustrates the breakdown of the value of the athletic shoe.
Athletic shoes example A1
The principal maintains two types of establishments in country A, a manufacturing establishment responsible for producing shoes and a wholesale establishment responsible for marketing and selling the shoes. The manufacturing establishment purchases material inputs, such as leather, valued at 30 and transforms the material inputs into the athletic shoes valued at 85. The wholesale establishment sells the shoes to a customer located in country C for 110. Table 2.3 illustrates the production accounts of the manufacturing and wholesale establishments in country
A and a further break down of the components of value added of the principal that represents the return to labour in the form of compensation of employees and the return to capital. This latter component includes the capital services (cf. Chapter 20, 2008 SNA) from the intellectual property embedded in the product and the trade margin for selling the good.
Table 2.2 Breakdown of value of the athletic shoe
Value components
Material inputs 30 Compensation of production workers 20 Compensation of managers for managing production
2
Other purchased services associated with production of the shoe
3
Return on intellectual property products (IPP) 30 Compensation of sales workers 15 Purchased services associated with selling the shoe
4
Profit on selling the shoe 6 Total 110
Table 2.3 Example A1 – Production account, country A
Manufacturing Trade Total Output 85 25 110
Goods 85 0 85 Services 0 25 25
Intermediate consumption
33 4 37
Materials 30 0 30 Processing services 0 0 0 Other services 3 4 7
Value added 52 21 73 Compensation of employees
22 15 37
Taxes less subsidies on production and imports
0 0 0
Gross operating surplus
30 6 36
The trade balance between countries A and C as presented in Table 2.4 illustrates a very simple case. The export of shoes from country A to country C equals 110.
Table 2.4 Example A1 – International transactions
Country A Country C Total Export 110 0 110
Goods 110 0 110 Imports 0 110 110
Goods 0 110 110
Typology of Global Production Arrangements
11
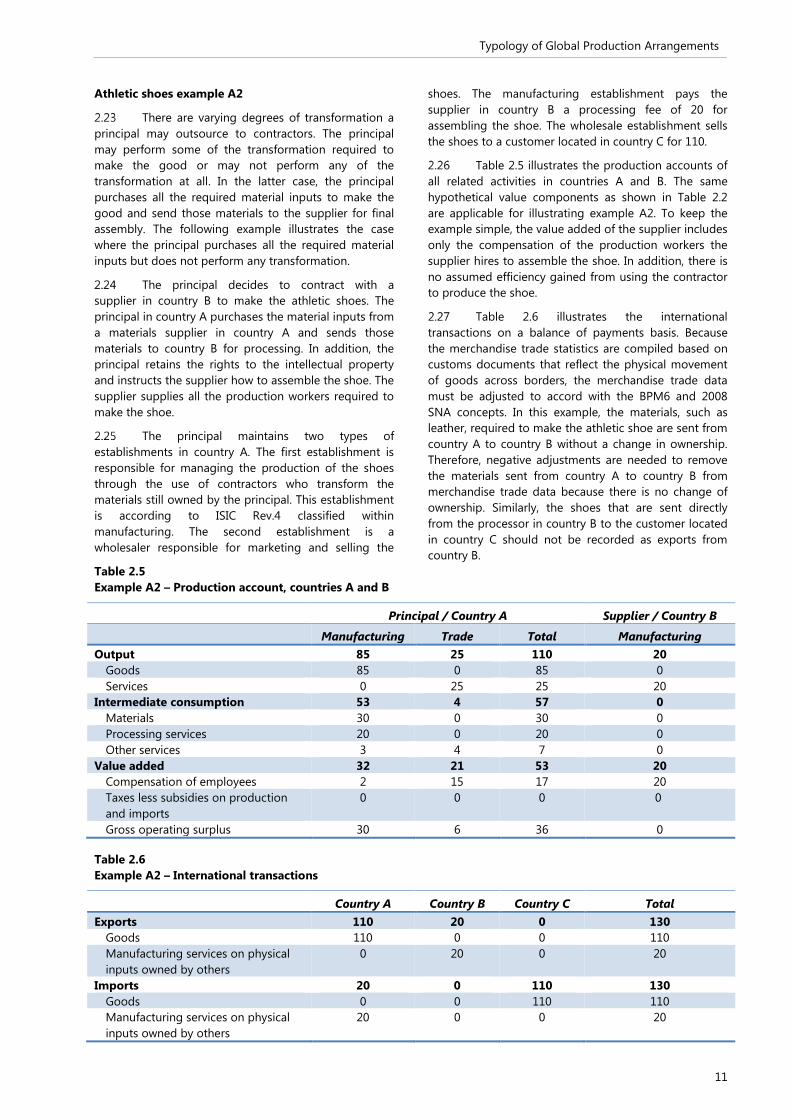
Athletic shoes example A2
There are varying degrees of transformation a principal may outsource to contractors. The principal may perform some of the transformation required to make the good or may not perform any of the transformation at all. In the latter case, the principal purchases all the required material inputs to make the good and send those materials to the supplier for final assembly. The following example illustrates the case where the principal purchases all the required material inputs but does not perform any transformation.
The principal decides to contract with a supplier in country B to make the athletic shoes. The principal in country A purchases the material inputs from a materials supplier in country A and sends those materials to country B for processing. In addition, the principal retains the rights to the intellectual property and instructs the supplier how to assemble the shoe. The supplier supplies all the production workers required to make the shoe.
The principal maintains two types of establishments in country A. The first establishment is responsible for managing the production of the shoes through the use of contractors who transform the materials still owned by the principal. This establishment is according to ISIC Rev.4 classified within manufacturing. The second establishment is a wholesaler responsible for marketing and selling the
shoes. The manufacturing establishment pays the supplier in country B a processing fee of 20 for assembling the shoe. The wholesale establishment sells the shoes to a customer located in country C for 110.
Table 2.5 illustrates the production accounts of all related activities in countries A and B. The same hypothetical value components as shown in Table 2.2 are applicable for illustrating example A2. To keep the example simple, the value added of the supplier includes only the compensation of the production workers the supplier hires to assemble the shoe. In addition, there is no assumed efficiency gained from using the contractor to produce the shoe.
Table 2.6 illustrates the international transactions on a balance of payments basis. Because the merchandise trade statistics are compiled based on customs documents that reflect the physical movement of goods across borders, the merchandise trade data must be adjusted to accord with the BPM6 and 2008 SNA concepts. In this example, the materials, such as leather, required to make the athletic shoe are sent from country A to country B without a change in ownership. Therefore, negative adjustments are needed to remove the materials sent from country A to country B from merchandise trade data because there is no change of ownership. Similarly, the shoes that are sent directly from the processor in country B to the customer located in country C should not be recorded as exports from country B.
Table 2.5 Example A2 – Production account, countries A and B
Principal / Country A Supplier / Country B Manufacturing Trade Total Manufacturing Output 85 25 110 20
Goods 85 0 85 0 Services 0 25 25 20
Intermediate consumption 53 4 57 0 Materials 30 0 30 0 Processing services 20 0 20 0 Other services 3 4 7 0
Value added 32 21 53 20 Compensation of employees 2 15 17 20 Taxes less subsidies on production and imports
0 0 0 0
Gross operating surplus 30 6 36 0
Table 2.6 Example A2 – International transactions
Country A Country B Country C Total Exports 110 20 0 130
Goods 110 0 0 110 Manufacturing services on physical inputs owned by others
0 20 0 20
Imports 20 0 110 130 Goods 0 0 110 110 Manufacturing services on physical inputs owned by others
20 0 0 20

Typology of Global Production Arrangements
12
Country case study 2.1 Goods sent for processing to third countries
An MNE in the motor vehicle industry has its headquarters located in country A and foreign affiliates in various different countries. The enterprise manufactures motor vehicle parts, mostly in country A, where the company is classified under ISIC 29: Manufacture of motor vehicles, trailers and semi-trailers. These parts are shipped to country B where the finished product is assembled by a foreign affiliate (also classified under ISIC 29). The headquarters in country A also buys other parts which are needed for the manufacturing of the final product from companies that are not part of the MNE in third countries (country C). These other parts are sent directly to the foreign affiliate in country B.
The finished product is not exported back to country A. In this production process, the headquarters in country A considers itself the owner of the inputs and the IPPs until the finished product is sold. In country A’s foreign trade statistics, the values of the exported parts are reported without the processing fee and at a much lower value than the finished product. Neither the value of the other parts imported from third countries used in the processing nor the cost of the processing are included as imports in the trade statistics of country A. However, the finished product is invoiced from country A and the full value of the finished product is reported in the business survey as production of motor vehicles. The full value of the finished product includes the profits related to management, design and research and development (R&D) carried out in country A and the cost of the processing and parts imported from third countries.
This results in discrepancies when balancing the output and the intermediate consumption with the export and import figures. Since the foreign trade in goods statistics do not collect data according to the change of ownership principle, the national statistical institute (NSI) in country A needs to contact the enterprise to obtain the data regarding the cost of processing in country B and the other parts imported directly from third countries to country B separately. Therefore, the foreign trade and the intermediate consumption figures can be adjusted in such a way that the export of country A reflects the turnover from foreign sales of completed vehicles. Imports and the intermediate consumption of country A include the processing services and the other motor vehicle parts purchased in country C. Care should be taken to also obtain data on inventories abroad.
In addition, since the principal in country A sells the shoes to a customer located in country C without the shoe entering the customs territory of country A, positive adjustments to merchandise trade are needed to add the goods sold abroad after processing as
exports of country A and to align the transaction to a balance of payments basis.9
Example A2 illustrates the case where the principal purchases all the required material inputs and 9 For information on reconciliation between merchandise source data and total goods on a balance of payments basis see BPM6 Table 10.2.
Country A Headquarters and manufacturing of motor vehicles
Country B Processing ISIC 29
Country C External producer of motor vehicle parts ISIC 29
Country D Final consumer
Physical movement of goods (motor vehicle parts)
Physical movement of goods (motor vehicle)
Cash flow
Ownership
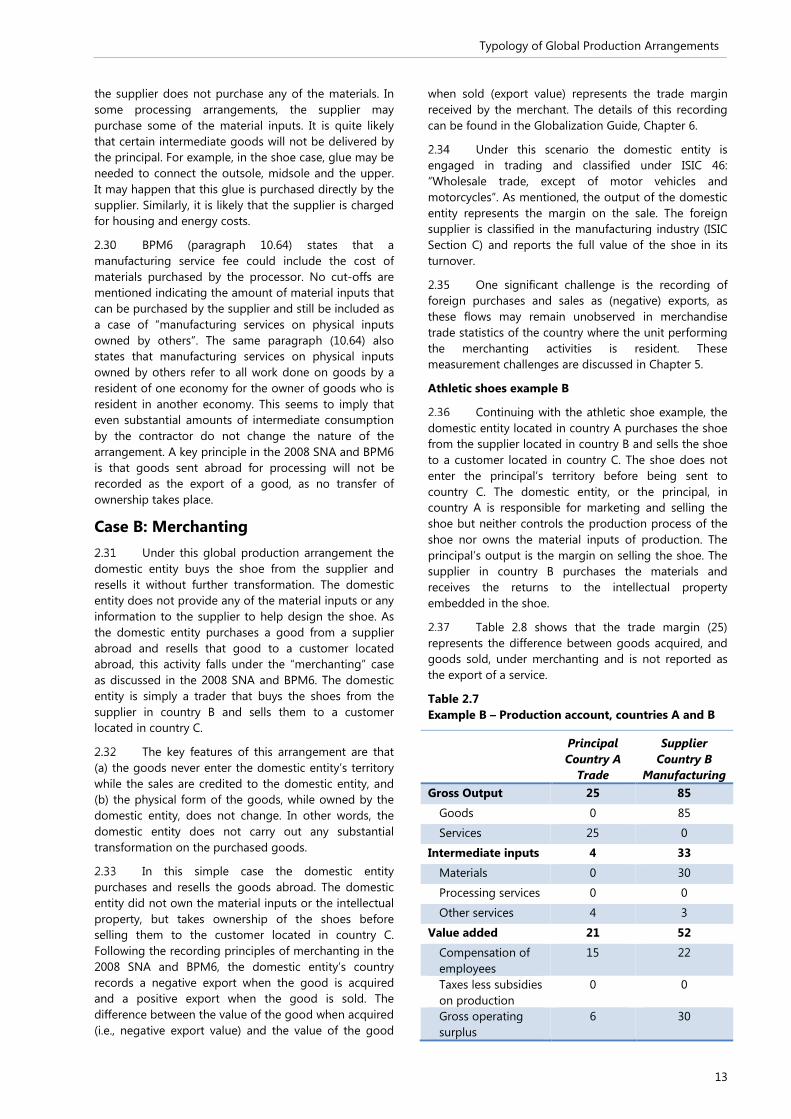
Typology of Global Production Arrangements
13
the supplier does not purchase any of the materials. In some processing arrangements, the supplier may purchase some of the material inputs. It is quite likely that certain intermediate goods will not be delivered by the principal. For example, in the shoe case, glue may be needed to connect the outsole, midsole and the upper. It may happen that this glue is purchased directly by the supplier. Similarly, it is likely that the supplier is charged for housing and energy costs.
BPM6 (paragraph 10.64) states that a manufacturing service fee could include the cost of materials purchased by the processor. No cut-offs are mentioned indicating the amount of material inputs that can be purchased by the supplier and still be included as a case of “manufacturing services on physical inputs owned by others”. The same paragraph (10.64) also states that manufacturing services on physical inputs owned by others refer to all work done on goods by a resident of one economy for the owner of goods who is resident in another economy. This seems to imply that even substantial amounts of intermediate consumption by the contractor do not change the nature of the arrangement. A key principle in the 2008 SNA and BPM6 is that goods sent abroad for processing will not be recorded as the export of a good, as no transfer of ownership takes place.
Case B: Merchanting Under this global production arrangement the
domestic entity buys the shoe from the supplier and resells it without further transformation. The domestic entity does not provide any of the material inputs or any information to the supplier to help design the shoe. As the domestic entity purchases a good from a supplier abroad and resells that good to a customer located abroad, this activity falls under the “merchanting” case as discussed in the 2008 SNA and BPM6. The domestic entity is simply a trader that buys the shoes from the supplier in country B and sells them to a customer located in country C.
The key features of this arrangement are that (a) the goods never enter the domestic entity’s territory while the sales are credited to the domestic entity, and (b) the physical form of the goods, while owned by the domestic entity, does not change. In other words, the domestic entity does not carry out any substantial transformation on the purchased goods.
In this simple case the domestic entity purchases and resells the goods abroad. The domestic entity did not own the material inputs or the intellectual property, but takes ownership of the shoes before selling them to the customer located in country C. Following the recording principles of merchanting in the 2008 SNA and BPM6, the domestic entity’s country records a negative export when the good is acquired and a positive export when the good is sold. The difference between the value of the good when acquired (i.e., negative export value) and the value of the good
when sold (export value) represents the trade margin received by the merchant. The details of this recording can be found in the Globalization Guide, Chapter 6.
Under this scenario the domestic entity is engaged in trading and classified under ISIC 46: “Wholesale trade, except of motor vehicles and motorcycles”. As mentioned, the output of the domestic entity represents the margin on the sale. The foreign supplier is classified in the manufacturing industry (ISIC Section C) and reports the full value of the shoe in its turnover.
One significant challenge is the recording of foreign purchases and sales as (negative) exports, as these flows may remain unobserved in merchandise trade statistics of the country where the unit performing the merchanting activities is resident. These measurement challenges are discussed in Chapter 5.
Athletic shoes example B
Continuing with the athletic shoe example, the domestic entity located in country A purchases the shoe from the supplier located in country B and sells the shoe to a customer located in country C. The shoe does not enter the principal’s territory before being sent to country C. The domestic entity, or the principal, in country A is responsible for marketing and selling the shoe but neither controls the production process of the shoe nor owns the material inputs of production. The principal’s output is the margin on selling the shoe. The supplier in country B purchases the materials and receives the returns to the intellectual property embedded in the shoe.
Table 2.8 shows that the trade margin (25) represents the difference between goods acquired, and goods sold, under merchanting and is not reported as the export of a service.
Table 2.7 Example B – Production account, countries A and B
Principal Country A
Trade
Supplier Country B
Manufacturing Gross Output 25 85
Goods 0 85
Services 25 0
Intermediate inputs 4 33
Materials 0 30
Processing services 0 0
Other services 4 3
Value added 21 52
Compensation of employees
15 22
Taxes less subsidies on production
0 0
Gross operating surplus
6 30

Typology of Global Production Arrangements
14
Table 2.8 Example B – International transactions
Country A Country B Country C Total Exports 25 85 0 110
Goods 25 85 0 110 Net exports of goods under merchanting 25 0 0 25
Goods acquired under merchanting -85 0 0 -85 Goods sold under merchanting 110 0 0 110
Services 0 0 0 0 Imports 0 0 110 110
Goods 0 0 110 110 Services 0 0 0 0
There are variations in the types of arrangements that fall under merchanting. For example, the good could be bought by the principal located in country A and sold to a customer located in the supplier’s country B. If the domestic entity buys the good from the supplier in country B and subsequently sells that good to a customer located in country B then country A would record the transaction as a merchanting transaction (i.e. country A would record a negative export of a good from country B and a positive export of a good to country B). Country B would record an export of a good to country A and an import of a good from country A.
There are at least two important borderline cases to consider in the context of merchanting. The first is when the good under ownership of the merchant is subject to further transformation or processing, which changes the nature of the good. In this case, the entity can no longer be considered to be engaged in merchanting. Instead, the unit should be treated and classified as a manufacturer. The resulting arrangement has similarities with goods sent abroad for processing. The distinction between “goods under merchanting” and “processing services” is further illustrated in BPM6, Box 10.1.
The second borderline case is when the merchanting unit is engaged in the production process by providing the required knowledge such as the blueprints of the production process carried out by the supplier in country B. This case of the so-called FGPs is further explored below.
Case C: Factoryless goods producers The fragmentation of production has allowed
firms to outsource processing activities to specialised domestic and foreign establishments. Some firms, known as factoryless goods producers, factoryless manufacturers, virtual manufacturers, or fabless manufacturers, supply inputs of IPPs, such as the technology, know-how and product design, but fully outsource the material transformation process required to produce the output.
FGP is a principal that controls the outcome of production of a good by undertaking the
entrepreneurial steps and providing the technical specifications required to produce the good. The FGP concentrates on innovation and marketing decisions. While the FGP does not supply material inputs into the production process, the FGP does supply substantial service inputs in the form of technology, know-how and product design. Likewise, the FGP maintains control over the outcome of the production process by providing technical specifications that are essential for the transformation of the material inputs. The FGP controls access and delivery of the final output to consumers.
The contract processor manages the transformation process by typically supplying material inputs and transforming the material inputs. The contract processor is a manufacturer that delivers pre-specified goods to the FGP at pre-determined prices and cannot sell the goods to parties other than the FGP. While a transaction in goods takes place between the contract processor and the FGP, the transaction cannot be seen as an unconditional market transaction. Key in this arrangement is that the transaction is conditional, which makes the contract processor captive: it cannot sell the good to other parties. In the case of factoryless manufacturing, control over the outcome of the production process and ownership, and provision of the IPP inputs seem to coincide with the economic ownership of the final output.
ISIC Rev.4 provides guidelines for classifying a unit that outsources production. Paragraph 137 of ISIC defines the term “outsourcing” as “…a contractual agreement according to which the principal requires the contractor to carry out a specific production process.” In ISIC, criteria for classifying a principal that outsources the complete production process are as follows:
142. In general, if the principal outsources the complete production process of a good or service, it is classified as if it were carrying out the production process itself. This applies in particular to all service-producing activities, including construction. In the case of manufacturing, however, the following special considerations apply.
143. In manufacturing, the principal provides the contractor with the technical specifications of the
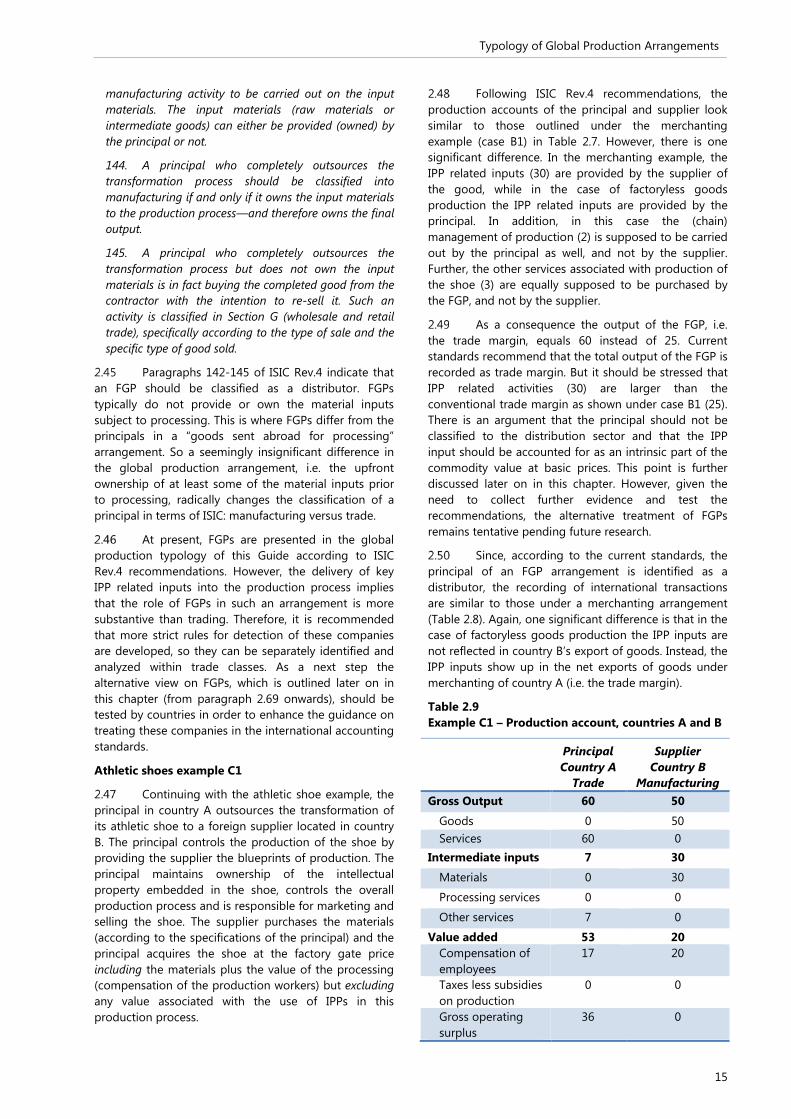
Typology of Global Production Arrangements
15
manufacturing activity to be carried out on the input materials. The input materials (raw materials or intermediate goods) can either be provided (owned) by the principal or not.
144. A principal who completely outsources the transformation process should be classified into manufacturing if and only if it owns the input materials to the production process—and therefore owns the final output.
145. A principal who completely outsources the transformation process but does not own the input materials is in fact buying the completed good from the contractor with the intention to re-sell it. Such an activity is classified in Section G (wholesale and retail trade), specifically according to the type of sale and the specific type of good sold.
Paragraphs 142-145 of ISIC Rev.4 indicate that an FGP should be classified as a distributor. FGPs typically do not provide or own the material inputs subject to processing. This is where FGPs differ from the principals in a “goods sent abroad for processing” arrangement. So a seemingly insignificant difference in the global production arrangement, i.e. the upfront ownership of at least some of the material inputs prior to processing, radically changes the classification of a principal in terms of ISIC: manufacturing versus trade.
At present, FGPs are presented in the global production typology of this Guide according to ISIC Rev.4 recommendations. However, the delivery of key IPP related inputs into the production process implies that the role of FGPs in such an arrangement is more substantive than trading. Therefore, it is recommended that more strict rules for detection of these companies are developed, so they can be separately identified and analyzed within trade classes. As a next step the alternative view on FGPs, which is outlined later on in this chapter (from paragraph 2.69 onwards), should be tested by countries in order to enhance the guidance on treating these companies in the international accounting standards.
Athletic shoes example C1
Continuing with the athletic shoe example, the principal in country A outsources the transformation of its athletic shoe to a foreign supplier located in country B. The principal controls the production of the shoe by providing the supplier the blueprints of production. The principal maintains ownership of the intellectual property embedded in the shoe, controls the overall production process and is responsible for marketing and selling the shoe. The supplier purchases the materials (according to the specifications of the principal) and the principal acquires the shoe at the factory gate price including the materials plus the value of the processing (compensation of the production workers) but excluding any value associated with the use of IPPs in this production process.
Following ISIC Rev.4 recommendations, the production accounts of the principal and supplier look similar to those outlined under the merchanting example (case B1) in Table 2.7. However, there is one significant difference. In the merchanting example, the IPP related inputs (30) are provided by the supplier of the good, while in the case of factoryless goods production the IPP related inputs are provided by the principal. In addition, in this case the (chain) management of production (2) is supposed to be carried out by the principal as well, and not by the supplier. Further, the other services associated with production of the shoe (3) are equally supposed to be purchased by the FGP, and not by the supplier.
As a consequence the output of the FGP, i.e. the trade margin, equals 60 instead of 25. Current standards recommend that the total output of the FGP is recorded as trade margin. But it should be stressed that IPP related activities (30) are larger than the conventional trade margin as shown under case B1 (25). There is an argument that the principal should not be classified to the distribution sector and that the IPP input should be accounted for as an intrinsic part of the commodity value at basic prices. This point is further discussed later on in this chapter. However, given the need to collect further evidence and test the recommendations, the alternative treatment of FGPs remains tentative pending future research.
Since, according to the current standards, the principal of an FGP arrangement is identified as a distributor, the recording of international transactions are similar to those under a merchanting arrangement (Table 2.8). Again, one significant difference is that in the case of factoryless goods production the IPP inputs are not reflected in country B’s export of goods. Instead, the IPP inputs show up in the net exports of goods under merchanting of country A (i.e. the trade margin).
Table 2.9 Example C1 – Production account, countries A and B
Principal Country A
Trade
Supplier Country B
Manufacturing Gross Output 60 50
Goods 0 50 Services 60 0
Intermediate inputs 7 30
Materials 0 30
Processing services 0 0
Other services 7 0
Value added 53 20 Compensation of employees
17 20
Taxes less subsidies on production
0 0
Gross operating surplus
36 0

Typology of Global Production Arrangements
16
Table 2.10 Example C1 – International transactions
Country A Country B Country C Total Exports 60 50 0 110
Goods 60 50 0 110 Net exports of goods under merchanting 60 0 0 60
Goods acquired under merchanting -50 0 0 -50 Goods sold under merchanting 110 0 0 110
Services 0 0 0 0 Imports 0 0 110 110
Goods 0 0 110 110 Services 0 0 0 0
Country case study 2.2 Factoryless Semiconductor Producers
This case study originates from Israel, a country with a relatively large number of factoryless semiconductor producers. According to the Global Semiconductor Alliance, factoryless semiconductor producers are called “fabless” because “Fabless refers to the business methodology of outsourcing the manufacturing of silicon wafers. Fabless companies focus on the design, development and marketing of their products and form alliances with silicon wafer manufacturers, or foundries.” Foundries are typically located in Asia because of the generally low cost of labour, so fabless companies can benefit from lower production costs while concentrating their R&D resources on the end-market.
A typical fabless semiconductor enterprise in Israel has a management unit and a large R&D unit. During the development of the design, the testing of the semiconductor is performed at the enterprise of a subcontractor, often situated in another country. At later stages the production is also performed by sub-contractors outside the territory of Israel.
An example of such a factoryless semiconductor enterprise in Israel is a fabless enterprise designing and marketing finished products, which are produced by non-affiliated enterprises in an Asian country. The income of the domestic enterprise in Israel amounts to about 35 per cent of the output value. The share of the domestic enterprise in the combined added value is quite high and may be assumed to reflect mainly the value of R&D performed within Israel. In its financial reports the domestic enterprise registers the whole value of the sales of the final production as domestic income, so that on the one hand it is easy to collect many of the gross data needed to analyze all production processes in the global value chain. On the other hand, in order to separate the activities between the countries, one has to collect data on the transactions taking place between the domestic enterprise, the producers abroad and the customers, since no movement of goods has been observed in the foreign trade data, and the transfer of R&D to be used in the outsourced production has also not been recorded. Country case study 2.3 Research-based producers in Sweden
In recent decades producers of high-tech goods in Sweden have been outsourcing the stages of physical transformation. This appears to be cost-effective due to streamlining of production processes and reductions in costs for freight. Production is often moved into the close neighbourhood of product markets while activities such as product chain management, R&D, product design and production testing is kept in Sweden. Also, turnover from sales worldwide is redistributed to the head offices in Sweden on a merchanting basis, which are needed for funding the company’s main activities in Sweden such as R&D and design. These activities are considered to be part of the comparative advantage of these enterprises.
When introducing the European system of national and regional accounts 2010 (ESA 2010) it became clear that R&D and product design are becoming main activities of several of the large MNEs with headquarters in Sweden. This development is being supported by government and universities as innovation is regarded as crucial in maintaining Sweden’s position as a competitive business partner.
In these Swedish companies, product development is dominating R&D together with activities such as marketing, branding and other forms of IPP creation. An important part of the R&D process is getting hold of new knowledge and innovations through mergers and acquisitions. All these examples of IPP creation and acquisition must be seen as an inseparable part of the final product, even though physical transformation of the “hardware” is fully outsourced. At first sight it seems that these enterprises are transforming their business towards the production of services as their main activities are R&D, software development, design trading etc. However, all these activities have one purpose only,

Typology of Global Production Arrangements
17
namely to strengthen the company’s final product in terms of competitiveness. Software and product design is often developed and tested in Sweden, and is then sold to the supplier under a license agreement to secure the content. The supplier provides the Swedish principal a manufacturing service. Confusion about the precise nature of these Swedish principals of global production arrangements has led to an undesirable situation in which these companies are classified in a variety of industries e.g. manufacturing, information technology, R&D or wholesale trade.
Producing goods or services?
In Sweden the name of “research-based producer” has been used to indicate this class of newly emerging companies. Research-based companies show very strong similarities with FGPs as introduced in this Guide. One specific feature of the research-based producers in Sweden is that, besides the typical FGP activities such as R&D and supply chain management, these companies are also responsible for software development and product testing. Further, they may also be selling services directly to customers using the final product as part of their business, or distributing products supplied by others within their merchandise networks and undertheir own brand name. So, these companies’ output will be a composite of products and services while their value added is mainly services dominated.
A research based producer is typically responsible for the product blueprints, the software related parts and the overall control of the production chain. The fractions typically outsourced relate to the hardware parts of the product. In these cases, marketing and logistics are in full control of the Swedish companies. Gross profits are redistributed to Sweden to be used for funding future research.
The research based producers do not consider themselves as service providers as the final products, consisting of hardware and software components, are core to their business. Using old “blue-collar” and “white-collar” perception of product manufacturing does not apply to the kinds of activities conducted by these Swedish firms. So, economic classifications are hard to apply. Similarities with computer-related manufacturing provide a rough indication of where to classify these research based producers. For the time being it is suggested to classify them within manufacturing even though the manufacturing of hardware is not carried out in Sweden. However, at present the research based enterprises are classified in several industries such as manufacturing, commercial services (software development), trading and research. Their classification in services, trading or research would imply that any connection to hardware manufacturing is omitted. Separately identifying these companies as FGPs would probably be a way forward, even in cases where parts but not all fractions of physical transformation are carried out abroad. A final solution can be found once the treatment of FGPs in ISIC is settled.
FGP could be involved in a combination of activities such as the factoryless goods production of a product A and branding of a product B. One such firm, a computer producer, utilizes a significant number of unaffiliated contractors around the world to manufacture products that have been designed by the firm. The firm uses multiple contractors to maintain
flexibility in their supply chain and manufacturing process thereby generating cost efficiencies and reducing time to market for own-designed products. In addition, the computer firm’s financial statements indicate the firm also purchases original manufactured products from third-party producers and resells these products under the firm’s own brand name.

Typology of Global Production Arrangements
18
It should be emphasised that the stylized arrangements discussed in this section are simplified versions of actual global production arrangements that can be very elaborate. The discussion above illustrates that a firm might use a combination of global production arrangements and statistical offices may have difficulty distinguishing between a producer that is only branding products and a producer that provides the blueprints of the production process, thus, exercising control over the production process. These borderline cases are further examined in paragraphs 2.74-2.85 and in Chapter 5.
Athletic shoes example C2 (drawing the borderline between FGP and IPP services supply)
The intellectual property inputs in global production arrangements may also be provided by entities other than FGPs. For example, companies specialised in R&D may supply their knowledge inputs without being engaged in the production of goods. Suppose an entity creates a new and innovative midsole that improves the athletic performance of runners. The entity sells the rights to use the design and the specifications for making the shoe to a shoe manufacturer which is also responsible for marketing and selling the shoe and receives the revenue. The R&D supplier receives revenue from selling or licensing the design and should not be seen as the principal arranging an international supply chain to make a particular good or service. It is simply a participant in the supply chain that is responsible for supplying the IPPs.
Continuing with the athletic shoe examples, a unit in country A is transferring the rights to use the design and blueprints of how to make the shoe to a manufacturer in country B in return for a fee. The manufacturer in country B transforms the shoe and is responsible for marketing and selling the shoe and records the full value of the shoe in its turnover, including the IPP service fee embedded in the shoe. Tables 2.11 and 2.12 show that the company in country A exports the IPP service to country B. All other production takes place in country B under the full responsibility and ownership of the shoe manufacturer.
Services related global production arrangements
Firms may contract with other firms to provide support activities such as billing services or information “helpdesk” services. Contracting these kinds of services is quite common. However, the arrangements presented in this subsection deal with firms whose primary activity is the production of services. These firms may fragment part of their services production to different countries or may even fully outsource, or subcontract, the provision of their services to non-affiliated companies abroad.
There is a subtle distinction between fragmenting part of the production and fully outsourcing production. Fragmenting implies that the domestic entity remains in control of the production of the primary service product and incorporates that part
Table 2.11 Example C2 – Production account, countries A and B
Country A R&D provider
Country B Manufacturer
Gross Output 30 110 Goods 0 110 Services 30 0
Intermediate inputs 0 67 Materials 0 30 Processing services 0 0 Other services 0 37
Value added 30 43 Compensation of employees 0 37 Taxes less subsidies on production and imports 0
Gross operating surplus 30 6
Table 2.12 Example C2 – International transactions
Country A Country B Country C Total Exports 30 110 0 140
Goods 0 110 0 110 Services (use of intellectual property) 30 0 0 30
Imports 0 30 110 140 Goods 0 0 110 110 Services (use of intellectual property) 0 30 0 30

Typology of Global Production Arrangements
19
that was fragmented into the product. Full subcontracting of the production of services means that the principal entity acts as a services arranger, who bundles and manages the services of the subcontractor(s) on behalf of customers.10 The main distinction between these two types of arrangements is whether the domestic entity contributes to the production of the primary service product versus fully subcontracting out the production of the primary service product.
Case D: Fragmenting part of the production of services, IPPs
In the following case, the domestic entity remains in control of the production process and owns the intellectual property used in production, as well as the intellectual property as output of the production process. For example, a software firm in country A receives a contract to design customized software for another company in country B.11 The software firm in country A employs computer programmers in-house to write the application, but also employs computer programmers located in country C to develop certain features of its application. The principal, the domestic software firm located in country A, owns the proprietary rights to the software being developed and is simply paying the supplier in country C a fee for providing the service.
Both the principal and the supplier are classified in the appropriate service industry. In the case of software development, both the principal and supplier are classified in the ISIC Division 62: Computer programming, consultancy and related activities.
Case E: Fragmenting part of the production of services, excluding IPPs
In this case, the domestic entity remains in control of the production process and owns the output associated with the service produced and no services are related to IPP.
For example, an accounting firm in country A receives a contract from a company in country A to audit the company’s financial statements. The audited company has a subsidiary in country B. The domestic accounting firm in country A uses domestic employees to perform auditing services of the unit located in country A. Because in many parts of the world accounting firms are required by law to be locally owned and independent, the accounting firm in country A must contract with another accounting firm in country B,
10 Manual on Statistics of International Trade in Services (MSITS) 2010 paragraphs 3.61 – 3.62.
11 The customer could be located in the domestic entity’s country—country A— or be located in the country of the supplier—country B.
where the subsidiary is located, to perform the auditing service for the subsidiary’s financial statements.
The accounting firm in country A provides auditing services to the company located in country A and receives the revenue directly from the customer located in country A. However, there is an international transaction involved to account for the purchase of auditing services by the accounting firm in country A from an accounting firm in country B. In this example both the principal and the supplier are classified in ISIC Division 69: Legal and accounting activities industry.
Case F: Subcontracting production of services
Under this global production arrangement, the principal may outsource (part of) its services provision. Under certain conditions, such an arrangement could be considered in some ways similar to merchanting of goods, particularly when the services are purchased and resold without any significant transformation. The issue of merchanting of services and its relationship to subcontracting is further discussed in Chapter 10.
For example, a principal unit is paid to provide custom software services to a non-resident customer. The principal subcontracts to a non-resident contractor to provide the required custom software services. The principal pays the non-resident contractor to obtain ownership of the developed software and subsequently resells this software to the non-resident customer. The principal records the revenue received from the non-resident customer (recorded as exports of software services) and the expenditure for purchasing the custom software from the non-resident contractor (recorded as imports of software services).
The value of services exported and imported in the economy of the principal is recorded on a gross basis. This treatment is applicable because the principal buys and sells the services. In case the principal acts on a commission basis (i.e. not taking ownership of the software), then only the commission would be recorded as the service provided by the principal. Both the principal and the supplier are classified in the appropriate service industry of their primary activity, which in this case is ISIC Division 62: Computer programming, consultancy and related activities. Chapter 10 provides a more elaborated discussion on services subcontracting and arranging of services (merchanting of services).
Direct investment enterprises, holding companies and head offices
The last production arrangements include direct investment enterprises that are themselves not directly engaged in the production of goods of services. Purely direct (foreign) investors are not engaged in production at all. The returns on their investments are recorded as property income (dividends) in the

Typology of Global Production Arrangements
20
distribution of income accounts. The owners of foreign enterprises may be engaged in the production activities in at least two ways.
Head offices (ISIC Rev. 4, Section M, class 7010) may oversee and manage the activities of (foreign) subsidiaries by undertaking the strategic or organizational planning and decision making role of the company or enterprise; exercising operational control and managing the day-to-day operations of their related units.
Holding companies (ISIC Rev. 4 in Section K, class 6420) hold the assets of subsidiary corporations but do not undertake any management activities. They are described as units that hold the assets (owning controlling-levels of equity) of a group of subsidiary corporations and whose principal activity is owning the group. The holding companies in this class do not provide any other service to the enterprises in which the equity is held, i.e. they do not administer or manage other units.
Both head offices and holding companies generate output in the form of managerial or financial services. These services are expected to be mostly consumed by the foreign subsidiaries and this may give rise to international transactions, i.e. the export and import of managerial and financial services. In theory these services add up to the other inputs of production of the foreign subsidiaries. In any case the output of the ultimate production process is reported in the country in which the subsidiaries are resident.
An alternative view on factoryless goods producers
There is an emerging consensus among national accountants and balance of payments compilers that the current treatment of FGPs as outlined in Tables 2.9 and 2.10 is not satisfactory. It is argued that the provision of critical inputs such as IPP services (i.e. the blueprints of products) implies that FGPs are engaged in activities other than trade. This suggests that the criterion of ownership of material inputs in ISIC Rev.4, as referred to in the previous section should be broadened to include critical services inputs such as those related to IPPs. While the prevailing view is to classify FGPs as manufacturers arguments exist in favour of classifying FGPs are neither distributors nor manufacturers but a totally new category of producers, which at present are not separately identified in the current industry classifications. The alternative view explored below treats FGPs as manufacturers, however, future research could include other options for recording of FGPs.
Given that a FGP undertakes the entrepreneurial steps and provides the technical specifications required to produce a good and does more than simply buying and selling goods, the TFGP developed an alternative view on FGPs in which they are
treated as producers of goods instead of traders in goods. Under a factoryless arrangement, the principal controls the blueprints of production, access to customers, trademarks and other sources of significant value embodied in the final output. The contractor only manages the material transformation related activities by strictly following the product specifications provided by the principal.
A key characteristic of the contractual arrangement is the captive nature of the contractor. Processing activities cannot be undertaken without the blueprints provided by the principal. Once processing is finalized according to the conditions of the contract, the contractor is entitled to compensation from the principal, and the output is no longer under the contractor’s control. The contractor is not allowed to sell the output to other parties but must sell to the principal. As a result, the value added by an FGP may be significantly more than the margin associated with the activities of merely distributing goods from a producer to a consumer since the IPP inputs embedded in the good may contribute significant value to the good measured in basic prices.
While identified as manufacturers, the production functions or cost structures of FGPs will differ substantially from those of “classic” vertically integrated manufacturers. From this viewpoint there may be a need to flag FGPs to allow separate analyzes for example in relation to input-output (IO) analysis and measuring trade in value added.
The following guidance could assist statistics compilers in separating FGPs from the principals active in merchanting or goods sent for processing arrangements. Chapter 5 provides references to data sources that could assist in obtaining the required evidence.
Factoryless goods production versus merchanting
When examining the differences between trading (merchanting) and factoryless goods production the significance of IPP use in the production process of the principal firm plays a decisive role. Yet, concrete decision rules are needed as FGPs will often be active in several areas such as product development, supply chain management, marketing and trade. The role of the principal in a global production arrangement must be assessed by looking at the dominance of IPP inputs and typical activities such as innovation, supply chain management and marketing versus the provision of purely distribution services. This should determine the firm’s overall economic engagement: factoryless goods production or trading (merchanting).
This leaves open the role of branding in a factoryless arrangement. A principal may not supply the blueprints for production but instead purchases goods from manufacturers and resells the goods under the entity’s brand name. These companies may spend large amounts of money on marketing assets (advertising) to

Typology of Global Production Arrangements
21
elevate the attractiveness of the brand it sells. And the return on these “investments” will show up as a substantial increase in the value of the good as sold to customers. It has been argued that in the eyes of customers the quality of the product has increased substantially due to branding. This suggests that between purchasing and selling, the good is being transformed in terms of its quality (although perhaps not in a physical sense).
Branding is often associated with arrangements that are led by firms involved in the downstream end of the global supply chain, such as retailers. In terms of ‘physical transformation’, one may argue that branding does not significantly differ from retailing. The same argument could be made for IPPs and trading, but the key difference here is that two products with the same material characteristics but different IPP inputs will have demonstrably different performance (and tangible quality) but two products identical in every way except for the brand name will not (all other things being equal). As a result, and in line with current standards (and also with the fact that unlike IPPs, “brands” are not considered produced assets), it is recommended that companies concentrating their activities on branding inside the global value chain should remain classified as distributors and also not be considered as FGPs.
The research agenda of the 2008 SNA includes the recording of marketing assets (A4.53) as one issue to be investigated. According to the 2008 SNA marketing assets include brand names, mastheads, trademarks, logos and domain names. Marketing is a key driver of brand value and big corporations invest heavily in building and supporting their brands by advertising, sponsorship and other measures to build a positive image with customers. The 2008 SNA treats marketing assets as being non-produced and the expenditures incurred in their creation as intermediate consumption. They appear in the balance sheet only when they are sold. The major reason for not treating marketing assets as fixed assets is the difficulty of measuring their value.
More generally, in the 2008 SNA research agenda it is acknowledged that product innovation and product development involves, in addition to R&D, other activities such as product design, market research and marketing. FGPs are expected to play a significant role in each of these areas. Supply chain management is another characteristic activity of FGPs. With the exception of R&D, each of these activities does not lead to IPP capital formation and IPP use in the strict 2008 SNA sense.
Acknowledging that factoryless goods production involves this broader range of activities, it is suggested that FGPs are defined as those companies which are substantive IPP investors and more than 50 per cent of value added originates from returns on IPP activities such as R&D, design, innovation, supply chain management, including activities related to non-produced assets, such as market research and
marketing. Because a company must be a substantive IPP investor most companies that are only involved in branding should be excluded under these criteria.
It is important to stress that this definition may require refinement in the near future, based on country experiences with implementing this Guide into practice.
Country case study 2.4 Borderline cases: FGP versus branding
A principal provides a blueprint (the product design) of a toy car to a contract manufacturer abroad for production. However, the toy design does not relate to IPP investment. Like an FGP the principal maintains control over the outcome of the production process and takes the responsibility for maintaining access to consumer markets and delivery of the final output to consumers. The contractor manages the transformation process by supplying all material inputs according to the specifications of the principal and transforming them to final products according to the blueprint provided by the principal. The contractor delivers pre-specified goods to the principal at pre-determined prices. As there is no IPP input involved and the design inputs embedded in the toy car do not contribute significant value to it, the principal cannot be identified as an FGP. Instead the principal is deemed to be engaged in trading.
Factoryless goods production versus goods sent for processing
Transformation of goods owned by others (processing) is well described in the 2008 SNA and BPM6. The classic example of a processing arrangement is that of the principal shipping raw materials or semi-fabricated goods to a processor abroad. An arrangement that presents a challenge is when the principal outsources completely the production process (similarly to an FGP) but also acquired (some of the) material inputs prior to transformation. These inputs may be purchased abroad and subsequently shipped to the processor. As the principal obtains economic ownership of (some of the) material inputs, this would be recorded as a case of processing. It should be acknowledged that the principal in such a processing arrangement has become “factoryless” similar to principals outsourcing all purchases of the material inputs. Such companies should also be taken into consideration when defining the scope of FGPs in a future revision of ISIC.
A pragmatic choice is needed to distinguish those “factoryless” arrangements falling under processing from those falling under factoryless production (in a narrow sense). The dividing line that could be drawn according to the current accounting standards is whether or not the principal has obtained at least some of the material inputs prior to processing. This criterion is in accordance with how goods sent for processing is currently explained in the 2008 SNA and

Typology of Global Production Arrangements
22
BPM6, and in line with the ISIC criteria for outsourcing. For example, BPM6 explicitly mentions that processing fees may partly reflect the costs of supplementary (material) inputs purchased by the processor.
The principals active in a “factoryless” arrangement that fall under processing or a factoryless goods production (in the narrow sense) are often responsible for similar kinds of tasks inside the global value chain. A broad notion of FGPs is sometimes used to identify the principals of global production arrangements that are responsible for the IPP inputs, design, value chain management, marketing etc., irrespective of whether or not some of the material inputs are purchased by this principal prior to processing by a contract manufacturer.
Factoryless goods producers versus head offices (ISIC Rev.4 - 7010)
According to ISIC, head offices include those units overseeing and managing other units of the company or enterprise, undertaking the strategic or organizational planning and decision making for the company or enterprise by exercising operational control and managing the day-to-day operations of their related units. The output of head offices often represents intra-company services.
FGPs play a more active role in the production process. FGPs may be subject to supervision of a head office. As argued, FGPs are directly responsible for the IPP related inputs usually obtained from in-house research or software development. They are also responsible for value chain management usually including all stages of production: from design, material transformation up to managing consumer markets. In a factoryless goods production arrangement, the foreign contractor may, or may not, be part of the MNE structure.
Defining the output of the FGP
At first sight FGPs seem to be engaged in a similar sequence of international goods transactions as merchants. However, FGP's activities differ from trading due to the significant contribution made by IPPs owned by the principal which can be considered transformative. The scale of value added generated by FGPs as returns to IPPs, management and other services provided clearly exceeds the amount generated from core distribution activities such as minimal processing, grading, cleaning and packaging as referred in the 2008 SNA. If FGPs are recognized as a special category of manufacturers, their output should accordingly reflect the full value of the manufactured good as sold to (foreign) customers, and not a trade margin. Similarly, the supply of goods by the contractor should be recorded as part of the FGP’s intermediate consumption.
Defining the output of a contract manufacturer under a factoryless arrangement
The well-established accounting rules of goods sent for processing explain that the contractor’s output is recorded as a manufacturing service. For the contracting firm this treatment also follows in the case where some part of material inputs are purchased on own account. Under such conditions the manufacturing service will include the value of these material inputs.
Whilst it is clear that FGPs are in the business of producing goods, the output produced by the contractor under a factoryless goods production arrangement (in short: a factoryless arrangement) requires some further elaboration. Under a processing arrangement the contractor transforms material inputs provided by the principal into a final product. Under a factoryless arrangement the contractor buys and transforms material inputs into a final output on the basis of the product specifications, i.e. the IPP related inputs, provided by the principal. In other words, a central feature of a factoryless arrangement is that the “intangible” components owned by the FGP are physically embodied in the contractor’s output, even though they are not included in the price as settled between the contractor and the principal.
Under a processing arrangement the contractor is not at liberty to sell its output to any purchaser. Such a restriction also holds under a factoryless arrangement. The transaction between the contractor and the FGP is based on an off market price for a product that in reality has a greater value, including the IPP capital service. However, under a factoryless arrangement the contractor is responsible for acquiring the material inputs in accordance with the specifications of the required output as defined by the FGP. Under such conditions the contractor takes more risks and plays a more active role in the production process compared to a contractor under a purely processing arrangement. Under a factoryless arrangement the contractor is generally exposed to risks related to fluctuating material input prices and holding inventories.
So, the key question is whether or not the contractor under a factoryless arrangement provides a manufacturing service, similar to a contractor’s output under a processing arrangement. This question is tightly linked to the issue of economic ownership of the good being produced. Under processing, the principal owns substantial parts of the material inputs used in production. This implies the principal is also expected to own the final product. As a logical consequence the contractor is providing a manufacturing service.
Under a factoryless arrangement, the material inputs are directly acquired by the contractor, who is expected to be in control of any material inputs held in inventory prior to transformation. In contrast, the IPP inputs are under control of the principal. This split in ownership of material and intangible inputs makes it
Typology of Global Production Arrangements
23
difficult to determine the economic ownership of the contractor’s output prior to the delivery and whether the contractor is de-facto producing a good or a service. There are two options to consider:
a) Under a factoryless arrangement the contractor is, during the transformation process and prior to the transaction, considered the economic owner of the good it produces. The contractor will be selling the good and, at the point of sale, the economic ownership is then handed over to the FGP.
b) Alternatively, the principal is identified as the economic owner of the good during the transformation process and prior to its delivery. This implies that the contractor provides manufacturing services on goods owned by the FGP. The transaction taking place between the contractor and the FGP is that of a processing fee.
It should be emphasized that this choice does not affect the contractor’s output value. Whether recording a good (a.) or a processing service (b.), the output of the contractor will cover the value of labour inputs, capital inputs and purchased materials but exclude the value of the IPP related inputs supplied by the FGP.
Regarding an assessment of control, risk and rewards, as recommended by the SNA, it seems unlikely that any data will ever be available to make an informed decision on ownership of the contractor’s output on a case-by-case basis. This means a workable convention is needed which could be established on the basis of the following arguments.
The arguments that can be brought forward in favour of option (a) are:
i. Besides factoryless arrangements, there are other examples where a producer and customer agree on the characteristics and the price of the (custom made) good prior to its production and delivery. These conditions may be such that the good cannot be sold to other customers. Generally, under such circumstances, the supplier will still be identified as the producer of the good and a transfer of ownership takes place at the moment the good is transacted. Also, before a transaction takes place, the contractor is expected to bear the risk of holding these manufactured goods in inventory, for example with respect to theft or accidents. This indicates the supplier is the economic owner of the manufactured goods prior to being transacted.
ii. When recording a manufacturing service, the production accounts of the contractor and the FGP will both be blurred by the fact that the contractor produces industrial services combined with substantive use of material inputs (which seems odd) while the FGP produces a good without consuming any material inputs (idem). As such a processing type of arrangement does not seem to
match very well with the fact that the principal is not responsible for acquiring any of the material inputs of production. Therefore, processing and factoryless goods production should be seen as different global production arrangements.
iii. Although the physical characteristics of the good do not change between purchase and sale, the FGP will increase its value substantially by adding a return on IPPs. As such, one may conclude that in an economic sense the good purchased from the contractor is not at all the same good sold to final customers.
iv. In contrast to processing, the contractor under a factoryless arrangement, is expected to be more active on input markets and will as such face risks with respect to material input prices and holding inventories. These risks should under such conditions translate to higher profit margins of the contractor.
Alternatively, arguments supporting option (b) are:
i. The contractor never becomes the economic owner of the good being produced under a factoryless arrangement, because the contractor does not have the decision power to freely sell its output or to set its prices. The contractor assembles a good by strictly following the blueprints provided by the principal. The transaction between the contractor and the FGP is based on an off market price for a product that in reality has a greater value on account of the IPP services included in it, irrespective of the risk management involved on the contractor's part. In economic terms, the contractor’s output could more accurately be described as a manufacturing service encompassing material inputs. BPM6 (10.64) explains that manufacturing services may include the value of material inputs purchased by the contractor, even though this paragraph does not specifically address those cases where all material inputs are purchased by the contractor.
ii. As such FGPs fall nicely under the goods sent for processing arrangement which simplifies the overall picture of goods related global production arrangements, limiting them only to merchanting and processing cases.
iii. A good cannot be produced twice. The physical characteristics of the good are not altered by the FGP. This implies the transaction between the contractor and FGP resembles a manufacturing service.
Although there was no full agreement, the majority of the TFGP supported the recording of a transaction in goods (option (a) in paragraph 2.91) between the supplier and principal under a factoryless arrangement. This recording follows the logic that, in
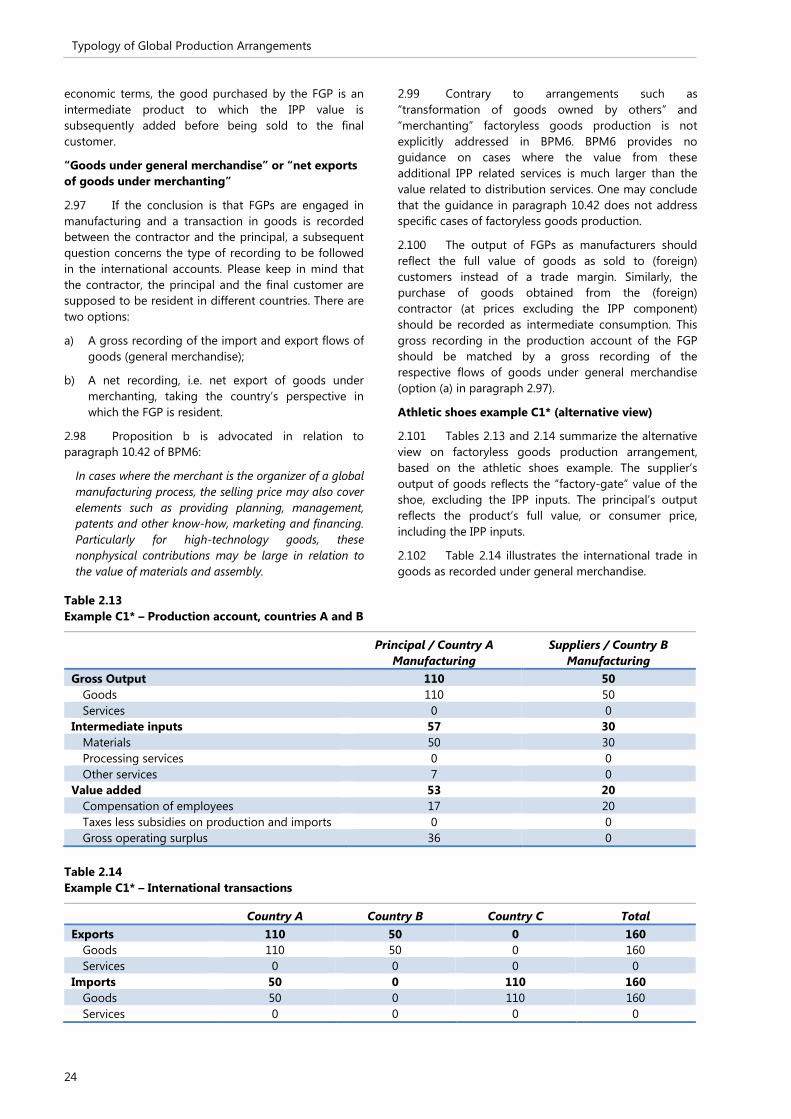
Typology of Global Production Arrangements
24
economic terms, the good purchased by the FGP is an intermediate product to which the IPP value is subsequently added before being sold to the final customer.
“Goods under general merchandise” or “net exports of goods under merchanting”
If the conclusion is that FGPs are engaged in manufacturing and a transaction in goods is recorded between the contractor and the principal, a subsequent question concerns the type of recording to be followed in the international accounts. Please keep in mind that the contractor, the principal and the final customer are supposed to be resident in different countries. There are two options:
a) A gross recording of the import and export flows of goods (general merchandise);
b) A net recording, i.e. net export of goods under merchanting, taking the country’s perspective in which the FGP is resident.
Proposition b is advocated in relation to paragraph 10.42 of BPM6:
In cases where the merchant is the organizer of a global manufacturing process, the selling price may also cover elements such as providing planning, management, patents and other know-how, marketing and financing. Particularly for high-technology goods, these nonphysical contributions may be large in relation to the value of materials and assembly.
Contrary to arrangements such as “transformation of goods owned by others” and “merchanting” factoryless goods production is not explicitly addressed in BPM6. BPM6 provides no guidance on cases where the value from these additional IPP related services is much larger than the value related to distribution services. One may conclude that the guidance in paragraph 10.42 does not address specific cases of factoryless goods production.
The output of FGPs as manufacturers should reflect the full value of goods as sold to (foreign) customers instead of a trade margin. Similarly, the purchase of goods obtained from the (foreign) contractor (at prices excluding the IPP component) should be recorded as intermediate consumption. This gross recording in the production account of the FGP should be matched by a gross recording of the respective flows of goods under general merchandise (option (a) in paragraph 2.97).
Athletic shoes example C1* (alternative view)
Tables 2.13 and 2.14 summarize the alternative view on factoryless goods production arrangement, based on the athletic shoes example. The supplier’s output of goods reflects the “factory-gate” value of the shoe, excluding the IPP inputs. The principal’s output reflects the product’s full value, or consumer price, including the IPP inputs.
Table 2.14 illustrates the international trade in goods as recorded under general merchandise.
Table 2.13 Example C1* – Production account, countries A and B
Principal / Country A Manufacturing
Suppliers / Country B Manufacturing
Gross Output 110 50 Goods 110 50 Services 0 0
Intermediate inputs 57 30 Materials 50 30 Processing services 0 0 Other services 7 0
Value added 53 20 Compensation of employees 17 20 Taxes less subsidies on production and imports 0 0 Gross operating surplus 36 0
Table 2.14 Example C1* – International transactions
Country A Country B Country C Total Exports 110 50 0 160
Goods 110 50 0 160 Services 0 0 0 0
Imports 50 0 110 160 Goods 50 0 110 160 Services 0 0 0 0

Typology of Global Production Arrangements
25
Increasing complexity of global production arrangements
Factoryless goods production arrangements may be difficult to identify and register in national accounts statistics, even though the example of a factoryless goods production arrangement presented above is rather straightforward. Real life examples can be more complex. For example, FGPs may locate their distribution activities in close connection to foreign consumer markets. Under such conditions it is possible that the turnover is no longer reported by the FGP but instead by their foreign affiliates responsible for wholesale and retail activities. This seriously complicates the identification of such FGPs as well as determining the accounting conventions that suit such more complex arrangements. These more complex arrangements are further elaborated below.
a) Factoryless goods production with a foreign distributor, manufacturing related turnover is reported in country A
The next example, as illustrated in the Tables 2.15 and 2.16, presents a case in which distribution activities are carried out, not by the principal but by a foreign affiliated company in the country in which the final products are sold to customers.
In the example, the principal is situated in country A, the contract producer in country B and the distributer in country C where the goods are brought to the consumers. The principal and distributer belong to the same (multinational) enterprise (company Y). The contract producer, on the other hand, represents an unaffiliated firm (company X).
The principal reports the turnover (85) from the manufacturing related activities at producers’ prices. This turnover includes the purchase of (intermediate) goods from the contract producer (50), a compensation for IPP inputs (30), production related services (3) and management costs (2).
The principal organizes its wholesale and retail activities via a foreign affiliated company situated in the direct neighbourhood of the consumer market in country C. The output of this foreign affiliate reflects a trade margin (25 = 110 - 85) which includes trade related service inputs (4), compensation of sales workers (15) and a profit on selling the shoe (6).
Assuming similar tax arrangements in the countries A and C, Company Y is indifferent about which country the turnover from wholesale and retail activities is being reported, as profits reported in country C will be appropriated by the parent in country A as returns on foreign investment.
Table 2.15 Production accounts
Country A Company Y
Principal
Country B Company X
Contract Manufacturer
Country C Company Y Distributor
Company Y Globally
Consolidated Accounts
Gross Output 85 50 25 110 Goods 85 50 0 85 Services 0 0 25 25
Intermediate inputs 53 30 4 57 Materials 50 30 0 50 Other services 3 0 4 7
Value added 32 20 21 53 Compensation of employees 2 20 15 17 Taxes less subsidies on production and imports 0 0 0 0 Gross operating surplus 30 0 6 36
Table 2.16 International transactions
Country A Country B Country C Exports 85 50 0
Goods 85 50 0 Services 0 0 0
Imports 50 0 85 Goods 50 0 85 Services 0 0 0

Typology of Global Production Arrangements
26
The example shows that offshoring the distribution related elements of the value added chain to a foreign affiliated company does not alter the role of the principal as an FGP. The Guide mentions that FGPs often combine value chain management and IPP related activities (e.g. research, product development) with trade related activities. But their characteristic activities are product development (e.g. providing the IPP inputs) and value chain management, and not trade.
Despite the several measurement challenges underscored in the Guide in connection to FGPs, the divergences of this arrangement compared with the “classic” factoryless goods production case, does not increasingly complicate the measurement and compilation issues for such FGPs. It could be argued whether or not the profit margin (6) should be entirely associated with the distribution activities in country C, but this is a rather minor issue. A crucial condition is that the entire manufacturing related output (as opposed to distribution related output) remains in the accounts of the FGP. This condition may not always hold.
b) Factoryless production with a foreign distributor, manufacturing related turnover is no longer reported in country A
The statistical observation of the factoryless goods production arrangement becomes critically complicated once the turnover is no longer reported at the level of the principal (in the previous example still identified as the FGP) in country A. This situation may occur when, driven by tax planning, turnover is only reported at the level of the foreign affiliated distributor in country C. Taking advantage of favourable tax arrangements the principal may prefer reporting the turnover and profits in country C instead of country A.
As the information on the existence of such arrangements was brought to the attention of the TFGP at a late stage of finalization of the Guide, practical examples could not be collected and analyzed in depth. This issue should be reviewed with priority in the future work on typology of global production arrangements and FGPs.
c) Goods sent for processing combined with a foreign distributor
Foreign affiliated distributors can also exist in combination with principals managing a goods sent abroad for processing arrangement. Under such conditions the principal is beyond doubt the economic owner of the processed goods prior to shipment of the goods to the distributor. It pays a processing fee and will be reporting the output of the processed goods in its production account. This implies a transaction in goods at producers’ prices takes place between the principal and the foreign affiliated distributor or the distributor could be paid a commission for sales/distribution services provided to the principal who retains ownership of the goods themselves. In other words, the problems
encountered above are not expected in relation to processing type of arrangements.
Conclusions and recommendations The stylized arrangements discussed and
illustrated in this chapter are simplified versions of actual global production arrangements that can be very elaborate. A MNE can consist of many units producing an array of products across several countries and the accompanying accounting relationships can be complex. In such situations the lines between the various types of production arrangements can become blurred.
The main objective of the typology is to support the proper breakdown of economic activities along the global supply chain on a country-by-country basis. Guidance on the recording of each type of global production arrangement is provided in the chapters that follow.
The following recommendations can be extracted from the discussions in Chapter 2:
a) Table 2.1 should be used as a “roadmap” to assist the translation of complex real life global production cases into recognizable schemes from which the main accounting principles can be derived. Updating this table is needed to keep track of newly emerging forms of global production arrangements, particularly in the area of services. The exploitation of natural resources (land, soil and fish stocks) in developing countries by MNEs is another area where further evidence should be obtained.
b) In the case of processing or manufacturing services on physical inputs owned by others (case A), the manufacturing service fee could include (substantial amounts of) cost of materials purchased by the processor. According to the current recommendations the processing arrangement refers to all processing done by a supplier on goods owned by others.
c) When the goods under ownership of an entity performing a merchanting function are subject to further transformation or processing, which changes the nature of the good, the transaction can no longer be recorded under merchanting. Instead the activity reflects manufacturing and the resulting recording falls under goods sent for processing.
d) FGPs control the supply chain, the blueprints of production, access to customers, trademarks and other sources of significant value embodied in the final output. The contractor generally only manages the processing activities by strictly following the specifications provided by the principal. A key characteristic of the contractual arrangement is the captive nature of the contractor. The contractor’s production activities cannot be undertaken without the blueprints provided by the principal. According

Typology of Global Production Arrangements
27
to the current standards, FGPs are presented as traders and their transactions are treated accordingly, but it is recommended that they are separately identified within respective ISIC classes.
e) Rules for identification of FGPs should be developed in close cooperation with classification and business register experts in order to allow for better analysis of their characteristics and testing the proposed accounting treatment. In this regard the following supplementary guidelines should be considered for future research:
• A principal that owns, or obtains a license to use and supplies IPP inputs but no material
inputs to a contractor but still manages (controls) the overall outcome of the production process can be seen as a type of manufacturer and could be classified accordingly. For example, it could be classified to the manufacturing industry in a separate subset of existing classifications that highlights the factoryless characteristics of the firm.
• A principal that supplies no IPP or other inputs (goods and services) to a contractor should be classified to trade.

Principles of economic ownership inside the multinational enterprise
29
Chapter 3 Principles of economic ownership inside the multinational enterprise Introduction 3.1 In the national accounts and the balance of payments statistics the recording of product transactions on the basis of economic ownership change is a fundamental principle. However, in the context of global production the identification of changes in the ownership of goods and assets can be quite a challenge to statistics compilers. This is particularly true for the globalized production activities of multinational enterprises (MNE). The entangled webs of MNE ownership structures, often spanning continents, can be a real challenge for statistics compilers, as it may not always be easy to breakdown these activities straightforwardly on a country-by-country basis.
3.2 National accounting requires that the value added of MNEs be properly assigned to individual national economies in which MNEs operate their business. Under these sometimes difficult circumstances, compilers have to make the best possible use of available accounting data that are usually prepared for another purpose i.e. to meet business accounting requirements rather than statistical ones.
3.3 The objective of this chapter is to explain how the output of MNEs is recorded on a country-by-country basis and how this may affect the recording of trading arrangements inside the MNE. Ownership relations may sometimes suggest that affiliated companies are not acting independently from their parents. The level of independence in their corporate behaviour determines whether or not an affiliated company is holding assets on its own behalf and is, therefore, engaged in economic transactions. Yet, the ECB/Eurostat/OECD Task Force report on Head Offices, Holding Companies and Special Purpose Entities recommends that entities with hardly any autonomy, and owned by non-residents, are always to be considered as separate institutional units by virtue of the fact that they are owned by non-residents.
3.4 Consequently economic statisticians reviewing the global production chains of MNEs are concerned with the following aspects of ownership:
a) Ownership of the MNE structure of subsidiaries, associates and other affiliates;
b) Ownership of the output of goods and services produced along the global value chain;
c) Ownership of assets within MNE.
3.5 The next section reviews the guidance given in the international statistical standards. The following one discusses related aspects of the international business accounting standards. This will help clarify the statistical information that can be obtained from companies and whether or not this information has a similar conceptual basis to the national accounts and balance of payments. The final section in this chapter discusses a number of specific complex case studies.
3.6 Chapter 4 discusses the specifics of intellectual property product (IPP) ownership and IPP related transactions inside the MNE, so these IPP specific issues are not dealt with in this chapter.
Guidance in the international statistical standards 3.7 MNEs usually consist of several entities that are spread over a range of countries. The identification of separate units by country of residence, together with their production activities, is fundamental for calculating gross domestic product (GDP) for each of these related countries. In reality these units and their activities may be highly integrated and the related transactions may be difficult to assign to each of these individual units. This can be a real challenge for statistics compilers. In some cases these units would not stand the test of an institutional unit if the MNE’s activities were concentrated in only one economic territory.
3.8 Undoubtedly these units need to be separately identified as they are required to assign production to individual countries, which is crucial for measuring GDP. However, as a result of control and ownership relationships, the reported transactions between the parents and foreign units, and between the affiliated units of an MNE, should be recorded with great care as these may not reflect market transactions at arm’s length and may as a result give a distorted or incomplete reflection of affairs.
Ownership relationships inside the MNE
3.9 Ownership structures of MNEs can be viewed in a foreign direct investment (FDI) framework. This

Principles of economic ownership inside the multinational enterprise
30
framework is developed to assist the compilers of FDI statistics. FDI is a category of cross border investment associated with a resident in one economy having control or influence on the management of an enterprise that is resident in another economy. Effectively this means FDI can be used to identify how an MNE controls the overall global production process. The global ownership chain of an MNE is termed the Foreign Direct Investment Relationship (FDIR) which is illustrated in Box 6.1 of the Balance of Payment and International Investment Position Manual (BPM), sixth edition. This FDIR framework captures the globalised activities of MNEs in relation to ownership of equity capital, inter-affiliate lending and related financial transactions. The example of an FDIR set out in this box shows chains that consist of (see also the System of National Accounts 2008 (2008 SNA), Chapter 4, Section B):
a) Subsidiaries, where the owner holds more than 50 per cent of the equity;
b) Associates, ownership between 10 and 50 per cent of the equity.
3.10 It is important to note that transfer of ownership of goods and services together with some asset categories within MNEs fall outside the scope of FDI statistics. Another source that can be examined to obtain a better understanding of MNE structures and relationships is Foreign Affiliates Statistics (FATS). FDI variables are ordinarily compiled with respect to transactions and positions with all foreign affiliates whereas FATS measures (e.g. on turnover, employment, value added, exports and imports and number of enterprises)are to be compiled only with respect to affiliates in which the direct investor holds a controlling interest. FATS may be produced for both foreign-controlled enterprises (inward FATS) in the compiling economy and foreign affiliates controlled by the compiling economy (outward FATS). FATS can be important for the analysis of the performance of domestically and foreign controlled enterprises, both in absolute terms and relative to the larger domestic and foreign universes of enterprises. Data on transactions in goods and services with both residents and non-residents can provide an additional perspective to balance of payments data.
Direct investment relationships versus ownership of output and assets
3.11 Investment relationships are a relevant factor when determining economic ownership of output and the assets (including IPPs) used in production inside the MNE. An extreme view is that because the parent is the ultimate owner, all movements of products and assets between companies or branches inside the FDIR do not really represent transactions based on a change of ownership. Change in ownership means that a unit inside an MNE assumes the responsibility in terms of risks and rewards of the goods and assets delivered to it.
3.12 Following the 2008 SNA and BPM6, an institutional unit is capable of owning assets, incurring liabilities and engaging in economic activities and in transactions with other entities. It is also able to take economic decisions and engage in economic activities for which it is itself held to be directly responsible and legally accountable. Because they have legal responsibility for their actions institutional units are centres of decision making for all aspects of economic behaviour. Such a unit must also compile a complete set of accounts including a balance sheet of assets and liabilities.
3.13 Either a complete set of accounts, including a balance sheet, already exists for the unit, or it would be possible and meaningful, from both an economic and legal viewpoint, to compile such accounts if they were required. This requirement also applies to non-resident or cross border branches. These entities are recognized as institutional units when their activities can be separately identified.
3.14 The 2008 SNA explains that even subsidiaries that are wholly owned by other corporations are separate legal entities that are required by law and the tax authorities to produce complete sets of accounts, including balance sheets. Although the management of a subsidiary corporation may be subject to the control of another corporation, it remains responsible and accountable for the conduct of its own production activities.
3.15 One may conclude that in practice this latter criterion will often prevail. Autonomy is in many cases assumed to exist where an entity can compile or make a separate set of accounts including a balance sheet. As practical guidance BPM6 (paragraph 3.42 and paragraph 10.24) suggests the timing of a change in economic ownership can be approximated at the moment the parties record the transaction in their books or accounts.
3.16 Accordingly, the 2008 SNA (paragraph 4.51) indicates that each individual corporation should be treated as a separate institutional unit, whether or not it forms part of a group, even if they are wholly owned by other corporations. Separate units may be needed for de facto institutional units such as branches (foreign operations without separate legal form), large construction projects and foreign owners of real estate and natural resources. BPM6 (paragraph 4.20) explains that because the focus of macro-economic statistics is on a single economy, a legal entity may be split into separate institutional units for statistical purposes. This step is taken because each of the parts has such a strong connection with the economic territory in which it is located that it should be considered as part of that economy.
3.17 In conclusion, MNE affiliates are to various degrees controlled by their parent and their autonomy in terms of decision making may vary from one case to another. As such, legal ownership of assets and liabilities

Principles of economic ownership inside the multinational enterprise
31
as opposed to economic ownership (and autonomous behaviour) do not necessarily coincide. In practice the nature of ownership is often legal and is used to organize the collection and presentation of statistics because it provides the best framework or source. The observation of legal (and taxable) entities is usually the point of departure for setting up accounts for production, value added and balance sheets. However, the nature of the transactions these units undertake are not always that easily understood and may be at odds with the principles of economic substance and ownership.
Legal versus economic ownership
3.18 Ownership can take the form of legal or economic ownership. Economic and legal ownership often coincide, apart from a few examples such as finance leasing and repurchase agreements. In those specific cases, the legal owner transfers to the economic owner both responsibilities for the risks involved in using a leased or repurchased asset and the associated benefits. In cases where economic and legal ownership diverge, economic ownership is the required recording in the SNA.
3.19 Paragraph 3.26 of the 2008 SNA defines economic ownership as follows: “The economic owner of entities such as goods and services, natural resources, financial assets and liabilities is the institutional unit
entitled to claim the benefits associated with the use of the entity in question in the course of an economic activity by virtue of accepting the associated risks.”
3.20 The assessment of who claims the benefits and bears the risk associated with economic ownership may not be straightforward in the context of MNEs because, as it is ultimately the parent that obtains the returns generated by its affiliates. Usually this income will flow back to the parent as dividends or reinvested earnings on FDI. Similarly, any risk of commercial failure or holding losses coinciding with the economic operations of a subsidiary will eventually affect the financial position of the parent.
3.21 In the context of MNEs, the 2008 SNA definition provides further guidance as the phrase “…with the use of the entity in question in the course of an economic activity…” in paragraph 3.19 above seems to imply that the benefits associated with the asset in question should show up in the generation of income account of the economic owner. In other words, it is the economic owner that uses the asset in its production process. For most assets this (minor) clarification will provide sufficient guidance for applying the principles of economic ownership inside MNE groups. However, for IPPs additional clarification may still be needed and this is given in Chapter 4.
Country case study 3.1 Legal versus economic ownership
This case study shows a company that obtains legal ownership of goods without becoming the economic owner.
A Dutch company B is a wholesaler in pharmaceutical products. The ultimate controlling institutional unit is resident in the United States (U.S.). The Dutch enterprise is the legal and not the economic owner of the goods it obtains. This reality is underlined by the company itself. Annual company reports of company B explain that “Most inventories held in the Netherlands are for risk and account of those parties holding the intellectual rights of the products”. In case of damage of the products or unpaid receivables, the intellectual property holders in either the U.S. or United Kingdom (UK) compensate company B for these losses. This implies economic ownership of these inventories is situated with the intellectual property holders in either the U.S. or the UK but not with company B.
The goods are shipped to B from either Puerto Rico or Spain. In Spain raw materials are converted to intermediate products. The company in Spain obtains a processing fee from the economic owners in the UK or the U.S. Shipment of these goods to company B in the Netherlands coincides with a transfer of legal ownership from the intellectual property holders to company B. In other words, intra-group transactions of the goods are being observed. The key question is whether or not these transactions must be recorded as an import of goods from the perspective of the Netherlands.
At the same time from Puerto Rico raw materials are also shipped via the Dutch airport Schiphol to Germany at which stage legal ownership of these shipped goods is transferred by the intellectual property holders to company B in the Netherlands. Company B receives an invoice from the intellectual property holders for the transferred goods. The raw materials are changed to intermediate products by a German manufacturer (legal ownership remains in the Netherlands) who obtains a processing fee from company B for the industrial services provided.
The final goods are sold to either the economic owner in the U.S. or to yet another affiliated company in the Netherlands. In both cases company B transfers legal ownership and the turnover obtained from the sales of the final goods.
Company B has an “Advanced Pricing Arrangement” with the Dutch tax authorities. According to this agreement the company is required to pay income taxes, at the legal rate, based on a percentage of its operational costs. The company is not responsible for setting inter-company prices nor for serving third-party customers. Such arrangements are carried out by the economic owner in the U.S. and the UK. The purchase prices vary substantially over the years.

Principles of economic ownership inside the multinational enterprise
32
It is concluded that goods handled by company B in the Netherlands are not economically owned by this company. As a result these flows of goods should not show up in structural business statistics in terms of purchases and sales. An agreement with company B was made to report on the gross margin as a proxy of net revenue. For the merchanting trade statistics no adjustments were made. However, in the national accounts and balance of payments additional adjustment are needed to remove these flows of goods from imports and exports which are not subject to economic transactions. In addition it was decided to change the International Standard Industrial Classification of All Economic Activities (ISIC) code of company B from wholesale to intra-group supporting services.
Recording intra-group imports and exports
3.22 Once issues around economic ownership of output inside the MNE are settled, a next step is recording the transactions between the various units active in the MNE. The typology presented in Chapter 2 gives further guidance on how MNEs organize their value chains. Figure 3.1 provides an overview of the most common arrangements inside the MNE and the corresponding intra-company flows. The figure should help in clarifying which unit controls the various parts of the value added chain and the nature of the transactions between the two identified parties. For simplicity the picture ignores the purchases of raw materials (from unaffiliated companies) and the sales of manufactured products outside the MNE group. Obviously a value chain with a mix of different types of arrangements further complicates the picture and the compilation of
the accounts for all affiliated companies. Such a real life case is discussed later on in this section.
3.23 The MNE presented in Figure 3.1 consists of a parent company X in country A and an affiliated company Y in country B. Their roles in the production chain depend on the type of global production arrangement. The numbers are taken from the athletic shoe example presented in Chapter 2, Table 2.2. Figure 3.1 reflects the situation in which companies X and Y are both, in one way or another, engaged in athletic shoes manufacturing.
3.24 Case A in Figure 3.1 presents the goods for processing example. The processing activities are carried out by affiliate Y in country B. The material inputs (30) are purchased by company X and shipped to company Y. The processing fee contains the compensation of employees (20). The total output of the athletic shoes (110) is recorded in the accounts of parent company X.
Figure 3.1 Overview of intra-group flows
Country A Parent company X (Principal, output= 110)
A. Goods sent abroad for processing; Transformation of materials by Y owned by X
Country B Foreign affiliated company Y (Processor, output =20)
30
50
20
B. Merchanting by X of a good produced by Y
Country A Parent company X (Merchant, output=25, trade margin)
Country B Foreign affiliated company Y (Manufacturer, output=85)
85
C. Factoryless producer X and contract producer Y*
Country A Parent company X (Factoryless producer, output=60 (or 110)*
50 Country B Foreign affiliated company Y (Contractor, output=50)
G. Direct investment relationship with X acting as head office**
Country A Parent company X (Head office, output=2)
Country B Foreign affiliated company Y (Manufacturer and trader, output=110)
2
Physical movement of goods
*) The principal’s output is 60 under current accounting rules and 110 when following the alternative recording method presented in Chapter 2. **) In this example the parent is engaged in production by providing managerial services which makes this example a little bit different from the standard case (G) as presented in Table 2.1.
Purchase (and export) of a good
Purchase (and export) of a service

Principles of economic ownership inside the multinational enterprise
33
3.25 In the merchant example, case B, all manufacturing activities are carried out under the responsibility and control of company Y. The parent acts as a trader by purchasing the complete athletic shoes from company Y at the factory gate price (85) and selling it to customers abroad. Its output is a trade margin (25) consisting of compensation of sales workers (15), services associated with sales (4) and sales profits (6). Company X will sell the shoe to foreign costumers at a sales price of 110. Please be aware that the required IPP’s, for the midsole that cushions and protects the feet of athletes, are in the hands of company Y.
3.26 This situation changes substantially when moving to case C where company X owns the IPP’s and acts as a factoryless goods producer (FGP). One can directly see that the difference in the intra-group sales value of the product represents the return to intellectual property (30), which is now included in the output of company X. However, the output of company X will completely change if the alternative recommendations in Chapter 2 are followed.
3.27 The fourth example does not fully comply with the pure direct investment case (G) as presented in Chapter 2, Table 2.1. Besides the FDI relationship between companies X and Y, the parent, company X, carries out some managerial activities (2) on behalf of its foreign affiliated company Y. The latter is responsible for
all other production activities. This makes company Y, similar to situation B, an independent producer of the goods. However, under the latter arrangement company Y is also responsible for all trading activities. A small amount of managerial services are obtained from company X.
3.28 Whether such intra-group service flows are easily captured in international trade in services statistics largely depends on the type of funding mechanism (direct or indirect) applied by the MNE. In all cases the profits of company Y will be earned by the parent as a return on FDI. The use of proper cost attribution methods is most of all an issue for the tax authorities (and statistics compilers).
3.29 It should be noted that the global production arrangements inside MNEs may be tax driven rather than benefiting from the competitive advantages of countries. Under such conditions, the supposed transactions between units inside the MNE should be observed carefully as the legal transfer of goods and assets inside the MNE may not necessarily reflect actual economic operation of the MNE’s global production. This often requires a case-by-case analysis as these arrangements can have unique features. Country case studies 3.1- 3.3 emphasize the need of a case-by-case approach.
Country case study 3.2 Production chain that combines processing with merchanting
This case study illustrates the production chain of an MNE with activities spread over the U.S. and several European Union (EU) member countries. The enterprise serves customers in Europe, the Middle East and Africa (EMEA). The example illustrates the difficult task to determine the controlling units in a value added chain and the nature of transactions taking place, also given that the parent is the ultimate owner of all affiliates. All the items being transacted remain within the group. Because transactions are observed and recorded in a fragmented way and by different national statistical institutes (NSI), full clarity may not always be achieved. Combining the efforts of NSIs to obtain the full picture of the MNE is advisable.
A careful consideration of control and risk management regarding e.g. inventories, accidents and theft is required to identify the economic owners of the various production stages of the chain. The accounts and balance sheets of units operating inside the chain may give further guidance. A key point in this example is that economic ownership of the goods does not follow the vertical steps in the production chain between the affiliates. Instead there is a huge divergence between economic ownership of inputs and (semi produced) products on the one hand, and the physical flow of goods on the other. Contract manufacturers located in France, Germany and the UK provide processing services to a Dutch principal that is responsible for the purchasing of raw materials from the United States. So each of these affiliates is engaged in providing manufacturing services on physical inputs owned by the Dutch principal. The latter retains ownership of inputs and outputs at all stages of the production process.
The shipment of raw materials and semi manufactured goods should not appear as imports or exports in the national accounts and balance of payments of either France, Germany or the UK. The raw materials are purchased and imported by the principal in the Netherlands. This latter also imports processing services from the contract producers in France, Germany and the UK. All trade related activities are arranged by a trader from Ireland. This company purchases the finalized goods at factory gate prices from the manufacturer in the Netherlands which is the owner of the output. The Irish merchant sells the goods to the customers in EMEA. Its output represents the trade (wholesale and retail) margins.
The combination of industrial processing and merchanting complicates the breakdown of economic activities, particularly because the physical movements of goods go in a different direction than the ownership changes and corresponding transactions. This requires a range of adjustments in merchandise trade statistics in order to make them suitable for balance of payments and national accounts compilations. The introduction of industrial processing and
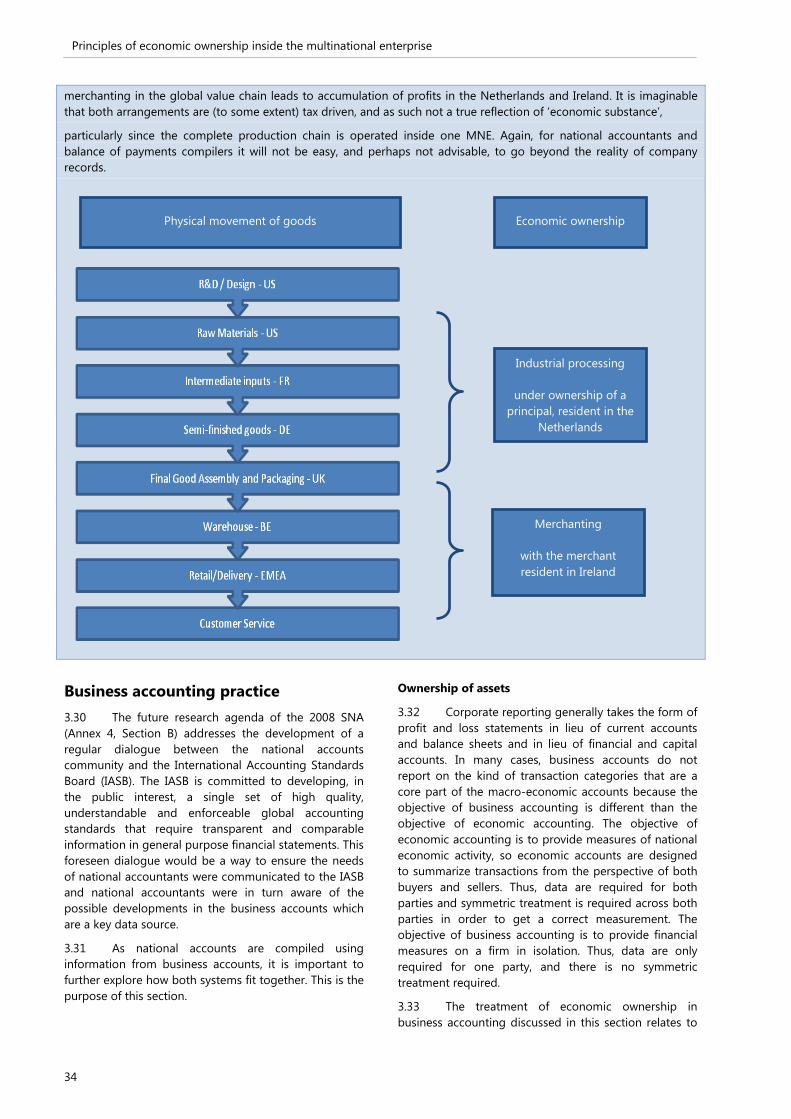
Principles of economic ownership inside the multinational enterprise
34
merchanting in the global value chain leads to accumulation of profits in the Netherlands and Ireland. It is imaginable that both arrangements are (to some extent) tax driven, and as such not a true reflection of ‘economic substance’,
particularly since the complete production chain is operated inside one MNE. Again, for national accountants and balance of payments compilers it will not be easy, and perhaps not advisable, to go beyond the reality of company records.
Business accounting practice
3.30 The future research agenda of the 2008 SNA (Annex 4, Section B) addresses the development of a regular dialogue between the national accounts community and the International Accounting Standards Board (IASB). The IASB is committed to developing, in the public interest, a single set of high quality, understandable and enforceable global accounting standards that require transparent and comparable information in general purpose financial statements. This foreseen dialogue would be a way to ensure the needs of national accountants were communicated to the IASB and national accountants were in turn aware of the possible developments in the business accounts which are a key data source.
3.31 As national accounts are compiled using information from business accounts, it is important to further explore how both systems fit together. This is the purpose of this section.
Ownership of assets
3.32 Corporate reporting generally takes the form of profit and loss statements in lieu of current accounts and balance sheets and in lieu of financial and capital accounts. In many cases, business accounts do not report on the kind of transaction categories that are a core part of the macro-economic accounts because the objective of business accounting is different than the objective of economic accounting. The objective of economic accounting is to provide measures of national economic activity, so economic accounts are designed to summarize transactions from the perspective of both buyers and sellers. Thus, data are required for both parties and symmetric treatment is required across both parties in order to get a correct measurement. The objective of business accounting is to provide financial measures on a firm in isolation. Thus, data are only required for one party, and there is no symmetric treatment required.
3.33 The treatment of economic ownership in business accounting discussed in this section relates to
Industrial processing
under ownership of a principal, resident in the
Netherlands
Merchanting
with the merchant resident in Ireland
Economic ownership Physical movement of goods

Principles of economic ownership inside the multinational enterprise
35
both principles based and rules based systems of accounts. Corporate financial reporting in the U.S. follows a rules based system termed U.S. Generally Accepted Accounting Principles (GAAP). In the case of the IASB the system of International Accounting Standards (IAS) along with United Kingdom (UK) GAAP are principles based. The inherent characteristic of a principles-based framework is the potential for different interpretations of similar transactions.12
3.34 In the UK GAAP a standard called Financial Reporting Standard (FRS) 5 requires accounts to reflect the substance of a transaction rather than its legal form where this is different. For example, in the associated reporting guidance it is mentioned that a company may sell (or transfer legal title to) an asset and enter into a concurrent agreement to repurchase the asset at sales price plus interest. The asset may remain on the premises of the seller and continue to be used in its business. In such a case the company continues to enjoy the economic benefit of the asset and to be exposed to the principal risks inherent in those benefits. FRS 5 requires that the asset continues to be reported as an asset of the seller, notwithstanding the transfer of legal title, and that a liability is recognized for the sellers’ obligation to repay the sales plus interest.
3.35 IAS 8 states that for information to be reliable it must be reported in accordance with economic substance rather than strictly in adherence to its legal form. It could be said that if material transactions are not accounted for in accordance with their substance it is doubtful whether the accounts present a true and fair view. Indeed IAS 1 (paragraph 19) requires an item to depart from the accounting standard if it does not represent faithfully the transactions. In IAS 17 (Leases, paragraph 4) a financial lease is defined as a lease that transfers substantially all the risks and rewards incidental to ownership of an asset. This results in recognition of the economic owner of the asset rather than the legal owner.
3.36 In the case of intangible assets IAS 38 provides the guidance for accountants. The guidance and recording centres on asset recognition to determine which intangible assets are to be reported in a company’s accounts. The accounting standard sets out the recognition criteria as follows.
3.37 The intangible asset is only recognized if and only if:
a) It is separable i.e. it is capable of being separated and sold, transferred, licensed, rented or exchanged, or;
12 Differences Between International Financial Reporting Standards (IFRS) and U.S. GAAP are summarised and can be found at http://www.ifrs.com/overview/General/differences.html
b) It arises from contractual or other legal rights regardless of whether these rights are transferable or separable from the entity or from other rights and obligations.
3.38 Intangible assets are understood to include computer software, patents, copyrights, licenses etc. So the treatment is aimed at IPPs but not necessarily IPPs as defined in the 2008 SNA.
3.39 In the 2008 SNA IPPs are described as being the result of research and development (R&D), investigation or innovation leading to knowledge that the developers can market or use to their own benefit in production because uses of the knowledge is restricted by means of legal or other protection. The basis for recognition of an IPP in the 2008 SNA is wider than business accounting rules. In particular, the 2008 SNA recommends capitalizing expenditures related to IPPs in some cases where business accounting rules require immediate expensing of the same expenditures. For example, R&D expenditures are recognized as assets under the 2008 SNA but are often expensed as incurred under current business accounting practice. As a logical consequence, business accounts will not necessarily cover all IPPs that need to be recorded in the national accounts. In the case of R&D, no R&D assets are recorded in the balance sheet of business accounts. Additionally operating income and net income are generally lower in the profit and loss statement because R&D expenditures are immediately expensed. This is not to say that the results of R&D that are embodied in some legal form, such as patents and trademarks, are not recognized as assets under business accounting. In contrast, R&D assets are recorded in the capital account of the 2008 SNA based on production costs if no other measures of output are available, which yields a higher value added and operating surplus than if R&D was treated as intermediate consumption.
Transfer pricing
3.40 The Organisation for Economic Co-operation and Development (OECD) (2010) guidance on transfer pricing13 introduced a series of guidelines that may assist MNEs and national tax authorities in using transfer prices to value intra-firm transactions and to evaluate their appropriateness for taxation purposes. The guidelines insist that intra-firm transactions are priced, as far as possible, like arm’s length transactions between unrelated third parties. The guidelines give recommendations on how these intra-firm transactions can be analyzed to determine if they meet these requirements. These recommendations cover comparable measures of profits or comparable measures of costs to be used in assessing transactions between firms.
13 Transfer Pricing Guidelines for Multinational Enterprises and Tax Administrations: www.oecd.org/ctp/transfer-pricing/transfer-pricing-guidelines.htm
Principles of economic ownership inside the multinational enterprise
36
3.41 In this context recent developments at OECD have resulted in a series of steps to be followed by member countries to limit the impact of Base Erosion and Profit Shifting (BEPS)14. These steps will require transparency, exchange of information between taxation authorities and general cooperation to ensure the arm’s length principle is followed in transactions between entities in an MNE group.
3.42 Nevertheless, distortions in the use of the arm’s length principle are not always tax driven. The 2008 SNA (paragraph 3.133) explains that the exchange of goods between affiliated enterprises may often be one that does not occur between independent parties (for example, specialized components that are usable only when incorporated in a finished product). Similarly, the exchange of services, such as management services and technical know-how, may have no near equivalents in the types of transactions in services that usually take place between independent parties. Thus, for transactions between affiliated parties, the determination of values comparable to market values may be difficult, and compilers may have no choice other than to accept valuations based on explicit costs incurred in production or any other values assigned by the enterprise.
3.43 The 2008 SNA explains that replacing book values based on transfer pricing with market value equivalents is perhaps desirable in principle but is an exercise calling for cautious and informed judgment. One would expect such adjustments to be enforced in the first place by the tax authorities.
Intra-group services
3.44 MNEs may include supporting units, or so-called group shared services centres, such as headquarters and R&D centres that provide supporting services to the entire enterprise group. Such services may also be provided by the parent enterprise. The activities that are centralised depend on the kind of business and on the organizational structure of the group, but in general they may include administrative services such as planning, coordination, budgetary control, financial services and advice, accounting, auditing, legal, factoring, computer services, buying, distribution, marketing and services in staff matters such as recruitment and training (OECD Transfer Pricing Guidelines, 2010).
3.45 Group service centres also may carry out R&D or administer and protect intangible property for all or part of the MNE group. These types of activities typically will be considered intra-group services because they are the type of activities that independent enterprises would have been willing to pay for or to perform for themselves.
14 http://www.oecd.org/tax/beps.htm
3.46 Several of these activities fall within the scope of an ancillary activity as defined in the 2008 SNA (paragraph 5.36). An ancillary activity as undertaken within an enterprise creates the conditions within which the principal or secondary activities can be carried out. When the production of an enterprise takes place in two or more different establishments, certain ancillary activities may be centralized for the benefit of all the establishments collectively. Under such conditions these ancillary activities may need to be separately identified as output. But this is not advocated by the 2008 SNA as a general principle. In cases where certain ancillary activities of an MNE are centred in one country, a separate institutional unit may need to be identified to account for its output.
3.47 There are at least two issues in the analysis of intra-group services. One issue is whether intra-group services have in fact been provided. The other issue is whether the intra-group charge for such services for national accounting purposes is in accordance with the arm’s length principle. The OECD Transfer Pricing Guidelines (Chapter VII, Intra-group service) provide such guidance, particularly for MNEs and tax authorities, but may be equally relevant for macro-economic statistics.
3.48 Under the arm’s length principle, the question of whether an intra-group service has been rendered depends on whether the service enhances the company’s commercial position. This can be determined by considering whether an independent enterprise in comparable circumstances would have been willing to pay for the service. So-called “shareholder activities” such as activities relating to the juridical structure or meetings of shareholders of the parent would not justify a charge to the recipient companies. However, most services mentioned above fall within the scope of the arm’s length principle because they are the type of activities that independent enterprises would have been willing to pay for or to perform for themselves.
3.49 The (allowable) funding mechanisms of intra-group services may vary. The fact that a payment was made to an associated enterprise for purported services can be useful in determining whether services were in fact provided. But a description of a payment such as “management fees” does not necessarily mean that such services have been rendered. At the same time, the absence of payments or contractual agreements does not automatically lead to the conclusion that no intra-group services have been rendered.
3.50 For national accountants and representatives of tax administrations alike, direct-charge methods are of great practical convenience. Such a method is particularly applicable in situations in which intra-group services are provided on demand to an intra-group customer. In other cases, indirect charge methods may be necessary, for example due to the nature of the service being provided. One example is where the proportion of the value of the services rendered to the

Principles of economic ownership inside the multinational enterprise
37
various relevant entities cannot be quantified, except on an approximate or estimated basis. Applied proxy indicators may be turnover or staff size of the beneficiary affiliates. Such indicators should preferably relate to benefits obtained by these affiliated companies.
3.51 The international macro-economic statistics guidelines do not provide extensive guidance on the recording of intra-group services. Concerning services transactions between related affiliated enterprises, the Manual on Statistics of International Trade in Services (MSITS) 2010 (paragraph 3.56) mentions that separate information on the value of all transactions between affiliated enterprises is helpful in understanding the degree to which globalization of services supply is taking place. Services for the general management of a branch, subsidiary or associate provided by a parent enterprise or other affiliated enterprise are often headed under the category “legal, accounting, management consulting and public relations services”. However, reimbursements of ancillary services supplied by affiliated enterprises, such as transport, purchasing, sales and marketing and computing, should be shown under the relevant specific headings.
3.52 MSITS 2010 does not really address the measurement challenges. The discussion in this chapter suggests some supplementary recommendations for MSITS might be necessary. In MSITS it is advisable to explicitly address the reporting of intra-group services in international trade in services surveys, depending of course on the relative size of MNE activities and related output or consumption of intra-group services. One may ask respondents (of MNE affiliated companies) to report payments as contributions from affiliated enterprises for
management services, which are not reported under any other heading. A separate recording of intra-group services may also help detect distortions such as disguised reporting on dividend payments or cost redistributions which seem unrelated or disproportional to the services provided.
3.53 A supplementary approach may be followed in the business surveys sent to head offices. As the output of head offices may include services provided to group members, the survey design may be adapted to this situation. For example the survey may explicitly ask for services provided to foreign affiliated companies or ask for cost redistributions for services provided for the MNE group as a whole. Similarly, the business surveys sent to affiliated companies may include questions on the charges for intra-group services.
A selection of complex cases 3.54 The 2008 SNA, paragraph 26.21, points out that there are no longer any exceptions to the recording of imports and exports based on the change of economic ownership principle. This section discusses a few examples in which the recording of international product flows based on a change in economic ownership principle may turn out to be challenging when it comes to accounting practice.
Special Purpose Entities
3.55 The concept of economic ownership (in contrast to legal ownership) requires additional consideration in the context of so-called special purpose entities (SPE). SPEs are explained in detail in the report of the ECB/Eurostat/OECD Task Force on Head Offices,
Country case study 3.3 Changing invoicing arrangements inside MNEs
The case study illustrates that seemingly insignificant changes in invoicing methods inside MNEs may have large effects on national accounts and balance of payments.
An enterprise has its headquarters in country A where it is classified under wholesale trade (ISIC 46). The MNE has several foreign affiliates in a range of countries. The MNE sells consumer products, designed in country A. Manufacturing is carried out by unaffiliated (contract) producers spread over several countries. The headquarters own and control the design of the consumer products.
The NSI in country A discovered that the MNE changed its reporting method. From a certain point in time the MNE started to report high amounts of goods acquired and sold under merchanting. The reason was that they had reorganized their activities. The size of global production (the sum of retail and wholesale margins) did not change much, but the margins reported in country A increased substantially.
Before the reorganization the foreign affiliates purchased the products directly from manufacturers which were sold at local consumer markets. Profits obtained by foreign affiliates largely returned to headquarters as property income. Local inventories were managed by the foreign affiliates.
After the reorganization, a new unit was created in country A which was made responsible for product design and managing relations with contract producers. This new unit also became the owner of all inventories and is engaged in selling the products to the foreign affiliates as well as to domestic retailers. This means that a large part of the wholesale and retails margins, earlier representing output of foreign affiliates, is all of a sudden reported by the new unit in country A. As a result, property income flows, i.e. the returns on FDI, diminished substantially. This organizational change led to substantially increased net export of goods under merchanting and also resulted in a substantial upward adjustment of GDP. However, gross national income (GNI) did not change very much from the old to the new situation.
Principles of economic ownership inside the multinational enterprise
38
Holding Companies and Special Purpose Entities. SPEs are formally registered with a national authority and subject to fiscal and other legal obligations of the economy in which they are resident. SPEs are often controlled by a non-resident parent. They have little physical presence and few or no employees. Practically, all assets and liabilities on the balance sheet of SPEs are foreign investments and their core business consists of group financing or holding activities, i.e. channelling of funds from non-residents to other non-residents. SPEs are hardly engaged in production and are sometimes described as being on “auto-pilot”.
3.56 According to the 2008 SNA (paragraph 4.56) SPEs often do not own non-financial assets. However, the Globalization Guide explains that entities with the above mentioned characteristics may be the legal holders of IPPs. Such IPP holding SPEs are also called ‘royalty and licensing companies’. Consequently, the Task Force on Head Offices, Holding Companies and Special Purpose Entities confirmed that such units could have non-financial assets on their balance sheets. Their main purpose is to concentrate the receipts from intellectual property (e.g. IPPs, trademarks), usually on behalf of an MNE, and they are generally created to benefit from tax advantages by transferring legal ownership of intellectual property (and their returns) to a low tax country. It is difficult to consider these units as autonomous given that their operation and management will in all likelihood be limited to bank account transactions where the receipts from royalties or similar intellectual property related services are recorded.
3.57 In other words, while legal ownership of intellectual property is assigned to these royalty and licensing companies, one may argue that economic ownership in fact has not changed and is still situated with the parent. Nevertheless, the guidance on the treatment of IPP holding SPEs in the 2008 SNA does not differentiate between these entities and other SPEs. They are recognized as a separate institutional unit when they are resident in a different economic territory from that of their parent.
3.58 The rationale behind this treatment is clearly a pragmatic one. The income generated by an SPE is subject to the tax code of its country of residence and this fact cannot be ignored. If (economic) ownership of the IPP was not assigned to the SPE in question a considerable amount of rerouting of transactions and related financial flows would be necessary. In general, the 2008 SNA does not encourage such imputations, probably because of the risk of asymmetries, as approaches may diverge between countries. However, leaving economic ownership of IPPs with the SPE may also lead to asymmetries. Lipsey (2010) introduces in this context the notion of “phantom imports” referring to services that are domestically produced but attributed by MNEs to SPEs in low tax countries. The latter group of countries may not necessarily report the corresponding
export of IPP services in their balance of payments. The issue of IPP holding SPEs is further discussed in Chapter 4.
Prorating the activities of multiterritory enterprises
3.59 A legal entity may be split when it has substantial and long lasting operations in two or more economies. Such entities are addressed as multiterritory enterprises. This artificial split may be needed when following the residence principle in economic accounting as the value added needs to be attributed to countries in which these multiterritory enterprises are active. However, this distribution of activities on the basis of “prorating” and the creation of “notional units” may have implications for the recording of international flows of goods connected to these multiterritory operations. The international transfer of goods and assets between the units in the different countries may need to be recorded as being subject to a transaction. However, such imputations do not necessarily build on the recording of imports and exports on a transfer of ownership basis as recommended in the 2008 SNA. The recommendation is to carry out these types of prorating in a harmonized way, as a joint effort of the NSIs of the concerned countries that need to take into account their share in the business of multiterritory enterprises. Such approaches, and related practical guidance, are provided in Chapter 8.
Large foreign construction projects
3.60 A related example is that of large foreign construction projects which equally require the establishment of a notional unit in the country in which the construction project is being carried out. The typology of global production arrangements in Chapter 2 does not explicitly refer to construction. However, carrying out construction projects outside the domestic territory could be considered a form of global production that may bring about conceptual and measurement challenges.
3.61 Regarding international construction and related activities, the international guidelines could be summarized as follows:
a) For substantial construction projects abroad (that take more than one year to finalize) the 2008 SNA and BPM6 recommend the use of notional units in the economy where these projects are carried out.
b) In the case of small projects (with the duration of less than one year), the creation of a notional unit is not required and the production is supposed to be carried out in the resident economy of the construction firm.
c) BPM6 provides detailed guidance on how related import and export flows must be recorded and classified. In case of smaller (less than one year) projects, BPM6 (paragraph 10.102) recommends that acquisition of goods and services by the enterprise undertaking that construction work from

Principles of economic ownership inside the multinational enterprise
39
the economy of location of the construction work is recorded under construction. Goods and services obtained from third countries must be classified according to the characteristics of these goods and services.
3.62 The recording of construction projects abroad includes the following four possible cases:
a) A domestic company undertaking a project abroad with the duration of less than one year;
b) A domestic company undertaking a project abroad with the duration of one year or longer;
c) A foreign company undertaking a project in the domestic economy with the duration of less than one year;
d) A foreign company undertaking a project in the domestic economy with the duration of at least one year or longer.
3.63 The conceptual and measurement challenges of these four cases are further explored below. In each of these examples the challenges of compiling the accounts for country A are investigated.
3.64 Some of the case studies presented in Chapter 8 show that for very large projects, which take several years to finalize, construction companies themselves will usually install legal units for managing operations abroad. This clearly helps properly allocate this production to the economy in which the project is carried out. The examples below refer to projects for which such legal units are not present, which complicates assessing the size of the operations abroad and the need for a notional unit.
Case (a) - domestic company, foreign project < 1 year
3.65 For construction projects which take less than one year to finish, no notional units need to be created. The related output is recorded in the resident economy A of the construction firm. The required goods and services may be obtained from suppliers in country A, country B or yet another country in the rest of the world (ROW).
3.66 In this example, following the international guidelines, goods and services obtained from country B and the ROW must be recorded as imports of country A.
According to BPM6, the goods obtained from country B must be recorded under construction services.
3.67 The merchandise trade statistics will observe the goods from country A as exports. This recording should not be followed in the national accounts or balance of payments, so this requires an adjustment. The other flows of goods (B and C) remain unobserved from the perspective of the merchandise trade statistics of country A.
3.68 The trade in services statistics (MSITS 2010) may be utilized for observing the goods and services flows (goods and services obtained from B and from the ROW) in connection to foreign construction projects on a transfer of ownership basis. Another option is to obtain this information from business surveys. A clear separation between purchases of goods versus services may not necessarily be obtained from these sources.
3.69 The trade in services statistics will quite likely report the export of construction services to country B.
3.70 One may conclude that the trade balance reflects generally well the transactions related to short-term construction projects carried out abroad, one complication may be the shipment of goods from country A to country B, which is not an export in the SNA/BPM sense.
Case (b) - domestic company, foreign project ≥ 1 year
3.71 For construction projects taking one year or longer to complete, the international recommendations ask for the creation of a notional unit. As a consequence the output of construction services will not be recorded in the accounts of country A, but instead in those of country B. This also means no export of construction services will be recorded from country A to country B.
3.72 From the perspective of country A the only international flows to be recorded in the national accounts and balance of payments are the goods and services supplied from country A. One should be aware that these goods and services may be delivered by the construction company. These intra-company deliveries from the construction company in country A to the notional unit in country B may not necessarily be subject to a transaction.
Figure 3.2 Domestic company, foreign construction project
Country A Country B ROW
Goods from A Goods from B Goods from C Services from A Services from B Services from C
Construction company
Construction project

Principles of economic ownership inside the multinational enterprise
40
3.73 Similar to case (a), the export of goods from country A to country B is reflected in the merchandise trade statistics. However, in contrast to case (a) this recording should in this case be followed in the national accounts and balance of payments.
3.74 In a similar fashion, the export of services from country A to country B should be recorded but its measurement may be complicated by the fact that the respondent (the construction company or any other supplier) may not consider the notional unit as a non-resident entity, particularly not when the construction company in country A is responsible for invoicing. Also, project related purchases in country B or abroad may still be reported as imports as the construction company considers its project in country B as part of its own business.
3.75 Another complexity of the creation of a notional unit is that the imputed earnings on FDI (profits) need to be recorded as well in the balance of payments of countries A and B.
3.76 A conclusion that may be drawn from these first two examples is that the distinction between small (< one year) and large (> one year) projects may be difficult to make in practice, particularly because this distinction alters their measurement substantially. Nevertheless, compilers need to use some criteria to determine the duration of the project in question and hence the nature of the activity investment by the construction firm. A legal set up by the construction company in the country where it carries out the project could be considered as indication of a large long lasting project. If the construction company specialises in building power plants it can be safely assumed that the project will last for longer than one year and a quasi-corporation has to be created to accommodate the direct investment nature of this activity relationship. In fact, it might reasonably be assumed that all cross border construction projects are long term in nature or at least this assumption could be a starting point in the recording of these activities. In any case, such a choice should be in accordance with the underlying principles of the accounts of country B. This perspective is discussed in the following two examples.
Case (c) – foreign company, domestic project < 1 year
3.77 This example reflects the reverse situation of case (a). Following the international recommendations, the output related to the small construction project in country A is assigned to the foreign construction company in country B. This means the accounts of country A need to record the import of construction services from country B. Delivery of goods and services from country A needs to be recorded as export.
3.78 The supply of goods from country B and the ROW will be recorded as import of goods in the merchandise trade statistics. These cross border movements of goods are not the result of a transfer of ownership and require a correction in the national accounts and balance of payments.
3.79 It is possible that supplies to foreign construction companies (goods and services from A) are observed via MSITS (or business surveys). It is quite likely that the contract sum is reported by the domestic customer as the import of construction services. So, the only measurement challenge is the above mentioned correction in the merchandise trade statistics.
Case (d) – foreign company, domestic project ≥ 1 year
3.80 Again, following the international guidelines, projects taking longer than one year to finalize require the creation of a notional unit. Consequently, the output of the construction project should be recorded in the accounts of country A.
3.81 Similar to case (c), the merchandise trade statistics will observe the import of goods from country B and abroad. As the output is recorded in the accounts of country A, these flows should correspondingly be reflected in the national accounts and balance of payments. A complicating factor is that the contract sum may still be reported by the consumer in country A as the import of construction services, particularly when the company in country B is responsible for invoicing. Given the creation of a notional unit, this transaction should be recorded as a domestically provided service.
Figure 3.3 Foreign company, domestic project
Country A Country B ROW
Goods from A Goods from B Goods from C Services from A Services from B Services from C
Construction project Construction company
Principles of economic ownership inside the multinational enterprise
41
To conclude
3.82 The current data requirements are substantial due to the classification differences, in the case of small projects, between (1) goods and services obtained from the country in which the project takes place (to be classified under construction) and (2) goods and services obtained from other countries (to be classified as such). Another split in questionnaires between short-term and long-term projects clearly puts an extra burden on respondents.
3.83 The creation of notional units does not only lead to rearrangements in the recording of goods and services affecting GDP. It will also require imputing flows in the primary income account in order to ensure that GNI is not affected. A pragmatic approach in classifying the construction projects as long or short-term is clearly necessary as there can be a limited amount of information available regarding such projects.
3.84 Finally, the accounting for large construction projects becomes much easier once companies themselves decide to create (temporary) legal units which are given the responsibility of project management in the country where the project is carried out. This provides a much better basis for observing actual transactions at the level of these legal units.
Conclusions and recommendations 3.85 The key issue discussed in this chapter is applying the principles of economic ownership when observing the production activities of MNEs by referring to the guidance given in the international statistical standards and the business accounting standards.
3.86 Applying the residence principle to the globalized businesses of MNEs sometimes requires the separate identification of units which are not in reality autonomous. These units may even be fully controlled by a foreign unit and they cannot really be seen as independent operating units. Nevertheless as long as the controlling parent is in different economy, a separate institutional unit should be recognized.
3.87 The key findings and recommendations of this chapter are as follows:
a) Business accounting is an important source of information for national accounts. In most cases IASs follow the economic substance of transactions and, thus, already give a good measure of national accounts transactions. The regular dialogue with the IASB, already foreseen in the 2008 SNA research agenda, is a tool to ensure the needs of national accountants are taken into account in future revisions of the business accounting standards.
b) The recognition of legal (and taxable) entities is usually the point of departure for setting up accounts for production, value added and balance sheets. However, in the context of MNEs the nature of the transactions that these units are undertaking are not always that straightforward and may be at variance with the principles of economic substance and ownership. This is particularly true for transactions undertaken by SPEs. Applying the principles of economic ownership to such cases, in contrast to legal ownership, would be extremely difficult. National accountants usually have no alternative than to follow the reality as reported by these SPEs i.e. recognize them as separate institutional units. Consulting the tax authorities may be a way to obtain a better understanding of the nature of these SPEs.
c) The exchanges of goods, services and assets inside MNEs should be carefully examined as these exchanges may not automatically coincide with market transactions. The transfer pricing methods applied by MNEs largely determine the extent to which such international transfers of goods and assets can be recorded on an “arm’s length” basis. This is particularly relevant for the intra-group services provided by e.g. head offices and dedicated R&D units. The case-by-case approach followed by the so-called “large and complex cases units” installed by various NSIs is probably the best way to proceed. The operation of these units is further discussed in Chapter 6.
d) To the extent possible NSIs should exchange aggregated data and information on adjustments that deviate from company accounts in order to avoid asymmetries. Confidentiality considerations and restrictions to sharing data have to be taken into account.
e) It is advisable to explicitly address the reporting of intra-group services in international trade in services surveys, depending of course on the relative size of MNE activities and related output or consumption of intra-group services. One may ask respondents (of MNE affiliated companies) to report payments as contributions from affiliated enterprises for management services, which are not reported under any other heading.
f) NSIs should work closely together to assure that no asymmetries are created in import and export data as a result of pro-rating the output of multiterritory and similar types of enterprises such as foreign construction projects. Restrictions in sharing micro data may complicate the cooperation.
g) A promising initiative currently under development in the EU is the Euro Group Register covering European MNEs. This register is intended to

Principles of economic ownership inside the multinational enterprise
42
provide updated information on the structure of MNEs to statistics compilers in EU countries. Together with this initiative, efforts to improve definitions and classifications are made in the framework of the European Statistical System
network (ESSnet) on profiling and the ESSnet on consistency. This joint effort is expected to lead to better source data on MNEs for compiling national accounts with a mutually consistent breakdown of the MNEs’ activities on a country-by-country basis.

Ownership of intellectual property products inside global production
43
Chapter 4 Ownership of intellectual property products inside global production Introduction
4.1 Intellectual property products (IPP) as discussed in this chapter are in line with the System of National Accounts 2008 (2008 SNA) definitions, which mean they are the results of research and development (R&D), mineral exploration and evaluation, computer software and databases, and entertainment, literary or artistic originals. The intangible nature of IPPs makes the transfer and use of IPPs difficult to observe, so that data may be lacking or misleading. The use of IPPs is not physically nor locally constrained. Especially for IPP transactions within a multinational enterprise (MNE) this feature can cause significant measurement difficulties. The main difficulty relates to identifying economic ownership (as opposed to legal ownership), which has repercussions for the treatment of related flows, namely those related to IPP use.
4.2 The intangible nature of an IPP provides significant scope for an MNE to locate the IPP original in an economy that maximises the overall post-tax MNE profits. This is not necessarily the same economy as where the IPP original was produced and nor is it necessarily the same economy where services or copies provided by the IPP are subsequently embodied in, or used to produce, other products. For example an oil exploration company, headquartered in the U.S., with an affiliate in Norway that discovers an oil field off the coast of Scotland, may charge its Scottish subsidiary fees for the rights associated with these exploration costs that are payable to another subsidiary in the Netherlands.
4.3 For MNEs in particular, establishing which affiliate is the economic owner of the underlying IPP within such a fragmented process is non-trivial, particularly as transactions are not always identifiable, and where they are, may not be at arm’s length prices nor necessarily align with national accounts concepts of economic ownership. Depending on various conditions, the following three units could be identified as the economic owner:
a) As the ultimate beneficiary, the parent company often finances directly or indirectly (via an affiliate) the acquisition or production of the IPP (i.e. the original);
b) An affiliate that uses the IPP in its production of other goods and services (excluding generating IPP copies, licenses to reproduce, or licenses to use the IPP);
c) Another intermediary affiliate, which could be the original producer (such as a dedicated R&D or software development unit) of IPPs, or a so-called Special Purpose Entity (SPE) acting as the legal owner of IPPs and obtaining the revenues of IPP copies or licences to use or reproduce.
4.4 This chapter considers the criteria to establish guidance on economic ownership and related transactions within various global production arrangements. The chapter also provides recommendations to address methods of data collection, drawing on existing experience. The issue of how to overcome data gaps, including the necessity of any assumptions, is also discussed. The following section provides a brief overview of existing guidelines.
A brief overview of existing guidance
4.5 The Organisation for Economic Co-operation and Development (OECD) Handbook on Deriving Capital Measures of Intellectual Property Products15 provided the first detailed international practical guidance and recommendations on measuring IPPs. Its primary recommendation in the context of global production chains was for an improvement in the breakdown of international IPP related transactions and in particular an extension to the Extended Balance of Payments Services Classification (EBOPS) system (see paragraph 4.15). This proposal has been adopted in the latest balance of payments recommendations and Manual on Statistics in International Trade in Services (MSITS).
4.6 Chapter 1, paragraph 5.2 of the OECD Handbook also elaborated on some of the statistical challenges inherent in measuring the movement of IPPs between affiliated enterprises in different countries:
“…The key difficulty reflects the fact that monetary transactions, implicit or otherwise, that are explicitly identifiable with the IPP are rarely recorded by either party. When an IPP is provided by one affiliated
15 http://www.oecd.org/std/na/44312350.pdf
Ownership of intellectual property products inside global production
44
enterprise to another, either in its entirety or via a license to use or reproduce, a number of possibilities for recording the transaction arise:
a. There is either a sale or licence agreement between the provider and the recipient: the provider provides access to the IPP in exchange for a fee that is observable and should be recorded in the BOP and SNA goods and services accounts.
b. There is a capital transfer from the provider to the recipient, i.e. the IPP should be recorded in the BOP and SNA capital accounts, but it is very likely to go unrecorded.
c. The IPP is provided by the parent to a foreign subsidiary without a fee but with the expectation of receiving property income in the future. In effect, the parent is providing the IPP for a fee and then using the fee to increase its FDI in the subsidiary. This, too, is likely to go unrecorded. Both this and the case below include access related to reproduction rights without explicit observable fees charged.
d. The IPP is provided to the parent by the foreign subsidiary without a fee but in response to previous FDI. In effect, the parent is receiving the IPP in lieu of property income. This, also, is likely to go unrecorded unless steps are taken to monitor what is happening to the output of foreign-owned units created to undertake the production of IPPs.
Transactions between affiliates also impact on the valuation of the original IPP. In effect, there are two possibilities, when transactions occur:
e. The aggregate value of the asset has increased within the multinational: in other words the expected present value of future benefits has increased, as could occur, for example, if the multinational acquired a new affiliate and so obtained economic rights within a country that were not expected at the time of the original valuation. This would be recorded in the other changes in the volume of assets account of the provider. Such recordings have been rare in practice. A consequential difficulty is related to the split, if any, of the asset across the different countries where economic rights exist.
f. The aggregate value of the asset has not changed: the provider expected to share the asset in some way at the time it was acquired. In other words the original valuation reflected the scope for its use across different countries.
Clearly significant problems related to these flows implicit or otherwise exist. Moreover, the current scope for fully articulating such flows in the accounts is restricted by the sources of information available to measure them.”
4.7 The OECD Handbook was unfortunately not able to present solutions to these problems and necessarily concluded with a call for further research as follows (paragraph 5.2):
“Evidently the national accounts should reflect economic reality, and changes in ownership of IPP assets and the associated transactions should be recorded. However, current data sources generally do not identify transactions such as (b), (c), or (d), above, and, so, it is generally not possible to record them in the accounts. Further research is needed to identify ways of obtaining the values of transactions between affiliated units and their nature. Likewise, if the aggregate value of the asset has changed it should, in principle, be recorded in the accounts but this too is stymied by a lack of information and so is also a matter for further research.”
4.8 Chapter 7 of the Globalization Guide, the predecessor to this Guide, picked up this challenge and made recommendations for further research, which is the aim of the current chapter of this Guide. Paragraph 7.8 of the Globalization Guide offered a few additional insights into the nature of the problem and the special character of IPPs which may complicate the determination of their ownership:
“The intangible nature of IPPs means that they can easily be registered as the property of a unit in one country when they are used in production by an enterprise located in another.”
4.9 These difficulties are particularly apparent in situations in which legal ownership is assigned to companies only because of related tax incentives:
“This characteristic creates an incentive for companies to register their IPPs as owned by a unit in a low-tax jurisdiction…This shifts value added from the parent company to the affiliate, although the global production function of the parent company remains the same.”
Determining stocks and flows of IPPs: a review of data sources
4.10 In order to develop practical guidance for the registration of IPPs, it is necessary to consider which flows and stocks of IPPs can be measured in a reliable manner, and which other data are available that might indicate how production and external flows should be accounted for.
IPP production
4.11 Of the IPPs included in the 2008 SNA, all except R&D were already included in the System of National Accounts 1993, and, so, no further guidance is developed here for the measurement of production of those IPPs. Taking a look at R&D, one may conclude that the measurement of production is perhaps most developed. Firm recommendations for measuring
Ownership of intellectual property products inside global production
45
expenditure on R&D are provided in the OECD Frascati Manual16, whose first edition was published in the 1960’s. At present internationally comparable R&D expenditure data are collected for about 90 countries by the OECD and United Nations Educational, Scientific and Cultural Organization (UNESCO).
4.12 Guidance on the measurement of output of all types of IPPs is found in the OECD Handbook on Deriving Capital Measures of IPPs referred to above. Especially for R&D bridge tables in Chapter II of the handbook show how data from the Frascati framework can be translated to SNA sectors and the SNA supply and use framework. The handbook also provides guidance on international trade, price and volume measurement issues and quarterly estimates.
4.13 Supplementary data can be obtained from specific surveys on MNEs, such as those recommended in the OECD handbook on Economic Globalization Indicators, which may also include the measurement of R&D performance. Related data collection takes place in a wide range of OECD countries and the results may include, in addition to other items, statistics on R&D expenditures, intra-firm imports and exports, technological payments and receipts. European Union (EU) member countries are obliged to compile similar statistics on foreign affiliates and there is a Eurostat manual on Foreign Affiliate Statistics (FATS). Both OECD recommendations and Eurostat regulations put an emphasis on the inward activities of MNEs while outward activities are only partially covered. Combining the data from a range of countries may lead to obtaining a fuller picture.
IPP imports and exports
4.14 Data on IPP related international trade flows, particularly between affiliated units, are usually more difficult to obtain. Flows between unaffiliated enterprises should be accounted for in financial statements, but they may not always be identifiable as specific IPP related transactions. Moreover, due to the intangible nature of IPPs, the related flows may not be recorded in customs data. For transactions between affiliated enterprises the same difficulties arise but even where flows are recorded, they may not be at market prices or follow the arm’s length principle.
4.15 However, the measurement of international flows in connection with IPPs is under development. Recently, updated international recommendations for defining and classifying services transactions have been published in the MSITS 2010. The main relevant variables in this classification are:
16 Frascati Manual 2015: Guidelines for Collecting and Reporting Data on Research and Experimental Development: http://www.oecd.org/publications/frascati-manual-2015-9789264239012-en.htm
8. Charges for the use of intellectual property n.i.e.
8.1 Franchises and trademarks licensing fees
8.2 Licences for the use of outcomes of research and development
8.3 Licences to reproduce and/or distribute computer software
8.4 Licences to reproduce and/or distribute audio-visual and related products
8.4.1 Licences to reproduce and/or distribute audiovisual products
8.4.2 Licences to reproduce and/or distribute other products
9. Telecommunications, computer, and information services…
9.2 Computer services…
9.2.1 Computer software
Of which: 9.2.1.a Software originals
10. Other business services
10.1 Research and development services
10.1.1 Work undertaken on a systematic basis to increase the stock of knowledge
10.1.1.1 Provision of customized and non-customized research and development services
10.1.1.2 Sale of proprietary rights arising from research and development
10.1.1.2.1 Patents
10.1.1.2.2 Copyrights arising from research and development
10.1.1.2.3 Industrial processes and designs
10.1.1.2.4 Other
10.1.2 Other
4.16 Data on external funding of business R&D are also collected in a large number of countries as part of the Frascati framework (see Table 4.1). The information includes funding from abroad by affiliated and non-affiliated enterprises. However, although business enterprises mainly perform market transactions, these flows of funding may reflect donations and subsidies and not necessarily sales and purchases of R&D (see also the country case study 4.1). Additional information, as described below, is needed, therefore, to use this source so that this information may be useful for the measurement of IPP imports and exports in the national accounts and balance of payments.
4.17 One approach is to refine the funding questions in R&D surveys to explicitly ask for intra-MNE group transfers of IPPs. Another approach is to include additional questions on intra-group transactions in enterprise surveys on international trade in services, as also discussed in Chapter 3. A third possibility is to include additional questions on R&D in dedicated MNE surveys. By combining data on MNEs from these three types of surveys, it is possible to develop a comprehensive picture of an MNE´s IPP production, trade and use (see country case study 4.2).
4.18 Another direction explored in a number of countries is the adapted collection of data for a number of large and complex enterprises (see also Chapter 6). As MNEs often contribute substantially to IPP investment a
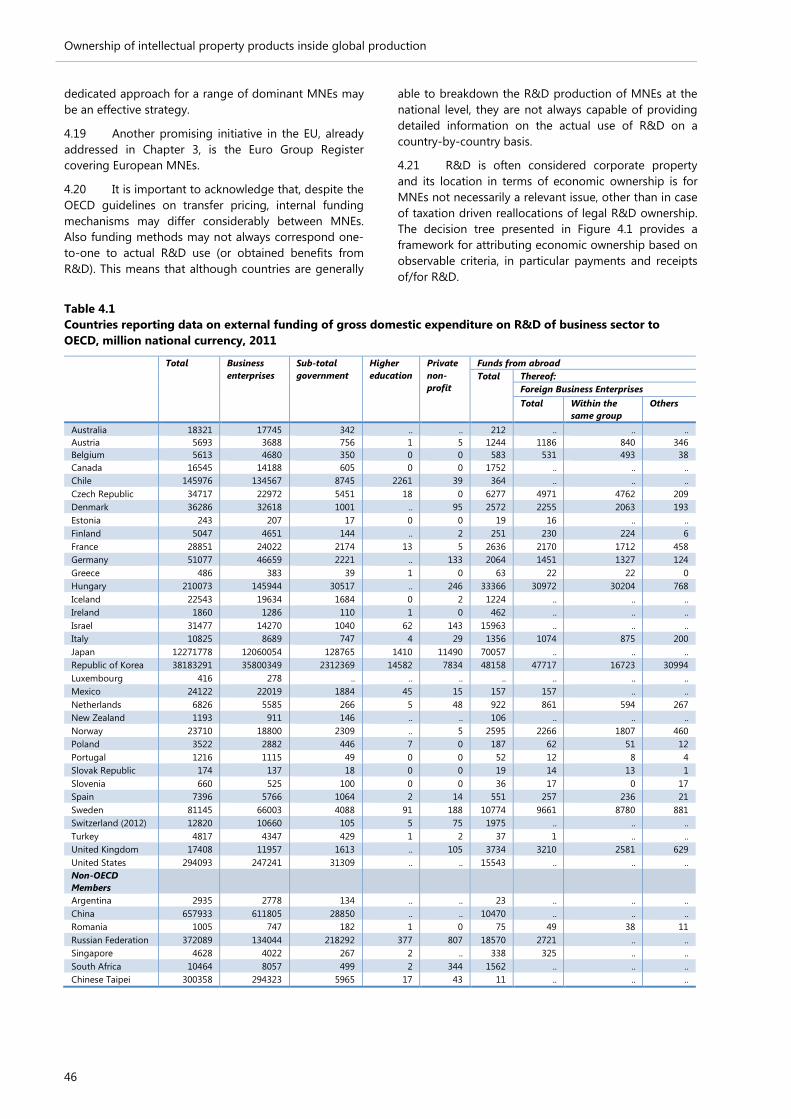
Ownership of intellectual property products inside global production
46
dedicated approach for a range of dominant MNEs may be an effective strategy.
4.19 Another promising initiative in the EU, already addressed in Chapter 3, is the Euro Group Register covering European MNEs.
4.20 It is important to acknowledge that, despite the OECD guidelines on transfer pricing, internal funding mechanisms may differ considerably between MNEs. Also funding methods may not always correspond one-to-one to actual R&D use (or obtained benefits from R&D). This means that although countries are generally
able to breakdown the R&D production of MNEs at the national level, they are not always capable of providing detailed information on the actual use of R&D on a country-by-country basis.
4.21 R&D is often considered corporate property and its location in terms of economic ownership is for MNEs not necessarily a relevant issue, other than in case of taxation driven reallocations of legal R&D ownership. The decision tree presented in Figure 4.1 provides a framework for attributing economic ownership based on observable criteria, in particular payments and receipts of/for R&D.
Table 4.1 Countries reporting data on external funding of gross domestic expenditure on R&D of business sector to OECD, million national currency, 2011
Total Business enterprises
Sub-total government
Higher education
Private non-profit
Funds from abroad Total Thereof:
Foreign Business Enterprises Total Within the
same group Others
Australia 18321 17745 342 .. .. 212 .. .. .. Austria 5693 3688 756 1 5 1244 1186 840 346 Belgium 5613 4680 350 0 0 583 531 493 38 Canada 16545 14188 605 0 0 1752 .. .. .. Chile 145976 134567 8745 2261 39 364 .. .. .. Czech Republic 34717 22972 5451 18 0 6277 4971 4762 209 Denmark 36286 32618 1001 .. 95 2572 2255 2063 193 Estonia 243 207 17 0 0 19 16 .. .. Finland 5047 4651 144 .. 2 251 230 224 6 France 28851 24022 2174 13 5 2636 2170 1712 458 Germany 51077 46659 2221 .. 133 2064 1451 1327 124 Greece 486 383 39 1 0 63 22 22 0 Hungary 210073 145944 30517 .. 246 33366 30972 30204 768 Iceland 22543 19634 1684 0 2 1224 .. .. .. Ireland 1860 1286 110 1 0 462 .. .. .. Israel 31477 14270 1040 62 143 15963 .. .. .. Italy 10825 8689 747 4 29 1356 1074 875 200 Japan 12271778 12060054 128765 1410 11490 70057 .. .. .. Republic of Korea 38183291 35800349 2312369 14582 7834 48158 47717 16723 30994 Luxembourg 416 278 .. .. .. .. .. .. .. Mexico 24122 22019 1884 45 15 157 157 .. .. Netherlands 6826 5585 266 5 48 922 861 594 267 New Zealand 1193 911 146 .. .. 106 .. .. .. Norway 23710 18800 2309 .. 5 2595 2266 1807 460 Poland 3522 2882 446 7 0 187 62 51 12 Portugal 1216 1115 49 0 0 52 12 8 4 Slovak Republic 174 137 18 0 0 19 14 13 1 Slovenia 660 525 100 0 0 36 17 0 17 Spain 7396 5766 1064 2 14 551 257 236 21 Sweden 81145 66003 4088 91 188 10774 9661 8780 881 Switzerland (2012) 12820 10660 105 5 75 1975 .. .. .. Turkey 4817 4347 429 1 2 37 1 .. .. United Kingdom 17408 11957 1613 .. 105 3734 3210 2581 629 United States 294093 247241 31309 .. .. 15543 .. .. .. Non-OECD Members
Argentina 2935 2778 134 .. .. 23 .. .. .. China 657933 611805 28850 .. .. 10470 .. .. .. Romania 1005 747 182 1 0 75 49 38 11 Russian Federation 372089 134044 218292 377 807 18570 2721 .. .. Singapore 4628 4022 267 2 .. 338 325 .. .. South Africa 10464 8057 499 2 344 1562 .. .. .. Chinese Taipei 300358 294323 5965 17 43 11 .. .. ..

Ownership of intellectual property products inside global production
47
4.22 In this context it is important to re-emphasise that these payments may mistakenly be reported as earnings from Foreign Direct Investment (FDI). In other words, payments for the use of IPPs per se may not always be observed separately and reported as recommended. Given these limitations, the possibilities of recording IPP flows in the context of global production will be limited and could range from entirely
ignoring these flows to imputing all flows using the available information on the structure of the MNE, or on the global production arrangement under consideration. But since measurement is making gradual progress, it is important to take this progress into account and adapt the guidance to the current commonly available information, aiming for maximum international comparability.
Country case study 4.1 Attempts to link R&D production, investment and use inside MNEs in the Netherlands
In the Netherlands business related R&D expenditure is concentrated into a limited number of large MNEs. Eight MNEs represent together about 45 per cent of all business expenditure on R&D (BERD). For this limited number of companies, there are quite a number of uncertainties about economic ownership and intra-company R&D services flows. A Frascati-based survey is used for determining R&D output (i.e. the output of newly performed R&D) which is relatively straightforward, in contrast to measuring exports and imports and gross capital formation. The R&D survey provides sufficiently robust results. At national level the linkage between R&D output and gross fixed capital formation is largely quantified by the R&D balance of trade.
The measurement of international R&D service flows appears less straightforward. Recommendation 17 of the OECD Handbook indicates that in situations in which the rights to benefit from R&D are not clearly assigned, the owner is deemed to be the producer of R&D on own account. But this does not solve all problems. Imputation of capital services may be needed to link R&D ownership to R&D use in the production activities of (foreign) affiliates.
Turning back to these eight largest R&D performers in the Netherlands, it appears that most of them are affiliated to MNEs with large parts of their worldwide R&D activities concentrated in the Netherlands. This suggests that these entities in the Netherlands would report substantial amounts of export of R&D services, particularly to their foreign affiliates. Otherwise, it is unlikely that this R&D contributes entirely to innovation activities in the domestic economy of the Netherlands.
R&D survey results include information on funding of gross expenditure on R&D from the rest of the world. These surveys may also provide information on funding by domestic companies of R&D carried out in the rest of the world. Although part of this funding may include actual sales and purchases of R&D, it is important to highlight that these funding flows may also include income transfers such as donations or subsidies.
As recommended in this chapter, for national accounting purposes, the survey questions on international R&D funding were recently split between actual sales and purchases of newly produced R&D versus other kinds of transactions (e.g. income transfers). Services obtained from existing R&D assets, such as licences to use, are not reflected at all in the survey results. These must be obtained from other sources such as the international trade in services statistics. Surprisingly, in the R&D survey of the Netherlands the eight largest R&D producers report very limited amounts of funding received from the rest of the world, i.e. R&D performed on behalf of foreign affiliates. Moreover, international trade in services data show that the largest R&D performers also report relatively low levels of export of R&D services. In other words R&D performers in the Netherlands do not receive substantial revenues from foreign affiliated companies using existing R&D assets, which would indicate that ownership either does not reside with the performer or, counter-intuitively that part of the R&D output in the Netherlands does not serve the needs of foreign affiliates.
In 2009, the R&D survey of the Netherlands was used to approach 18 of the largest R&D performing companies with a small number of additional questions. These questions addressed R&D performed in Netherlands but intended to serve the R&D needs of foreign subsidiaries. Responses on these additional questions were received from 15 companies. The results confirmed prior expectations that part of this R&D output was indeed intended to serve foreign subsidiaries even if transactions are not necessarily observed in the accounts. The results also confirmed that economic ownership is not necessarily transferred to the actual users of R&D inside the MNE.
One may conclude from this that available surveys under-report intra-company R&D service flows. Adjustments of these results can only be made on a case-by-case basis and in close consultation with the respondent. As these observation problems of intra-company R&D flows are particularly common for the largest MNEs, a custom-made surveying approach may be realistic in terms of (respondent) costs and benefits. Obviously, the proposed improvements in MSITS statistics classification will be helpful as well in explicitly addressing these intra-company flows of R&D.

Ownership of intellectual property products inside global production
48
Country case study 4.2 Measuring international trade in R&D in Israel
In Israel R&D expenditure survey has been conducted since the 1970's. Recently, questions on funding of R&D were introduced in this survey according to SNA classifications. In the survey multinationals are separately observed.
In addition, enterprise surveys on international trade in services have been conducted in Israel since 2004, and specific enterprise surveys on activities of MNEs have been conducted since 2002.
For each of the three types of surveys for which the data are collected by interviewers, data reporting for national accounts and balance of payments purposes has gradually improved. The data as obtained from the most recent survey are considered adequate for recording IPP related transactions according to 2008 SNA guidelines.
By linking and combining the results of these three surveys at the level of individual MNE, it has been possible to present more detailed information on production and trade in IPPs by MNEs. Table 4.2 provides an overview of the data collection at industry level. It has been possible to collect R&D expenditure data separately for the parents of MNEs, their foreign affiliates and subsidiaries in Israel with foreign parents. The data includes domestic R&D expenditure, number of employed persons engaged in R&D, R&D imports and exports.
Table 4.2 Expenditure on R&D and external trade (million USD) in R&D of MNEs in Israel 2011
Determining the economic ownership of IPPs
General principles
4.23 IPP ownership and the IPP transactions are obviously interrelated. The general principles of economic ownership, as applied inside global production arrangements and MNEs, are discussed in Chapter 3. The decisive criteria of accepting the risks and rewards need to be translated to the particular case of economic ownership of IPPs.
4.24 Acceptance of risks involves the owner’s responsibility for repairs and maintenance of the asset, as well as its ultimate loss. In the case of IPPs,
maintenance can be taken to mean the responsibility of paying for fees to maintain patents, copyrights or other registrations of the IPP in question. Ultimate losses are perhaps not so relevant in the case of IPPs, although the instant termination of protection or secrecy will inevitably lead to less monopolistic power and declining competitiveness as competitors can also obtain access to the IPP in question.
4.25 The channels by which to obtain the rewards from IPPs can be diverse. The owner may decide to use its IPP in production and the return to IPP capital depends in this case on the commercial success of the created output. Another way to obtain rewards is granting other parties the right to use the IPP in their production processes for a fee, such as a licence to use
2009 2009 2009A Agriculture, forestry and fishing 29 .. .. .. 34 .. ..B-C Manufacturing; mining and quarrying 2,551 59 423 921 1,077 451 64
10-12 Manufacture of food products, beverages and tobacco products 18 .. .. .. 9 .. ..
13-14 Manufacture of textiles and wearing apparel 22 .. .. 22 14 .. ..20-21 Manufacture of chemicals and pharmaceuticals 644 4 354 686 98 51 14
22-23 Manufacture of rubber, plastics and other non-metallic mineral products 25 .. .. .. .. .. ..
24-28Basic & fabricated metal products, computers, electronic & optical products, electrical equipment, machinery & equipment n.e.c.
1,636 46 40 207 939 395 46
Other manufacturing, mining and quarrying 206 .. .. .. .. .. ..G Wholesale and retail trade and repair of motor vehicles 9 .. .. .. 27 .. ..62,631,72 Selected services 926 133 45 115 4,719 3,705 84
62, 631 Computer programming, consultancy & related activities, data processing, hosting & related activities, web portals 561 44 23 74 2,111 1,803 31
72 Scientific research and development 365 90 22 41 2,549 1,902 53Other industries 47 .. .. .. 60 .. ..
3,561 194 476 1,039 5,858 4,216 156
(2) For these variables separate data for agriculture, wholesale and retail trade and repair of motor vehicles and "other industries" have not been detailed
Industries (1)
Industry code Name of Industry
Total
Subsidiaries of MNEs (IN)Parent companies of MNEs (OUT)
Expenditure on R&D
Exports of R&D
(2)
Imports of R&D
(2)
Expenditure of
subsidiaries abroad on R&D (2)
(1) According to ISIC4
Imports of R&D
(2)
Exports of R&D
(2)
Expenditure on R&D

Ownership of intellectual property products inside global production
49
software. Alternatively, the owner may still be developing IPP applications and its value will depend on its expected success.
4.26 The identification of economic ownership of IPPs inside MNEs may require a special treatment. When transactions are not observed directly, ownership and the recording of intra-group IPP transfers become uncertain and can only be based on certain conventions. These issues are dealt with in the next subsection.
Decision tree
4.27 The supply and use of IPPs in global production are usually observed via enterprise statistics such as business surveys, R&D surveys or related administrative sources. Additional sources, such as international trade in services statistics may also be used for the recording of international transactions.
4.28 Source statistics may provide information on:
a) IPP related output such as IPP development (on own account), IPP sales and receipts from e.g. copies, licences to use and royalties;
b) IPP related purchases such as purchases of originals, copies, licences to use and royalty payments;
c) IPP funding, it should be highlighted that the funding flows inside MNEs do not necessarily reflect change of ownership of IPPs;
d) IPP (legal) ownership, company reports may reveal information on (legal) ownership of IPPs, although it must be stressed that company balance sheets will generally under-report IPPs as defined in the SNA. Patent or copyrights registers may equally be consulted to obtain information on IPP ownership, but also this source will usually provide an incomplete coverage, as patenting practice may differ from one industry to another.
4.29 Consulting FATS is needed to examine the possible relationship of the observed unit to an MNE group, as inside these groups identification of IPP ownership and use is particularly challenging. This is why the decision tree presented in Figure 4.1 makes a distinction between IPP ownership inside MNEs versus IPP ownership within the context of global production arrangements in which unaffiliated companies are participating.
4.30 In addition, it is useful to obtain information on the main characteristics of the unit under observation such as kind of economic activity of the unit, in terms of the International Standard Industrial Classification of All Economic Activities (ISIC). For example, the observed unit may be a manufacturer using the IPP in its production process. Alternatively, the unit may be engaged in developing IPPs, or simply be in charge of holding IPPs and collecting the payments for use by others.
4.31 Figure 4.1 shows a decision tree which assists in determining the economic ownership of IPPs and IPP related transactions (particularly IPP related import and export flows). The tree represents a sequence of steps, from left to right, guiding the statistics compiler to a decision. The starting point of the tree is the observation of IPP output or IPP ownership at the level of a certain unit. The obtained information is examined in 4 different steps:
a) Control/ownership of the unit: is the unit member of an MNE (yes/no)?
b) Is the unit producer of the IPP (yes/no)?
c) What is the main kind of activity (in terms of ISIC) of the unit, or, is the unit expected to use the IPP in its production process (yes/no)?
d) Does the unit receive income related to IPPs, or, does the unit pay for the use of IPPs (royalties and licences) (yes/no)?
4.32 Together these steps should lead to a coherent decision on ownership, the recording of capital formation and the recording of IPP related services (imports/exports). However, it should be acknowledged that the available information needed to go through each of these steps may be insufficient. Particularly inside MNE groups it may be quite challenging to classify IPP related transactions properly, identifying separately IPP funding, IPP purchases and sales and payments for IPP use. This means that each situation identified in the decision tree will be provided with a default solution in case information is insufficient to run properly through each of the decisive steps.
4.33 The first part of the decision tree describes the situation of units inside MNE groups. The observed unit may be a producer of IPPs on own account (1.1.1) or a main IPP producer (1.1.2) serving the IPP needs of the various members of the MNE group. In case of an own account producer the (default) decision is to assign economic ownership to the unit in question. It could be that other units inside the MNE group equally benefit from this IPP. However, in such cases it is recommended that intra-group transactions are only recorded when data sources point at receipts for IPP use by member units.
4.34 In case of a main IPP producer, economic ownership of the produced IPP is assigned to this unit (1.1.2.2) unless there is evidence the unit does not generate any IPP related turnover (e.g. sales of copies, licences to use), or, there is evidence of sales of the original to the parent or to other customers (1.1.2.1). No observed IPP related turnover implies the unit is indirectly funded by the parent. Such funding should be observed. Without conclusive evidence the default solution is to assign economic ownership to the producing unit (1.1.2.2).

Ownership of intellectual property products inside global production
50
Figure 4.1 Decision tree for determining economic ownership of an IPP observed in global production (1)
Control/ownership of unit
Production of the IPP
Type of producer Income and expenditure related to the IPP
Decision about economic ownership of the IPP
Related decisions
1.1.1. The unit is a main producer of other (non IPP) goods and services and is expected to use the IPP in its production process
1.1.1 The unit may, or may not, receive funding from the parent as compensation for IPP development costs but this aspect is not decisive.
Attribute by default economic ownership of the IPP to this unit
The IPP is by convention recorded on the balance sheet of this unit, even when other member units of the MNE may benefit from the IPP.
1.1 The unit produced the IPP
1.1.2.1The unit does not receive income from royalties or licences to use, but either receives compensation for IPP development from the parent or sells the IPP originals to the parent.
Do not attribute economic ownership to the unit. This unit serves as a dedicated IPP producer for the benefit of the MNE as a whole.
Do not record the IPP as fixed capital formation of the unit. Instead record the developed IPP as export to the (foreign) MNE parent. Reported sales of IPP originals may show up in international trade in services statistics.
1.1.2. The unit is a main IPP producer.
1.1.2.2. The unit receives income from royalties or licences to use, or does not receive any compensation for IPP development from the parent, so it can be assumed that it is expected to obtain income from royalties and licences to use in the near future.
Attribute economic ownership to the unit. The unit functions as a dedicated IPP producer with income from units outside the MNE from the IPPs produced.
The IPP is recorded as fixed capital formation of the unit.
1. The unit is part of a multinational enterprise (MNE)
1.2.1.1. The unit pays royalties or licences to use.
The unit does not own the IPP
Do not record the IPP as fixed capital formation of the unit. IPP service payments to foreign suppliers are recorded as import of IPP services (or royalties).
1.2.1. The unit is a main producer of other (non IPP) goods and services and may use the IPP in production
1.2.1.2 The unit purchased the IPP original for use in production
Attribute economic ownership of the IPP to the unit
The IPP is fixed capital formation of the unit. If purchased from abroad register an import of the IPP (original)
1.2. The unit did not produce the IPP
1.2.1.3. No IPP related payments are being observed. IPP use may be indirectly observed based on the nature of the production process (with usually high IPP requirements) and above average returns to capital.
The MNE parent is expected to be the economic owner and supplier of the IPPs used in production.
Conceptually, an imported IPP service flow should be recorded. But this is not an easy task (and not without risks) as the nature and size of these flows are principally unknown. Such imputations of imports/exports should preferably be the outcome of a concerted action in which all national statistical institutes (NSI) involved join efforts in filling in the IPP flows between the units of an MNE.
1.2.2. The unit is not a
producer of other (non IPP) goods and services. Its main output is IPP related.
1.2.2. Purchase of the IPP from the parent and income from royalties and licences to use may, or may not, be observed.
The unit is assumed to have purchased the IPP (original) from the parent and to receive (on behalf of the parent) income from royalties or licences to use the IPP. Attribute economic ownership of the IPP to the unit. The unit is considered an IPP holding SPE providing its services to the MNE parent.
It is recommended to classify the fixed capital formation, income and expenditure related to these IPP holding SPEs separately to allow analysis excluding "brass plate" units, also because the transactions carried by these units are not necessarily at arm’s length.

Ownership of intellectual property products inside global production
51
Figure 4.1 (cont.) Decision tree for determining economic ownership of an IPP observed in global production (2)
4.35 Source statistics may indicate the use or ownership of IPPs, but without the observed unit being identified as the producer of IPPs (1.2). Unless there is evidence of purchases of IPP originals, such units will generally not be considered the economic owners of
IPPs. One may expect that payments for IPP use will be observed (1.2.1.1). But even without such payments it is quite possible that these units use IPPs provided by the MNE parent in their production processes (case 1.2.1.3).
Control/ownership of unit
Production of the IPP
Type of producer Income and expenditure related to the IPP
Decision about economic ownership of the IPP
Related decisions
2.1.1. The unit is a producer of other (non IPP) goods and services and is assumed to use the IPP in production
Attribute economic ownership of the IPP to the unit
The IPP is fixed capital formation of the unit.
2.1. The unit produced the IPP
2.1.2.1. The unit receives income from copies, royalties or licenses to use.
Attribute economic ownership of the IPP to the unit.
The IPP is fixed capital formation of the unit. If royalty payments are received from abroad register these payments as exports of IPP services.
2.1.2. The unit is a main IPP (or factoryless goods) producer.
2.1.2.2. The unit does not receive income from copies, royalties or licenses to use the IPP. One may assume that this unit operates as a factoryless goods producer (FGP).
Attribute economic ownership of the IPP to the unit.
The IPP is fixed capital formation of the unit.
2. The unit participates in a global production arrangement but not as member of an MNE
2.2.1.1. The unit pays royalties or licenses to use the IPP
The unit does not own the IPP Don't include the IPP as fixed capital formation of the unit. If payments to abroad register imports of IPP services
2.2.1. The unit is a main producer of other (non IPP) goods and services and is expected to use the IPP in production
2.2.1.2. The unit purchased the IPP.
Attribute economic ownership of the IPP to the unit.
The IPP is fixed capital formation of the unit. If purchased from abroad register imports of the IPP
2.2. The unit did not produce the IPP.
2.2.2.1. The unit receives
income from royalties or licenses to use the IPP
Attribute economic ownership of the IPP to the unit
The IPP is fixed capital formation of the unit. If income is received from abroad register exports of IPP services
2.2.2. The unit is a main IPP (or factoryless goods) producer.
2.2.2.2. The unit does not receive income from IPP related royalties or licenses to use. Instead payments for IPP use (originals or copies) may be observed. This unit is expected to operate as an FGP.
The economic ownership of the IPP should be judged on the basis of the IPP related transactions observed with this unit. It is possible that the unit makes use of IPP services provided by dedicated IPP producers.
The IPP is fixed capital formation of the unit when the purchase of an original is observed. Otherwise the unit is expected to purchase IPP services in which case royalty or license payments should be observed.
Ownership of intellectual property products inside global production
52
4.36 However, one could also argue that since these units are obtaining the benefits from IPPs, they could alternatively be identified as the actual economic owners inside MNEs. This would argue in favour of imputing the transfer of the IPP original from the parent to the unit and capitalization of this IPP on the balance sheet of the unit under observation. This is not an easy task, and not without risks. The nature, size and timing of these flows are principally unknown. This is why such an approach is not advocated under 1.2.1.3.
4.37 In case one would want to move in this direction, it is recommended that the imputations of imports/exports are the outcome of a concerted action in which all national statistical institutes (NSI) involved join their efforts in filling in the IPP flow gaps that are believed to exist between the various member units of an MNE. Such a combined action will assure that imputations do not lead to new asymmetries in the balance of trade.
4.38 Case 1.2.2 reflects those units created by MNEs with the purpose of taking advantage of low tax jurisdictions. The default solution is assigning economic ownership of the IPP to these units, in correspondence with legal ownership. Rerouting of ownership, and corresponding income flows, from the legal to the economic owner is not recommended. However, income received by these units should preferably be classified under a separate heading such as “IPP related services provided by SPEs” as the provision of these services by such “brass-plate” companies have very little economic significance (see also Chapter 3). A separate reporting of these artificial IPP services will provide a clearer view on national accounts and balance of payment statistics.
4.39 The second part of the decision tree (2) reflects the situation of global production in which a principal and the contract producer do not belong to the same MNE Group. In appraising IPP ownership under such conditions, there are roughly two situations to consider. In the first situation (2.1.1) a manufacturer owns the IPP and uses it in its production process, which implies the principal is simply obtaining a full-fledged product including the IPP service. In this case there is no necessity of recording IPP transfers. The principal has no involvement in the manufacturing process and is expected to concentrate its business to trade related activities. The IPP recording aspects are relatively straightforward: the goods manufacturer in question invest on own account in IPP and the asset value should be recorded in its balance sheet.
4.40 In the second situation, the principal owns the IPP and provides a contract producer with its blueprints of the required output (2.1.2). No IPPs, or IPP related transactions, will need to be identified when observing the contract producer’s production activities. The contract producer will deliver a product to the principal; however, without reflecting the user costs of the IPP.
4.41 The decision tree even reflects the (perhaps hypothetical) situation in which the factoryless producer puts into use the IPPs developed by others (2.2.2.2). Such units will be IPP owners when they purchased the IPP originals. Alternatively, they could use the IPPs owned by dedicated IPP producers.
4.42 Outside the scope of MNEs, IPP related transactions may be observed, when dedicated producers provide IPP originals or IPP related services (2.1.2.1) to those entities in the production chain engaged in manufacturing (2.2.1).
4.43 In conclusion, when there is a need to record IPP related transfers outside the domain of MNEs, such transfers are usually observed from market transactions and this makes the decision on registration much less complicated. Similarly, the identification of IPP ownership is usually less problematic outside the scope of MNEs. Yet, the analysis of IPP use in production typically requires a complete picture of the global production chain, which will not be obtained from a national input-output table. Alternatively, a world input-output table may show how IPPs are linked, for example via factoryless goods producers (FGP), to the global production chain.
4.44 The recommendations in this chapter are in line with those in Chapter 3 in a sense that compilers are advised to stay close to statistical observation, even in clear cases where legal ownership does not match with the SNA principles of economic ownership. In this respect a complicating factor is that the administrative reality in terms of IPP control and legal ownership inside MNEs can change rigorously from one day to another. The intangible nature of IPPs allows MNEs to make such changes without substantial costs. Surveys may not easily keep track of such changes. Also it may sometimes be difficult to accept such changes as a true reflection of economic reality.
4.45 A default solution advocated by some compilers is placing economic ownership at the units producing the IPPs. Such a shortcut would also lead to large distortions in the analysis of production based on supply-use or input-output studies such as measuring trade in value added (see Chapter 7).
4.46 One may be tempted to follow a default solution in which IPP ownership is allocated according to IPP use in production (or physical transformation). But such a solution would simply go beyond economic reality, particularly in the case of factoryless goods production.
4.47 The following three country case studies illustrate the use of the decision tree in real existing cases.

Ownership of intellectual property products inside global production
53
Country case study 4.3 Intra-group supply of R&D (1)
R&D centre “Comp” in domestic country A, is a subsidiary of a multinational “Multicomp” with a parent in country B and other subsidiaries in countries C and D. Comp engages only in R&D production and has developed a prototype of a new kind of computer chip "ChipM". The business accounts indicate that Comp received financing of all costs of development from the parent in country B. This indicates that the development of ChipM has been financed by the parent of Multicomp. It is assumed that as soon as the prototype is finalized, ChipM will be patented in the name of Multicomp. At that moment the subsidiaries in countries C and D will start producing computers containing ChipM components. Comp in country A corresponds to case 1.1.2.1 in the decision tree in Figure 4.1. Comp’s output, the design of ChipM, is sold to the parent of Multicomp in country B. Irrespective of the method of finance, the transaction between Comp and the parent represents a purchase of an IPP. The production of the ChipM design leads to the generation of income in the accounts of Comp and related profits must be reported by Comp to the tax authorities of country A. The net profits will flow back to the parent of Multicomp as (un)distributed dividends on FDI. The point of view of Multicomp is reflected by case 1.2.1.2. The financing of ChipM should be registered as import of an IPP, leading to gross fixed capital formation in the balance sheets of Multicomp´s parent in country B. No transfers of IPPs will be recorded to the subsidiaries in countries C and D. The IPPs will remain unobserved in those countries and no IPP related transactions need to be recorded.
Country case study 4.4 Intra-group supply of R&D (2)
“SwiftC” is a very small company in country A with very few employees. SwiftC is the subsidiary of an MNE “Bigcomp” with headquarters in country B. SwiftC appears the legal owner of patented software named “SoftPat” and obtains royalty payments from two subsidiaries of Bigcomp operating their production activities in countries C and D. Both subsidiaries use SoftPat in their manufacturing activities. SwiftC is not engaged in the development of software or any other production activities. The decision tree in Figure 4.1 points out that SwiftC is according to case 1.2.2. a brass plate company. Following related recommendations SwiftC will be considered the owner of the IPP but for analytical purposes all income and expenditure linked to SoftPat should preferably be registered separately. The situation of headquarters in country B may not differ very much by the rerouting of IPP related income via SwiftC. Without existence of this SwiftC, IPP related income would probably be obtained directly from the subsidiaries engaged in manufacturing in countries C and D.
Country case study 4.5 IPPs recorded in the value added tax (VAT) registers of Hungary
The decision tree presented in this chapter suggests that when IPP assets or IPP related flows are observed a judgement is needed of economic ownership and the kinds of transactions that take place. This case study from Hungary shows what may happen if VAT registrations enter this process. The issue of these registrations is also discussed in Chapter 9. In the EU the presence of VAT traders may require additional attention. Since VAT registrations are obliged to report foreign trade data in the resident economy, their reported export figures reflect values of these transactions other than the ones recorded in resident books. This point is illustrated in the figure below.
non-residential principal software
resident producer
physical part
Electronic equipment without
software value in resident
books
VAT registration
Electronic equipment with
software value in foreign trade statistics
merchant or final customer
sells products reports FTS data
Ownership of intellectual property products inside global production
54
Some producers in Hungary manufacture electronic equipment. Subsequently, software will be installed on this equipment, developed and owned by non-resident firms. The installation of software takes place in Hungary, but after a change of ownership, i.e. after selling the electronic equipment without the software to a non-resident principal. The non-resident principal sells the electronic devices together with the installed software to customers outside Hungary. The installation of software should be considered an industrial service on inputs owned by the foreign principal. The latter's presence is shown in the VAT register. Following the VAT register the exported good (including the software) is almost twice the value of the output reported by of the domestic manufacturer. The VAT register represents the basis for compiling merchandise trade statistics.
If no adjustment is made, this difference will result in errors and omissions in national accounts and balance of payments. The question arises which adjustment should be made. The decision tree does not provide direct answers under such specific circumstances. Although the observed software embedded in the exported good may easily be associated with the domestic producer, it does neither own or (re)sell the software. The main problem is really the presence of the VAT registration. Without this information the software would not appear in any statistics in Hungary.
As a result, the merchandise trade statistics of Hungary are adjusted to report only the hardware parts of the exported good before their incorporation into the national accounts and the balance of payments. These adjustments are not easily made and require a careful, case-by-case, investigation. This example shows that in addition to harmonization of the Balance of Payment and International Investment Position Manual (BPM), sixth edition and the 2008 SNA, further attention should be given to bridging the underlying concepts of merchandise trade statistics to those of macro-economic statistics.
Conclusions and recommendations
4.48 The measurement challenges of IPP production, transfer and use are widely acknowledged, particularly in the context of global production and MNEs. Guidance to statistics compilers can be found in the OECD Handbook on Deriving Capital Measures of Intellectual Property Products, in Chapter 7 of the Globalization Guide and in this chapter.
4.49 Initiatives are undergoing to improve data collection, such as the proposed refined classification in MSITS to better keep track of intra-company transfers related to IPPs. It should be acknowledged that the expected increase in response burden may pose an important restriction for most NSIs. Another promising initiative is the development of the Euro Group Register covering MNEs with their business spread over EU.
4.50 The recommendations following from this chapter, which are supplementary to those found in the other manuals, are formulated as follows:
a) The data collection on the international trade in services is in many countries underdeveloped and needs improvement. The refined classification as presented in MSITS 2010 provides a solid point of departure. The funding questions in the R&D survey are considered a second best alternative to obtain information on R&D related international trade flows.
b) The international coordination of data collection on MNEs between NSIs, the pooling of efforts and systematic exchange of results, should be further pursued.
c) The principles laid down in the decision trees presented in this chapter should be used as guidance to attribute IPP ownership and for accounting of IPP related flows inside MNEs and global production chains. The guidance relies inevitably on information on IPP control and ownership and other characteristics of units engaged in IPP related transactions.
d) The income flows received by IPP holding SPEs should be classified under a separate heading such as “IPP related services provided by SPEs” as the provision of these services is not really reflecting economic transactions (see also Chapter 3). Separating these artificial IPP services in the accounts from other output will support a correct interpretation of national accounts and balance of payment statistics.
4.51 Recommendations in this chapter may need to be updated in the near future to reflect the further development and refinement of measurement methodology. It is expected that the implementation of the 2008 SNA, European system of national and regional accounts 2010 and BPM6 will lead to new experiences and a need to compare country results and the underlying applied methods and data sources.
Measuring global production: data sources and compilation challenges
55
Chapter 5 Measuring global production: data sources and compilation challenges
Introduction 5.1 This chapter focusses primarily on the measurement challenges related to the first three categories of global production arrangements introduced in Chapter 2: Goods sent abroad for processing (case A in Table 2.1), Merchanting (case B) and Factoryless goods production (case C). The challenges become particularly apparent in the context of the changed accounting standards, the System of National Accounts 2008 (2008 SNA) and the Balance of Payment and International Investment Position Manual, sixth edition (BPM6). This calls for a review of the data collection methods and data analysis.
5.2 The chapter examines the changes in the accounting standards between the 1993 and 2008 versions of the SNA and differences between the fifth and sixth versions of the BPM, particularly with respect to the data needs and analysis required for each of the three forms of global production mentioned above. The conceptual underpinnings of these changes are explained in the Globalization Guide. The changing concepts are generally well understood, while the required modifications in data collection are not always straightforward. Furthermore, the International Merchandise Trade Statistics (IMTS) 2010 have a different conceptual basis and their reconciliation with the imports and exports as recorded in the national accounts and the balance of payment requires several adjustments (see Table 10.2 in the BPM6).
5.3 The data items needed to make these adjustments may not be readily available, so these deserve further attention. Without guidance there is concern that national statistical institutes (NSI) and other compiling agencies will employ approaches that are different enough to hamper international comparability of national accounts and balance of payments. However, it is acknowledged that compilers will use different methods depending on the specific characteristics of institutional arrangements, data sources and statistical systems in their countries.
5.4 This chapter follows a step-by-step approach by reviewing the data items needed to properly measure outward and inward processing, merchanting and factoryless goods production. This guidance is not only limited to the recording of international trade flows but
also addresses some aspects of measuring production such as the recording of output, intermediate consumption and inventories.
5.5 Available data sources may be incomplete, or insufficiently reliable to carry out some of the steps needed to obtain the required estimates. The following section in this chapter provides a list of existing and relevant data sources and shows how relatively small adjustments in these source statistics may leverage their use in measuring certain aspects of global production and improve the quality of the estimates. This may help assess additional data needs against all current and potential sources of information with a view of minimizing collection cost and response burden.
5.6 This chapter benefits substantially from the work carried out by the Eurostat Task Force on “Goods sent abroad for processing” and the related manual that was compiled as a follow up of the task force report. The chapter reflects on a broad range of experiences including Canada, China, China/Hong Kong SAR, Czech Republic, E.U., Israel, Ireland, Kyrgyzstan, Mexico and the United States (U.S.).
5.7 Nevertheless, it is not expected that the available experiences presented in this chapter completely cover all data issues countries will encounter when dealing with global production. Particularly the experiences from the developing countries are limited at present and as a result underreported in the chapter. Collecting evidence from these countries, including their search for adequate data sources and compilation methods, is an issue for future research.
5.8 Some statistical offices are currently still in the process of studying how to classify and collect data from entities that are part of global production arrangements. In other words, the robustness of data collection in the context of global production is still subject to on-going research. An update of this chapter is recommended once data collection and compilation methods are further advanced in a broader range of countries.

Measuring global production: data sources and compilation challenges
56
Goods sent abroad for processing (Case A) Outward processing
5.9 The name “outward processing” is used when a resident company, the principal, sends goods abroad for processing while retaining economic ownership of these goods. After processing the goods may be sent back to the company, or to customers that are resident in the country. However, it is also possible that after processing the goods do not return and are directly delivered to customers in the country where the processing takes place or yet another country.
5.10 The conceptual differences between the 1993 and 2008 SNA in recording goods sent abroad for processing are explained in detail in the Globalization Guide (Chapter 5). Under the System of National Accounts 1993 (1993 SNA) treatment, an ownership change is imputed for the raw materials or semi-processed goods sent abroad for processing and recorded as an export of goods. After processing a second transaction is imputed presenting the import of the manufactured good in a similar way. This imputation of processing related imports and exports is not required in the 2008 SNA as their recording should be fully based on the observation of international product transactions. The main transaction taking place in the context of outward processing is the fee paid for the delivery of processing services.
Measuring production
5.11 Conceptually, moving from 1993 to 2008 SNA leads to a number of changes in the production accounts of companies that send goods abroad for processing. These changes are reflected in Table 5.1 which turns back to the athletics shoe example as introduced in Chapter 2. The table shows that according to the 1993 SNA, output needed to be upwardly adjusted to include the delivery of goods sent abroad for processing. Similarly, intermediate consumption is increased by the imputed purchase of processed goods. As long as the difference between imputed output (30) and imputed intermediate consumption (50) represents the processing fee, the 1993 and 2008 SNA recommendations lead to the same value added.
5.12 One may expect that, not many national accountants were able to follow the 1993 SNA recommendations to accurately make such ownership imputation adjustments in the production account. However, there were cases where NSIs brought production and intermediate consumption carefully in line with international trade statistics as reported by a limited number of companies engaged in outward or inward processing and other adjustments. Without such adjustments, the balancing of supply-use tables was disturbed by the (implicit) mix up of different recording concepts. This is one of the reasons why these accounting recommendations were changed in the 2008
SNA - to improve the internal consistency of the national accounts.
Table 5.1 Outward processing, the production account according to 1993 and 2008 SNA
1993 SNA 2008 SNA Output 140
(=110+30) 110
Goods 115 (=85+30) 85
Services 25 25
Intermediate consumption
87 (=37+50) 57
Materials 80 (=30+50) 30
Processing services
0 20
Other services 7 7
Value added 53 53
Compensation of employees
17 17
Gross operating surplus
36 36
5.13 Another consequence of the 1993 SNA recording method of outward processing was that the purchase of processing services (20) was not separately recorded, since this fee is assumed to be included in the value of the return flow of the good after processing.
5.14 In the case of outward processing the 2008 SNA guidelines lead to simplification of the recording of production. The accounts can be constructed straightforwardly by following the transactions as reported in business surveys, without the need of making imputations. However, this entails an effort to bring trade flows in line with the reality of manufacturing.
5.15 Regarding the correct observation of outward processing, it is recommended to explicitly include in the questionnaires of business surveys a data item on the purchases of manufacturing services. Further, a distinction should be made between services purchased from domestic suppliers and from suppliers abroad. The wording associated with industrial processing (sometimes addressed as custom work) is cumbersome and the questionnaires need to be reviewed to make sure that they are clear to respondents.
5.16 Further, outward processing may lead to inventories of raw materials or processed goods that are under ownership of the principal but have a physical presence in the country of the processor. Therefore, inclusion of a separate question in the questionnaire on inventories held abroad would be particularly helpful. If this is not possible, it is recommended that as a minimum the instructions in business surveys highlight explicitly that also inventories held abroad must be reported.

Measuring global production: data sources and compilation challenges
57
5.17 Keeping in mind that not all firms are engaged in outward industrial processing, there should be an assurance that (i) the survey frame is comprehensive and includes such firms and (ii) the sample size is sufficient and with an effective sampling strategy. A priori information or company profiling can be helpful in identifying large companies engaged in processing. Such companies would ideally be in the take-all portion of the sample. At the very least, they should be in the take-all portion of the annual survey, if such a survey is used to supplement and benchmark the monthly or quarterly surveys.
5.18 According to the International Standard Industrial Classification of All Economic Activities, Revision 4 (ISIC Rev.4) the principal is classified to the class that corresponds to the activity representing the complete production process, i.e. it is classified as if it were carrying out the complete process, including the contracted work. For national accounting purposes it may be useful to group these companies, engaged in substantive outward processing, under a separate subcategory. This is important for compilation as well as for analytical reasons, as the cost structure of such companies may differ substantially from companies that carry out the physical transformation themselves.
Measuring international trade in goods and manufacturing services
5.19 Table 5.2 presents the international transactions in the simplest case of outward processing in which the goods after processing re-enter the country of the owner. As illustrated in the table, the required changes in the recording of international transactions logically follow those made in the production account. In the 2008 SNA the imputation of export and import flows is no longer required. The only transaction that needs recording is the processing fee paid to the processor abroad. One key measurement challenge is the adjustments that must be made to merchandise trade statistics to bring them in line with the requirements of national accounts and balance of payments. Another challenge poses the situation in which the processed goods do not return to the country of the principal. Both measurement issues are further discussed below.
Table 5.2 Outward processing, international transactions according to 1993 and 2008 SNA
1993 SNA 2008 SNA Exports 30 0
Goods 30 0
Manufacturing services
0 0
Imports 50 20
Goods 50 0
Manufacturing services
0 20
5.20 Practically each national accounts, or balance of payments, compiler will use the IMTS 2010 data collection framework as a starting point for the estimation of imports and exports of goods in national accounts and balance of payments. Like previous editions, IMTS 2010 gives priority to statistics that reflect physical cross-border movements of goods. This recording concept of cross-border flows differs in several important aspects from the conceptual framework adopted in the 2008 SNA and BPM6, which is the recording of imports and exports purely on transaction basis.
5.21 IMTS 2010 (paragraph 1.20) mentions that all cases of goods sent for processing, and goods resulting from processing, are to be included in the merchandise exports and imports of the countries at their full (gross) value. As these shipments of goods do not coincide with economic transactions they should not be recorded as imports or exports in the national accounts or the balance of payments. Essentially, goods for processing (where there is no change of ownership) need to be separately identified so that they can be removed from the IMTS source data, before they are integrated in the national accounts or balance of payments. The options to make such adjustments in a sufficiently robust way may differ from country to country.
5.22 More generally, in the context of outward processing the following data items, and corresponding data adjustments, are required:
a) Adjustments in IMTS to remove (i) the merchandise trade exports for the goods being sent abroad for processing and (ii) the merchandise trade imports for the goods being returned to the domestic economy following processing;
b) In case purchased abroad, include a recording of these imports of raw materials or semi-processed goods;
c) Estimate the export of processed goods, in case these do not physically return to the country of the principal;
d) Estimate the import of services associated with the purchase of processing services from abroad;
e) Estimate (changes in) inventories held abroad in connection to outward processing.
5.23 Each of these items is further discussed below.
a) Adjustments in merchandise trade statistics
5.24 In many countries customs information form the basis of merchandise trade statistics. As mentioned these need to be translated to national accounts and balance of payments concepts. The adjustments can include coverage, timing, valuation and country attribution (origin-shipment) adjustments, but also adjustments needed to record international trade on a change of ownership basis for goods under processing arrangements (or goods under repair).
Measuring global production: data sources and compilation challenges
58
5.25 Some or most of the merchandise subject to processing may qualify for exemptions from normal customs duties (exempt or partially exempt). Under these circumstances, it is expected that customs’ records would identify such merchandise. For example, information on re-exports may be widely available in the customs information. It is quite possible in some countries that available customs information is not fully utilized in the merchandise trade statistics. Some of this information may already exist on available customs fields that are not fully captured or ignored for merchandise trade statistics purposes. In other words, existing but non-tabulated or analyzed fields might be able to provide important information for adjustment purposes. This might involve additional efforts by compilers as well as negotiations with customs agencies for access to additional records on customs documents.
5.26 The desired additional information from customs records would include the values and commodity codes of the merchandise that has been sent abroad for processing, the processing fees paid on these goods, where the work is undertaken and where the processed goods are destined, etc. The information may also include the dates of departure and return of all temporarily shipped merchandise.
5.27 The commodity detail that would be associated with any of these categories of temporarily shipped merchandise would then form the basis of a national accounts or balance of payments change in ownership adjustment for trade in goods. Exports related to outward processing would have to be removed in the period in which they were sent abroad as well as for the period in which they returned.
5.28 For example within the European Union (EU), specific customs procedures are used to identify certain types of trade, including goods for inward and outward processing. These types of trade are identified by “nature of transaction codes” within customs procedures. While these codes are typically used to compile IMTS, they can be a source of information to identify goods for processing.
5.29 In the context of the nature of transaction codes, outward processing is defined as the customs procedure under which goods that are in free circulation in an economy may be temporarily exported for manufacturing, processing or repair and then re-imported with total or partial exemption from import duties and taxes.
5.30 While such nature of transaction codes may be a useful source of information to the compiler, they do not readily identify whether there is a change of ownership or not, just that the goods are intended for re-shipment. However, identifying whether the goods are being returned to the domestic economy seems a reasonable proxy for determining whether there is no change of ownership.
5.31 The nature of transaction codes can be used as a source for detecting and extracting commodity flows subject to processing, but only when this classification is in effective use by the customs authority. If goods for processing are exempt from certain taxes, the incentives are in place to report high quality data. Without such tax breaks the quality of the obtained data may not be sufficient.
5.32 The EU Manual on Goods Sent Abroad for Processing recommends consulting the customs administrations regarding the quality and use of information obtained from transaction codes. As mentioned it is important to understand companies’ practices with respect to the declaration of goods for processing and the suitability of actual customs records to identify them. This may require a one-off survey coordinated by custom administration on behalf of balance of payments and national accounts compilers.
5.33 Alternative options need to be considered when information on nature of transaction codes of sufficient quality is not available from the merchandise trade statistics. It is possible that information on the (magnitude of) value of goods sent abroad for processing be obtained from business surveys in combination with questions on payments of processing fees to foreign processors. This information can be used to make the required adjustments in the merchandise trade statistics.
5.34 Obtaining these data items from business surveys may lead to increased response burden that is considered undesirable. Under such conditions the fall back option is to make crude adjustments based on information on payments of processing fees to foreign processors as derived from business surveys and international trade in services surveys. The assumption used may be that the processing fee reflects the difference between the value of goods sent for processing and the value of goods returning to the home country of the owner. This would imply that the size of downward adjustments of exports and imports are such that the trade balance for goods reflect the service fee. As the fee is recorded separately, the overall trade balance would be unaffected.
5.35 A possible way to measure the unknown gross flows to be removed is through measuring the processing fees to processed goods ratios estimated for a sample of similar firms in terms of economic activity, country of origin/destination of the goods, etc. for which all this information is readily available.
5.36 However, such adjustments may give rise to disturbances in the trade balance, particularly when there is uncertainty about the amount of goods not returning after processing to the country of residence of the principal. Again, under such data conditions it is advisable to run a one-off survey to obtain at least a general picture of the importance of flows of processed goods not re-entering the domestic economy.

Measuring global production: data sources and compilation challenges
59
Country case study 5.1 International Merchandise Trade Statistics in the European Union
The compilation of the IMTS (named International Trade in Goods Statistics, ITGS, at the level of the EU) relies principally on customs records complemented, as appropriate, by additional sources to enhance their coverage (e.g. to include electricity, or trade in vessels and aircrafts). These statistics essentially reflect the physical movement of goods across borders.
The IMTS in the EU is based on two data collection systems, called Intrastat and Extrastat. The EU is a customs union and there are no customs frontiers between its member states. The introduction of the single market on 1 January 1993 led to the abolition of customs formalities between the member states which had served as the traditional source of trade statistics and to a clear distinction in the observation methods and collecting systems between the intra-EU and extra-EU trade, giving existence to two data collection systems, i.e. the Intrastat system and the Extrastat system.
Companies that trade within the EU with other member states (so-called Intrastat trade) have seen substantial changes. Detected by means of the value added tax (VAT) information, they declare directly to the statistical authorities. Companies that trade with countries outside the EU (so-called Extrastat trade) declare, as before 1993, only to the customs authorities, and a copy of the customs documents is processed by the statistical authorities.
The Intrastat system is linked to the value added tax system, based on enterprise surveys and data according to the country of consignment for arrivals (imports) and the country of destination for dispatches (exports). Enterprises registered in the VAT register with a sales or purchases of goods from/to other member states exceeding the statistical threshold submit Intrastat declarations. In the Intrastat declaration the information related to the country of origin is not obligatory. The reporting agent in the country of final destination may, therefore, not know at all the non-EU country of origin of the goods. Only the information related to the country of consignment (imports) is available.
The trade of member states with non-member countries (Extrastat) is recorded on the basis of customs declarations (single administrative document). The Extrastat statistics collect data according to the country of origin/final destination.
Goods for processing are recorded on a gross basis in the IMTS. An export is recorded when a semi-finished good is transferred to a foreign processor for processing under contract (outward processing) and an import is recorded when a national processor receives foreign owned goods for processing (inward processing). Goods for processing can to some extent be identified in the IMTS by the nature of transaction codes or the customs procedure codes. It is mandatory for member states to collect the nature of transaction code in Intrastat. The nature of transactions is the sum of characteristics (e.g. purchases or sales, goods sent for processing), helping to determine the different transactions in Intrastat/Extrastat. The nature of transactions is specified by a two digit code as follows:
Operations with a view to processing under contract:
41. Goods expected to return to the initial member state of dispatch; 42. Goods not expected to return to the initial member state of dispatch.
Operations following processing under contract:
51. Goods returning to the initial member state of dispatch; 52. Goods not returning to the initial member state of dispatch17.
In Extrastat it is optional for member states to collect the nature of transaction. It is envisaged that the collection of the nature of transaction should become mandatory with the implementation of the Union Customs Code, at latest in 2020. The customs procedure codes are four digit codes. The two first digits show the current procedure while the third and fourth digit indicate the previous procedure that the goods were placed under.
Some procedures indicate goods for processing:
21, 22: Temporary export under outward processing 41: Inwards processing procedure – drawback system 51: Inwards processing procedure – suspension system 91: Processing under customs control
17 In some EU member states this information is available only by a one digit code.
Measuring global production: data sources and compilation challenges
60
Some procedures can only exist as a previous procedure:
54: A previous procedure indicating that goods were under inward processing procedure in another member state (suspension system).
92: A previous procedure indicating that goods were under processing under customs control in another member state.
Codes 41, 51 and 91 are import procedures used by the companies (requires an authorisation) when there is a tariff on the materials that are going to be processed. The extent of goods imported for processing where the procedure for normal imports is used is unknown. Customs procedure codes 41 and 51 are used when the goods are expected to be re-exported. In case of code 51 the goods are not in free circulation of the EU (‘T1 goods’) and after processing the exports of the processed goods must be documented. In case of code 41 the customs duties are paid and the goods are in free circulation (‘T2 goods’). When the goods are subsequently re-exported the duties are refunded. Since the goods are in free circulation the goods can without any further notification of the customs authorities stay in the processing economy even though this was not anticipated initially. Due to the re-export of the processed goods both 41 and 51 might represent processing activities under contract. Concerning customs procedure code 91 there is no requirement or intention that the goods must be re-exported following processing. Only when the goods are re-exported it seems reasonable that the goods might have been processed under contract. Only a fraction of the goods imported for processing under customs control should be associated with processing under contract. The ratio between the value of goods that are re-exported and goods that are not re-exported provides an indication of the share of imports for processing under contract. Codes 54 and 92 exist only as a previous procedure indicating that the processing activity has taken place in another member state. Codes 21 and 22 are export procedure codes that are used when the processed goods are expected to return. When there is a tariff on the finished goods the company has an economic incentive to use the codes for processing. The amount of goods imported following processing but which are reported under the procedure for normal imports is unknown. When semi-finished goods are not expected to return after processing, the procedure for normal exports is likely to be used.
b) Estimate purchases of goods (raw materials, semi-processed goods) abroad as imports
5.37 Goods (raw materials, semi-processed goods) to be processed by a foreign processor may be purchased abroad. In such cases these purchases will not show up as imports in merchandise trade statistics as these goods do not cross the borders of the country in which the principal is resident.
5.38 The only way these imports can be observed is asking the respondents of business surveys to report separately domestic purchases of intermediate goods from purchases abroad. Such a split is particularly recommended for industry branches in which outward processing is known to exist more widely. A coherent approach is to combine questions on foreign expenditure on processing services abroad (see the following item) with related imports of goods subject to outward processing.
5.39 In the absence of information coming from business surveys a possible approximation would be to subtract the processing fee paid from the value of the imports after processing as reported in customs records. An error that could easily be made is removing imports after outward processing from merchandise trade statistics without replacement with the actual import value of the goods purchased abroad before processing.
c) Estimate exports directly following processing
5.40 The exports following outward processing will not show up in merchandise trade statistics as the goods have already crossed borders before the transaction in processed goods takes place. The nature of transaction
codes in merchandise trade statistics may be helpful for detecting goods sent for processing that will not return to the domestic economy after processing. If this information is available, and of sufficient quality, the values of these goods sent for processing could be replaced by the eventual transaction value after processing. The best approach would be to match turnover from foreign sales (as reported by the principal in business surveys) with goods sent for processing and not returning back to the home country. A rough approximation of the transaction value would be to add the processing fee paid by the exporting principal to the commodity value reported in customs records at the moment it is shipped abroad for processing.
5.41 Without information of sufficient detail and quality on the nature of transactions, adjustments in merchandise trade statistics cannot be made and are not without risk. Again, an error that could easily be made is removing shipments for outward processing from merchandise trade statistics without replacement with the actual export value of the good after processing.
d) Estimate the import of processing services
5.42 There are two data sources in particular that may provide information on the import of processing fees: business and international trade in services surveys. The latter source is sometimes also referred to as balance of payments surveys. Both types of surveys may not be geared to measure aspects of global production, in particular with respect to services associated with goods that cross the border for processing. However, both surveys can be amended to collect information on purchases of processing services from foreign suppliers.

Measuring global production: data sources and compilation challenges
61
The Manual on Statistics of International Trade in Services (MSITS) 2010 addresses explicitly in its classification the coverage of manufacturing services on physical inputs owned by others.
5.43 One challenge is to ensure that surveys adequately cover firms engaged in (outward) processing. In this context, one big advantage of business surveys is that they usually cover total domestic activity while the international trade in services survey often have a smaller scope in terms of coverage and sample size. Another advantage of the business survey is obviously the integrated view in which these characteristics of production and output are obtained.
5.44 An alternative approach is to measure the processing fee indirectly as the difference in the values of the goods before and after processing, as observed via the export and the import flows of goods subject to an outward processing arrangement. Box III.2 in the MSITS 2010 explains that the value of the fees charged for manufacturing services on physical inputs owned by others is not necessarily the same as the difference between the value of goods sent for processing and the value of goods after processing. In addition to the processing fee, value differences may also include holding gains and overhead costs. At the same time, such calculations become particularly problematic in case goods do not return to the country of the principal. Further, as the result of physical transformation, the product classification may change before and after processing and this may equally complicate the indirect estimation of the processing fee. Therefore it is recommended to observe the processing fee directly rather than indirectly.
e) Estimate (changes in) inventories held abroad
5.45 The data on inventories are usually collected as part of the business survey. It was recommended before that the design of business surveys should be such that inventories held abroad are captured. A split between domestic and foreign held inventories would be very helpful. Also a split of raw materials versus processed goods would be useful, particularly in providing a broader picture of the commodity flows subject to outward processing. This split would also help properly measure revaluations.
Data validation
5.46 From a theoretical point of view, it is possible to collect information on data items a-e, and to estimate each of them, independently. Many compilers will be making their estimates under less favourable conditions; and therefore, data validation must be part of the estimation procedure. These data validations can be done at various levels of detail.
5.47 Even if information on processing services is largely or solely obtained from the trade in services surveys, it is possible that the coverage of this activity in merchandise trade statistics is superior to that of
services surveys. In other words the merchandise trade statistics may be used to detect omissions in the observed payments of processing fees. There should be a rough relationship between the values of commodity flows and processing fees. Data errors can be detected as well by comparing processing flows as observed from the nature of transaction codes information in merchandise trade statistics and the processing fees as observed in the trade in services statistics. Also, information from business surveys can help validate both the coverage of processing in international trade in services and the international trade flows in customs data.
5.48 All of this could be enhanced by the existence of so-called “importer-exporter” registers associated with merchandise trade statistics. The alignment of these registers with the business register would facilitate data confrontation with other surveys. Some countries have developed importer-exporter registers, which will be linking the merchandise trade by commodity to the firms engaged in this activity. Importer-exporter registers allow tracing detailed commodity trade back to the trading establishments and importer-exporter firms. This can provide valuable possibilities for linking trade data to the related business surveys, especially manufacturing surveys and trade in services surveys, in the case of cross-border processing activity. Tying the aforementioned merchandise trade adjustments to firms in manufacturing via record linkages as well as commodities can increase the accuracy and the alignment of production and trade related data of the examined firms.
5.49 Finally, the above discussed adjustments in IMTS focus primarily on obtaining the total exports and imports according to the 2008 SNA and BPM6 principles; however, without necessarily taking into account a product breakdown. This latter aspect is particularly relevant for the compilation and balancing of supply-use tables. A product breakdown may also help provide a correct presentation of external trade in the context of global production. And even the sub-annual balance of payments and the quarterly gross domestic product (GDP) estimates usually require some degree of commodity detail.
5.50 Referring back to the athletic shoe example of Chapter 2, if a principal sends the midsoles to a foreign processor for final assembly, and the shoes do not return to the country of the principal but are shipped directly to the country of the final user, the exports of the principal, for example estimated as the sum of the value of the midsoles and the processing fee paid, have to be registered as exports of shoes and not as exports of midsoles. Classifying these exports correctly on the basis of the Central Product Classification (CPC) is not straightforward. A default assumption could be to assume that the product breakdown of the goods before processing is the same after processing. This may indeed be a plausible assumption on a higher

Measuring global production: data sources and compilation challenges
62
aggregation level. These classification issues are equally relevant when making corrections in IMTS in connection to inward processing.
Inward processing
5.51 The name “inward processing” is used when the resident company, the processor, is engaged in the physical transformation of goods that are before and after processing under ownership of a foreign principal. After processing, the goods may return to the country of the principal, or be supplied to customers in the country of the processor, or shipped to yet another country.
5.52 Inward processing arrangements are usually easier to identify and observe than outward processing because the nature of the arrangement is usually explicitly reflected in business surveys.
Measuring production
5.53 Following the 2008 SNA and BPM6 recommendations, the output of the processor represents the manufacturing processing services and not the full value of the manufactured products, as was required according to 1993 SNA. Without the need of making these imputations, the production account can be derived straightforwardly from the revenues and costs as reported in business statistics.
5.54 Following up on the athletics shoes example, introduced in Chapter 2, the output of the processor represents the processing services (20), corresponding in this example to the compensation of employees.
5.55 According to ISIC Rev.4 contractors, or units carrying out an activity on a fee or contract basis, are classified in the same category as units producing the same goods or services on own account. For national accounting purposes it may be useful to present companies that mainly provide industrial services under a separate subcategory. It is important for compilation, as well as analytical, reasons as the cost structure of contract manufacturers will substantially differ from companies carrying out production on own account.
Table 5.3 Inward processing, the production account according to 1993 and 2008 SNA
1993 SNA 2008 SNA Output 50 (=30+20) 20
Goods 50 (=30+20) 0 Services 0 20
Intermediate consumption
30 0
Materials 30 0 Processing services 0 0 Other services 0 0
Value added 20 20 Compensation of employees
20 20
Gross operating surplus
0 0
Measuring international trade
5.56 From the processor’s country perspective, the required changes when moving from the 1993 to 2008 SNA are the mirror image of the changes illustrated in Table 5.2. The shipments of raw materials, and possibly the processed goods, will show up in merchandise trade statistics, but these should not be recorded as imports and exports in the national accounts or balance of payments of the country in which the processor is resident. So the new 2008 SNA and BPM6 guidelines require that the international trade flows related to inward processing, as reported in the IMTS source data, are removed from the import and export estimates in the national accounts and balance of payments.
5.57 In the context of inward processing the following data items, and corresponding data adjustments, are required:
a) Adjust trade in goods to remove (i) the merchandise trade imports for the goods received from abroad for processing and (ii) the merchandise trade exports for the goods being returned to the domestic economy, or shipped to a third country, following processing;
b) Estimate the exports of services associated with the sale of processing services to abroad;
c) If relevant, estimate the value of exports of goods (raw materials, semi-manufactured goods) purchased on the domestic market by the principal abroad, and which are subsequently processed by the domestic processor;
d) One may expect that inventories of raw materials or finished products held in the premises of the processor, but under ownership of the principal, are not reported by the processor in business statistics questionnaires. If these inventories are in the accounts of the processor, respective adjustments to exclude them need to be done by statistics compilers.
5.58 The first three above mentioned items are further discussed below.
a) Adjustments in merchandise trade statistics
5.59 As discussed in the former subsection in the context of outward processing, nature of transaction codes similar to those used by the EU can also be used as a source for detecting and extracting commodity flows subject to inward processing, but only when this classification is in effective use by the customs authority and the incentives are in place (the existence of tax breaks) to report to the customs authorities information of sufficient quality.
5.60 Alternatively, information on the value of goods for inward processing can be obtained from business surveys in combination with questions on payments of processing fees by foreign principals. This information can be used to make the required

Measuring global production: data sources and compilation challenges
63
adjustments in the merchandise trade statistics. But it must be stressed that the principals in processing arrangements generally have a much better view on the value of goods sent abroad for processing than the processors. The processors may not have precise information on value of the materials or semi-processed goods sent to them for processing as they are not the owners.
5.61 A fall back option is to assume a certain relationship between the value of processing services and the value of goods sent for processing, on the basis of which general adjustments can be made in merchandise trade statistics. Import and exports may be downwardly corrected in exactly similar way. However, such adjustments may give rise to disturbances in the trade balance, particularly when there is uncertainty about the amount of goods that remain in the country of the processor. In this situation it is advised to run at least a one-off survey to obtain a general picture of the relationship between processing fees and the product flow values subject to inward processing, and to obtain a view on the significance of those flows that stay after processing in the domestic economy of the processor.
b) Estimate the export of processing services
5.62 There are two data sources in particular that may provide information on the export of processing services: business surveys and the international trade in services surveys. As already mentioned, both surveys can be amended to collect information on the production and export of processing services. The output of processing services in the accounts of the processor is probably easier to observe than the intermediate consumption of processing services in the accounts of the principal. The indirect measurement of exports of processing services as the difference in the values of the
goods before and after processing is not recommended because of the same reasons highlighted in the context of outward processing (paragraph 5.44). It is advised that such indirect measurement is done for data confrontation purposes only.
c) Exports of goods purchased on the domestic market by the principal abroad which are processed by a domestic processor
5.63 From the perspective of inward processing there is no obvious mode of observing these exports. Before processing no cross-border flow of goods is observed and as such these exports will remain unobserved in the merchandise trade of goods statistics. As the domestic processor is not directly involved in the transaction (the domestic purchase of raw materials) it is not reasonable to burden the processor with questions about the country of origin of the materials it processes (domestically purchased or shipped from abroad).
5.64 Alternatively, the value of the export of raw materials or semi-manufactured goods could be obtained by subtracting the processing fees from the value of the export flow after processing. The latter information may be obtained from the cross-border registration as followed in the merchandise trade statistics. A complicating factor is that only part of the processed goods is purchased by the principals in the domestic economy.
Data validation
5.65 The procedures of data validation were already discussed in the context of outward processing. The need of such procedures is equally relevant for analysing the outcomes on inward processing, particularly when the underlying source data are incomplete or not of sufficient quality.
Country case study 5.2 The effects of manufacturing services on the balance of payments of China
Thanks to the open-up policy in the late 1970’s, the importance of goods for processing has increased rapidly and this contributed greatly to the development of foreign trade, employment, GDP growth and industry restructuring in China. According to Monitoring Measures of General Administration of Customs of the People Republic of China on Goods under Goods for Processing, the following three main types of processing arrangements are identified:
1) Processing with imported materials where domestic entities import and purchase the materials, do some manufacturing domestically and sell abroad the finished products after processing. This form of processing to some extent corresponds to the contract producer under a factoryless arrangement (C) as discussed in Chapter 2;
2) Processing with supplied materials, where the domestic processors receive but do not purchase materials supplied and owned by foreign entities, process or assemble on order and charge only processing fees when returning the finished products (case A);
3) Outward processing is the opposite of (2), foreign entities receive but do not purchase raw and supplemental materials, parts, components and semi-final products supplied and owned by Chinese entities, process or assemble on order and send the finished products to the same Chinese entities after processing.
The total exports and imports related to processing increased rapidly in the past decades. For example, the total volume of goods sent for processing in 1981 was USD 2.5 billion, only 6 per cent of total foreign trade of China while in 2011, the total volume of goods under processing amounted to USD 1306 billion, 36 per cent of total foreign trade of China. Industrial processing is the main source of foreign trade surplus in China. Processing with imported materials
Measuring global production: data sources and compilation challenges
64
dominates, while the ratio of processing with supplied materials decreased over time. Processing activities have extended from low value added downstream manufacturing to more sophisticated upstream manufacturing, with domestic contribution increasing over time.
In China the Customs is the authority to disseminate goods for processing exports and imports data. Applying the principles of BPM6 leads to the following classification of the above mentioned processing arrangements. Only processing with supplied materials (2) and outward processing (3) are in line with the manufacturing services without a change of ownership, while a substantial part of processing with imported materials should be reclassified from goods for processing to general merchandise under goods account in the balance of payments because change of ownership on goods occurs. Based on Customs data, only net exports of processing can be derived, which in many cases do not equal to the service charges. Also, a complicating factor is that the Customs’ classifications on foreign trade are different from those set in BPM6.
Data analysis and cross-checking of inter-agency data in the so-called International Transaction Reporting System leads to improvements in the estimates of processing with imported materials, processing with supplied materials and outward processing. To some degree, this additional data analysis also enables the State Administration of Foreign Exchange to collect service fees of different types of goods for processing and improve the data quality in the future. Cross-border receipts and payments of processing with supplied materials and outward processing may be potential alternatives to the statistics on the relevant goods for processing by the Customs. This is because the former is in better position to meet BPM6 requirements. Furthermore, conceptually speaking, the difference between cross-border receipts and payments is manufacturing services on physical inputs owned by others. However, to get more accurate data, in-depth study on this issue should be made in the future.
Country case study 5.3 The “Maquiladora” Industry Program in Mexico
The “Maquiladora” Industry Program consisted of enterprises that, with the authorization of Mexico’s Secretariat of Economy, temporarily imported goods for manufacturing, assembly or repair with the intention of subsequently exporting them. The “Maquiladora” regulation was replaced by the Manufacturing, Maquila and Export Service Industry (IMMEX) program in 2006. Enterprises under the Maquiladora regulation were exempt from the payment of duties and taxes if their finished products were sold abroad. The regulation began in the mid-1960s with the Policy for the Industrialization of the Northern Border and the purposes were promoting Foreign Direct Investment (FDI), developing the manufacturing industry and creating employment.
Enterprises admitted to the Maquiladora Industry Program spread across Mexico, with the majority located in the north of Mexico, where they took advantage of the proximity of the U.S. The Mexican authorities determined which goods in terms of their Harmonized System (HS) codes could be imported and exported. Any change in the registered and approved items was reported to the authorities for re-approval under new HS codes. Goods produced by the “Maquiladora” industry could leave Mexico without any restriction on their destination. It was assumed that all goods temporarily imported by the “Maquiladora” enterprises were goods for processing. These enterprises were delivering manufacturing services on inputs owned by others. Change of ownership was only recognized when the enterprise paid duties and taxes on the imported goods to sell the finished products to the domestic market. These transactions were identified by specific customs records.
The sources for the statistics on goods for processing until 2006 were the customs records used for the merchandise trade statistics and the monthly survey of the “Maquiladora” Industry carried out by the National Institute of Statistics and Geography (INEGI). It was mandatory for the “Maquiladora” enterprises to respond to the survey that asked about employment and salaries, purchases and consumption of goods and services as well as the value added of exports. The value added of exports corresponded with the processing fee since it included the wages and salaries, domestic expenses and profits. The 2006 statistics showed that there were almost 3,000 “Maquiladora” enterprises employing 1.2 million persons and the total value of processing fees was USD 24 billion. With the start of the IMMEX Program the customs records changed. As a result there was no longer information available to distinguish the goods for processing and calculate the manufacturing services on inputs owned by others because the IMMEX Program involves different kind of enterprises, production processes and foreign trade transactions. This is why INEGI started collecting statistics for this new group of enterprises on merchandise trade by enterprise characteristics (TEC), including a linkage of customs records to obtain information on export market relationships, with a key focus on goods sent to Mexico for processing.

Measuring global production: data sources and compilation challenges
65
Country case study 5.4 Measuring trade in goods and services on a change of ownership basis: the example of China/Hong Kong SAR
China/Hong Kong SAR applies the change in ownership principle in compiling statistics on goods sent abroad for processing and merchanting since 2012. Experiences and challenges in measuring international trade in line with the 2008 SNA and BPM6 recommendations are outlined in this case study.
Hong Kong is one of the most externally oriented economies in the world. Trading activities related to goods sent abroad for processing and merchanting play a vital role in the external trade of Hong Kong. As early as in the 1980s, many manufacturing companies in Hong Kong started to relocate their production processes to Mainland China to take advantage of the geographical proximity and lower production cost there. Raw materials and semi-manufactures are transported to factories in Mainland China for processing and the processed goods are returned to Hong Kong for local consumption or for re-export. The share of processing trade in Hong Kong’s imports from Mainland China (based on cross-border registration) increased between 1991 and 2000 from 67 to 79 per cent. This share decreased to a level of 38 per cent in 2013.
The majority of the goods sent to Mainland China for processing in the 1990s, was under the arrangement of “processing and assembling” (P&A) in which the raw materials sent to Mainland China for processing and the finished output after processing remained property of Hong Kong-based companies throughout the process, i.e. there was no change of ownership. The processed goods would normally be returned to Hong Kong for subsequent re-exportation to overseas markets. During the 2000s, processing arrangements were gradually shifted to “processing with imported materials” (PIM). Under the PIM arrangement, the ownership of the imported inputs is transferred to the processing units in Mainland China, and the processed goods might not be returned to Hong Kong. As a result of the shift from P&A to PIM arrangement, the volume of processed goods returned to Hong Kong showed only a moderate increase in the 2000s as compared to the 1990s. New data on processing trade under both P&A and PIM arrangements are collected to implement the change of ownership principle. The new data also support analysis of the structural changes from P&A to PIM arrangements at broad industry level.
Value of goods sold without passing through Hong Kong and exports of goods of Hong Kong
While re-imports to Hong Kong still remained the major mode, its share (as a percentage of the value of raw materials/semi-manufactures sent to Mainland China for processing) had somewhat declined in the past decade or so, from 78 per cent in 2000 to 71 per cent in 2012. On the other hand, the share of processed goods exported directly to overseas markets had gradually increased. Parts of these goods are processed under the P&A arrangement, and hence should be recorded as exports of goods of Hong Kong instead of Mainland China under the change of ownership principle. On the other hand, merchanting activities undertaken by Hong Kong companies have prospered since the 2000s. Hong Kong traders engage in a substantial amount of merchanting activities to take advantage of their extensive trading network with buyers and sellers in the global market. The total value of goods sold without passing through Hong Kong amounted to USD 535 billion in 2013, about 5 times the value in 2000. As a result, since 2010 the value of goods without passing through Hong Kong had become higher than the overall value of total exports of goods from Hong Kong.

Measuring global production: data sources and compilation challenges
66
Companies in Hong Kong typically undertake three types of global production arrangements: outward processing, merchanting and offshore trade activities involving outward processing. Their measurement based on the 2008 SNA and BPM6 principles is further discussed below.
Outward processing
Given the importance of processing trade between Hong Kong and Mainland China, the Census and Statistics Department of Hong Kong has been conducting a Survey on Trade Involving Outward Processing in the Mainland of China (OP Survey) since the late 1980s to capture data on outward processing activities. The OP Survey is conducted on a monthly sample of import/export trade declarations. While basic information regarding the sampled consignments (such as trade type, trade value, commodity type and market) can be collected from trade declarations, the required information on outward processing is obtained by computer-assisted telephone interviews with the establishments concerned. For the purpose of implementing the change of ownership principle, the OP Survey has been enhanced since the second quarter of 2008 to collect additional data on the P&A contracts. Enhancements include collecting additional information on the following breakdowns pertaining to imports from Mainland China which involve outward processing of goods under the P&A arrangement:
• Value of raw materials/semi-manufactured goods sent from Hong Kong to Mainland China
• Value of raw materials / semi-manufactured goods purchased and delivered directly from places other than Hong Kong to Mainland China
• Value of manufacturing services on physical inputs owned by Hong Kong, with the following breakdowns:
- Processing fees paid by Hong Kong
- Raw materials/semi-manufactured goods procured directly by Mainland China’s processing units
To support the compilation of more detailed trade statistics under the change of ownership principle and the conduct of more in-depth trade analysis, the quarterly sample size of the OP Survey has been enlarged significantly (more than doubled) over the past years. This has enabled the compilation of reliable estimates of the above mentioned additional breakdowns. To meet the timeliness requirement of GDP and balance of payments estimates, preliminary estimates of goods related to outward processing, applying the change of ownership principle, have been produced at an aggregate level, at a shorter time lag, using partial survey results and data modelling.
Merchanting and offshore trade activities involving outward processing
Considering the significance of merchanting activities in Hong Kong’s trade in services, the Census and Statistics Department of Hong Kong has been collecting the relevant data via the Annual Survey of Imports and Exports of Services (ASIES) since the 1990s. Data on the sales of goods and cost of goods sold under merchanting are regularly collected to compile the value of merchanting services provided by Hong Kong traders. Offshore trade activities involving outward processing refer to trading activities in which goods are processed under P&A contracts, and subsequently sold to non-residents directly without the goods passing through Hong Kong. Under the previous treatment, the gross margin of offshore trade activities involving outward processing was recorded as trade in services. However, as the goods sold involve actual buying and selling activities (with a change of ownership), the new principle stipulates that sales of such goods should be recorded as trade in goods. The processing fee involved is to be recorded as an import of manufacturing services on physical inputs owned by Hong Kong traders. To meet the data requirements on merchanting arising from the new principle in a timely manner, the Census and Statistics Department of Hong Kong has implemented a new Quarterly Survey of Merchanting and Other Trading Activities (QSMTA) since the first quarter of 2010. However, only aggregate data are collected to minimize response burden. More detailed data, e.g. the value of sales of goods under merchanting by broad commodity group and by country/territory, continue to be collected on an annual basis via the ASIES.
Apart from collecting the value of sales and cost of goods sold under merchanting, the new quarterly survey also provides additional data related to offshore trade activities involving outward processing. This information cannot be otherwise collected from trade declarations or from the OP Survey of which the reporting unit is based on trade declarations, as these goods do not cross the boundary of Hong Kong. The following additional data are collected on offshore trade activities involving outward processing activities via the QSMTA:
• Value of goods sold offshore after processing
• Cost of goods sold offshore after processing, with further breakdowns into:
- Value of raw materials/semi-manufactured goods sent from Hong Kong to the processing economy
- Value of raw materials/semi-manufactured goods purchased and delivered directly from places other than Hong Kong to the processing economy
Measuring global production: data sources and compilation challenges
67
- Value of manufacturing services on physical inputs owned by Hong Kong, with the following breakdowns:
- Processing fees paid by Hong Kong
- Raw materials/semi-manufactured goods procured directly by the processing units abroad
On average, about 2000 establishments are selected for enumeration in each survey round of QSMTA, of which 800 are certainty cases. These certainty cases have been identified to be very prominent in terms of trade in services or merchanting receipts, based on the survey returns in previous rounds of ASIES and QSMTA. The coverage of the QSMTA is reviewed on an annual basis to ensure a good representation of establishments engaged in merchanting and trade in services activities in the survey.
Country case study 5.5 The recording of foreign trade in the Czech Republic according to the 2008 SNA principles
The Czech Republic has a small and open economy, which is export dependent. The international orientation of the Czech economy increased significantly after the EU accession, which gave rise to considerable FDI inflows at the beginning of the century. Economic and customs union also led to an implementation of a common VAT system and a harmonized system of data collection on foreign trade. As a result, the valuation of trade flows, based solely on the recording of cross-border movements of goods, overestimates the country’s trade balance in comparison with the value added created by residents and evidence obtained from the financial accounts. This shows that in the Czech Republic cross-border movements of goods increasingly diverge from foreign trade as recorded on the basis of a change of ownership between residents and non-residents.
Consequently, the traditional primary data sources on international merchandise trade (Intrastat and Extrastat in EU Countries), which are based on the recording of cross-border movements of goods, must be adjusted or complemented with other data sources in order to estimate foreign trade in the national accounts of the Czech Republic. In 2010, a new concept of foreign trade was introduced by the Czech Statistical Office, labelled as the “national concept” to distinguish it from the “cross-border concept” that is based purely on cross-border movements. Since then, the national concept has been used as a main foreign trade data input for national accounts and balance of payments instead of the cross-border concept. Since 2014, the national concept has been published monthly as the main macro-economic indicator on foreign trade in the Czech Republic.
Moreover, there are adjustments conducted in national accounts and balance of payments in order to follow the 2008 SNA, European system of national and regional accounts 2010 (ESA 2010) and BPM6 principles. This case study explains the main steps needed to move from the cross-border primary data source to the national concept and from the national concept to the “change of ownership” recording of trade required by the 2008 SNA, ESA 2010 and BPM6.
From cross-border concept to national concept of foreign trade
Traditionally IMTS have been based on the cross-border concept, i.e. purely on primary data on physical movements of goods across the borders. However, free movement of goods and free trade within the Single market of the EU creates a serious problem for the compilation of merchandise trade based on cross-border data. In the Single market, any unit is allowed to participate in trade and move goods to any member state. Consequently, a considerable amount of cross-border movements of goods are conducted by non-resident units in the Czech Republic (often with only limited relation to the Czech economy). There are also transactions within the domestic market of the Czech Republic between residents and non-residents, which are not recorded in cross-border merchandise statistics. The national concept takes into account these aspects of the Single market and provides a better approximation of trade between Czech and foreign units. Nonetheless, the national concept must not be confused with export and import in national accounts and balance of payments. There are other adjustments made to the national concept before national accounts and balance of payments aggregates are obtained (see the text below).
The transition from the cross-border concept to the national concept consists of two steps:
1) Exclusion of transactions reported by non-residents in regular IMTS data sources, since these transactions cannot be considered exports or imports for the Czech economy.
2) Inclusion of transactions by non-residents in the Czech domestic market, since these transactions represent the interaction (real trade) between residents and non-residents.
Transactions reported by residents in regular IMTS data sources remain unchanged and are identical in both concepts (however, there are further adjustments in national accounts and balance of payments, see the text below).
Step 1 - Exclusion: The cross-border transaction reported by non-residents in regular IMTS cannot be considered exports or imports for the Czech economy since either:
Measuring global production: data sources and compilation challenges
68
a) The goods crossing the borders did not result from trade between a resident and non-resident unit (so-called quasi-transit trade), or;
b) The goods crossing the borders resulted from trade in the domestic market between resident and non-resident units but were purchased at considerably different prices than reported at the borders (the trade in the domestic market is considered export and import – see step 2).
Quasi-transit trade is usually associated with the import of goods by non-residents into the reporting economy from a non-EU country (data collected by Extrastat), which is followed by the subsequent export of goods into another EU country (data collected by Intrastat). The same phenomenon can also occur for exports. This phenomenon mainly affects countries at the EU borders. However, quasi-transit trade may occur also within the EU and have analogous impact on the estimate of exports and imports in the EU country. These transactions are usually related to warehouse facilities or distribution centres that are primarily intended for the whole European market and not for the Czech domestic market. Due to its convenient location, the territory of the Czech Republic is often used as such a transit (storage) area for goods on the way from the country of production to the final markets. Note the difference between quasi-transit trade and re-export: in case of re-export the owner of the goods is resident.
Quasi-transit trade inflates not only the value of cross-border exports and imports compared to the real exports and imports (followed by financial transactions between residents and non-residents) but also the estimation of cross-border balance of trade. This is because the value of exports related to quasi-transit trade is usually significantly higher than imports due to revaluation of the goods in the warehouses by the owner (non-resident unit) from cost or in-house prices to final customer prices.
The identification of quasi-transit trade in primary data sources (Intrastat, Extrastat) is not easy. In case of Intrastat, there is no specific nature of transaction code to mark these transactions. As for Extrastat, many countries can identify quasi-transit trade by a specific customs procedure. However, it is usually not declared under this customs procedure in the Czech Republic, because it is more convenient for non-resident units to register for VAT in the Czech Republic, declare imports under a free-circulation customs procedure (without any collateral conditions) and subsequently export goods via Intrastat to another EU country. Therefore, in the Czech Republic it is impossible to distinguish goods related to quasi-transit trade from goods that are intended for the Czech market. From a practical point of view, at the moment of physical import of the goods into a warehouse, not even the owner of the goods can usually determine the goods that would be sent to another country or would end up in the domestic market of the Czech Republic.
Nonetheless, the difficulties associated with identification of quasi-transit trade should not prevent the compilation according to the national concept, because by definition all cross-border transactions reported by non-residents are not relevant to the real foreign trade of the Czech Republic. If the good is physically imported into the Czech territory and sold by a non-resident in the Czech domestic market, then it is the trade value of the sale that is taken as import value for the domestic economy (not the value reported by non-residents at the borders, which is often lower than that at sale). Similarly, if the good is purchased by a non-resident unit in the Czech domestic market and subsequently exported from the Czech territory, it is the value of the purchase that has to be considered as export (not the value reported by non-residents at the borders, which is often higher than that at purchase).
Step 2 – Inclusion: Sales or purchases between non-residents and Czech residents in the Czech domestic market are considered imports and exports for the Czech economy. Thus, contrary to the cross-border concept, the difference between the real trade value (at the moment of change of ownership) and the value reported at the borders by non-residents is not included in exports, imports and the balance of trade following the in national concept. The estimation of sales and purchases by non-residents are based on VAT returns submitted by non-residents in the Czech Republic. The estimation of the commodity and territorial breakdown of sales and purchases by non-residents (not provided in VAT returns) are based on cross-border transactions breakdowns and also on industrial surveys, which distinguish between output sold by Czech producers in the domestic market to non-residents (often to a related company) or directly/indirectly across the borders or in the domestic market to residents.
Conclusion of the national concept: The transition from the cross-border concept to the national concept consists of removing shipments of goods as reported by non-residents in Intrastat and Extrastat as they do not represent any change in ownership between residents and non-residents and substituting them with non-residents’ purchases or sales in the Czech Republic. This procedure solves both the adjustment of price differences between the value in the Czech domestic market and the value reported at the borders and eliminates quasi-transit trade. The goods sent by residents directly across the borders remain unchanged in both concepts, since it still can be assumed that the cross-border movement marks the change of ownership between residents and non-residents (and if not, it is adjusted in national accounts and balance of payments).
Transactions declared by non-residents represent 25 per cent of exports and more than 18 per cent of imports in the IMTS (in 2014). Most of the surplus in the balance of trade based on cross-border movements was created by non-

Measuring global production: data sources and compilation challenges
69
residents (75%). Therefore, the difference between the national concept balance and the cross-border IMTS was about -10.5 billion euros (EUR) in 2014. The balance is EUR 5.6 billion according to the national concept instead of EUR 16.0 billion according to the physical movement of goods (see reconciliation table at end of this case study). Moreover, since there are further adjustments conducted in national accounts and balance of payments when compiling statistics on import and export of goods, e.g. for goods sent for processing, the balance in goods in national accounts and balance of payments is usually even lower than the balance in the national concept.
Annual balance of trade (CIF/FOB18) of the Czech Republic
Measuring goods sent for processing
The national concept of foreign trade is used for the input data for compiling export and import of goods in national accounts and balance of payments. The most significant adjustment in national accounts and balance of payments is the exclusion of the goods sent/received for processing, i.e. cross-border flows of goods without change of ownership, as observed via IMTS data sources. The exclusion of goods sent/received for processing is focused only on transactions reported by residents, because non-resident transactions related to processing (along with all other cross-border non-resident transactions) are already excluded from the national concept. These resident-reported transactions are excluded based on the special nature of transaction code (2-digit in Intrastat and 1-digit in Extrastat).
However, not all nature of transactions codes that are labelled and collected in Intrastat as “goods sent for processing” should be excluded. For example, there is a special nature of transaction code: goods sent abroad for processing without goods returning back, because the goods are sold abroad. In this case the good is not excluded from export (with a minor adjustment in value of goods to take into account the processing services received). Since the nature of transactions can be misreported (especially after processing) in Intrastat, more detailed control procedures were established in the system of data collection by the Department of Foreign Trade Statistics.
With regard to processing services, the difference between goods crossing the borders before and after processing cannot serve at a macro-economic level as a proxy for processing fees, because there are services provided/received without goods crossing the borders. Therefore, since 2013, processing fees are surveyed quarterly in the statistical survey on import and export of services in 14 commodity groups based on the Czech version of the Classification of Products by Activities (CPA). For annual revisions conducted during the balancing of the supply-use table, an annual industrial survey with a commodity breakdown according to Classification of manufactured goods in the European Community (PRODCOM) groupings is used in order to obtain the overall value of export of processing services (i.e., inward processing).
Measuring merchanting
Merchanting is another important adjustment in national accounts and balance of payments compilation. Traditional merchanting is observed via the statistical survey of import and export of services, in which the values of goods
purchased and sold abroad by residents are surveyed (the resident is a trader). As required, merchanting is recorded as net export of goods.
18 Imports including cost, insurance and freight (CIF) adjusted to free on board (FOB) value.

Measuring global production: data sources and compilation challenges
70
Further, the so-called inverse merchanting is recorded in the Czech national accounts and balance of payments. Inverse merchanting in the Czech Republic was discovered when VAT data, and non-residents’ VAT returns in particular, were examined in full detail. Inverse merchanting occurs when non-residents buy and sell goods solely within the domestic market of the Czech Republic without goods leaving the Czech territory (the non-resident is a trader, and residents are both buyers and sellers). As there is a change of ownership between residents and non-residents, the transactions must be considered either export or import of goods, even without any recording of cross border movements of the goods. The trade margin obtained by these non-residents may cause a discrepancy between resources and the use side of the supply-use tables if not properly observed. It is conceptually analogous to traditional merchanting from the resident point of view. In the Czech Republic this inverse merchanting is, therefore, recorded under net import of goods.
Other methodical adjustments for exhaustiveness in national accounts and balance of payments
Following the ultimate change of ownership principle and exhaustiveness required by ESA 2010, 2008 SNA and BPM6, there are other adjustments carried out in the Czech national accounts and balance of payments, such as illegal activities, exclusion of other cross-border flows without a change in ownership (e.g. operating lease, other lease assets), supplies below threshold, exclusion of duplicates (between goods and services) and goods purchased at ports and borders.
Reconciliation table for foreign trade in goods – from cross-border data to national accounts and balance of payments aggregates, preliminary estimates for year 2014 (in EUR million)
Country case study 5.6 The Philippine experience on improving the methodology on electronics import statistics
Questions on the reliability and accuracy of published imports and exports data have been raised in the Philippines. Although an improvement in the trade balance has been observed, with electronics industry as the main driver of exports growth, there was no corresponding increase in the respective materials. Further, a comparative study showed that reported material value of electronic exports exceeded imported raw materials in spite of the fact that electronics are highly import-dependent. These observations led to the expectation that there was underestimation of imports, specifically on consigned electronic goods. Hence, this study focuses on improving the capture and valuation of consigned electronics in the Philippines.
In the Philippines, exports and imports of electronics are grouped into nine components, namely: (1) components/devices of semiconductors; (2) electronic data processing; (3) office equipment; (4) consumer electronics; (5) telecommunication; (6) communication/radar; (7) control instrumentation; (8) medical/industrial instrumentation and (9) automotive electronics.
In 2011, Philippine exports of electronics accounted for 61 per cent, 55 per cent in 2012 and 52 per cent in 2013 vis-à-vis the country’s total exports. On the other hand, electronic imports accounted for 32 per cent, 35 per cent and 30 per cent of total imports in 2011, 2012 and 2013, respectively.
To address the issue of reliability and accuracy of published exports and imports data, a task force on import statistics was created by the Central Bank of the Philippines (BSP). This task force was composed of representatives from the BSP, National Economic and Development Authority (NEDA), National Statistical Coordination Board (NSCB) and the NSI. On the basis of the joint report presented by the task force, the NSCB Executive Board directed the NSI to revise the time series of imports data to account for the underestimation and to put recent developments in the balance of
payments and external accounts into proper perspective, including the estimation of exports and imports of goods for the national accounts.
Export of goods Import of goods BalanceCross-border foreign trade (IMTS) - CIF/FOB 131452 115381 16071
of which: Non-residents cross-border transactions (-) -33156 -21128 -12028Purchases by non-residents from residents in the domestic market 16240 . .Sales by non-residents to residents in the domestic market . 14724 .National concept of foreign trade 114535 108977 5558
Exclusion of goods sent/received for processing (-) -4186 -3706 -480Traditional merchanting (residents) 279 . .Negative merchanting (non-residents) . 399 .Other methodical adjustments for exhaustiveness* -16 113 -129
Foreign trade in NA/BoP - CIF/FOB 110612 105783 4829* For example, supplies below threshold, illegal activities, exclusion of duplicities (betw een services and goods), operating lease
Adjus
tmen
tsin
NA/B
oP

Measuring global production: data sources and compilation challenges
71
The task force through the BSP and NSI conducted a joint Survey of Imported Raw Materials with the top 15 electronic companies as respondents. Based on the results of the survey, the task force came up with a proposed methodology for the revision of imports data which was presented and approved by the NSCB Executive Board. Using this approved methodology and responses of top 10 sample companies in a subsequent survey, the NSI computed and released the revised import data for 2002 together with revised monthly imports data for 2000 and 2001.
The task force on Import Statistics continued to find ways to further improve the valuation methodology and continuously informed the Board on its activities, particularly, the provision of instructions for importers and exporters on the proper filling out of import/export declaration forms and the importance of providing correct information. In 2004, the task force presented its recommendations to the NSCB Executive Board. One recommendation was the creation of the Inter-Agency Committee on Trade Statistics (IAC-TRS), which continued the work of the task force by exploring means to further improve the valuation methodology. While the Survey of Imported Raw Materials was conducted to correct imports, the underestimation was only partially addressed as the NSI limited the correction to the sampled companies only. The survey suffered from poor quality of responses from some companies such that the survey data could not be used to correct subsequent reports. Further, having a joint survey on a regular basis is not sustainable due to budget constraints and response burden. As the underestimation persisted, the IAC-TRS continued to consult with the Semi-conductors and Electronics Industries of the Philippines, Inc. (SEIPI) and other electronics companies.
A series of briefings on the Automated Export Data Documentation System (AEDS) of the Bureau of Customs (BOC) have likewise been conducted by the IAC-TRS to provide directions on the proper filling out of the customs declaration forms for the purpose of correcting under/over coverage of electronics exports. The AEDS training also provided an insight into the electronic industry as a whole and strengthened the initial findings in the previously held dialogues with the electronics industry. Some of the major findings were:
• The industry functioned largely under consigned arrangement/outsourcing in which manufacturing is limited to mostly assembly work; and therefore, local value added is relatively low. The value added, or the amount that local companies charged to the foreign companies for assembly work, enters the local company books as its revenue. Note that free on board (FOB) values of exports and imports under consigned arrangements are not entered in the books of the local companies.
• Companies do not know the exact value of received shipments and have no urgent need to know since, as previously mentioned, these are off balance sheet items. In most cases, import values are dictated by the foreign companies whose only use for the companies is to comply with customs declaration.
• For big companies, declaration is done by brokers and forwarders who would not be in a position to report the true value of imports.
• Moreover, since consigned imports are are not subject to duty, they are not examined thoroughly by customsand, therefore, any error in valuation would not be corrected.
Given the above observations, it is unlikely that the present monitoring system that is purely dependent on documents, Import Entry and Internal Revenue Declaration (IEIRD) collected by the NSI from BOC, will give a good measure of the true value of imports. Hence, the IAC-TRS proposed another methodology to estimate the true measure of imports of consigned electronics using the material value of electronic exports derived from the Export Declarations (ED) instead of the FOB import figures from the IEIRD of consigned electronics exports.
The methodology proposed by the IAC-TRS involved the use of the information compiled from the ED and AEDS collected by the NSI from the BOC. One limitation in using the BOC forms is the reliability of the information contained therein. There are cases where the material value content of exports is not filled out. The mandatory filling out of this information is, thus, a necessary step to have more reliable information. Detailed steps are as follows:
1) Generate the top 25 electronic exporters for the year in terms of their FOB value of exports. The top 25 comprise 85 to 87 per cent of the total FOB value of electronic exports.
2) Categorize these electronic exporters according to how they acquire raw materials, that is, whether the raw materials are acquired on a consignment basis (consigned exporters), or directly imported (direct exporters) or both (mixed exporters).
3) Generate a file for consigned exporters consisting of their FOB value of exports (X) and the value of raw materials (material value) reported in the ED and the FOB value of imports (M) from IEIRD.
4) Validate the value of raw materials (MV) with the import (M) figures:
• If the material value (MV) of the exporter is greater than imports (M), replace the value of imports with its material value to get the revised import (M')
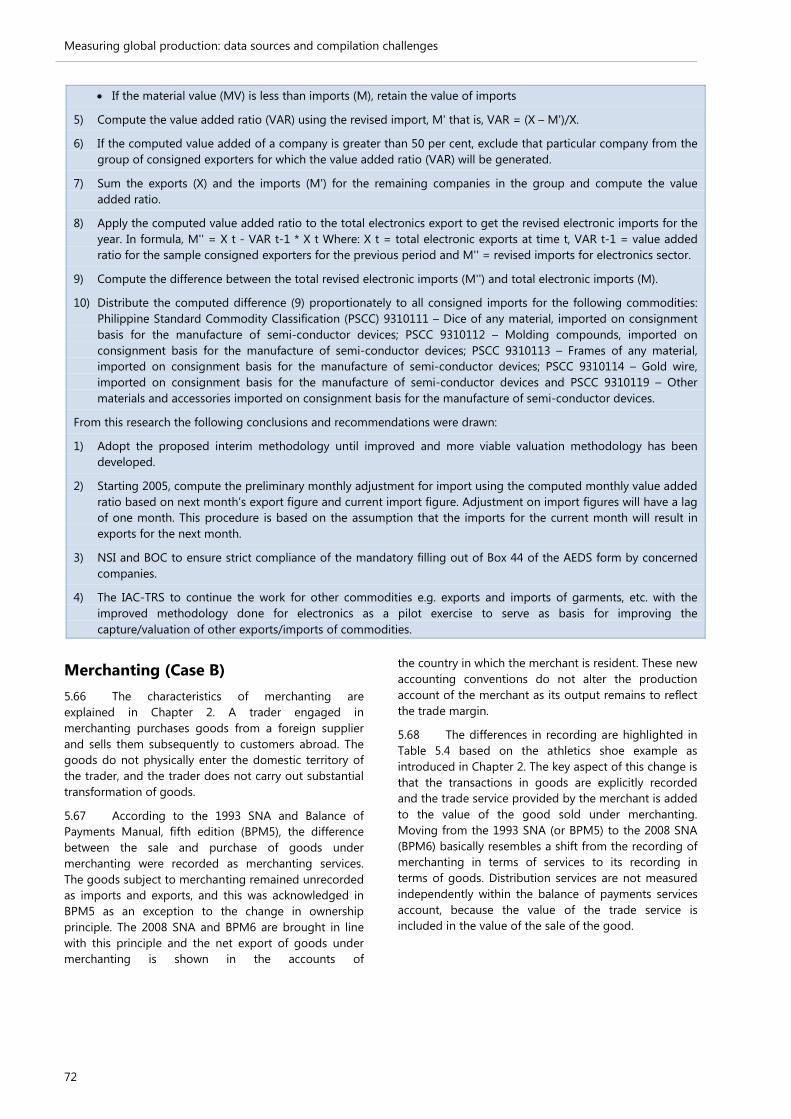
Measuring global production: data sources and compilation challenges
72
• If the material value (MV) is less than imports (M), retain the value of imports
5) Compute the value added ratio (VAR) using the revised import, M' that is, VAR = (X – M')/X.
6) If the computed value added of a company is greater than 50 per cent, exclude that particular company from the group of consigned exporters for which the value added ratio (VAR) will be generated.
7) Sum the exports (X) and the imports (M') for the remaining companies in the group and compute the value added ratio.
8) Apply the computed value added ratio to the total electronics export to get the revised electronic imports for the year. In formula, M'' = X t - VAR t-1 * X t Where: X t = total electronic exports at time t, VAR t-1 = value added ratio for the sample consigned exporters for the previous period and M'' = revised imports for electronics sector.
9) Compute the difference between the total revised electronic imports (M'') and total electronic imports (M).
10) Distribute the computed difference (9) proportionately to all consigned imports for the following commodities: Philippine Standard Commodity Classification (PSCC) 9310111 – Dice of any material, imported on consignment basis for the manufacture of semi-conductor devices; PSCC 9310112 – Molding compounds, imported on consignment basis for the manufacture of semi-conductor devices; PSCC 9310113 – Frames of any material, imported on consignment basis for the manufacture of semi-conductor devices; PSCC 9310114 – Gold wire, imported on consignment basis for the manufacture of semi-conductor devices and PSCC 9310119 – Other materials and accessories imported on consignment basis for the manufacture of semi-conductor devices.
From this research the following conclusions and recommendations were drawn:
1) Adopt the proposed interim methodology until improved and more viable valuation methodology has been developed.
2) Starting 2005, compute the preliminary monthly adjustment for import using the computed monthly value added ratio based on next month’s export figure and current import figure. Adjustment on import figures will have a lag of one month. This procedure is based on the assumption that the imports for the current month will result in exports for the next month.
3) NSI and BOC to ensure strict compliance of the mandatory filling out of Box 44 of the AEDS form by concerned companies.
4) The IAC-TRS to continue the work for other commodities e.g. exports and imports of garments, etc. with the improved methodology done for electronics as a pilot exercise to serve as basis for improving the capture/valuation of other exports/imports of commodities.
Merchanting (Case B) 5.66 The characteristics of merchanting are explained in Chapter 2. A trader engaged in merchanting purchases goods from a foreign supplier and sells them subsequently to customers abroad. The goods do not physically enter the domestic territory of the trader, and the trader does not carry out substantial transformation of goods.
5.67 According to the 1993 SNA and Balance of Payments Manual, fifth edition (BPM5), the difference between the sale and purchase of goods under merchanting were recorded as merchanting services. The goods subject to merchanting remained unrecorded as imports and exports, and this was acknowledged in BPM5 as an exception to the change in ownership principle. The 2008 SNA and BPM6 are brought in line with this principle and the net export of goods under merchanting is shown in the accounts of
the country in which the merchant is resident. These new accounting conventions do not alter the production account of the merchant as its output remains to reflect the trade margin.
5.68 The differences in recording are highlighted in Table 5.4 based on the athletics shoe example as introduced in Chapter 2. The key aspect of this change is that the transactions in goods are explicitly recorded and the trade service provided by the merchant is added to the value of the good sold under merchanting. Moving from the 1993 SNA (or BPM5) to the 2008 SNA (BPM6) basically resembles a shift from the recording of merchanting in terms of services to its recording in terms of goods. Distribution services are not measured independently within the balance of payments services account, because the value of the trade service is included in the value of the sale of the good.
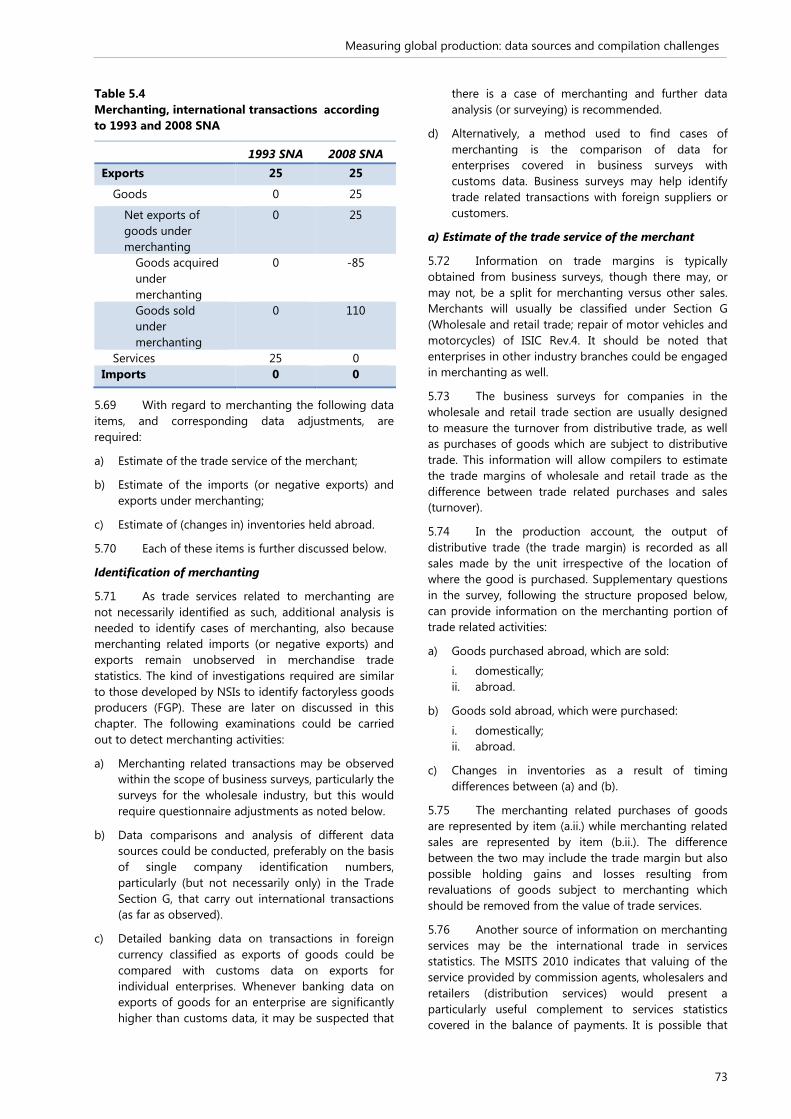
Measuring global production: data sources and compilation challenges
73
Table 5.4 Merchanting, international transactions according to 1993 and 2008 SNA
1993 SNA 2008 SNA Exports 25 25
Goods 0 25
Net exports of goods under merchanting
0 25
Goods acquired under merchanting
0 -85
Goods sold under merchanting
0 110
Services 25 0 Imports 0 0
5.69 With regard to merchanting the following data items, and corresponding data adjustments, are required:
a) Estimate of the trade service of the merchant;
b) Estimate of the imports (or negative exports) and exports under merchanting;
c) Estimate of (changes in) inventories held abroad.
5.70 Each of these items is further discussed below.
Identification of merchanting
5.71 As trade services related to merchanting are not necessarily identified as such, additional analysis is needed to identify cases of merchanting, also because merchanting related imports (or negative exports) and exports remain unobserved in merchandise trade statistics. The kind of investigations required are similar to those developed by NSIs to identify factoryless goods producers (FGP). These are later on discussed in this chapter. The following examinations could be carried out to detect merchanting activities:
a) Merchanting related transactions may be observed within the scope of business surveys, particularly the surveys for the wholesale industry, but this would require questionnaire adjustments as noted below.
b) Data comparisons and analysis of different data sources could be conducted, preferably on the basis of single company identification numbers, particularly (but not necessarily only) in the Trade Section G, that carry out international transactions (as far as observed).
c) Detailed banking data on transactions in foreign currency classified as exports of goods could be compared with customs data on exports for individual enterprises. Whenever banking data on exports of goods for an enterprise are significantly higher than customs data, it may be suspected that
there is a case of merchanting and further data analysis (or surveying) is recommended.
d) Alternatively, a method used to find cases of merchanting is the comparison of data for enterprises covered in business surveys with customs data. Business surveys may help identify trade related transactions with foreign suppliers or customers.
a) Estimate of the trade service of the merchant
5.72 Information on trade margins is typically obtained from business surveys, though there may, or may not, be a split for merchanting versus other sales. Merchants will usually be classified under Section G (Wholesale and retail trade; repair of motor vehicles and motorcycles) of ISIC Rev.4. It should be noted that enterprises in other industry branches could be engaged in merchanting as well.
5.73 The business surveys for companies in the wholesale and retail trade section are usually designed to measure the turnover from distributive trade, as well as purchases of goods which are subject to distributive trade. This information will allow compilers to estimate the trade margins of wholesale and retail trade as the difference between trade related purchases and sales (turnover).
5.74 In the production account, the output of distributive trade (the trade margin) is recorded as all sales made by the unit irrespective of the location of where the good is purchased. Supplementary questions in the survey, following the structure proposed below, can provide information on the merchanting portion of trade related activities:
a) Goods purchased abroad, which are sold:
i. domestically; ii. abroad.
b) Goods sold abroad, which were purchased:
i. domestically; ii. abroad.
c) Changes in inventories as a result of timing differences between (a) and (b).
5.75 The merchanting related purchases of goods are represented by item (a.ii.) while merchanting related sales are represented by item (b.ii.). The difference between the two may include the trade margin but also possible holding gains and losses resulting from revaluations of goods subject to merchanting which should be removed from the value of trade services.
5.76 Another source of information on merchanting services may be the international trade in services statistics. The MSITS 2010 indicates that valuing of the service provided by commission agents, wholesalers and retailers (distribution services) would present a particularly useful complement to services statistics covered in the balance of payments. It is possible that
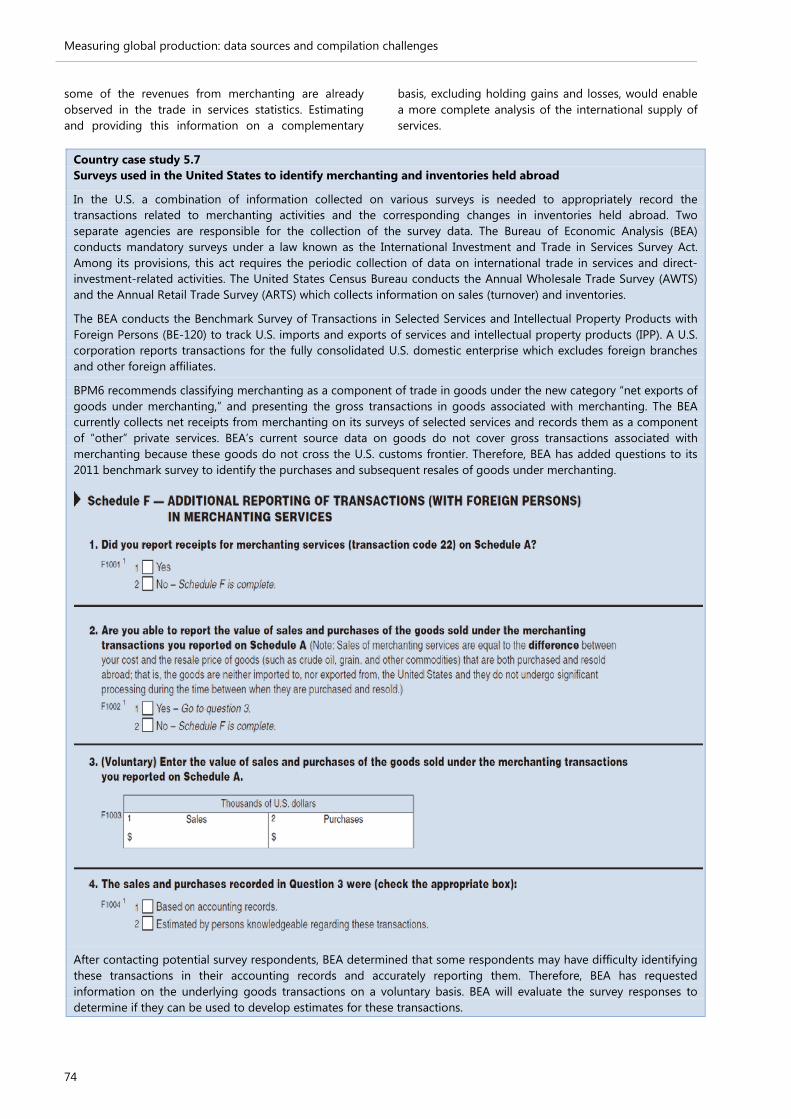
Measuring global production: data sources and compilation challenges
74
some of the revenues from merchanting are already observed in the trade in services statistics. Estimating and providing this information on a complementary
basis, excluding holding gains and losses, would enable a more complete analysis of the international supply of services.
Country case study 5.7 Surveys used in the United States to identify merchanting and inventories held abroad
In the U.S. a combination of information collected on various surveys is needed to appropriately record the transactions related to merchanting activities and the corresponding changes in inventories held abroad. Two separate agencies are responsible for the collection of the survey data. The Bureau of Economic Analysis (BEA) conducts mandatory surveys under a law known as the International Investment and Trade in Services Survey Act. Among its provisions, this act requires the periodic collection of data on international trade in services and direct-investment-related activities. The United States Census Bureau conducts the Annual Wholesale Trade Survey (AWTS) and the Annual Retail Trade Survey (ARTS) which collects information on sales (turnover) and inventories.
The BEA conducts the Benchmark Survey of Transactions in Selected Services and Intellectual Property Products with Foreign Persons (BE-120) to track U.S. imports and exports of services and intellectual property products (IPP). A U.S. corporation reports transactions for the fully consolidated U.S. domestic enterprise which excludes foreign branches and other foreign affiliates.
BPM6 recommends classifying merchanting as a component of trade in goods under the new category “net exports of goods under merchanting,” and presenting the gross transactions in goods associated with merchanting. The BEA currently collects net receipts from merchanting on its surveys of selected services and records them as a component of “other” private services. BEA’s current source data on goods do not cover gross transactions associated with merchanting because these goods do not cross the U.S. customs frontier. Therefore, BEA has added questions to its 2011 benchmark survey to identify the purchases and subsequent resales of goods under merchanting.
After contacting potential survey respondents, BEA determined that some respondents may have difficulty identifying these transactions in their accounting records and accurately reporting them. Therefore, BEA has requested information on the underlying goods transactions on a voluntary basis. BEA will evaluate the survey responses to determine if they can be used to develop estimates for these transactions.

Measuring global production: data sources and compilation challenges
75
The reporting unit on the Census Bureau’s AWTS or ARTS survey cover all wholesale (or retail) establishments in the U.S. reporting payroll under a single employer identification number (EIN). The EIN is a Federal Tax Identification Number and is used to identify a business entity. The end-of-year inventories and inventories held outside the U.S. are collected by industry and not by type of product. Below is an excerpt from the annual wholesale trade survey for the questions specific to inventories. The same questions appear on the ARTS survey.
The questions do not specifically target goods bought and sold under a merchanting arrangements. The data collected could reflect timing differences of when a good is imported into the U.S. and when the change in ownership occurs. However, the data could be used as an indication of the amount of inventories held abroad under merchanting arrangements. The highest percentage of inventories held abroad for merchant wholesalers excluding manufacturing sales branch offices was in the petroleum and products industry, an industry known for its merchanting type arrangements. The results also show that in the year 2011 inventories held abroad by merchant wholesalers represent 4 per cent of total inventories.

Measuring global production: data sources and compilation challenges
76
Country case study 5.8 Implementation of merchanting in the national accounts of the Republic of Korea
Under the 1993 SNA, merchanting was calculated as the value of the goods sold less the cost of purchasing the same goods and at that point in time and was classified in wholesale services. The 2008 SNA recommends that goods under merchanting should be recorded as negative exports on acquisition and positive exports on disposal.
The following steps were taken by the Bank of Korea to measure merchanting according to the 2008 SNA and BPM6 principles. As a first step the total amount of processing and merchanting trade was estimated by determining the difference between International Transactions Reporting System in the Republic of Korea (FEIS) data and customs data by using the following identities:
Exports in FEIS - Exports in customs data – Other exports except customs, processing and merchanting trade = Total Exports of Processing and Merchanting
Imports in FEIS - Imports in customs data – Other imports except customs, processing and merchanting trade = Total Imports of Processing and Merchanting
The second step represents dividing the total amount of processing and merchanting into trade for processing and merchanting using the survey on Processing Activities. As a third step the product composition of goods subject to merchanting is identified by using a survey on Merchaning Activities. Key in this analysis is the reconciliation of valuation methods between the two used sources, FEIS versus customs data, and making the proper adjustments for time lags.
Composition of processing and merchanting trade (2010, USD million)
For identifying the processing related commodity flows the following steps are taken:
1) Identify the known information from customs data. 2) Link the goods for processing with returned goods. 3) Survey and Estimate. 4) Make imports transaction table for outward processing.
For estimating merchanting activities, the following analytical steps are made:
1) Estimate total acquisition and disposal by Merchanting Activities 2) Survey merchanting activities by industries:
- select items subject to merchanting; - acquisition and disposal of each item; - major origin and destination countries.
3) Estimate margin rate of each item. 4) Make exports vector for Merchanting.
Looking at the goods subject to merchanting in the Republic of Korea (reference year 2010), 89.3 per cent consists of Electronic and electrical products, Petroleum and coal products (4.6%), Chemical products (2.7%) Textile products, (1.3%) and Others (2.0%).
Measuring global production: data sources and compilation challenges
77
b) Measuring net exports of goods under merchanting
5.77 One could say that, compared to industrial processing, merchanting leads to the opposite data situation. Industrial processing results in flows of goods in merchandise trade statistics which should not be recorded in the balance of payments. Merchanting leads to net exports (exports minus imports) which remain unobserved in merchandise trade statistics. This means that supplementary sources are needed for their observation.
5.78 As previously discussed, the transactions of goods under merchanting could either be observed by making corresponding adjustments in the business statistics of wholesale traders, or in the international trade in services statistics. The minimum data requirement is to measure at least the trade margin obtained from merchanting. Without information on product transactions, the corresponding product values (purchases and sales) could roughly be derived from the trade service value by making assumptions. However, details on the specific commodity categories will remain unknown. Information on the trade service alone would probably provide a reasonable approximation of the contribution of merchanting to the trade balance. This approximation of imports and exports is obviously a
second best alternative that should only be used when the data collection cannot be expanded in the process of moving from BPM5 to BPM6.
c) Estimate (changes in) inventories held abroad
5.79 Country case study 5.5 shows that inventories held abroad as part of merchanting should be observed by making the appropriate arrangements in the business surveys of wholesale traders. In connection with information on purchases and sales of goods under merchanting, the business survey may be able to provide a comprehensive view of merchanting activities and may support making the distinction between trade services and revaluations of related inventories.
Data validation
5.80 Cases of merchanting which significantly contribute to (trade related) domestic turnover, or are significant from a balance of trade perspective, may require an individual approach on the basis of all available information that is collected for these companies. This may lead to data improvements and filling in the missing bits of the entire merchanting arrangement. An example of such a custom-made analysis is illustrated in the following country case study of Kyrgyzstan.
Country case study 5.9 Merchanting in Kyrgyzstan
Like most countries in the world, Kyrgyzstan is caught up by the process of globalization. International flows of goods, services, capital, labour and income, affect the national economy and -(pose challenges for the statistical measurement). The National Statistical Committee of the Kyrgyz Republic (NSC) is responsible for detecting new phenomena accurately and developing measurement solutions.
Regular statistical reporting does not distinctly show the effects of globalization in the activity of national enterprises. In order to detect aspects of global production, NSC developed an analytical tool and put into practice in 2010. This tool deals mostly with the data of wholesale trade enterprises. While processing regular statistical reports, an automatic comparison is conducted regarding domestic wholesale trade volumes, volumes of production and exports and imports by products. These quasi balances provide current estimations at the level of product groups. The tool enabled NSC to discover some important facts.
There are two large resident enterprises in Kyrgyzstan which occupy a significant place in the national economy. The revenues of these enterprises in 2011 were equal to 0.7 and 0.4 per cent of GDP respectively. These enterprises are monitored through several indicators within regular statistical reporting: gross income (trade margin), goods for resale, expenditures on heat supply and electricity, railway transport, communication, rent, payments of interest on credit, compensation of employees, travel allowances and other expenditures. These indicators reflect the domestic production activities carried out by these companies as recorded in the Kyrgyz national accounts.
Most of these enterprises’ activities consist of wholesale trade in oil products. A specific feature is that these enterprises buy oil products in the Russian Federation which are sold in Kazakhstan. The goods (oil products) are being shipped from the Russian Federation to Kazakhstan directly without entering the economic territory of Kyrgyzstan. This trade in oil products remains unrecorded in the customs statistics and, consequently, does not show up in the foreign trade statistics of Kyrgyzstan.
At the same time, the sales of these oil products are reported by these enterprises as wholesale turnover of domestic trade. Although this turnover is correctly assigned to these two companies, it does not relate to domestic trade de-facto as the oil products do not enter the national territory. Taking into account that Kyrgyzstan is a country with a small market for oil products, the volumes under consideration are quite important regarding the scale of the national economy. The resulting misbalance between the data on trade in the domestic and foreign economies, intermediate consumption and all other data in the input-output framework required reconsideration.

Measuring global production: data sources and compilation challenges
78
The Interstate Statistical Committee of the Commonwealth of Independent States (CIS-STAT) experts together with the NSC statisticians considered the question of how the activity of the described enterprises should be reflected in the compilation of Kyrgyz national accounts. For the recognized clear cases of merchanting, the corresponding recommendations in the 2008 SNA (14.79, 26.21) and BPM6 (10.41-10.49), as well as the recommendations in the Guide “The Impact of Globalization on National Accounts” (6.22-6.23) were applied. This means that the acquisition of goods by these two merchants is shown as a negative export of goods under merchanting while the subsequent sales of the goods id shown as positive export of goods under merchanting. The difference between sales and purchases of merchanted goods represents the “net exports of goods under merchanting” which equals the produced trade services by these two merchants in Kyrgyzstan.
Factoryless goods manufacturing (Case C) 5.81 Under current guidelines FGPs are considered as a special case of merchants. However, due to their specific characteristics and the more active role they take in the manufacturing stages of production it is recommended that FGPs are separately identified within trade classes (see the detailed discussion on the classification and recording the transactions of FGPs in Chapter 2). This separate identification will allow further analysis of the characteristics of FGPs and will inform future revision of international standards to include FGPs in respective manufacturing classes.
5.82 If FGPs are classified in trade, their recording will follow the merchanting arrangements and data items as introduced in the previous section on merchanting are needed. The suggested accounting adjustments when FGPs will be classified to manufacturing are presented in Chapter 2 (paragraph 2.69 and further).
5.83 As mentioned above the first step in advancing the research on FGPs is their separate identification within trade. The following paragraphs propose criteria that are used to detect such companies. It has to be noted that although according to currents standards FGPs are classified under trade, the evidence from countries shows that FGPs may be also found also in manufacturing, commercial services, research or other activities.
Identifying FGPs
5.84 The key challenge is identifying the nature of FGPs’ activities and to distinguish them from trading as it is likely that most FGPs will be classified under trade which is according to the current international recommendations. Although output and production will differ substantially, business surveys may not provide the necessary evidence needed to distinct FGPs from distributors found in the same ISIC-class. Both types of companies will report turnover from sales of manufactured goods combined with purchases of (the same) manufactured goods. Details on production costs will show that both types of firms are not engaged in the physical transformation of goods.
5.85 The distinction between both types of companies is much better described in terms of their
role in the (global) production arrangement, or in other words, the business functions they carry out. Distributors are mainly responsible for bringing manufactured goods from producers to consumers. FGPs take part in the manufacturing process of the goods they buy and sell by delivering the blueprints of goods and managing the production chain. From a measurement perspective it is unfortunate that all these functions, distribution, product development and chain management may be combined within one enterprise. This obviously complicates the picture and the precise classification of companies engaged in this mixture of business functions.
5.86 The first signals helping to identify a FGP is when seemingly traders appear to be huge investors in IPPs and are generating above average trade margins. These high trade margins encapsulate the returns to IPP investment. A complicating factor is of course that such companies may not be included in the sample of research and development (R&D) surveys, when these companies are classified as traders. In other words, two important indicators mark the presence of an FGP. Firstly, a trade margin that encapsulates the value of IPP related services will be substantially larger than that of a pure trader. Secondly, substantive ownership of IPPs, and R&D in particular, does not match very well with purely trade related activities, and this may indicate the presence of an FGP.
5.87 FGPs will employ staff with above average wages per hour including managers, researchers and product designers. Information on the educational attainment of employees obtained from labour surveys may provide further evidence. So, a supplementary step is analysing the quality aspects of labour input. Dedicated R&D or information and communication technology (ICT) surveys may show that substantial parts of the labour input is actually involved in IPP development and related to IPP investment on own account. Substantive shares of high educated labour will usually indicate that employees are engaged in managing production chains rather than in trading.
5.88 Further, manufacturers’ associations may be consulted to list known FGPs, particularly when these companies are known to operate in specific industry branches, the most obvious being consumer electronics and semi-conductor industries.
5.89 Additional detection methods include data comparisons and analysis involving various data sources,

Measuring global production: data sources and compilation challenges
79
preferably on the basis of a single company identification number, such as:
a) Detailed banking data on transactions in foreign currency classified as exports of goods could be compared with customs data on exports for individual enterprises. Whenever banking data on exports of goods for an enterprise are significantly higher than customs data, it may be suspected that there is a case of factoryless production of goods (or merchanting), and the financial reports have to be further examined. However, banking data may be subject to classification problems. Time lags in recording may play a disturbing role as well.
b) Yet another detection method is the comparison of VAT data on exports with customs data on exports for individual enterprises. Whenever for a particular enterprise VAT data on exports are significantly higher than customs data, it may be suspected that there is a case of global manufacturing (or merchanting) and further research is probably required.
5.90 A more structural solution is to capture FGPs in the framework of enterprise surveys, preferably based on their explicit identification in the business register. The proposed review of the ISIC, related to the industrial classification of FGPs, supports this approach.
5.91 Recent country experience shows that questions in business surveys on offshoring the production of goods lead to satisfying results. However, the surveys require additional specific guidance and follow-up with the respondents compared to other surveys, since the observed arrangements may even be more complicated than foreseen at the stage of survey preparation, particularly because enterprises may be engaged in several forms of global production. Enterprises may report payments to sub-contractors; however, without the corresponding sales of products abroad being observed. This may indicate the building up of inventories abroad. Preliminary country results also indicate that the difference between merchanting and factoryless production cannot always be clearly made. This issue is further discussed below.
Delineating FGPs from traders
5.92 Under the current international accounting standards, it is probably sufficient to separately classify all distributers that are engaged in factoryless goods production, the main purpose of this exercise being supporting further analysis of these enterprises. Delineating FGPs from traders has stronger repercussions once FGPs are classified as manufacturers. Particularly for those companies which combine factoryless goods production with distribution related activities, the output of activities must be split in (a) the manufacturing related output (the output of goods at basic prices) and (b) trade related output (the trade
margin). This is not an easy task as it requires splitting the value added of these companies in manufacturing distribution related components.
5.93 The most important step in this decomposition is approximating the capital service of the relevant IPPs on the balance sheet of the company under examination. Expectedly these IPP related capital costs are manufacturing and not trade related. The size of these capital services may give a reasonable indication of whether or not the company is indeed to be classified as an FGP. The residual income element may be allocated as trade margin.
5.94 The concept of capital services is introduced in Chapter 20 of the 2008 SNA. The capital service represents the service flow of an asset to production. Conceptually a capital service should correspond to a capital rental value. For a deeper understanding of the subject, reference is made to the Organisation for Economic Co-operation and Development (OECD) manual on Measuring Capital (2009)19.
5.95 It is possible that an FGP obtains the R&D services of a dedicated R&D service provider. These services could be in the form of a purchase of an R&D asset or the purchase of R&D related capital services. This does not change the nature of the FGP. One advantage of such a situation is that IPP related asset values or capital service values can be directly observed from market transactions.
5.96 For “true” borderline cases a final judgement may be complicated by variability in the outcomes of the analysis over time. This may reflect reality as the relative size of trading and factoryless goods production in total output may vary over the course of several reference periods.
5.97 In conclusion, there are borderline cases for which the required small and detailed differences between trading/merchanting and factoryless goods production (and goods sent abroad for processing) are difficult to make on the basis of evidence obtained from surveys. Sometimes these nuances are not easily be detected there. Particularly for the larger companies a custom-made evaluation may be the only way forward, benefiting from the supplementary evidence directly obtained from representatives of the enterprise in question.
19 Measuring Capital - OECD Manual 2009, Second edition: http://www.oecd.org/publications/measuring-capital-oecd-manual-2009-9789264068476-en.htm

Measuring global production: data sources and compilation challenges
80
Country case study 5.10 Identifying manufacturing services and factoryless goods production in the United States
The U.S. Census Bureau and BEA have been studying how to classify and collect data from entities that are part of Global Value Chains (GVC). A key element is identifying the relationship between firms that outsource the fabrication of products, while still controlling the production process, and firms that perform the processing as contract manufacturing services. Through preliminary outreach conducted by the Census Bureau, respondents appear to understand the concept of contract manufacturing services and the need for U.S. statistical agencies to collect the data. Collecting data, however, could be challenging. Some respondents indicated that they were generally unable to provide data because either accounting or production management systems did not include a searchable characteristic that would distinguish these services. To determine whether data collection can be robust, the U.S. Census Bureau and BEA have added questions to their respective surveys to determine whether U.S. businesses can accurately report purchases and sales of contract manufacturing services.
Direct Investment Abroad Survey
Every five years, BEA conducts the mandatory Benchmark Survey of U.S. Direct Investment Abroad (BE-10) to track the economic activity of U.S. multinational companies and their foreign affiliates. The BE-10 benchmark survey covers the entire universe of U.S. direct investment abroad in terms of value, and is BEA’s most comprehensive survey of such investment in terms of subject matter. The survey collects detailed information on the financial structure and operations of U.S. parent companies and their foreign affiliates and on the transactions and positions between the parents and their affiliates. Any U.S. person (which includes companies) that had a foreign affiliate is required to report. If the respondent is a U.S. corporation, the respondent reports transactions for the fully consolidated U.S. domestic enterprise, which excludes foreign branches and other foreign affiliates.
To understand the activity of U.S. multinationals with respect to manufacturing services, BEA added questions on purchases and performance of contract manufacturing on the 2009 Benchmark Survey of U.S. Direct Investment Abroad for U.S. parents that are not banks (BE-10A). The questions were added to identify a group of firms engaged in manufacturing services that could be used either as a sample frame for a special survey on that topic or as a way to identify firms engaged in contract manufacturing that may be linked to data collected by the Census Bureau. A data link is performed when company identification codes from BEA files are matched to the corresponding companies in the Census Bureau files. The BE-10 survey defined contract manufacturing as “Contracting with a firm to process materials and components, including payments for fabricating, assembling, labelling and packaging materials and components.” Because BEA was trying to identify a group of firms that engaged in contract manufacturing only yes/no questions were added to the survey. The BE-10 definition was broader than the international guidelines definition of manufacturing services as processing of materials and components owned by others. However, BEA requested respondents to answer if they owned some or all of the materials used by the contract manufacturers or if they did not own the materials.
BEA is in the process of collecting data from the Benchmark Survey of Transactions in Selected Services and Intellectual Property Products with Foreign Persons (BE-120) on manufacturing services on materials and components owned by others covering processing, assembly, labelling, packing and so forth undertaken by businesses that do not own the goods concerned. Reporting by companies on the contract manufacturing questions is voluntary and initial review of these questions indicates a low response rate.
Company Organization Survey
The Company Organization Survey (COS) covers all multi-unit companies with 250 or more employees and a selection of smaller companies to support other Census surveys. Companies with less than 250 employees are only selected for the COS when administrative records indicate that the company may be undergoing organizational change and is adding or dropping establishments. The Census Bureau focuses its efforts on collecting establishment information for large companies because of their importance to the economy. The COS is conducted annually in the four years between economic censuses. The COS is designed primarily to maintain the Business Register.
Several inquiries were included in the 2011 COS to enhance the Census Bureau’s understanding of the relationship between the enterprise and its establishments, business models and global economic activity. In particular, the purchase and sale of manufacturing services and the impact of domestic FGPs, firms that are integrated manufacturers in their global reach but offshore manufacturing activities and would be classified as domestic wholesale trade under current U.S. industry classification guidance, has been problematic for capturing and interpreting national economic statistics in a global economy.
In 2010, an initial test by the Census Bureau to collect more detailed information on contract manufacturing services from several large firms found that the terminology was well understood. However, most of the characteristics of the
Measuring global production: data sources and compilation challenges
81
data sought, such as the value of the materials and components provided to overseas contract manufacturers, would have to be collected below the enterprise level. Based on this pretesting, the level of detail sought was reduced. A pilot test of 180 reporting units was conducted in the 2010 COS. Results from the pilot test indicate that reporters largely understood contract manufacturing as “outsourced transformation of own product” and were able to distinguish it from simple purchases of goods for resale.
The 2011 COS included contract manufacturing inquiries on approximately 40,000 surveys. Respondents to the 2011 COS survey were asked a series of questions as to whether they operate manufacturing facilities, provide contract manufacturing services incorporating patents, trade secrets, or proprietary technology owned by the principal, or purchase contract manufacturing services incorporating patents, trade secrets, or proprietary technology owned by the respondent’s company. Questions on R&D performance and revenues from royalties and license fees for the rights to use intellectual property were also included.
Responses were analyzed by the Census Bureau to determine if respondents purchased or sold manufacturing service and are engaged in factoryless production. For example, if a company has R&D conducted in the U.S., does not have foreign ownership, does not operate manufacturing facilities, but does purchase contract manufacturing services incorporating the company’s own patents, trade secrets, or proprietary technology; it is likely to be classified as a factoryless goods manufacturer. Initial analysis of the results of the survey showed that the potential “factoryless” producer population is likely to be small regardless of where a bright-line may be drawn for classification purposes. There is no “simple” set of criteria that is likely to identify the factoryless producer (as of yet). Ownership and large, complex, global enterprises may have business segments that would be factoryless producers even though they would not be at the enterprise level.
In addition to the contract manufacturing questions at the company level, special inquiries have been added to the 2012 Economic Census to collect information at the establishment level. The Economic Census is the Census Bureau’s most comprehensive measurement of the U.S. economy and is conducted in reference years ending in “2” or “7” and contains highly detailed industry, geographic and product statistics. The Census Bureau directly collects data from establishments of multi-establishment businesses and larger single-establishment businesses. For establishments currently classified in the manufacturing, wholesale trade, and management of companies sectors, questions on purchases of contract manufacturing services were added. In addition, for establishments currently classified in the manufacturing sector, questions on receipts from contract manufacturing services were added.
Next Steps
The results from the BEA BE-120 survey will be available soon. Once available, BEA can evaluate whether the value of receipts and payments for contract manufacturing services can be reported along with the destination of the goods after processing. The contract manufacturing services questions on the COS enterprise level survey discussed in this case study represent initial steps in determining if further data collection is likely to be robust and if the Census Bureau can identify factoryless producers in their surveys. As a next step, the Census Bureau will evaluate the special inquiries on the 2012 Economic Census to see if information at the establishment level can better identify factoryless manufacturers and to assess whether sufficient data can be collected on the value of the manufacturing service and the associated revenue on sales of products produced by contract manufacturers.
Country case study 5.11 Factoryless production of furniture
A few years ago a former manufacturer of furniture, company X, closed down its production in country A. Production was transferred to various contract manufacturers all over the world. Company X remained responsible for design (the blueprints), testing of products, marketing and sale. The goods designed by company X, many of which are patented, have developed over the years. Present output includes chairs for children, other equipment for the nursery and prams.
Currently parts of the furniture and equipment are produced by contract producers all over the world according to the blue prints (IPP) developed and owned by company X. Suppliers are chosen according to price, delivery reliability and quality. The different parts delivered by the suppliers are sent to logistics centres. From these logistic centres the completed product is subsequently sent to customers. Company X completely controls each of these deliveries. Almost all final output is shipped to customers outside of country A. Sales and related profits worldwide are reported in the business accounts of company X.
As recommended by ISIC Rev. 4 the NSI in country A classifies company X in its business register within retail and wholesale trade. However, determining the industry classification of a factoryless producer is not straightforward. A special feature in this case is that the raw materials as processed by the suppliers are not owned, while the produced parts as delivered to the logistics centres are under ownership of company X. The activities of the logistics centres

Measuring global production: data sources and compilation challenges
82
could be regarded as industrial processing, which would make company X a manufacturer. In any case, the intellectual property embedded in the products resembles a vital part of the production chain. As shown before, trading represents only a limited part of the economic activities carried out by the factoryless producer X.
A review of data sources 5.98 This section reverses the angle of the discussion on data requirements by reviewing the main characteristics of the most important data sources available to measure various aspects of global production. Rather than providing a sequence of methodological steps, as outlined in the former section, this section reviews particularly the potential of different data sources, providing the reader with some degree of flexibility in how these data sources are used in practice. This section also discusses some of the main conditions and requirements of these data sources in order to use them effectively in the context of global production measurement.
Business surveys, manufacturing
5.99 Manufacturing surveys are typically directed at establishments with annual and sub-annual cycles. Keeping in mind that not all firms are engaged in any particular form of global production, there should be an assurance that the survey frame is comprehensive and includes such firms. In addition the sample size should be sufficient and with an effective sampling strategy, also for the purpose of simply identifying those companies engaged in any form of global production. A priori information, for example obtained from company profiling can be of assistance in identifying large companies engaged in any form of global production. Such companies would ideally be in the take-all portion of the sample. At the very least, they should be in the take-all portion of the annual survey, if such a survey is used to supplement and benchmark the quarterly survey.
5.100 As FGPs should, according to international guidelines at present, be classified under trade, as a special case of merchanting, they may fall outside the frame of manufacturing statistics and are likely to be captured by trade statistics instead. It should nevertheless be emphasised that enterprises in the manufacturing industry may also be engaged in merchanting or factoryless goods production as part of their secondary output. Business surveys for the manufacturing industry are usually designed to collect information on trading activities (trade related turnover and trade related purchases of goods) in order to estimate trade margins. A split in domestic and foreign trade related sales and purchases may help observe merchanting as secondary output.
5.101 So, in manufacturing surveys, there needs to be a means to identify total revenues associated with main output, aside from revenues obtained from:
a) Carrying out processing services (i.e. processing fees) on goods subject to foreign ownership;
b) Factoryless goods production, where the physical transformation is carried out abroad;
c) Merchanting (as a separate category of turnover from trade).
5.102 Similarly, purchases of goods should preferably be subdivided into:
a) Intermediate goods used for main (manufacturing) output;
b) Purchases from contract producers (under a factoryless goods production arrangement) abroad;
c) Foreign purchases of goods subject to trade.
5.103 The terminology used in surveys may be a point of concern. As mentioned, processing or outsourcing more generally, is often referred to as custom work in surveys. As these kinds of activities have been around for some time, it is likely that most manufacturing-based surveys would already have such a split. It can be that the wording associated with various forms of global production is cumbersome and possibly not clear to respondents and might benefit from a review.
5.104 It is particularly helpful if manufacturing surveys cover all purchases and sales of goods subject to each of these three global production arrangements, including sufficient detail on the characteristics of these goods (in terms of CPC). This information may help make the required adjustments in merchandise trade statistics as discussed previously in this chapter.
5.105 Similarly it is recommended to add questions on (changes in) inventories of material inputs and (unfinished) goods held abroad, in relation to outward processing, factoryless goods production and merchanting. Business surveys are probably the only means to obtain information on inventories held abroad. The survey design should be such that the principle of economic ownership of inventories is leading, and not the physical appearance of inventories at a certain production location, particularly in cases where there is a difference between the two observation concepts. To be more specific:
a) Inventories held abroad (due to e.g. processing abroad, goods sent abroad for repair, merchanting), but under ownership of a domestic principle, should be recorded in the balance sheet of this principal and, thus, in the balance sheet of the national accounts in which this principal is resident.
b) Reversely, inventories held domestically, but owned by foreign principals for similar reasons, should not show up in the balance sheets of the national accounts.
Measuring global production: data sources and compilation challenges
83
Wholesale and retail trade surveys
5.106 As a first step it is advisable to profile distributors engaged in either merchanting or factoryless goods production and make sure these companies are sufficiently covered in the survey. The size of their representation may determine whether adjustments in survey designs are required to cover the specific features of these companies appropriately.
5.107 As a second step it is recommended to classify those companies that are predominantly engaged in factoryless goods production under a separate class of ´traders´, particularly because the businesses of these companies are very different from distribution. A future step may be classifying these companies under (a special class of) manufacturers, pending on the adoption of such recommendations in the international standards.
5.108 The coverage of merchanting depends on the extent to which reporting addresses foreign (trade related) purchases and sales, and inventories held abroad. Otherwise, if merchanting (or factoryless production) is considered sufficiently important, trade surveys may need to be adjusted to specifically capture purchases and sales subject to merchanting. There is probably no other source available to obtain this information. Goods subject to merchanting may remain completely unobserved in merchandise trade statistics. Sufficient detail provided in the classification of foreign purchased and sold goods is another precondition for recording the net export from merchanting in the national accounts and balance and payments.
5.109 The survey may also need to be adapted to capture inventories of goods held abroad, as a consequence of carrying out merchanting activities.
International trade in services surveys
5.110 International trade in commercial services (SITCS) surveys are typically enterprise-based surveys with details on service categories and probably also on industries and geography (countries and regions). Maintaining good coverage can be challenging as firms engaged in international service transactions are not always that easy to identify. Often these surveys are smaller in terms of sample size compared to business surveys covering total domestic production activity. Links to a centralized business register with a flag for international activity, based on information obtained from other surveys, can help keep the SITCS survey frame and the applied sampling method up to date. More generally, such registers are equally important in bringing together and validating a wider range of survey results, including those of business surveys. A quarterly survey may be supplemented with a more detailed (in particular for geography) annual survey, which may be used to benchmark the sub-annual surveys.
5.111 The SITCS survey may not necessarily be geared to measure aspects of global production, such as processing fees, trade margins obtained from
merchanting or the IPP flows inside global production chains. Surveys may require improvement in terms of coverage and design. In doing so, it will be essential to ensure adequate coverage of both service and goods producing industries as both can be engaged in international processing and merchanting. Any profiling related to the cross-border dimension undertaken in the case of the manufacturing surveys and distributive trade’s surveys as well as their survey frames would be useful in this regard.
Merchandise trade statistics
5.112 Merchandise trade statistics measure cross-border flows of goods. The adjustments needed in national accounts and balance of payments require recording of international trade on the basis of ownership transfer, discussed in detail in this chapter, including the use of “nature of transaction codes” derived from custom’s records.
5.113 So-called importer-exporter registers may help combining the usually few sources available for making the adjustments in merchandise trade statistics. Such registers help establish the link between commodity trade data and business statistics. Various countries have developed importer-exporter registers which may also be linked to centralized business registers. Tying the aforementioned merchandise trade adjustments to firms in manufacturing via record linkages as well as linkages at commodity level can increase the accuracy and data confrontations and adjustments.
Foreign direct investment (FDI) surveys
5.114 FDI surveys are also briefly discussed in Chapter 3. These surveys on inward and outward FDI are enterprise-based, or legal entity-based. The purpose of FDI surveys is to collect information on FDI flows and stocks which may help explaining multinational enterprises’ ownership structures. For both inward and outward FDI, it is typically possible to identify and isolate majority owned affiliates by industry. In fact, majority-owned foreign affiliates are the basis for foreign affiliate statistics.
5.115 Combining FDI statistics with other data sources may help obtain a better understanding of parent-affiliate relationships in terms of their roles in global production arrangements, particularly when information on the nature of economic relationships (and transactions) between these affiliated companies is incomplete. For example, a majority-owned foreign affiliate engaged in manufacturing, and a principal parent with no production plants in the domestic economy, may nevertheless report significant purchases (abroad) of raw materials and sales of final goods (abroad), which may then be assumed to be processed by the foreign affiliate.
5.116 Tying information from FDI statistics on ownership structures into manufacturing surveys and, or, merchandise trade data, will likely necessitate the use of

Measuring global production: data sources and compilation challenges
84
record linkages. To do this properly, the FDI frame is preferably connected to, or based on, the centralized business register.
Foreign Affiliate Statistics (FATS)
5.117 FATS contain two components: inward and outward FATS. Inward statistics on foreign affiliates represent those statistics describing the activity of foreign affiliates resident in the compiling economy. Outward statistics on foreign affiliates represent statistics describing the activity of foreign affiliates abroad controlled by the compiling economy. FATS cover both financial and non-financial industries. Variables collected within the FATS framework are e.g. turnover, value added, purchases of goods and services, R&D expenditure, personnel costs, number of employees, gross investment in tangible goods and international trade.
5.118 FATS requires that international trade data are somehow linked to the business or enterprise register. In this regard the FATS framework is already very valuable for improving the quality of data obtained from multinational enterprises (MNE). Perhaps more importantly, FATS may specifically focus on trade in goods and services between affiliated companies in different countries. This part of the FATS may only be obtained by carrying out supplementary surveys.
5.119 The Eurostat (2007) guidelines explain that intra-group trade transactions may be subject to transfer pricing, a fact that companies are unlikely to be transparent about. Nevertheless, FATS may help identify transfers of goods subject to processing, or IPP related intra-group transfers, particularly when dedicated supplementary surveying is done to obtain these pieces of information.
International data comparisons
5.120 For the largest and most complex enterprises the issue of data confrontations at national level are discussed in detailed in Chapter 6. Attuning survey designs and combining outcomes may be the obvious way to optimize coverage aspects of global producers in a concise way and at minimum cost and response burden.
5.121 The increasing complexity of global production chains and MNE structures underlines the importance of international data confrontations. Such forms of cooperation may entail:
a) Alignment of business registers. A clear initiative is the EU framework on Modernization of European Enterprise and Trade Statistics (MEETS), a cooperation project that started in 2008 to establish an inventory on the current implementation in the member states and to prepare guidelines for a more consistent data system. One of the key features is the development of a EuroGroups register. Another important objective is to develop a methodology for measuring global value chains and linking of
micro data on international trade and business statistics. This project may not only lead to further harmonization of register designs, units and survey designs but may be particularly helpful to address issues related to global production.
b) Alignment of approaches to measuring global production. International organizations play an important role on this front, for example by providing a platform for regularly exchanging methods and identifying best practices, also based on the international comparisons of country results.
c) Alignment of international trade statistics. Several so-called mirror exercises have been carried out at bilateral or multilateral level to adjust for asymmetries in international trade statistics. Globalization makes such analysis more relevant than ever and such exercises may particularly focus on intra-company flows of goods, services and IPPs in particular. One obstacle to such efforts is that legislation may exist in some jurisdictions that restrict the amount of information that can be exchanged with compilers in other countries. Another limitation may be that such an exercise is usually very resource demanding. Nevertheless, processes could be sought to facilitate this kind of work. A longer term objective would be developing an international platform for micro data confrontations, which will certainly help in reducing asymmetries in international trade statistics.
Conclusions and recommendations 5.122 This chapter discussed the measurement aspects of goods sent abroad for processing, merchanting and factoryless goods production by reviewing the required data items and associated adjustments in source statistics. Each of these global production arrangements require adjustments and additions in existing data collection systems and the need for the changes may be amplified by the on-going globalised dispersion of production chains. Yet these measurement challenges may not easily match the ongoing attempts of NSIs to reduce costs and response burden.
5.123 The recommendations of this chapter are summarized as follows:
a) One of the biggest challenges is the required adjustments in merchandise trade statistics for their use in the national accounts and the balance of payments. Sufficient detail is often not available in the nature of transaction codes, nor sufficiently reliable, to make the required adjustments. In these cases it is recommended to add extra data items to business surveys, at least on an annual basis, to observe the international flows of goods related to processing (or merchanting), preferably in close correspondence to questions about processing fees paid to, or received from, foreign companies. A

Measuring global production: data sources and compilation challenges
85
particular concern is the estimation of exports of goods directly following processing. Without this information, corrections in merchandise trade statistics may be wrong and this will disturb the trade balance. Clearly this recommendation may contrast the obligation of statistical offices to minimize respondent burdens. However, it is unlikely that information on the above mentioned international trade flows can be obtained from any alternative source.
b) It is possible that in some countries the available customs information is not fully utilized in the merchandise trade statistics. Some of this information may already exist in available customs data fields that are not fully captured or ignored for merchandise trade statistics purposes. In other words, existing but non-tabulated or non-analyzed fields might be able to provide important information for adjustment purposes. This might involve additional efforts by compilers as well as negotiations with customs agencies for access to additional records on customs documents. The ultimate goal is to have trade declaration documents that would allow the compilation of data both on shipment of goods and economic transactions.
c) The transactions of goods under merchanting could either be observed by making corresponding adjustments in the business statistics of wholesale traders (asking for the purchases and sales of goods under merchanting), or in the international trade in services statistics. The minimum data requirement is to measure at least the trade in services connected to merchanting.
d) When data sources are incomplete, or insufficiently reliable, data validation is recommended by bringing together, and reconciling, the results from business surveys, merchandise trade statistics and the international trade in services statistics, preferably on the basis of an integrated business register, and were needed at the individual enterprise level. This would be supplemented by the balancing of the supply-use tables.
e) The value of processing fees, paid or received, should be observed from business surveys, or the
international trade in services. The indirect calculation of these fees as the difference in the values of the goods before and after processing is not recommended as this is generally expected to give low quality results. It could be used, however, as a validation tool or to extend the result to full coverage of the activity.
f) The design of business surveys should be such that inventories held abroad are explicitly captured. A split between domestic and foreign held inventories is quite helpful.
g) The identification of actors engaged in merchanting or factoryless goods production may require special attention and methods to detect such cases are highlighted in this chapter. Further work with classification experts should lead to enhanced criteria for the separate identification and analysis of these two production arrangements.
h) The activities of expected FGPs should be examined to decide whether these are genuinely manufacturing related (which means the observed company is indeed an FGP) or predominantly trade related (which means the company should be considered a trader). The required methods to make this distinction are discussed in this chapter.
i) Data exchange between NSIs may help complete the picture of companies and industries engaged in each of the discussed forms of global production, and is, therefore, recommended. Such exchange may be facilitated by the establishment of common business registers, at least for multinational companies, such as the EuroGroups Register. It will also require the exchange of micro data, for example to eliminate asymmetries in international trade statistics or to complete the picture of global value chains and the operations of multinational enterprises. This may help determine a proper breakdown of these international production activities on a country-by-country basis. However, unfortunately at present many statistical offices face legal constraints when it comes to the exchange of micro data. NSIs are invited to look at ways to overcome these constraints for the sake of data validation and overcoming asymmetries in trade statistics.


Large and complex enterprises units
87
Chapter 6 Large and complex enterprises units Introduction 6.1 The Globalization Guide, in 2011, concluded that the activities of large multinational enterprises (MNE) should be examined case by case, in close cooperation with statisticians working in relevant statistical domains. Some national statistical institutes (NSI) have established organizational units to examine MNEs and other statistical units that are important for all aspects of quality of statistics, especially for consistency.
6.2 Consistency analysis, used in many NSIs, is a practical tool for quality assurance. It includes collecting data from different sources and comparing them in a systematic way. Consistency means that data from separate statistics fit together and provide a coherent description of economic development.
6.3 Organizational units, responsible for consistency analysis of MNEs in particular, are called here large and complex enterprises units (LCU). The work done by LCUs is essential for ensuring that the data of large corporations are incorporated coherently across economic statistics. The above mentioned Globalization Guide presented case studies of LCU work in Finland, Ireland, Netherlands and Sweden as annexes of Chapter 2.
6.4 This chapter focuses on presenting the outcomes of a survey carried out in March 2013 by the Task Force on Global Production to get a better understanding of the organization of work and the type of analysis carried out by LCUs. The results of this survey provide statistical offices with a possibility to identify best practices across countries. All countries that replied to the survey reviewed their answers in April-May 2015 and updated the information where necessary.
6.5 The survey was sent to 14 countries where consistency work had already started. The survey questionnaire is attached as an annex to this chapter. In total, 10 countries replied: Canada, Czech Republic, Finland, France, Hungary, Ireland, Netherlands, New Zealand, Norway and Sweden. However, Czech Republic and Norway only noted that they do not have an LCU. New Zealand also reported not having a dedicated LCU, but provided a summary of their work related to surveying and dealing with large and complex enterprises which is distributed across the organization.
Their Integrated Data Collection (IDC) unit conducts relationship management and ensures supply of data from large units, but does not currently contribute to data analysis or consistency work. However, since their practice is in many ways similar to those of LCUs, for simplicity the work carried out in New Zealand is reported together with the countries that have established an LCU.
6.6 This chapter first provides a brief background and considers the reasoning behind the consistency work. The following section presents the results of the survey, including a discussion of the organizational aspects, human resources, use of different data sources, selecting the target population and managing respondent relationships. The section then continues by considering the challenges of data reporting, data linkage and data exchange, and the process of solving inconsistency issues. It also briefly touches on issues other than globalization that cause data inconsistencies since these are part of the LCUs’ work. These other issues causing inconsistencies include the use of different statistical units and definitions and applying different methods in data processing across statistical domains. The chapter also presents how LCUs examine the different cases of global production arrangements according to the typology presented in Chapter 2. The chapter concludes by highlighting some important country experience and giving recommendations for dealing with large and complex enterprises.
Background 6.7 The impact of MNEs on national accounts and balance of payments is substantial. Almost all business and economic surveys are affected in some way by the activities of MNEs. This is especially true for open and globalized economies where the importance of international trade is big, and where a relatively small number of MNEs accounts for a major part of total output and value added of national economies. For this reason, MNEs are generally included in most surveys carried out in the area of economic statistics.
6.8 For example, in Sweden the 50 largest enterprises accounted for almost 30 per cent of non-financial enterprises’ contribution to gross domestic

Large and complex enterprises units
88
product (GDP) in 200520. Data on the largest enterprises are, thus, critical for improving the quality of economic statistics. Consequently, LCUs concentrate mostly on MNEs. For instance, in Ireland all LCU client enterprises are MNEs and in the Netherlands at least 90 per cent of the 320 enterprise groups that the LCU deals with are MNEs or part of an MNE. LCU work covers, in the Netherlands, some 40% of turnover, 35 per cent of value added and 20 per cent of the number of persons employed in all non-financial enterprise groups.
6.9 International tax considerations are very important for MNEs and may change the way MNEs organize their activities. Sometimes, although physically nothing changes in the production of goods, the way a company reports on its activities may change and the change may well influence statistics.
6.10 One of the challenges, faced by statisticians, is that enterprises often do not account for their financial performance by physical establishment or by production unit. Consequently, it is quite a challenge to collect data from MNEs on a country by country basis, not to mention by establishments within a country. Enterprises may account for their financial performance in ways that fit with their own requirements, such as geographical or functional divisions, type of good/service or customer groups. In general terms the economy has evolved to being more knowledge-based, where outsourcing and offshoring expand the supply chains to new markets with the aim of making MNEs more cost effective. Thus, while the business world has developed, the requirements for statistical data collection have not really changed.21
6.11 In view of these developments, already in the early 1990’s many NSIs started considering how to counter the difficulties experienced in compiling national accounts, especially in measuring the activities of MNEs. This work took many different forms: dedicated contact persons to provide large enterprises with a single contact point inside the NSI for all surveys; networks of specialists and working groups within the NSI or the statistical system to discuss and analyze the data and the related inconsistences; persons nominated as MNE coordinators; or separate units to conduct consistency analysis and guide data collection and editing in the NSI.
6.12 Several NSIs have realized that a more proactive dialogue with important respondents can significantly improve NSI’s knowledge of the large enterprises’ and, vice versa, enterprises’ understanding 20 Erikson, Anna-Greta (2008): Coherence Analysis - Improved Quality of National Accounts, Statistics Sweden. Statistics Canada’s International Symposium Series: Proceedings. www.statcan.gc.ca/pub/11-522-x/2008000/article/11014-eng.pdf 21 Vinette, Lucie (2008): Achieving Data Coherence for Complex Enterprises, Statistics Canada. www.statcan.gc.ca/pub/11-522-x/2008000/article/10985-eng.pdf
of the statistical data requirements. A study conducted at the United States Census Bureau identified the following areas for improvement in respondent relationships22:
• It is difficult to keep track of frequent company reorganizations and changes of contact information across multiple survey programs;
• Businesses place statistical surveys after other reporting responsibilities such as internal and stockholder financial reports, and tax and regulatory agency reports;
• Enterprise respondents would like to receive more information about the survey, including advance notice of the survey and real time responses;
• Many enterprises would prefer having a single point of contact at the NSI and in the enterprise to streamline communication;
• Respondents are unaware of how survey results are used in the statistical system.
6.13 In addition, according to feedback from respondents some statistical concepts should be better explained in data collection forms, and the NSIs’ data collection strategies should be fine-tuned especially for large and complex enterprises.
6.14 The process of supplying data to NSIs is complex (see Figure 6.123) and can be costly for respondents in terms of staff time and required reporting system changes. Because respondents have an incentive to minimise the time and resources spent fulfilling data requests, NSIs should try to make respondents’ work easier. Providing adequate support to the important respondents can reduce the need to do additional data queries and ensure that high quality data are delivered in the first instance. Ways to minimise response burden and misunderstandings include regular contacts between the NSI and the respondent, involving respondents in the designing and testing of new surveys, getting to know more about the respondent’s business, communicating data requirements concisely and clearly, allowing for the possibility of customised data supply and providing timely support to the respondent. These tasks are often assigned to LCUs, and as these measures have been taken many respondents have reported decreased response burden.
22 Marske, Robert; Torene, Laurie and Hartz, Michael (2007): Company-Centric Communication Approaches for Business Survey Response Management, United States Census Bureau. International Conference on Establishment Surveys. www.amstat.org/meetings/ices/2007/proceedings/ICES2007-000220.PDF 23 Barrow, Rochelle (2008): Working together – How good relationships with providers can improve the quality of official statistics, Reserve Bank of New Zealand. www.bis.org/ifc/publ/ifcb28zzc.pdf
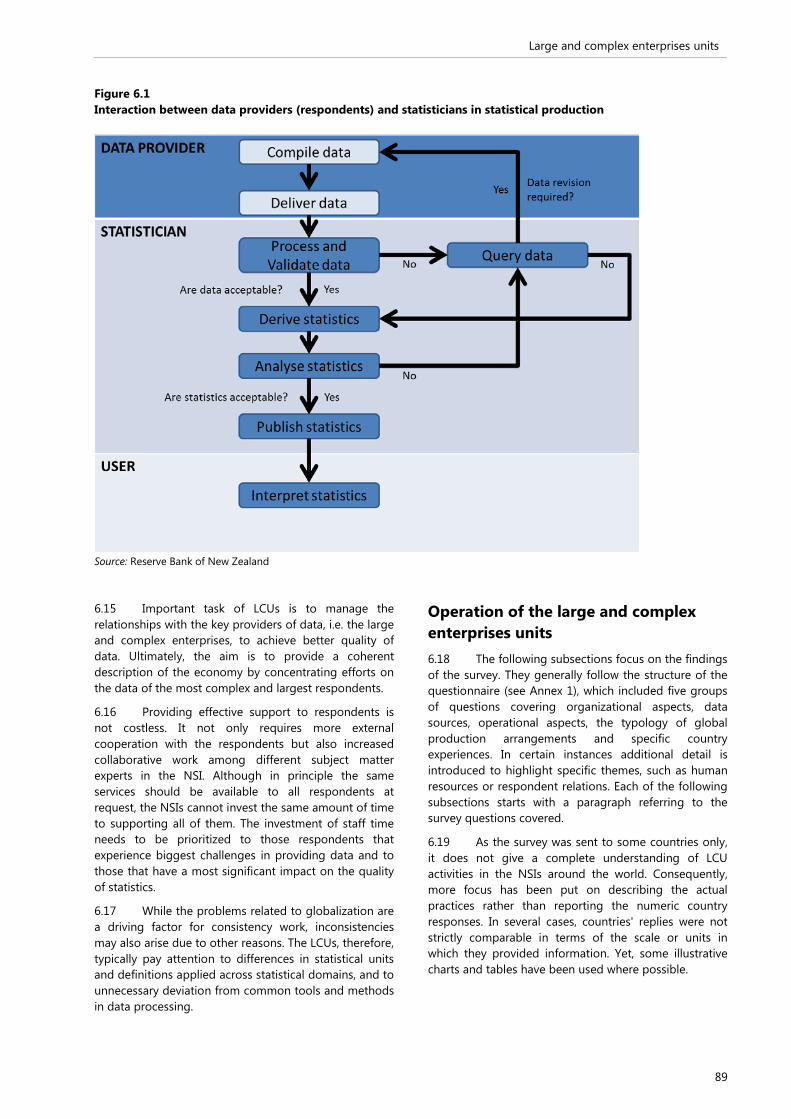
Large and complex enterprises units
89
Figure 6.1 Interaction between data providers (respondents) and statisticians in statistical production
Source: Reserve Bank of New Zealand
6.15 Important task of LCUs is to manage the relationships with the key providers of data, i.e. the large and complex enterprises, to achieve better quality of data. Ultimately, the aim is to provide a coherent description of the economy by concentrating efforts on the data of the most complex and largest respondents.
6.16 Providing effective support to respondents is not costless. It not only requires more external cooperation with the respondents but also increased collaborative work among different subject matter experts in the NSI. Although in principle the same services should be available to all respondents at request, the NSIs cannot invest the same amount of time to supporting all of them. The investment of staff time needs to be prioritized to those respondents that experience biggest challenges in providing data and to those that have a most significant impact on the quality of statistics.
6.17 While the problems related to globalization are a driving factor for consistency work, inconsistencies may also arise due to other reasons. The LCUs, therefore, typically pay attention to differences in statistical units and definitions applied across statistical domains, and to unnecessary deviation from common tools and methods in data processing.
Operation of the large and complex enterprises units 6.18 The following subsections focus on the findings of the survey. They generally follow the structure of the questionnaire (see Annex 1), which included five groups of questions covering organizational aspects, data sources, operational aspects, the typology of global production arrangements and specific country experiences. In certain instances additional detail is introduced to highlight specific themes, such as human resources or respondent relations. Each of the following subsections starts with a paragraph referring to the survey questions covered.
6.19 As the survey was sent to some countries only, it does not give a complete understanding of LCU activities in the NSIs around the world. Consequently, more focus has been put on describing the actual practices rather than reporting the numeric country responses. In several cases, countries' replies were not strictly comparable in terms of the scale or units in which they provided information. Yet, some illustrative charts and tables have been used where possible.

Large and complex enterprises units
90
Organizational aspects
Organizational arrangements
6.20 The survey explored the kind of arrangements statistical offices have made (or are planning to make) to deal with large and complex enterprises (Question (Q) 1.1). It asked countries to report about any dedicated LCUs that they have created, and where the LCU activities are located in the organizational chart.
6.21 Seven out of eight countries that filled in the survey questionnaire have created an organizational unit to deal with large and complex enterprises. In Canada, France, Hungary and Netherlands LCUs are independent units located together with business statistics. Ireland has placed their LCU directly with national accounts. Similarly, national accounts are actually in the same department with the LCU and business statistics in Canada, France and Netherlands. The LCU is part of a department for centralized data collection in Finland and Sweden. In New Zealand the integrated data collection unit carries out tasks to manage respondent relationships and ensure supply of data from large units, while other LCU-type work is distributed throughout the organization.
6.22 Organizing consistency work in the form of LCUs has certain advantages, for instance:
a) Complex enterprises become clearly a focus and responsibility of the LCU, which may allow for having a single contact point and greater flexibility in data provision for the respondent.
b) Data from the different surveys are accessed and compared across statistics at an early stage.
c) Data issues can more easily be discussed among statisticians, and once agreed, can be solved in a consistent way across statistics.
d) Individual statisticians know whom to contact when experiencing challenges with large and complex enterprises.
e) Greater critical mass of specialist skills and expertise becomes available in the NSI.
f) Possibility to standardize the design and development of data collection functions across the organization and, thus, create efficiencies.
6.23 All countries recognized efficient cooperation and communication within the NSI and with respondents as an important element of successful consistency work. Instead of creating a specific unit, some NSIs have created a working group or a network of experts comprising staff from several departments of the NSI, regional offices and other producers of official statistics. Quite often, this kind of an arrangement may also complement the LCU work. For instance, along with the LCU, Finland has a consistency group including experts from data collection and different economic statistics, and in Hungary the LCU coordinates the work
of a network of experts that includes representatives from seven regional offices of the NSI. Furthermore, Hungary has working groups (both within the NSI and between the NSI and the central bank) consisting of experts from business statistics, national accounts and external trade statistics, and other of experts from the NSI and the central bank.
6.24 In the survey, most NSIs called for exchange of experience on organizing LCU work. In this regard, the European Statistical System network (ESSnet) on Profiling of large and complex Multinational Enterprise groups24has been very useful. The ESSnet on Profiling focuses on globalization in the analysis of complex and large enterprises and aims to provide a better understanding of globalization and global production chains. The confidentiality rules of the EuroGroups Register (EGR) allow some data sharing among the members of the ESSnet. Otherwise, in most countries the legal framework limits data sharing even among the producers of official statistics within a country, not to mention internationally. This unfortunately limits the opportunities to collaborate on the analysis of large and complex enterprises.
6.25 The differences across countries in consistency work are partly explained by the way statistical production is organized. For example, balance of payments and merchandise trade statistics are not always compiled by the NSI. These statistics are especially important for the consistent treatment of globalization and MNEs’ activities. Thus, good cooperation between the NSI, providers of administrative data, such as tax authorities, and with the other producers of statistics, for example the central bank and customs office, is crucial for data quality, especially consistency. In some countries this cooperation is based on ad hoc contacts whereas others organize regular meetings. As mentioned above, restrictions of data exchange among producers of official statistics cause challenges even nationally, and in these cases cooperation is limited to macro level issues.
Human resources
6.26 The survey asked for an estimate of working time, in full time equivalent units (FTE), annually spent on dealing with large and complex enterprises. For comparison, the same estimate was asked for the entire size of the statistical institute (Q 1.2). The NSIs were further requested to allocate the LCU labour capacity to different activities, such as surveying, data analysis (imputations, data adjustments), profiling of enterprises, company visits, coordination and other activities (Q 1.5). NSIs also provided information on the required staff
24 Eurostat (2008): Development of profiling of large and complex MNEs, ESSnet on profiling of large and complex Multinational Enterprise groups. Working Group on Business Registers and Statistical Units. Doc. ESTAT/G1/BR/2008-4.7/EN

Large and complex enterprises units
91
skills and competencies (Q 1.3), and whether they consult experts from outside the NSI such as from central banks or tax authorities (Q 1.4).
6.27 Among the respondents, the average size of the LCUs was about 0.5 per cent of the total staff of the NSI. In Finland and Hungary the resources allocated to LCUs are about 4-5 staff years in FTEs. A similar amount of time is used in LCU type of work in New Zealand. Two countries, the Netherlands and Ireland have created somewhat larger units in relative terms: around 1.5 per cent of total staff, and 30 and 10 FTEs respectively. Canada has allocated 20 FTEs to their LCU, France 12 and Sweden 11.
6.28 The amount of time spent dealing with large and complex enterprises is, in reality, larger in many countries than what is reported in this survey. Plenty of time is invested in this work also in the subject matter units, but is usually not monitored separately from statistical production.
6.29 The tasks of LCUs vary across countries, but the following are most often identified:
a) Surveying and monitoring the data collection process to identify current and forthcoming problems in data provision. Participating in drafting instructions for respondents and developing common and/or tailored tools for surveying.
b) Data analysis (including imputations and data adjustments) to solve problems related to large and complex enterprises arising in statistical production. The aim is to improve coherence and reduce the need for ad hoc data editing in the longer term.
c) Profiling enterprises is defined in the “Business Registers – Recommendation Manual” (Eurostat, 2010) as “a method to analyze the legal, operational and accounting structure of an enterprise group at national and world level in order to establish the statistical units within that group and their links, and the most efficient structures for the collection of statistical data”. Profiling helps achieve consistency over statistical domains and collect more relevant data for the business register and other statistics
through economically meaningful units instead of artificially created administrative business units.
d) Coordination involves providing a contact point between the statistical office and the respondent. The coordination task is two-fold comprising both communication of the statistical needs to the enterprise, and harnessing expertise and providing learning opportunities within the office about changes in the enterprise and their treatment.
e) Visiting companies is a way to establish a dialogue and build relationships with large respondents. The significance of the enterprises’ data for statistics is typically explained during company visits. This enables better understanding of the data requests and personalises the process. Knowing the enterprise, its business and organization better, and being updated on changes in the enterprise helps solve data problems more efficiently. Knowledge of the enterprises’ accounting systems, administration and their capacity to provide data may be helpful as well.
f) Other tasks include for example development of standards and tools which can create efficiencies and help improve consistency. This task requires continued re-evaluation of the statistical production process to see where the LCU can best contribute to the quality of statistics.
6.30 An analysis of the labour capacity dedicated to different activities of LCUs shows that they are quite different across countries. In some NSIs the LCU is not much involved in surveying while in others the share of time used in this task is 20-30 per cent. Time used in data analysis (including coherence analysis) varies from 15 to 50 per cent. Profiling is also a key activity, for example in Canada where it takes up to 50 per cent of the LCU working time. Yet, the average time used in profiling in the other countries is 15 per cent. Visiting enterprises takes 5-20 per cent of the working time, and coordination of work around 10-20 per cent. On average, most of the time is allocated to data analysis, profiling and coordination. (See Figure 6.2.)
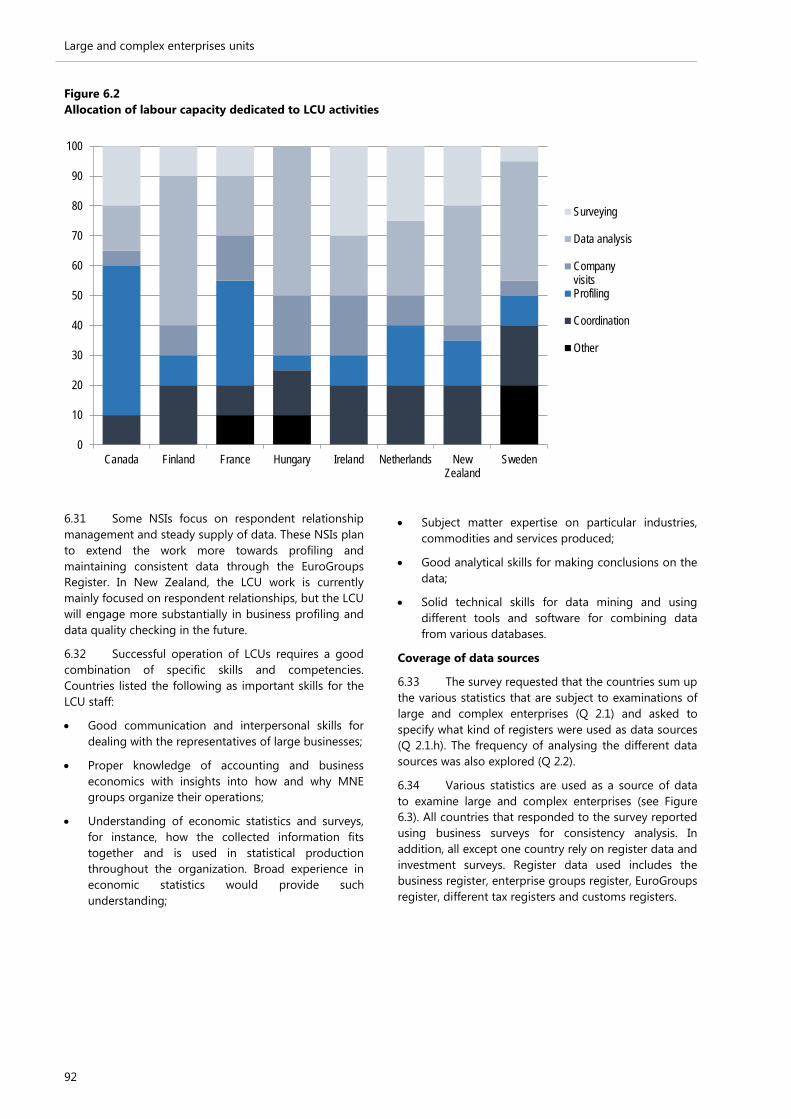
Large and complex enterprises units
92
Figure 6.2 Allocation of labour capacity dedicated to LCU activities
6.31 Some NSIs focus on respondent relationship management and steady supply of data. These NSIs plan to extend the work more towards profiling and maintaining consistent data through the EuroGroups Register. In New Zealand, the LCU work is currently mainly focused on respondent relationships, but the LCU will engage more substantially in business profiling and data quality checking in the future.
6.32 Successful operation of LCUs requires a good combination of specific skills and competencies. Countries listed the following as important skills for the LCU staff:
• Good communication and interpersonal skills for dealing with the representatives of large businesses;
• Proper knowledge of accounting and business economics with insights into how and why MNE groups organize their operations;
• Understanding of economic statistics and surveys, for instance, how the collected information fits together and is used in statistical production throughout the organization. Broad experience in economic statistics would provide such understanding;
• Subject matter expertise on particular industries, commodities and services produced;
• Good analytical skills for making conclusions on the data;
• Solid technical skills for data mining and using different tools and software for combining data from various databases.
Coverage of data sources
6.33 The survey requested that the countries sum up the various statistics that are subject to examinations of large and complex enterprises (Q 2.1) and asked to specify what kind of registers were used as data sources (Q 2.1.h). The frequency of analysing the different data sources was also explored (Q 2.2).
6.34 Various statistics are used as a source of data to examine large and complex enterprises (see Figure 6.3). All countries that responded to the survey reported using business surveys for consistency analysis. In addition, all except one country rely on register data and investment surveys. Register data used includes the business register, enterprise groups register, EuroGroups register, different tax registers and customs registers.
0
10
20
30
40
50
60
70
80
90
100
Canada Finland France Hungary Ireland Netherlands NewZealand
Sweden
Surveying
Data analysis
CompanyvisitsProfiling
Coordination
Other

Large and complex enterprises units
93
Figure 6.3 Statistics subject to examinations of large and complex enterprises
6.35 The enterprise group register and the EuroGroups register are often an integrated part of the business register. The structures of enterprise groups they record are a very useful source of information for the LCU work.
6.36 Most of the countries also analyze data on international trade in services and corporate accounts. Five countries reported using the survey of international trade in goods, the research and development (R&D) surveys and producer price statistics.
6.37 Use of data from the balance of payments surveys was mentioned by three countries only. This probably reflects the fact that the balance of payments is often compiled by the central bank. NSIs typically use data they collect themselves or register data sets they have in their possession.
6.38 Five countries mentioned using other data sources for consistency work. These included business outlook, statistics on the production of manufactured goods (PRODCOM), specific surveys such as Information and Communication Technology (ICT) surveys, enterprises’ quarterly and annual reports, and balance sheets of enterprise groups. Furthermore, New Zealand explained that the structure of their business demographics, where large units dominate many industries, mean that large and complex enterprises are significant in all surveys and statistics. In Canada the LCU focuses on business surveys and tax data but may examine other data sources on an ad hoc basis. France plans to improve analysis of international trade in goods data of complex units by better using the information from outward Foreign Affiliate Statistics (FATS) and Global Value Chain (GVC) surveys.
6.39 The LCU staff analyzes these data sources usually on a quarterly and annual basis depending on
the frequency of the data in each data source. Two countries also analyze short-term statistics on a monthly basis. More careful analysis is usually carried out annually when all relevant datasets become available. France also reported that they benchmark and make monthly and quarterly data on large and complex enterprises consistent with annual statistics.
Operational aspects
Population of large and complex enterprises
6.40 The population of large and complex enterprises (or enterprise groups) is typically determined and maintained according to certain criteria. The survey explored how the target population of the LCU is defined (Q 3.1.a) and how many enterprises and enterprise groups are included (Q 3.1.b). Countries were also asked to evaluate how important measurement problems related to globalization were taken into consideration when deciding whether or not an entity should be included in the LCU group (Q3.1.c).
6.41 Typically LCUs target the most important and the most challenging respondents that may have a serious impact on the quality of national accounts and other economic statistics.
6.42 The criteria for identifying large and complex entities comprise the following:
• Size measured by some of the following variables: gross value added, turnover, annual income, value of production, balance sheet total or number of employees;
• Complexity assessed by the number of layers in the enterprise group structure, number of enterprises in the group and complexity of operations by industry or geographical area;
0
1
2
3
4
5
6
7
8
Businesssurveys
Investmentsurveys
Registerdata
Internationaltrade inservicessurveys
Corporateaccounts
Internationaltrade ingoodssurvey
R&Dsurveys
Producerprice
statistics
Other datasources
Balance ofpaymentsurveys

Large and complex enterprises units
94
• Significance for data collection means selecting the most important respondents among businesses i.e. those who have problems in data provision, to whom a large number of questionnaires are sent, whose response performance needs improvement or whose enterprise group is very dominant in a certain industry.
6.43 Some countries mention using profiling programmes or algorithms to calculate a “complexity and size score” based on a combination of the parameters listed above. For example, Canada ranks enterprises on the business register based on the size of the enterprise in terms of revenues generated and the complexity of the enterprise in terms of its operations by industry and by geographical location.
6.44 Usually the final list of enterprises is agreed based on both data analysis and discussions between the subject matter units and the LCU. Often enterprise groups are added at the request of national accounts or business statistics departments, because they cause challenges in statistical production. Statistical departments are also asked to identify any significant reporting issues so that relevant enterprises can be included in the LCU’s work programme.
6.45 NSIs update the list of large and complex enterprises with varying frequencies: from quarterly updates to updates at the interval of two to three years.
6.46 The number of enterprises or enterprise groups handled by LCUs depends on the size of the economy and on the share of value added created by the rather small number of largest enterprise groups. The number of enterprise groups handled by LCUs varies across countries from 18 to more than 300 (see Table 6.1).
Table 6.1 Target populations of LCU work
enterprises* enterprise groups
Hungary 1000
Canada 320
Finland 18
Ireland 70
France 60
New Zealand 1800 110
Sweden 2000 50
Netherlands 2400 320
* domestic enterprises
6.47 Often the largest and most complex enterprises are analyzed more intensively whereas other enterprises can be treated more or less automatically. For instance, France profiles intensively around 60 most significant large and complex enterprise groups. In addition, almost 5000 small and medium-sized enterprise groups, and all those having international connections, are semi-
automatically profiled. For other groups (about 75000) profiling is fully automatized.
6.48 Countries report that challenges related to globalization are a high priority when determining the target population of large and complex enterprises. What matters for the selection phase is the complexity of the enterprise, not what is causing it, but often the most complex cases belong to MNEs. LCU work usually focuses on domestic enterprises. In some cases the units abroad have to be taken into account as well. Sometimes the objective of the work is to get a good understanding of the production process carried out by an enterprise group, rather than mapping all its global production structures.
Respondent relationships
6.49 The NSIs were asked if, in their view, company representatives consider centralized surveying and having one contact person in the enterprise feasible and desirable (Q 3.2.a). NSIs were also inquired if customized survey forms or survey methods are used for large and complex enterprises (Q 3.2.b) and how the respondents are consulted in setting up these customized surveys (Q 3.2.c). Finally, the NSIs were asked if electronic surveying methods are used, for example based on extended mark-up language (XML) or extended business reporting language (XBRL) (Q 3.2.d).
6.50 One argument in favour of respondent relationship management by LCUs is the possible decrease of response burden. Having only one contact person at the NSI who knows all the surveys sent to the enterprise makes the work easier for the respondent and is expected to increase the quality of data received by the NSI. For this reason in Ireland the LCU became, among its other tasks, a “one stop shop” for MNEs in all their dealings with the NSI.
6.51 Similarly, directing all surveys to one focal point in the enterprise may release time and attention of other staff. The usefulness of having only one contact person depends among other things, on the structure of the internal reporting system of the enterprise and on the way it has organized its data management. Enterprises often appoint one dedicated contact point to deal with issues related to statistical surveys. Current country experience shows, however, that often enterprises internally direct different questionnaires to different persons. Nevertheless, it seems that the majority of large enterprises would prefer that statistical information be managed by one central contact point at the NSI. At the moment, NSIs generally offer a single contact point only if a specific arrangement has been made with the enterprise or the enterprise group in question.
6.52 Usually, the contact person at the respondent’s end needs several dedicated persons in different departments as “subcontractors” in data provision. Currently, only in rare cases the NSI sends all surveys to one contact person at the enterprise group who then distributes them within the group. Some enterprises

Large and complex enterprises units
95
prefer centralization by theme, for example to direct all surveys regarding human resources and administration to one person.
6.53 Having a single contact person at the respondent’s end to represent a whole enterprise group may sometimes cause confidentiality issues. In some countries NSI is not allowed to give any enterprise level information to a person outside of that specific enterprise even if the person represents the group to which the enterprise belongs to. This may for instance prevent sending prefilled questionnaires to a single contact person of the enterprise group. In Finland a special procedure has been defined to assure confidentiality of enterprise level data when an enterprise group has a single contact point. A special agreement will be signed between an enterprise group and Statistics Finland which details the information that this single contact person is allowed to see.
6.54 It seems that tailored questionnaires are quite rarely developed for MNEs. Canada, New Zealand and Sweden mention that a customized reporting form may be developed for some enterprises if deemed useful during negotiations with them.
6.55 A couple of interesting examples of respondent centric data collection forms were reported:
• Ireland issues three electronic forms - monthly, quarterly and annual. The forms are tested with enterprises. The forms cover all the variables required from the respondent at each frequency and, thus, eliminate duplication of surveying.
• In France each profiled enterprise group may receive a tailored structural business statistics survey form. To get started, though, they need to experimentally fill in the tailored survey for the duration of one year, while their legal units still answer to the regular survey forms separately.
6.56 Some other NSIs also reported in the survey their willingness to provide customized questionnaires, but so far practical limitations have prevented wider application of tailor-made approaches.
6.57 Countries reported that customized forms should always be developed in close cooperation with the respondent and experts from the enterprise, but also including consultations with subject matter personnel at the NSI. This usually requires organizing a visit to the enterprise for finalizing the questionnaires and testing of data collection forms before use.
6.58 Electronic data reporting provides a good platform for customizing questionnaires. Several countries have developed or are currently introducing electronic tools for data reporting. They vary from questionnaires based on excel sheets to more complicated XML-based web applications. So far, no country is using XBRL in regular data collection. France has done some experimenting with financial support of Eurostat and also Sweden has started to evaluate
usability of XBRL reporting. France has found data collection far more easier and more effective through XBRL. However, at least in France, it is too early to start wider data collection based on XBRL, since very few enterprise groups have their financial statements available in XBRL.
Conceptual challenges of data reporting
6.59 The survey explored the role of LCU activities in improving data quality. NSIs were asked if they believe that respondents generally understand the concepts of “domestic economy”, “residency” and “economic ownership”, and how these concepts may relate to the information available at the corporate level (Q 3.3). The countries were also asked which data sources they use when measuring for example industrial processing and merchanting, and determining economic ownership of goods, inventories or assets held abroad, and how do they overcome the conceptual differences between international trade in goods statistics and national accounts (Q 3.4). Further question concerned, if their analysis also include R&D production, capital formation and international trade (Q 3.5).
6.60 Some of the concepts used in data collection are complex and the related data may be difficult to collect. As MNEs are often engaged in merchanting and processing as part of global value chains, their activities constitute at least the following challenges for statisticians25:
• Distinguishing between activities that are resident and non-resident in a particular economy;
• Detecting and recording merchanting activities where the actual goods do not cross the compiler’s frontier;
• Detecting movements of goods for processing abroad to be excluded from international trade in goods statistics because there has been no change of ownership.
6.61 Generally, the respondents understand the main concepts used in statistical data collection quite well. However, misunderstanding these concepts is still an important reason for inconsistencies between data from different sources and surveys, and often there is a need to align the concepts to the language of the enterprises and business accountants. Data quality can improve if NSIs explain how the concepts fit the enterprise in question and its activities and characteristics. Regardless of good documentation, there may be cases where the availability of information at the enterprise, according to the desired statistical
25 Connolly, Michael (2012): Merchants and International Processors in the context of SNA 2008 - a strategy to capture the activities of Multinationals in Ireland, Central Statistics Office, Ireland. search.oecd.org/officialdocuments/publicdisplaydocumentpdf/?cote=STD/CSTAT/WPNA(2012)13&docLanguage=En
Large and complex enterprises units
96
breakdown, is simply restricted due to the limits of the enterprise’s internal reporting system.
6.62 To avoid misunderstandings of important concepts, efforts should be put into drafting clear and concise definitions for variables including practical examples to be given in the instructions that accompany questionnaires. Furthermore, statisticians choosing the concepts and carrying out surveys should carefully study what kinds of data are typically available at the corporate level.
6.63 Activities such as industrial processing and merchanting are among the special measurement challenges that LCUs need to tackle. The main source for detecting these activities is confrontation of data from structural business statistics, surveys on international trade in goods and services, PRODCOM, the monthly survey on turnover for manufacturing and value added tax (VAT) data.
6.64 For instance, since 2008, the French structural business statistics survey differentiates between five types of sourcing in manufacturing:
a) Products bought or processed by a sub-contractor supplying the inputs;
b) Own products processed by a contractor on material supplied by the surveyed business;
c) Products produced in own factories based on own concept;
d) Products produced in own factories not based on own concept;
e) Products processed as a sub-contractor (manufacturing service).
6.65 This breakdown does not yet split between domestic and foreign processing, but the possibility to do so is currently studied. France also reported about the risk that concerns data on the legal unit level. These data are no longer used by enterprises’ managers. Instead they are purely administrative and fiscal. For this reason, they become available later and are, therefore, less significant from an economic point of view.
6.66 As discussed in Chapter 3, the concept of ownership used in the International Financial Reporting Standards (IFRS) and the United States Generally Accepted Accounting Principles (GAAP) that guide accounting practices in enterprises has many similarities with the System of National Accounts (SNA) concept of economic ownership. Yet, it is among the concepts that are difficult to understand and apply in practice, similarly to the concept of residency. More and more often global organizations do not need to measure “domestic” production for reasons other than to fulfil the needs of official statistics.
6.67 There are well known conceptual differences in the treatment of the change of ownership principle between merchandise trade statistics and national
accounts that cause difficulties in statistical production. Some NSIs are carrying out research to bridge between the two data sets. Analysis of data from different surveys is important in order to link merchandise trade and production statistics to the national accounts. LCUs can help identify and solve any significant or unintended conceptual differences between these statistics.
6.68 Another difficulty is the lack of data sources for determining economic ownership of goods and inventories or assets held abroad. Two countries reported using survey data for this purpose, and one reviews quarterly and annual company reports for the related information. Additional surveying may be needed in the future to get more information on these MNEs’ activities.
6.69 The survey shows that analysis of large and complex enterprises does not generally extend to data on R&D production, capital formation and international trade. LCUs seem to deal with R&D questions to a limited extent. They assess royalty flows and business expenditure on R&D only in few countries. The Netherlands explains that the comparison of the R&D data from the annual production statistics with the data of the R&D survey is difficult for two reasons:
a) In the production survey only the costs of R&D by third parties are included, so the possibilities to confront data from different sources are limited.
b) The R&D survey is based on cash flows expenditures whereas the production survey measures expenses recorded on an accrual basis. Therefore, these two recording concepts do not necessarily provide matching information.
Data linkage and exchange
6.70 The survey examined whether NSIs are able to link unit level data from international trade surveys and business surveys (Q 3.6). It also reviewed cooperation with other NSIs in examining the activities of MNEs. In this context, the survey asked whether a legal framework is in place for regulating (or preventing) data sharing or data linking (Q 3.7).
6.71 In general terms, MNEs complete a considerable number of statistical questionnaires since they tend to be large and have a significant impact on several statistics (see the country case study 6.1). For this reason they are typically included in most surveys that cover economic and business activities. Consequently, an MNE completes various surveys that are transmitted to different statistical domains in the NSI (or other statistical office) such as industry, services, producer prices, international trade and balance of payments.
6.72 Often MNEs’ activities need to be aggregated in statistical production based on data reported by different units of the MNE. It is critical for consistency how MNEs’ data are treated across statistics. This applies not only to data on merchanting and processing but also on production, turnover, imports and exports etc.

Large and complex enterprises units
97
Country case study 6.1 Number of statistical reporting units from one MNE to statistical surveys in one period
The graph presents the different data sources and the number of units reporting for one MNE managed by the LCU in Ireland. The Central Statistics Office (CSO) of Ireland is currently working towards having unique business identifiers. This work is part of a larger project to create a new statistical infrastructure covering business, personal and geographic unique identifiers. The lack of unique business identifiers is a challenge for many statistical offices. Because of that, complex correspondence keys may be needed for data linking and consistency work. In Ireland, the CSO must link VAT numbers for trade data with the corporation tax number and also with the Central Business Register number of the CSO. The Central Business Register number covers most surveys issued by the CSO, but not all at the moment. The reporting units vary from enterprise level in the balance of payments to several local units surveyed in industrial statistics, and to different types of units for trade in goods where VAT numbers provide the basis. When each data source has a separate identifier, and there are differences in the units, the difficulties are obvious, but not insurmountable. This makes the role of LCU in linking the statistical unit data essential.
Source: Central Statistics Office, Ireland
6.73 In most countries that responded to the survey the LCU link unit level data across statistics, including with trade surveys, although in some countries this is not done regularly. Unfortunately, some NSIs cannot link survey data with register data due to the lack of a common identification (ID) code. One NSI reported that, regardless of having a common ID code for enterprises, linking has not helped solve the large differences that remain at the macro level. The NSI of France, on its part, is working towards an agreement with the central bank on linking the balance of payments micro data on international trade in services with other business surveys.
6.74 Half of the countries reported that they exchange data internationally among NSIs on an ad hoc basis only. Mostly this has been done within the ESSnet on Profiling. Besides ESSnet on Profiling, data exchange
is done within the ESSnet on Global Value Chains and ESSnet on European System of interoperable statistical Business Registers. NSIs of Norway, Denmark and Finland exchanged unit level data (concerning year 2009) as part of a mirror exercise of inward and outward FATS data for a study on FATS quality. One country also reported that mirror data are sometimes exchanged among NSIs on external trade statistics, in the framework of the project on the Modernisation of European Enterprise and Trade Statistics (MEETS).
6.75 The legal framework, usually the statistical law, typically limits or prevents data sharing even nationally among producers of official statistics. However, this may not be the case in all countries. In addition, in some specific cases statistical legislation may allow be bilateral agreements between the enterprise and NSI on sharing the data of the enterprise in question. Some European Commission (EC) regulations also facilitate data
Tax No. – corporation tax number, VAT No. - value added tax number, EHECS - Earnings Hours and Employment Survey, ASI - annual services enquiry, CIP - Census of Industrial Production, PRODCOM - Survey of products (CPA-based), QAI - Quarterly Asset Inquiry, QAII - Quarterly Asset Inquiry to Industry, BOP - Balance of Payments, WPI - Wholesale price inquiry (producer prices also), IPI - Import price inquiry, MSI - monthly services inquiry, MIP - Monthly industrial production

Large and complex enterprises units
98
exchange, such as EC No 177/2008 establishing a common framework for business registers for statistical purposes. The regulation states that “the exchange of confidential data may take place, exclusively for statistical purposes, between the appropriate national authorities of different member states, in accordance with national legislation”.
Solving data consistency issues
6.76 Countries were asked how they solve inconsistencies encountered in source statistics, national accounts and balance of payments. They were also invited to consider any timeliness or continuity issues that need to be addressed in this respect. (Q 3.8)
6.77 The process of solving inconsistencies varies across countries:
• Initiative by the subject matter department: In this case, the unit responsible for the survey carries out data editing. If there are problematic cases, they contact LCU staff. LCU decides how to solve the problems that concern several statistics.
• Initiative by LCU: By comparing different sources LCU detects inconsistencies and then contacts subject matter areas.
• Shared work with LCU: Data confrontation is done both by LCU and the national accounts department.
• Regular working group meetings: A working group of experts from various statistics meets before quarterly publications. Problems are solved case by case as they arise.
• Ad hoc meetings: LCU calls a meeting of experts of various basic statistics and national accountants to solve inconsistencies if needed.
• Contacts to respondents: Large enterprise coordinators contact the enterprise to discuss the inconsistencies and solve the issues related to data reporting.
6.78 In Ireland service level agreements exist between the statistical domains and the LCU. The agreements cover issues related to timeliness, data quality of aggregates supplied by LCU. Editing of the data is done by the LCU in Ireland for all the MNE groups covered by the unit.
6.79 In Canada survey data are compared to other sources for coherence analysis. Data confrontation takes
place in the national accounts integrated framework. For the international accounts there is an annual reconciliation with the United States (U.S.) (the biggest trade and investment partner) data.
6.80 Some countries do not have enough time to detect and solve effectively the inconsistencies of monthly statistics, such as international trade in goods. Regardless of LCU’s efforts, typically all inconsistencies cannot be solved before publishing quarterly statistics.
6.81 Continuity problems may occur when short-term statistics have to be adjusted because of a consistency correction. Since the main aim of short-term statistics is to measure changes across time and not levels or structures, adjustments for structural correctness may not be necessary in short-term statistics. Instead, maintaining comparability in time requires a lot of efforts while producing short-term statistics. Therefore, important inconsistency problems in monthly statistics require timely work by LCUs.
Typology
6.82 The survey studied which “standard” cases of global production, as introduced in Chapter 2, are most frequently examined (Q 4.1). The countries were also asked to describe any additional cases they have encountered that do not fall under the “standard” types presented in the typology (Q 4.2).
6.83 Countries were requested to report on how often they examine different cases of the typology of global production using a scale from 1 (hardly examined) to 5 (very often examined). Most frequently NSIs analyze cases of global production that relate to “merchanting” (case B) (see Figure 6.4), followed by “production abroad of materials owned by domestic principal” (case A1) and “domestic production of materials owned by principal abroad” (case A2). Finland, Ireland, Netherlands and Sweden encounter most often cases of “factoryless production” (case C). “Fragmenting parts of the production of services” (cases D and E), including or excluding intellectual property products (IPP), is quite often examined in Sweden and Ireland. “Subcontracting services production” (case F) is often encountered in France, Ireland and Sweden. “Direct investment (DI) enterprises not directly engaged in the production process required making the good (case G) or the service” (case H) are in practice only examined by the Netherlands.

Large and complex enterprises units
99
Figure 6.4 Most frequently examined cases of global production
6.84 All responding countries had not yet implemented all of the concepts suggested by the typology. New Zealand reported that global production has been considered to be insignificant in the past, but these cases will be re-assessed in light of the 2008 SNA and BPM6.
6.85 Finland has recognized that especially project suppliers often mix the categories of the current typology. The Netherlands has encountered two cases that may not fall under any of the categories A-H:
a) The use of nationally developed programme formats by foreign television stations and vice versa. Such companies seem to be specializing in renting out entertainment, literary or artistic originals.
b) The exploration of oil and gas abroad, both in the case when there is a foreign establishment and in the case when there is not. When the exploration and production activities are controlled by a foreign company and the management decisions are effectively taken abroad, the legal entity in the Netherlands is regarded as an empty shell and treated as a special purpose entity (SPE). The legal entity in the Netherlands seems to be there merely for tax optimization. However, when the exploration and production activities abroad are controlled by a domestic company and the management decisions are taken by the Dutch headquarters, the situation is not that clear. On the one hand, it can be debated that the production abroad is controlled and managed by the Dutch headquarters, so that the resources flow to the Dutch legal entities; and therefore, production should be accounted for in
the Netherlands. On the other hand, most exploration and production activities last more than one year and on that basis should be treated similarly as construction projects abroad by a multiterritory enterprise. That is, production should be accounted for in the country where the exploration and production activities take place.
Specific country experiences
6.86 Countries also reported some additional information about their experience or problems with large and complex enterprises (Q 5.1).
6.87 Treatment of VAT-registrations is crucial in Hungary. These data have to be examined and adjusted regularly to reconcile the differences in concepts between international trade and national accounts.
6.88 In Sweden reporting of foreign trade is difficult in cases where the enterprise regards the exported items as a project. This does not fit into the Harmonized System (HS) classification, where only goods should be included. The borderline between goods and services is somewhat blurred and not in line with what was the case when the reporting of trade in goods was first developed. Transfer pricing and internal agreements between various units within the same enterprise group are also hard to keep track of in a way in which they ought to be valued according to the national accounts recommendations.
6.89 France is presently working on:
• Further analyzing the impact of profiling and shifting from legal unit to enterprise (or enterprise group) as a statistical unit to provide a better
0
5
10
15
20
25
Case B:Merchanting
Case A1:Production abroadof materials owned
by domesticprincipal
Case A2: Domesticproduction of
materials ownedby principal abroad
Case C:Factoryless
manufacturing
Case D:Fragmentingpart of the
production ofservices, incl. IPPs
Case E:Fragmentingpart of the
production ofservices, excl.
IPPs
Case F:Subcontractingproduction of
services
Case G/H:Goods/services byDI enterprises not
engaged inproduction
Finland Netherlands Sweden Ireland Hungary

Large and complex enterprises units
100
understanding of the way production is concentrated among enterprises;
• Treatment of highly integrated industries (such as plane construction) in which national production is not significant. The aim is to allocate value added per country (without trying to calculate it through production, assembly, etc.);
• Treatment of affiliates controlling the whole global production of an enterprise group and allocating it to distributive affiliates without physical movements of goods through the country of its residence.
6.90 Statistics Canada has achieved many objectives by implementing a program to respond to the challenges associated with the measurement of large and complex enterprises. These include:
• Evaluating data coherence and resolving issues by working collaboratively among survey subject matter staff, national accountants and business respondents;
• High quality frame for survey selection achieved by having specialized staff working directly with companies to ensure their operations are correctly identified;
• Reductions in reporting burden by having specialized staff work directly with companies to ensure the statistical information requirements are both understood and reportable;
• Mechanism is in place to rapidly respond to data quality issues. Specialized staff can quickly contact and work with company staff to resolve reporting issues.
6.91 In the Netherlands the LCU exists since 2010. One of its main benefits is that data editing for a number of surveys is now done within one unit instead of numerous decentralized units. This makes it much easier to correct data as early as possible in the statistical process. In the Netherlands each account manager works in a team with one profiler, who maintains the structure of the enterprise groups in the business register and two analysts who review and edit survey data. This small team deals with all the enterprise groups and the underlying enterprises in the portfolio of the account manager. In this way the knowledge on an enterprise group is concentrated and more easily shared.
6.92 For two years the Netherlands has been using a consistency tool, i.e. an automated process to retrieve production data from the production systems of the source statistics and to subject these data to a number of consistency checks. This tool allows detecting inconsistencies in an efficient way.
6.93 Within Statistics Netherlands good contacts with the national accounts department are important to ensure that attention is paid to key issues. Good contacts with statistical departments guarantee that the
work by LCU is supported, used and acknowledged. Good documentation of findings and sharing the documentation with other departments is essential.
6.94 Most respondents are also willing to supply the information requested by Statistics Netherlands to solve and explain the inconsistencies. Respondents appreciate that their data are taken seriously and that the NSI tries to adjust the data collection units in a way that fits the organization of the respondent.
Conclusions and recommendations 6.95 NSIs clearly acknowledge and are aware of the measurement challenges of MNEs, particularly in the context of global production arrangements.
6.96 Collecting data from large and complex enterprises will demand an increasingly multi-disciplinary approach. Survey managers, statisticians, informatics specialists, subject matter experts, respondent relationship managers and survey design specialists need to work together to ensure availability and quality of data. For statistical agencies this will require continuous thought of how the work should be organized to support such wide collaboration.
6.97 MNEs are often included in practically all NSI’s surveys that cover economic and business activities. Developing questionnaires in close cooperation with MNEs and tailoring questionnaires to better meet their needs may also help improve surveys in general.
6.98 Data exchange among producers of official statistics is not yet as efficient as it could be. National division of work and legal frameworks currently limit the possibilities for data exchange among producers of official statistics. In some countries lack of common ID codes also prevents proper data linking.
6.99 In most countries international exchange of data among NSIs is more an exception than a regular practice. To be able to produce high quality statistics new opportunities for international consistency work should be explored. The EuroGroups register that covers MNEs including their business activities spread over Europe is a promising initiative in this direction.
6.100 Based on country experience highlighted in the survey responses, close cooperation with respondents ensures better understanding of data requests and reduces response burden. At the same time knowing the most important respondents helps statisticians solve inconsistencies more efficiently. Even though the activities of LCUs vary across countries, they definitely provide a mechanism to support statisticians in dealing with MNEs. LCUs can also improve efficiency by promoting the use of common tools, drafting clear instructions for data collection and enhancing consistent treatment of large and complex enterprises’ data. Moreover, when LCUs review MNEs’ data they do that for various statistics using this information whereas without LCUs this work would be done multiple times in
Large and complex enterprises units
101
various statistics leading to higher costs and lower consistency.
6.101 The survey confirmed that the treatment of globalization is challenging, among other things, due to conceptual differences between statistics and lack of proper data sources for example on economic ownership. Additional surveying may be needed in the future to get a clearer understanding of MNEs’ activities.
6.102 The target of LCU work is to help improve statistical data so that it could provide a coherent description of the economy. LCU activities presented in this chapter provide examples of how to facilitate consistency of the results of statistics.
6.103 The recommendations from this chapter are formulated as follows. NSIs are encouraged to:
a) Analyze the need for setting up an LCU, e.g. based on their challenges with large respondents, structure of national economy and complexity of the business sector. A relatively small size of national economy seems to make the establishment of an LCU a more containable and achievable goal.
b) Learn from other countries that have developed strategies for and gained experience in dealing with large and complex enterprises.
c) Consider alternative ways to organize this work at the NSI. Engage experts from different areas to support a multi-disciplinary approach to data collection and analysis.
d) Develop cooperation mechanisms and collaboration among producers of statistics, both nationally and internationally.
6.104 Although the organization, tasks and the analyzed data sets may vary across countries, the survey revealed many common issues which statistical offices face. A platform to share experience and learn from each other’s practices and strategies would be very beneficial.
6.105 Many countries have plans to start, or further develop, consistency work in order to seek efficiencies, improve data quality and develop respondent relationships. Recommendations in this chapter may need to be updated when more experience has been gained.
Large and complex enterprises units
102
Annex 6.1 – Questionnaire on the operation of large and complex cases units 1. Organizational aspects
1.1. What kind of arrangements does your Statistical Institute make (or is planning to make) to deal with large and complex enterprises? Does your organization have a dedicated “large and complex cases” unit? If so, does this function as an independent unit, or as a working group with contributors from various statistical departments? If so, where are these activities located in your organization, together with business register, business statistics, national accounts, etc.?
1.2. What is the size of your national statistical institute in full time equivalents (or number of employees)? How much working time is annually spent on dealing with large and complex cases measured in full time equivalents (or number of employees)?
1.3. Are there particular skills or competencies required for dealing with large and complex cases?
1.4. Are you consulting experts from outside the Statistical Institute such as representatives from central banks or tax authorities?
1.5. Could you (roughly) allocate the labour capacity dedicated to large and complex cases to the following activities: a. Surveying .. % b. Data analysis (imputations, data adjustments) .. % c. Profiling of enterprises .. % c. Company visitations .. % d. Coordination .. % e. Other (please explain) .. %
2. Coverage of data sources
2.1. Please sum up the various statistics that are subject to large and complex cases examinations: a. Business surveys (yes/no) b. International trade in goods survey (yes/no) c. International trade in services surveys (yes/no) d. Balance of payment surveys (yes/no) e. Investment surveys (yes/no) f. R&D surveys (yes/no) g. Producer price statistics (yes/no) h. Register data (tax, customs, .., please explain) (yes/no) i. Corporate accounts (yes/no) j. Other data sources (please explain) (yes/no)
2.2. Are (some of) these data source analyzed on annual and/or quarterly basis?
3. Operational aspects
3.1. Could you briefly explain: a) how the population of large and complex enterprises (or enterprise groups) is being determined and maintained? b) what is its size in number of enterprises and kind-of-activity units? c) what prominence is given to globalization related measurement problems when determining the population of large and complex enterprises?
3.2. Could you briefly explain: a) if respondents, or company representatives, consider centralized surveying, by approaching only one contact person in their organization, feasible and desirable from their point of view? b) if customized survey forms, or customized survey methods, are used for large and complex enterprises? c) If so, could you explain how respondents are being consulted in setting up these customized surveys? d) Do you use electronic surveying methods, for example based on XML or XBRL?
3.3. Do you believe that respondents, or company representatives, generally understand the concepts of “domestic economy”, “residency” and “economic ownership” applied in official statistics and national accounts, and how these concepts may relate to information available at corporate level?
Large and complex enterprises units
103
3.4. Which data sources are leading when measuring activities such as industrial processing and merchanting? How are in this respect the conceptual differences between international trade in goods statistics and national accounts overcome? Do you use specific data sources to measure economic ownership of goods, inventories or assets held abroad?
3.5. Does your analysis of large and complex cases also include R&D: production, capital formation and international trade? Which data sources are examined in this respect, and on what principles is economic ownership of R&D assets inside multinational enterprises being determined?
3.6. Are you able to link, on enterprise or establishment level, the results from international trade surveys and business surveys?
3.7. Do you examine the activities of multinational enterprises in cooperation with other national statistical offices? Is there a legal framework in place that regulates (or inhibits) data sharing or data linking?
3.8. How are encountered inconsistencies solved in source statistics, national accounts and balance of payments statistics? Are there timeliness and continuity issues that need to be solved in this respect?
4. Typology
4.1. Could you indicate on a scale of 1 to 5 which “standard” cases of global production, as introduced in chapter 2 of the task force report, are most frequently examined? ( 1 = hardly, 5 = very often): Case A1: Production abroad of materials owned by domestic principal Case A2: Domestic production of materials owned by principal abroad Case B: Merchanting Case C: Factoryless Manufacturing Case D: Supplying Intellectual Property Inputs Case E: Outsourcing part of the production of services Case F: Subcontracting production of services Cases G and H: Direct investment enterprises not directly engaged in the production process required to make the good (case G) or the service (case H).
4.2. Did you encounter significant case studies, which do not seem to fall under one of these categories (A-H)? If so, could you briefly describe these cases?
5. Specific country experiences
Do have specific experiences or problems that are worthwhile mentioning for the benefit of this questionnaire which are not addressed in previous questions?


Measuring trade in value added
105
Chapter 7 Measuring trade in value added Introduction 7.1 Global value chains (GVC), or the process of international fragmentation of production, can be analyzed from a micro and macro perspective. The micro perspective is illustrated by the typology of global production arrangements in Chapter 2, but also by the well-known Apple iPod example (Dedrick et al, 2010), which showed that of the USD 144 (Chinese) factory-gate price of an iPod, less than 10 per cent contributed to Chinese value added, with the bulk of the components (about USD 100) being imported from Japan and much of the rest coming from the United States (U.S.) and Republic of Korea. This stylised approach is typically conducted for specific products and only explains part of the story of who benefits from trade and how GVCs work, as it is typically unable to reveal how the intermediate parts are created. For example the message would be significantly different if, for sake of argument, the imported parts from Japan used to make the iPod required significant Chinese content.
7.2 To deal with the bigger picture and also to capture all of the upstream effects, a number of studies have adopted a macro approach, based on the construction of inter-country or world input-output tables (Hummels et al. (2001), Daudin et al. (2006, 2009), Johnson and Noguera (2010) and Koopman et al. (2011)). A number of pioneering initiatives have helped accelerate improvements in the underlying statistics used to construct the results, such as those of Global Trade Analysis Project (GTAP), the studies of the World Trade Organization (WTO) with the Institute of Developing Economies Japan External Trade Organization (IDE-JETRO) and also the World Input-Output Database (WIOD).
7.3 But these studies and initiatives have generally been one-off in nature and often require the use of non-official statistical data. What has been lacking thus far has been a systematic attempt to mainstream the development of statistics in this area. In response to this need, on 15 March 2012, the Organisation for Economic Co-operation and Development (OECD) and WTO joined forces to develop a database of Trade in Value Added (TiVA) indicators and to mainstream their production within the international statistical system. The first preliminary results from this initiative were released on 16 January 2013 and some highlights from this first release are presented below. The latest release was
produced in June 2015. But, as described in this chapter, further work is needed (and can be done) in order to improve the quality of the estimates produced under the “trade in value added” umbrella.26
7.4 This chapter in some respects demonstrates the importance of all the preceding chapters. Ultimately the chapter acts as a clarion call, in conjunction with the previous chapters, to national statistical institutes (NSI), that the world is increasingly interconnected and that conventional approaches used to understand how economies work can no longer rely solely on national statistics. Increasingly, in order to understand how economies work, and how to target and create industrial policies targeting competitiveness for example (notwithstanding trade policies and the implications and importance of trade), it is necessary to see the whole. National statistics build pictures based on inter-relationships between producers and consumers and the rest of the world. But these relationships, particularly those with the rest of the world have become increasingly more complex, and, as such, there is an increasing need to consider global production within a global accounting framework. This implies a departure from the traditional role of international organizations as compilers of internationally comparable national statistics, such as national input-output or supply-use tables. Instead it requires that they bring together these national tables to create a global table and also act as conduits to resolve on-going differences in mirror statistics. This latter point was already highlighted in Chapter 5.
7.5 The remainder of this chapter describes the policy drivers and needs for such a framework, and the underlying methodology and assumptions used to estimate trade in value added, before finalising on the implications for NSIs, particularly in data collection and compilation of input-output tables. The chapter ends by describing future longer term avenues of research.
26 To mainstream the production of global input-output tables in the international statistics information system the OECD and WTO are actively reinforcing on-going collaborations and developing new collaborations with regional partners, including amongst others: the Eurostat/JRC project on Full International and Global Accounts for Research in Input – Output Analysis (FIGARO) in the European Union; IPEA-UNECLAC, developing TiVA for the Latin and Central American region; APEC-TiVA; UN ESCWA, UNECA and the African Development Bank.

Measuring trade in value added
106
Figure 7.1 Double counting in gross flows of trade
Key principles of TiVA 7.6 The TiVA initiative addresses the double counting implicit in current gross flows of trade and instead measures flows related to the value that is added (labour compensation, other taxes on production and operating surplus, or profits) by a country in the production of any good or service that is exported.
7.7 The simple example above illustrates this. Country A exports USD 100 of goods, produced entirely within A, to country B that further processes them before exporting them to C where they are consumed. B adds value of USD 10 to the goods and so exports USD 110 to C. Conventional measures of trade show total global exports and imports of USD 210 but only USD 110 of value added has been generated in their production. Conventional measures also show that C has a trade deficit of USD 110 with B and no trade at all with A, despite the fact that A is the chief beneficiary of C’s consumption.
7.8 If instead we track flows in value added, one can recalculate C’s trade deficit with B on the basis of the value added it "purchases" from B as final demand, which reduces its deficit on this basis, to USD 10, and apply the same approach to A's value added to show C running a deficit of USD 100 with A. Note that C's overall trade deficit with the world remains at USD 110. All that has changed is its bilateral positions. This simple illustration reveals how output in one country can be affected by consumers in another and by how much (for example C's consumers driving A's output) but it can also reveal many other important insights into GVCs. For example it shows that B's exports depend significantly on intermediate imports from A, and so reveals that protectionist measures on imports from A could harm its own exporters and hence competitiveness. Indeed, by providing information at the level of specific industries, it is possible to provide insights in other areas too, such as the contribution of the service sector to international trade.
The need for TiVA 7.9 While the literature on trade in value added is quite technical, it has attracted a lot of attention from policymakers. What initially seemed a concern for trade statisticians is now understood as a key issue for the policy debate. For example, Pascal Lamy, the Director General of the WTO noted that “the statistical bias created by attributing commercial value to the last country of origin perverts the true economic dimension of the bilateral trade imbalances. This affects the political debate, and leads to misguided perceptions”.27 Recently, the French Senate devoted a special seminar to the related statistical and policy issues.28
7.10 There are a number of areas where measuring trade in value added terms brings a new perspective and is likely to impact on policies:
a) Trade, growth and competitiveness: Better understanding how much domestic value added is generated by the export of a good or service in a country is crucial for development strategies and industrial policies. Some countries have capitalised on GVCs by developing comparative advantages in specific parts of the value-chain. For example in China, much of its exports reflect assembly work, where the foreign content is high. Access to cheaper imports, therefore, and accessibility within GVCs, matters as much in a world of international fragmentation as does access to markets. Conventional gross trade statistics, however, are not able to reveal the foreign content of exports and so there is a risk that policies protecting industries where gross statistics reveal a comparative
27 Financial Times, 24 January 2011.
28 WTO and Commission des Finances du Sénat, (2011) "Globalization of industrial production chains and measurement of trade in value added", Conference proceedings.
Country A
Country B
Country C
Value-added (100)
Gross exports (intermediates)
(100)
Gross exports (110)
Value-added (10)

Measuring trade in value added
107
advantage may decrease the competitiveness of those very same domestic industries, and, so mercantilist-styled “beggar thy neighbour” strategies can turn out to be “beggar thyself” miscalculations.
b) In addition, domestic value added is not only found in exports but also in imports: goods and services produced in one domestic industry are intermediates shipped abroad whose value comes back to the domestic economy embodied in the imports of other, and often the same, industries. As a consequence, tariffs, non-tariff barriers and trade measures –such as anti-dumping rights– can also impact on the competitiveness of domestic upstream producers (as well as the competitiveness of downstream producers as mentioned above) in addition to foreign producers. For example, a study of the Swedish National Board of Trade on the European shoe industry highlights that shoes “manufactured in Asia” incorporate between 50 per cent and 80 per cent of European Union (EU) value added. In 2006, anti-dumping rights were introduced by the European Commission on shoes imported from China and Vietnam. An analysis in value added terms would have revealed that EU value added was in fact subject to the anti-dumping rights.29
c) Looking at trade from a value added perspective is also able to better reveal how upstream domestic industries contribute to exports, even if those same industries have little direct international exposure. Gross trade statistics for example reveal that less than one-quarter of total global trade is in services. But in value added terms the share is significantly higher. Goods industries require significant intermediate inputs of services (both from foreign and domestic suppliers). Looking at trade in value added terms, therefore, can reveal that policies to encourage services trade liberalisation and more foreign direct investment (FDI), and so policies designed to improve access to more efficient services, can improve the export competitiveness of goods industries.
d) Global imbalances: Accounting for trade in value added (specifically accounting for trade in intermediate parts and components), and taking into account "trade in tasks", does not change the overall trade balance of a country with the rest of the world (ROW) - it redistributes the surpluses and deficits across partner countries. When bilateral trade balances are measured in gross terms, the deficit with final goods producers (or the surplus of
29 “Adding value to the European Economy. How anti-dumping can damage the supply of globalised European companies. Five case studies from the shoe industry”, Kommerskollegium, National Board of Trade, Stockholm, 2007.
exporters of final products) is exaggerated because it incorporates the value of foreign inputs. The underlying imbalance is in fact with the countries who supplied inputs to the final producer. As pressure for rebalancing increases in the context of persistent deficits, there is a risk of protectionist responses that target countries at the end of GVCs on the basis of an inaccurate perception of the origin of trade imbalances. As shown below, the preliminary results from the OECD-WTO database point to significant changes.
e) The impact of macro-economic shocks: The 2008-2009 financial crises was characterised by a synchronised trade collapse in all economies. Authors have discussed the role of global supply chains in the transmission of what was initially a shock on demand in markets affected by a credit shortage. In particular, the literature has emphasized the “bullwhip effect” of GVCs.30 When there is a sudden drop in demand, firms delay orders and run down inventories with the consequence that the fall in demand is amplified along the supply chain and can translate into a standstill for companies located upstream. A better understanding of value added trade flows would provide tools for policymakers to anticipate the impact of macro-economic shocks and adopt the right policy responses. Any analysis of the impact of trade on short-term demand is likely to be biased when looking only at gross trade flows. This was again more recently demonstrated in the aftermath of the natural disaster that hit Japan in March 2011.31
f) Trade and employment: Several studies on the impact of trade liberalisation on labour markets try to estimate the “job content” of trade. Such analysis is only relevant if one looks at the value added of trade. What the value added figures can tell us is where exactly jobs are created. Decomposing the value of imports into the contribution of each economy (including the domestic one) can give an idea of who benefits from trade. The EU shoe industry example given above can be interpreted in terms of jobs. Traditional thinking in gross terms would regard imports of shoes manufactured in China and Vietnam by EU shoe retailers as EU jobs lost and transferred to these countries. But in value added terms, one would have to account for the EU value added and while workers may have indeed lost their job in the EU at the assembly stage, value added-based measures would have highlighted the
30 See Escaith et al. (2010) and Lee et al. (1997).
31 See an application of international IO on "Japan's earthquake and tsunami: International trade and global supply chain impacts", VoxEU, April 2011 at http://www.voxeu.org/index.php?q=node/6430

Measuring trade in value added
108
important contribution made by those working in the research, development, design and marketing activities that exist because of trade (and the fact that this fragmented production process keeps costs low and EU companies competitive). When comparative advantages apply to “tasks” rather than to “final products”, the skill composition of labour imbedded in the domestic content of exports reflects the relative development level of participating countries. Industrialised countries tend to specialise in high skill tasks, which are better paid and capture a larger share of the total value added. A WTO and IDE-JETRO study on GVCs in East Asia shows that China specializes in low-skill types of jobs. Japan, on the contrary, has been focusing in export activities intensive in medium and high skill labour, while importing goods produced by low-skilled workers. The study also shows that the Republic of Korea was adopting a middle-of-the ground position (in 2006), but was also moving closer to the pattern found in Japan.32
g) Trade and the environment: Another area where the development of a global input-output table would support policymaking is in the assessment of the environmental impact of trade. For example, concerns over greenhouse gas emissions and their potential role in climate change have triggered research on how trade openness affects CO2 emissions. The unbundling of production and consumption and the international fragmentation of production require a value added view of trade to understand where imported goods are produced (and hence where CO2 is produced as a consequence of trade). Various OECD studies note that the relocation of industrial activities can have a significant impact on differences in consumption-based and production-based measures of CO2 emissions (Ahmad et al., 2003, Nakano et al., 2009).
Early evidence from the OECD-WTO database33 7.11 The results presented in this section are obtained from the OECD-WTO TiVA indicators, which are preliminary results as released by the OECD in January 2013.
32 See WTO and IDE-JETRO (2011).
33 For more information, and the latest data, on the database see www.oecd.org/trade/valueadded
7.12 At the time of writing the database is based on a global input-output table that brings together national input-output tables for 57 economies34, combined with bilateral trade data on goods and services, with a breakdown into 37 industries (see below). The following provides an overview of the key messages provided by the data.
Exports require imports
7.13 The data reveals that the import content of exports (the share of value added by the export of a given product that originates abroad) is significant in all countries for which data are presented (40 at the time of writing, all 34 OECD countries, Brazil, China, India, Indonesia, Russian Federation and South Africa), see Figure 7.2, which shows the domestic content of exports, as a per cent of total exports.
7.14 Typically the larger a country, the lower the overall foreign content, reflecting in part scale and cost. But a number of smaller economies also have relatively low foreign content in their exports, such as Australia, Chile and Norway, reflecting their high share of exports of natural resource goods such as ores, oil and copper, which have not surprisingly a low foreign content. Geography plays a role too, which helps explain New Zealand’s relatively low ratio, as well as its relatively high dependency on agricultural exports, which also have a relatively low foreign content. For mid-size economies, however, particularly those in Eastern Europe, the norm is for around one-third of the value of exports to reflect foreign content.
7.15 Notwithstanding some of the interpretative caveats above, the ratio is perhaps the single most digestible indicator of the propensity of a country to engage in GVCs. It reveals the existence of European, Asian and North American production hubs and also the significant dependency many countries have on imports to generate exports. In Mexico, with its maquiladoras35, and China with its processors/assemblers, about one-third of overall exports reflect foreign content and, as described below, these are considered to be conservative estimates.
34 As part of the on-going expansion of the database, the June 2015 included data for 61 economies, updated to 2011, with the corresponding underlying global input-output tables also made available for the first time.
35 Maquiladora is a manufacturing operation in Mexico, where factories import certain raw-materials semi-finished goods on a duty-free and tariff-free basis for assembly, processing, or manufacturing and then export the products back to country of origin.
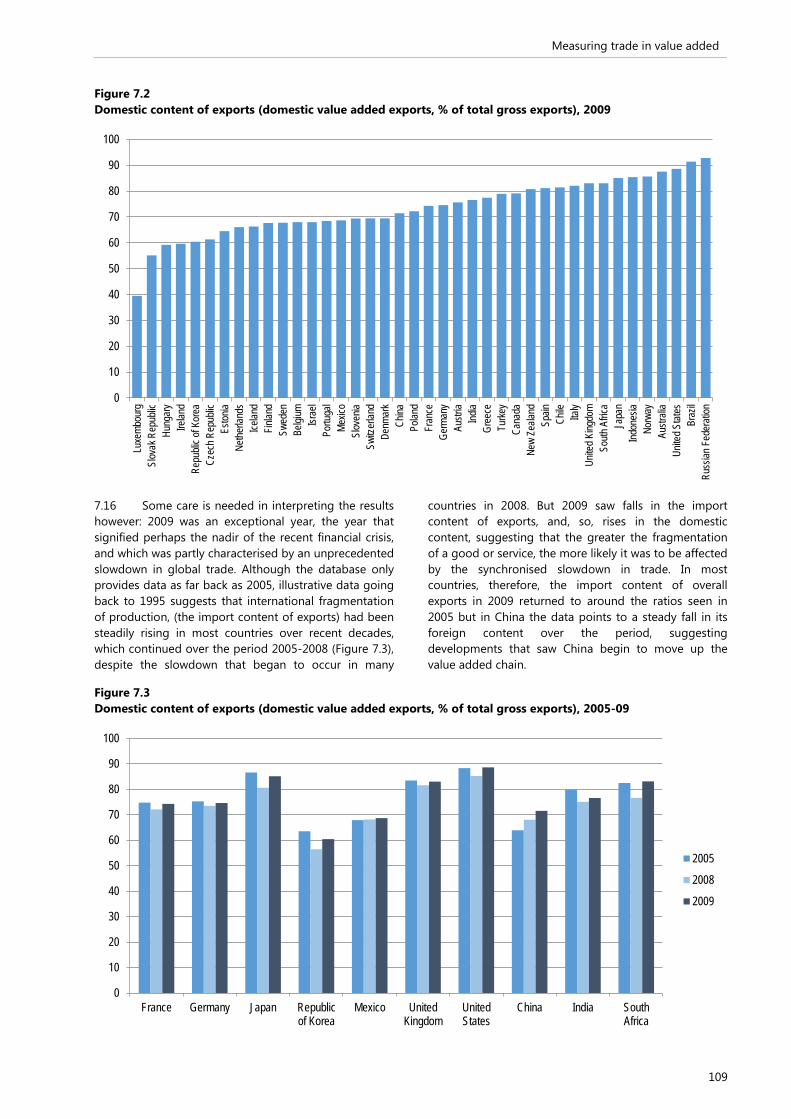
Measuring trade in value added
109
Figure 7.2 Domestic content of exports (domestic value added exports, % of total gross exports), 2009
7.16 Some care is needed in interpreting the results however: 2009 was an exceptional year, the year that signified perhaps the nadir of the recent financial crisis, and which was partly characterised by an unprecedented slowdown in global trade. Although the database only provides data as far back as 2005, illustrative data going back to 1995 suggests that international fragmentation of production, (the import content of exports) had been steadily rising in most countries over recent decades, which continued over the period 2005-2008 (Figure 7.3), despite the slowdown that began to occur in many
countries in 2008. But 2009 saw falls in the import content of exports, and, so, rises in the domestic content, suggesting that the greater the fragmentation of a good or service, the more likely it was to be affected by the synchronised slowdown in trade. In most countries, therefore, the import content of overall exports in 2009 returned to around the ratios seen in 2005 but in China the data points to a steady fall in its foreign content over the period, suggesting developments that saw China begin to move up the value added chain.
Figure 7.3 Domestic content of exports (domestic value added exports, % of total gross exports), 2005-09
0
10
20
30
40
50
60
70
80
90
100Lu
xemb
ourg
Slov
ak R
epub
licHu
ngar
yIre
land
Repu
blic o
f Kor
eaCz
ech R
epub
licEs
tonia
Nethe
rland
sIce
land
Finlan
dSw
eden
Belgi
umIsr
ael
Portu
gal
Mexic
oSl
oven
iaSw
itzer
land
Denm
ark
China
Polan
dFr
ance
Germ
any
Austr
iaInd
iaGr
eece
Turke
yCa
nada
New
Zeala
ndSp
ainCh
ile Italy
Unite
d King
dom
South
Afric
aJa
pan
Indon
esia
Norw
ayAu
strali
aUn
ited S
tates
Braz
ilRu
ssian
Fed
erati
on
0
10
20
30
40
50
60
70
80
90
100
France Germany Japan Republicof Korea
Mexico UnitedKingdom
UnitedStates
China India SouthAfrica
2005
2008
2009

Measuring trade in value added
110
Figure 7.4 Transport equipment, gross exports decomposed by source, USD billion, 2009
7.17 Tangible evidence of the scale of GVCs emerges more clearly when considering specific industries. For example between one-third to half of the total value of exports of transport parts and equipment by most major producers originated abroad in 2009 (Figure 7.4), driven by regional production hubs. In the U.S. and Japan, the shares were only about one-fifth, reflecting their larger scope to source inputs from domestic providers but this was also the case for Italy, possibly reflecting efficient upstream domestic networks
of small and medium enterprises. Interestingly, in 2009, Germany exported 25 per cent more than the U.S. in gross terms but only 5 per cent more in value added terms.
7.18 Similar patterns emerge in other sectors with a high degree of international fragmentation. For example in China and the Republic of Korea, in 2009, the foreign content of exports of electronic products was about 40 per cent (Figure 7.5) and in Mexico, the share was over 60 per cent.
Figure 7.5 Electronic equipment, gross exports decomposed by source, USD billion, 2009
0
50
100
150
200
Italy Spain China UK Republic ofKorea
France OtherNAFTA
Japan OtherEurope
USA Germany
Foreign Content
Domestic Content
0
100
200
300
400
500
Italy France UK Switzerland Mexico Germany Republicof Korea
USA Japan OtherEurope
China
Foreign ContentDomestic Content

Measuring trade in value added
111
High shares of intermediate imports are used to serve export markets
7.19 The figures above reveal the scale of international fragmentation of production as firms exploit possibilities provided to integrate into global value chains, through specialisation in tasks where they have comparative advantages rather than through the production of the whole value chain. Integration requires access to cost effective intermediate goods and services produced upstream, which includes imported goods and services. Protectionist measures that increase the cost of these intermediate imports can therefore be counter-productive as they damage the competitiveness of exporters.
7.20 In most economies, around one-third of intermediate imports are destined for the export market. Not surprisingly, typically, the smaller the economy the higher the share, but even in the U.S. and Japan these shares are 15 and 20 per cent respectively at the total economy level, with a higher incidence of intermediate imports in some highly integrated industries (Figure 7.6). In Japan for example nearly 40 per cent of all intermediate imports of transport equipment end up in exports.
7.21 In many other countries, the share of intermediate imports embodied in exports is significantly higher. In Hungary, for example two-thirds of all intermediate imports are destined for the export market after further processing, with the share reaching 90 per cent for electronic intermediate imports. In China, Republic of Korea and Mexico around three-quarters of all intermediate imports of electronics are embodied in exports. The database also shows that close to 85 per cent of China's intermediate imports of textile products end up in exports. Open markets matter, including in the services sector
7.22 Services comprise about two-thirds of gross
domestic product (GDP) in most developed economies. However, based on gross terms, trade in services typically account for less than one-quarter of total trade in most countries. This partly reflects the fact that significant shares of services output are generally not tradeable, e.g. government services, many personal services and imputations such as those made in GDP calculations to reflect the rent homeowners are assumed to pay themselves (between 6-10% of GDP in most developed economies). But it also reflects the fact that the service sector provides significant intermediate inputs to domestic goods manufacturers.
7.23 Accounting for the value added produced by the services sector in the production of goods shows that the service content of total gross exports is over 50 per cent in most OECD economies, approaching two-thirds of the total in the United Kingdom (Figure 7.7). Canada, with significant exports of natural resources, which have typically low services content, has the lowest services content of its exports in the G7 but even here the share is close to 40 per cent.
7.24 Typically, emerging economies and other large exporters of natural assets, such as Norway, Chile and Australia, have the lowest shares of services. But in India over half of the value of its gross exports originates in the service sector. Indonesia has the lowest share of the 40 countries in the database at around 20 per cent.
7.25 Part of the explanation for the difference between OECD countries and emerging economies reflects the relatively higher degree of (largely domestic) outsourcing of services by manufacturers in OECD countries in recent decades, suggesting that a similar process could lead to improvements in the competitiveness of emerging economy manufacturers. Figure 7.7 also reveals a not insignificant contribution to exports coming from foreign service providers.
Figure 7.6 Intermediate imports embodied in exports, % of total intermediate imports, 2009
0
25
50
75
100
UnitedStates
Japan Mexico Germany China Republic ofKorea
CzechRepublic
Hungary
Total Transport Equipment Electronics

Measuring trade in value added
112
Figure 7.7 Services value added: % of total exports, 2009
7.26 Another, perhaps clearer way, of illustrating the importance of services to exports is to consider, the services content of specific exports in goods producing sectors. Figure 7.8 below, which takes an average of all 40 countries in the database, shows that services make a significant contribution (typically one-third) across all manufacturing sectors, with significant shares provided
by both foreign and domestic service providers. For individual sectors in specific countries the importance of the service sector is often starker. In France, for example, the data reveals that over half of the domestic value added generated in producing transport equipment originates in the French service sector.
Figure 7.8 Services value added: % of total exports of goods, average of OECD and BRICS36, 2009
36 Brazil, Russian Federation, India, China and South Africa
0
25
50
75
100
Indon
esia
China
Mexic
oCh
ileNo
rway
Russ
ian F
eder
ation
Repu
blic o
f Kor
eaSo
uth A
frica
Cana
daBr
azil
Austr
alia
Rest
of the
Wor
ldJa
pan
Slov
ak R
epub
licCz
ech R
epub
licPo
land
New
Zeala
ndHu
ngar
yTu
rkey
Nethe
rland
sSl
oven
iaGe
rman
yAu
stria
Switz
erlan
dIta
lyPo
rtuga
lInd
iaIce
land
Unite
d Stat
esFin
land
Swed
enEs
tonia
Israe
lFr
ance
Denm
ark
Belgi
umSp
ainUn
ited K
ingdo
mIre
land
Gree
ceLu
xemb
ourg
Foreign content Domestic content
0
10
20
30
40
50
Agric
ultur
e
Minin
g
Food
Texti
les
Woo
d, pa
per
Mine
ral p
rodu
cts
Metal
s
Mach
inery
nec
Elec
tronic
s
Tran
spor
t equ
ipmen
t
Othe
r Man
ufactu
ring
Foreign
Domestic
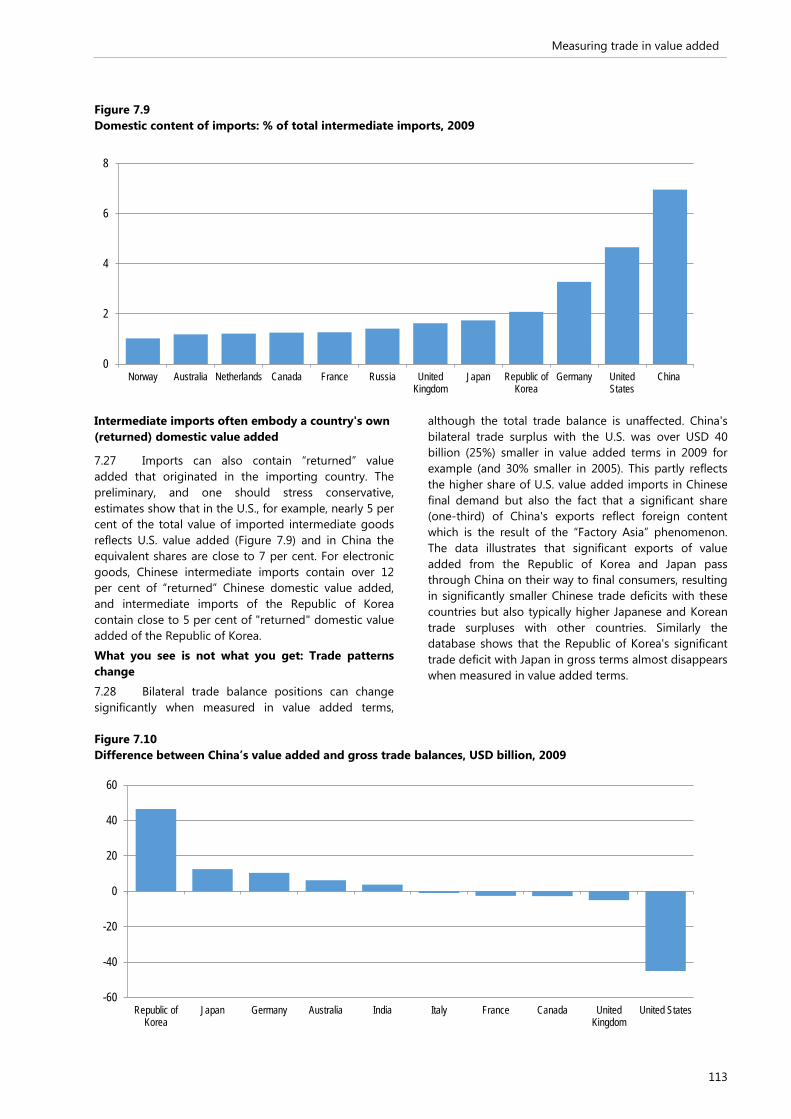
Measuring trade in value added
113
Figure 7.9 Domestic content of imports: % of total intermediate imports, 2009
Intermediate imports often embody a country's own (returned) domestic value added
7.27 Imports can also contain “returned” value added that originated in the importing country. The preliminary, and one should stress conservative, estimates show that in the U.S., for example, nearly 5 per cent of the total value of imported intermediate goods reflects U.S. value added (Figure 7.9) and in China the equivalent shares are close to 7 per cent. For electronic goods, Chinese intermediate imports contain over 12 per cent of “returned” Chinese domestic value added, and intermediate imports of the Republic of Korea contain close to 5 per cent of "returned" domestic value added of the Republic of Korea.
What you see is not what you get: Trade patterns change
7.28 Bilateral trade balance positions can change significantly when measured in value added terms,
although the total trade balance is unaffected. China's bilateral trade surplus with the U.S. was over USD 40 billion (25%) smaller in value added terms in 2009 for example (and 30% smaller in 2005). This partly reflects the higher share of U.S. value added imports in Chinese final demand but also the fact that a significant share (one-third) of China's exports reflect foreign content which is the result of the “Factory Asia” phenomenon. The data illustrates that significant exports of value added from the Republic of Korea and Japan pass through China on their way to final consumers, resulting in significantly smaller Chinese trade deficits with these countries but also typically higher Japanese and Korean trade surpluses with other countries. Similarly the database shows that the Republic of Korea's significant trade deficit with Japan in gross terms almost disappears when measured in value added terms.
Figure 7.10 Difference between China’s value added and gross trade balances, USD billion, 2009
0
2
4
6
8
Norway Australia Netherlands Canada France Russia UnitedKingdom
Japan Republic ofKorea
Germany UnitedStates
China
-60
-40
-20
0
20
40
60
Republic ofKorea
Japan Germany Australia India Italy France Canada UnitedKingdom
United States
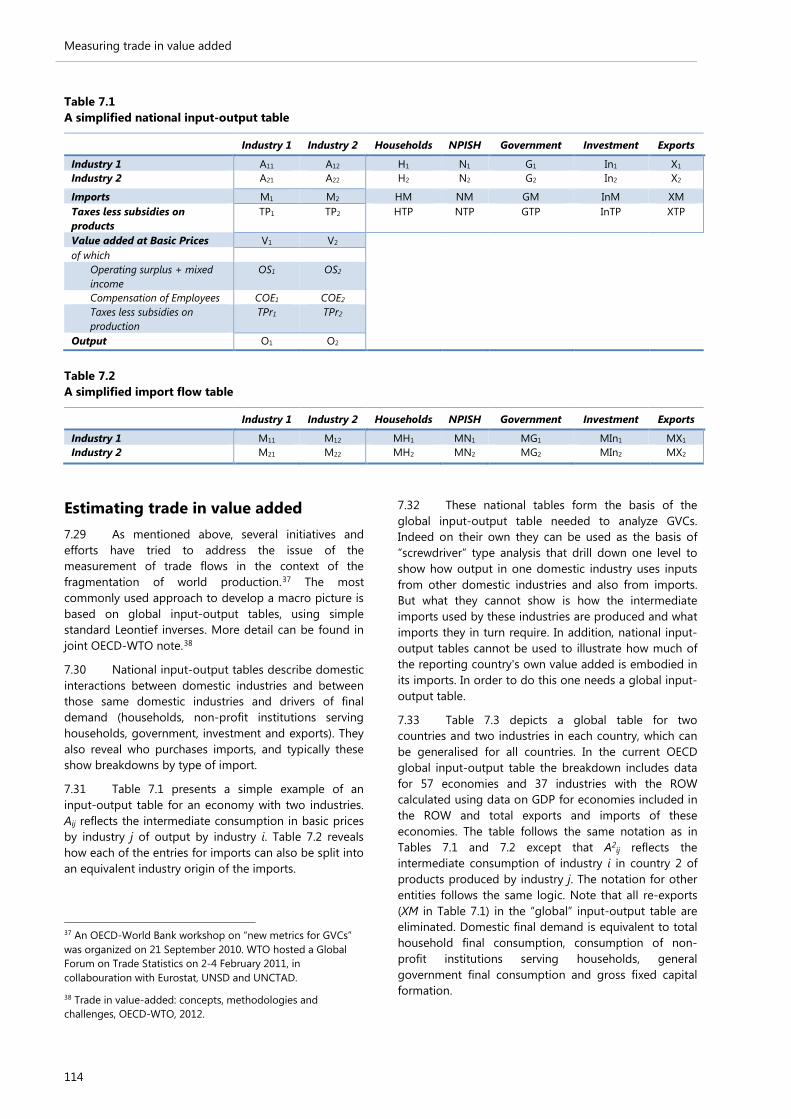
Measuring trade in value added
114
Table 7.1 A simplified national input-output table
Industry 1 Industry 2 Households NPISH Government Investment Exports
Industry 1 A11 A12 H1 N1 G1 In1 X1 Industry 2 A21 A22 H2 N2 G2 In2 X2
Imports M1 M2 HM NM GM InM XM Taxes less subsidies on products
TP1 TP2 HTP NTP GTP InTP XTP
Value added at Basic Prices V1 V2 of which
Operating surplus + mixed income
OS1 OS2
Compensation of Employees COE1 COE2 Taxes less subsidies on production
TPr1 TPr2
Output O1 O2
Table 7.2 A simplified import flow table
Industry 1 Industry 2 Households NPISH Government Investment Exports
Industry 1 M11 M12 MH1 MN1 MG1 MIn1 MX1 Industry 2 M21 M22 MH2 MN2 MG2 MIn2 MX2
Estimating trade in value added 7.29 As mentioned above, several initiatives and efforts have tried to address the issue of the measurement of trade flows in the context of the fragmentation of world production.37 The most commonly used approach to develop a macro picture is based on global input-output tables, using simple standard Leontief inverses. More detail can be found in joint OECD-WTO note.38
7.30 National input-output tables describe domestic interactions between domestic industries and between those same domestic industries and drivers of final demand (households, non-profit institutions serving households, government, investment and exports). They also reveal who purchases imports, and typically these show breakdowns by type of import.
7.31 Table 7.1 presents a simple example of an input-output table for an economy with two industries. Aij reflects the intermediate consumption in basic prices by industry j of output by industry i. Table 7.2 reveals how each of the entries for imports can also be split into an equivalent industry origin of the imports.
37 An OECD-World Bank workshop on “new metrics for GVCs” was organized on 21 September 2010. WTO hosted a Global Forum on Trade Statistics on 2-4 February 2011, in collabouration with Eurostat, UNSD and UNCTAD.
38 Trade in value-added: concepts, methodologies and challenges, OECD-WTO, 2012.
7.32 These national tables form the basis of the global input-output table needed to analyze GVCs. Indeed on their own they can be used as the basis of “screwdriver” type analysis that drill down one level to show how output in one domestic industry uses inputs from other domestic industries and also from imports. But what they cannot show is how the intermediate imports used by these industries are produced and what imports they in turn require. In addition, national input-output tables cannot be used to illustrate how much of the reporting country's own value added is embodied in its imports. In order to do this one needs a global input-output table.
7.33 Table 7.3 depicts a global table for two countries and two industries in each country, which can be generalised for all countries. In the current OECD global input-output table the breakdown includes data for 57 economies and 37 industries with the ROW calculated using data on GDP for economies included in the ROW and total exports and imports of these economies. The table follows the same notation as in Tables 7.1 and 7.2 except that A2
ij reflects the intermediate consumption of industry i in country 2 of products produced by industry j. The notation for other entities follows the same logic. Note that all re-exports (XM in Table 7.1) in the “global” input-output table are eliminated. Domestic final demand is equivalent to total household final consumption, consumption of non-profit institutions serving households, general government final consumption and gross fixed capital formation.
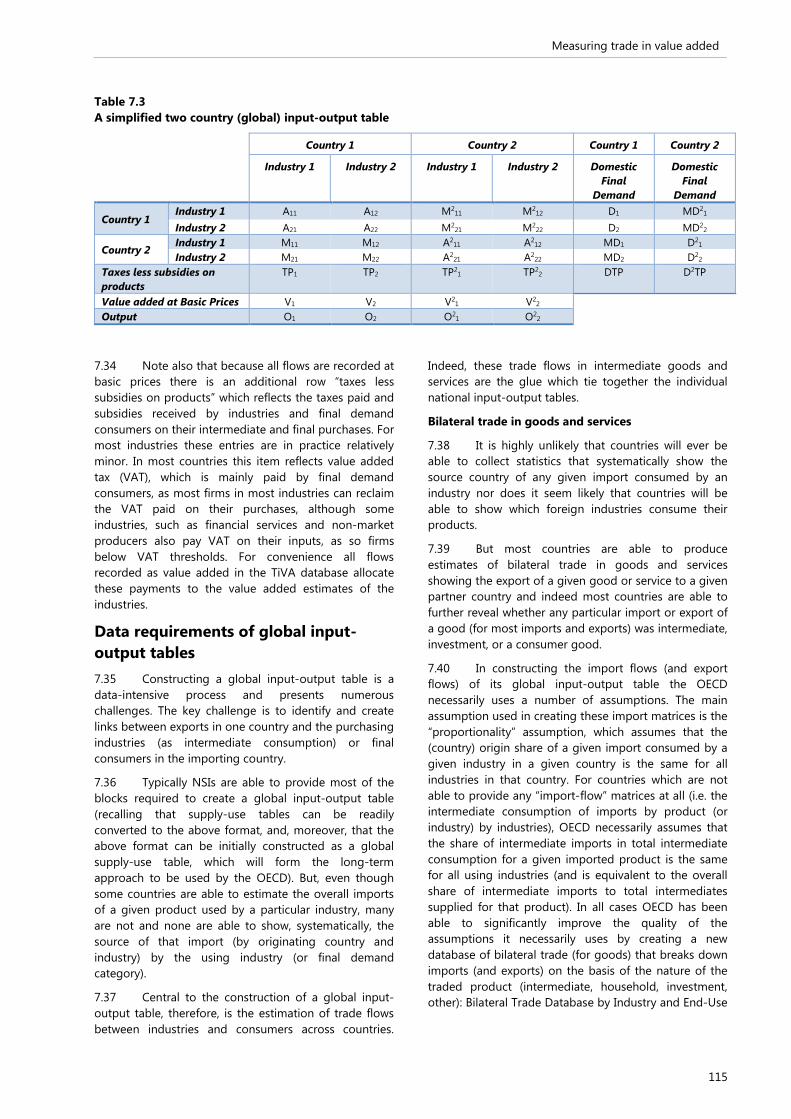
Measuring trade in value added
115
Table 7.3 A simplified two country (global) input-output table
Country 1 Country 2 Country 1 Country 2 Industry 1 Industry 2 Industry 1 Industry 2 Domestic
Final Demand
Domestic Final
Demand
Country 1 Industry 1 A11 A12 M2
11 M212 D1 MD2
1 Industry 2 A21 A22 M2
21 M222 D2 MD2
2
Country 2 Industry 1 M11 M12 A2
11 A212 MD1 D2
1 Industry 2 M21 M22 A2
21 A222 MD2 D2
2 Taxes less subsidies on products
TP1 TP2 TP21 TP2
2 DTP D2TP
Value added at Basic Prices V1 V2 V21 V2
2 Output O1 O2 O2
1 O22
7.34 Note also that because all flows are recorded at basic prices there is an additional row “taxes less subsidies on products” which reflects the taxes paid and subsidies received by industries and final demand consumers on their intermediate and final purchases. For most industries these entries are in practice relatively minor. In most countries this item reflects value added tax (VAT), which is mainly paid by final demand consumers, as most firms in most industries can reclaim the VAT paid on their purchases, although some industries, such as financial services and non-market producers also pay VAT on their inputs, as so firms below VAT thresholds. For convenience all flows recorded as value added in the TiVA database allocate these payments to the value added estimates of the industries.
Data requirements of global input-output tables 7.35 Constructing a global input-output table is a data-intensive process and presents numerous challenges. The key challenge is to identify and create links between exports in one country and the purchasing industries (as intermediate consumption) or final consumers in the importing country.
7.36 Typically NSIs are able to provide most of the blocks required to create a global input-output table (recalling that supply-use tables can be readily converted to the above format, and, moreover, that the above format can be initially constructed as a global supply-use table, which will form the long-term approach to be used by the OECD). But, even though some countries are able to estimate the overall imports of a given product used by a particular industry, many are not and none are able to show, systematically, the source of that import (by originating country and industry) by the using industry (or final demand category).
7.37 Central to the construction of a global input-output table, therefore, is the estimation of trade flows between industries and consumers across countries.
Indeed, these trade flows in intermediate goods and services are the glue which tie together the individual national input-output tables.
Bilateral trade in goods and services
7.38 It is highly unlikely that countries will ever be able to collect statistics that systematically show the source country of any given import consumed by an industry nor does it seem likely that countries will be able to show which foreign industries consume their products.
7.39 But most countries are able to produce estimates of bilateral trade in goods and services showing the export of a given good or service to a given partner country and indeed most countries are able to further reveal whether any particular import or export of a good (for most imports and exports) was intermediate, investment, or a consumer good.
7.40 In constructing the import flows (and export flows) of its global input-output table the OECD necessarily uses a number of assumptions. The main assumption used in creating these import matrices is the “proportionality” assumption, which assumes that the (country) origin share of a given import consumed by a given industry in a given country is the same for all industries in that country. For countries which are not able to provide any “import-flow” matrices at all (i.e. the intermediate consumption of imports by product (or industry) by industries), OECD necessarily assumes that the share of intermediate imports in total intermediate consumption for a given imported product is the same for all using industries (and is equivalent to the overall share of intermediate imports to total intermediates supplied for that product). In all cases OECD has been able to significantly improve the quality of the assumptions it necessarily uses by creating a new database of bilateral trade (for goods) that breaks down imports (and exports) on the basis of the nature of the traded product (intermediate, household, investment, other): Bilateral Trade Database by Industry and End-Use

Measuring trade in value added
116
Category39, derived from the United Nations Statistics Division’s (UNSD) COMTRADE database (a repository of official trade statistics and relevant analytical tables), where values and quantities of imports and exports are compiled according to product classifications and by partner.
7.41 COMTRADE data are classified by declaring country (i.e. the country supplying the information), by partner country (i.e. origin of imports and destination of exports), and by product (i.e. according to Harmonized System (HS)). Trade flows are stored according to the product classification used by the declaring country at the time of data collection. In general, source data are held according to Standard International Trade Classification (SITC) Rev. 2 for the time period 1978-1987, the Harmonized System (1988) for 1988-1995, HS Rev. 1 (1996) for 1996-2001, HS Rev. 2 (2002) for 2002-2006 and HS Rev.3 (2007) from 2007 onwards.
7.42 To generate estimates of trade in goods by industry and by end-use category, 6-digit product codes from each version of HS from COMTRADE are assigned to a unique International Standard Industrial Classification of All Economic Activities Revision 3 (ISIC Rev.3) industry and a unique end-use category and hence the System of National Accounts (SNA) basic classes of goods, (see Table 7.4).
7.43 Notwithstanding the known problems relating to the asymmetries that exist within bilateral trade statistics (i.e. global exports do not equal global imports) these bilateral statistics form the basis for populating the international flows shown in the tables above.
7.44 But only very few countries have a consistency between bilateral trade flows (imports and exports) by partner country and the corresponding flows shown in their supply-use table (the basis for the creation of national input-output tables), reflecting the fact that, for goods at least, bilateral trade flows follow merchandise trade accounting standards.
7.45 As such there are a number of recommendations that follow to improve the data conditions for compiling world input-output tables:
a) Preferably the national input-output tables are compiled following similar computational assumptions.
b) The various forms of global production as introduced in Chapter 2 should be recorded properly, following the recommendations in the various other chapters in this Guide.
c) Countries should produce import flow matrices as a standard part of their supply-use tables.
d) Producing bilateral trade flows that are consistent with underlying supply-use tables should form a
39 For more details, see www.oecd.org/sti/btd
high priority of national statistical offices in this regard.
e) Confidential trade: In some countries disclosure rules suppress 6-digit HS components in COMTRADE and also higher 2-digit HS chapter levels. This should be avoided where possible with other forms of preserving confidentiality adopted, such as suppressing another 6-digit category.
f) Re-exports: Adjustments are required for re-exports which are significant for major continental trading hubs. Sufficient data are available in order to adjust for reported trade between China and the ROW via Hong Kong, but not currently for other major hubs such as Belgium, Netherlands and Singapore.
g) Identifying used/second-hand capital goods: HS codes and reported trade in COMTRADE cannot differentiate between new and old capital goods (such as second-hand aircraft and ships). Estimating international trade in these flows in a value added context requires an elaboration of the input-output framework that allows these flows to be recorded in a way that aligns with total global value added produced in a given period.
h) Unidentified scrap and waste: Certain types of waste and scrap do not have separate 6-digit HS codes – e.g. personal computers and other electrical equipment exported (often to developing countries) for recycling.
i) Moreover, for services, countries are encouraged to provide more detail on partner countries and also to on the type of products (following Extended Balance of Payments Services Classification (EBOPS) 2012).
j) Last but not least, greater efforts are needed to reconcile asymmetries in international trade flows.
Input-output related accounting issues 7.46 This chapter is not designed to be part of a handbook on input-output or supply-use tables. It mainly shows the policy relevance of trade in value added indicators, and related to this, the need of good quality and harmonized national accounts and trade statistics. As explained these statistics of individual countries are integrated in a global input-output table. This section explains how various forms of global production, as elsewhere discussed in this Guide are, or should preferably be, represented in (global) input-output tables.
Reconciling input-output tables and international trade statistics
7.47 The recording of international trade flows on the basis of changes in economic ownership is expected
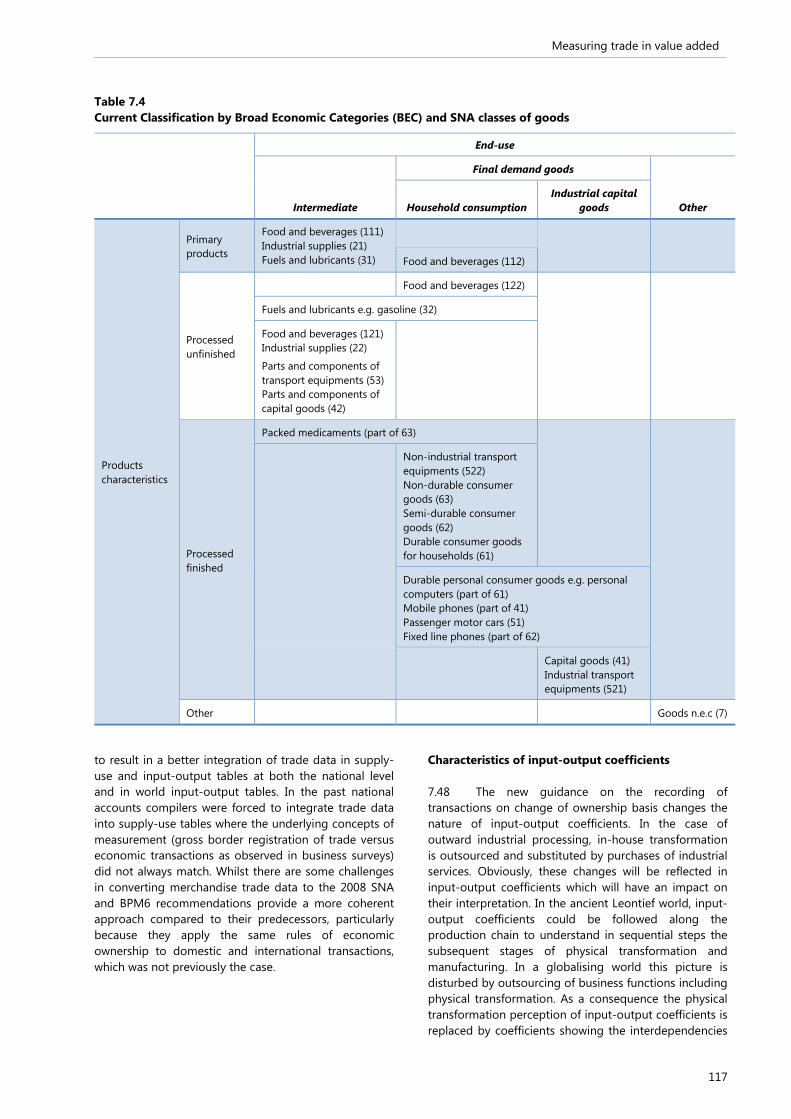
Measuring trade in value added
117
Table 7.4 Current Classification by Broad Economic Categories (BEC) and SNA classes of goods
End-use
Intermediate
Final demand goods
Other Household consumption Industrial capital
goods
Products characteristics
Primary products
Food and beverages (111) Industrial supplies (21) Fuels and lubricants (31)
Food and beverages (112)
Processed unfinished
Food and beverages (122)
Fuels and lubricants e.g. gasoline (32)
Food and beverages (121) Industrial supplies (22)
Parts and components of transport equipments (53) Parts and components of capital goods (42)
Processed finished
Packed medicaments (part of 63)
Non-industrial transport equipments (522) Non-durable consumer goods (63) Semi-durable consumer goods (62) Durable consumer goods for households (61)
Durable personal consumer goods e.g. personal computers (part of 61) Mobile phones (part of 41) Passenger motor cars (51) Fixed line phones (part of 62)
Capital goods (41) Industrial transport equipments (521)
Other Goods n.e.c (7)
to result in a better integration of trade data in supply-use and input-output tables at both the national level and in world input-output tables. In the past national accounts compilers were forced to integrate trade data into supply-use tables where the underlying concepts of measurement (gross border registration of trade versus economic transactions as observed in business surveys) did not always match. Whilst there are some challenges in converting merchandise trade data to the 2008 SNA and BPM6 recommendations provide a more coherent approach compared to their predecessors, particularly because they apply the same rules of economic ownership to domestic and international transactions, which was not previously the case.
Characteristics of input-output coefficients
7.48 The new guidance on the recording of transactions on change of ownership basis changes the nature of input-output coefficients. In the case of outward industrial processing, in-house transformation is outsourced and substituted by purchases of industrial services. Obviously, these changes will be reflected in input-output coefficients which will have an impact on their interpretation. In the ancient Leontief world, input-output coefficients could be followed along the production chain to understand in sequential steps the subsequent stages of physical transformation and manufacturing. In a globalising world this picture is disturbed by outsourcing of business functions including physical transformation. As a consequence the physical transformation perception of input-output coefficients is replaced by coefficients showing the interdependencies
Measuring trade in value added
118
of various companies in global production chains in terms of the business functions they carry out inside the chain.
7.49 Chapter 5 of the Globalization Guide explains that input-output coefficients may change considerably as a result of ongoing globalization, for example when businesses decide to rearrange their global production chains, or decide to outsource particular business functions. This reflects an economic reality but that is not to say that it cannot be measured and illustrated in a meaningful way. Growing globalization, driven by global production, has changed the way that firms conduct their activities and it is important that these phenomena are understood and, most importantly, measured. Responding to this requires a new approach to the way national supply-use and input-output tables are produced. In a nutshell it requires that national statistics build in this global dimension from the outset by developing aggregations not only on the basis of their industrial classification, but also on the basis of their business function, for example by showing sub-groupings of processors, factoryless producers, foreign owned firms etc separately. Doing so would allow countries to construct supply-use tables, broken down by these new groupings, that would have a higher degree of homogeneity, certainly compared to aggregations which focus only the industrial classification of firms, where, and as this Guide illustrates, there exists considerable heterogeneity.
Factoryless goods producers
7.50 The recommendations in this Guide to classify factoryless goods producers (FGP) as (a special case of) manufacturers instead of traders is also beneficial from an input-output analysis perspective, as this better reflects the global production chain within which the firms are involved whereas as traders they were basically unlinked. In such a way they are better able to reflect their role within manufacturing as providers and producers of the underlying intellectual property product (IPP), which increasingly forms the major content of manufactured goods. Again, the case of FGPs shows that the input-output analysis of global production is partly about physical transformation but more and more related to the intangible aspects of production. This observation is in line with the previous results on TiVA identifying the direct and indirect significance of services in global production chains.
Intellectual Property Products
7.51 A broader issue concerning IPPs, however, and covered in Chapter 3 of this Guide, concerns the coverage of flows related to the use of IPPs between affiliated enterprises, where the economic owner may be hard to establish. As described in Chapter 3, a strict interpretation of the rules on economic ownership will often indicate that some flows that are currently recorded as property income flows should instead be recorded as payments for services. These issues have
fairly trivial consequences for supply-use tables and are not further elaborated here.
Goods for processing and merchanting
7.52 The implications of the 2008 SNA and BPM6 changes on the treatment of goods for processing and merchanting were fully described in the Globalization Guide and so are not considered further here.
Beyond TiVA 7.53 Looking at trade in value added terms provides a valuable insight into broader notions of competitiveness (in addition to providing insights into trade policies) by illustrating inter-linkages between countries and also by illustrating those activities (or tasks) that generate the most value.
7.54 But additional indicators and insights can be gained by considering extensions to the accounting framework.
Trade in Jobs
7.55 One immediate area relates to jobs. This requires consistent estimates of employment measures (employment, employers, actual hours worked) with the underlying value added estimates produced by NSIs in their supply-use tables.
7.56 Countries have already begun to make improvements in this area, driven by a need to produce coherent productivity estimates (by industry), and it is hoped highlighting the important insights that can be gained by looking at trade in jobs will reinforce and support these national initiatives aimed at improving coherence. Going a step further, particularly because international fragmentation has meant industries across countries are less comparable than they used to be (as countries specialise in those stages of the underlying activity where they have comparative advantage) it is increasingly becoming necessary to link jobs statistics to skills statistics.
Trade in Income
7.57 The difficulties raised by the recording of payments related to the use of IPPs in the national accounts, international trade statistics and balance of payments highlight the importance of beginning to think about broader accounting frameworks that can adequately capture who really benefits from trade.
7.58 But this is not merely a measurement issue related to the quality of statistics on international trade in IPPs. Consider for example an affiliate enterprise, recognized as the economic owner of an IPP that it uses to produce goods it sells. The affiliate's value added would reflect in part the return on this underlying asset, realized as profits. These profits would subsequently be recorded as reinvested earnings whether or not any actual flows occur between the parent and its affiliate. Ultimately, therefore, it is the parent (often the entity that finances the underlying IPP) that benefits from the
Measuring trade in value added
119
use of the IPP. In cases where these flows are incorrectly recorded as primary income flows and not payments (by the affiliate) of an IPP owned by the parent, the situation is the same. It is the parent that benefits from the flow of trade but an analysis of trade in value added terms cannot reveal this.
7.59 But the flows merely illustrate a wider issue. Such interpretations extend beyond looking only at the conventional set of assets recognised as such in the SNA. Other knowledge-based assets, such as brands and organizational capital can also increase an affiliate's value added and even though these assets are not recognised in the SNA the profits recorded by the affiliate compensate for their use, and which is manifested as reinvested earnings flows in the accounts. But these flows are typically not available on a bilateral partner country basis let alone partner country-industry basis; which is what is needed for analysis of trade in income in an analogous way to trade in value added.
7.60 Recording these flows is, therefore, crucial. Part of the solution lies in producing supply-use tables (or indicators) that capture foreign ownership. Clearly it is unlikely to be feasible to produce supply-use tables that capture foreign ownership by (the affiliate's owner's) country. But a separate breakdown of activities in a supply-use table that differentiates between foreign and domestic owned firms can be done.
7.61 By supplementing this with bilateral trade in primary income (from whom-to-whom) statistics (broken down by type of income (in particular reinvested earning and interest) it should be possible to create extensions to the trade in value added accounting framework by treating the primary income flows (and components) as if they were services produced by artificial industries in the host country of the parent company.
7.62 Some of the tools to do this already exist. Foreign affiliate trade statistics can be combined for example with information in supply-use tables that shows breakdowns based on ownership. And there is also scope to link this further to balance of payments data flows. The OECD created an Expert Group on Extended Supply-Use tables in 2014 to assess the feasibility of developing a more detailed accounting framework and set of recommendations in this area.
7.63 The main focus of the Group is to tackle two important areas, the first relates to the challenge of better addressing heterogeneity, described above. The second, addresses the challenge of extending the accounting framework of conventional supply-use tables such that they meet and respond to growing needs in a
number of policy areas, chiefly those described above but also potentially many others, such as those related to the integration of small and medium-sized enterprises in GVCs and the spill-over effects of FDI, both to upstream and downstream industries.
7.64 But these are not the only areas that could benefit from extended supply use tables. At present the national accounts, foreign affiliate statistics, and trade by enterprise characteristics data are derived as relatively autonomous products that are not necessarily coherent with each other. This can cause confusion. An overarching framework that brings these datasets together should improve the quality of all of the respective statistical outputs.
7.65 Additional, albeit more stretching, extensions could be considered that respond to many other policy relevant questions, for example, the inclusion of information on taxes paid by firms (particularly foreign owned affiliates) would provide important insights into Base Erosion and Profit Shifting (BEPS), as would directly collected estimates of emissions by industries to provide a coherent mechanism for the calculation of carbon footprints (described below).
7.66 The extended framework for supply-use tables being considered by the Expert Group is summarily developed in Tables 7.5 and 7.6 (note that some countries in the Expert Group are also developing splits of domestic firms into two separate categories, those that have affiliates abroad and those that do not). The proposal can be summarised as follows – a breakdown of current industry classifications (2-digit ISIC) into new sub-categories that aggregate firms on the basis of (a) ownership, (b) export intensity and (c) size. Further breakdowns to be explored could include import intensities. Similar breakdowns will also be required for the product (rows) of the supply-use tables, which is non-trivial.
7.67 Naturally, the more detailed the breakdown the greater the likelihood that confidentiality constraints will be breached, so a key objective of the Expert Group will be to investigate an optimal level of disaggregation for most countries that satisfies confidentiality constraints, together with operational guidelines on the prioritisation of different attributes. For example, while size class dimensions are particularly important to understand how small and medium enterprises integrate (indirectly) within GVCs, it seems more likely than not that for most countries such information will be too demanding, particularly as information on the intermediate consumption of the output of small firms by large firms will not be typically available beyond specialised surveys.

Measuring trade in value added
120
Table 7.5 Supply Table
Imports FOB
Domestic Foreign Domestic Foreign
of which
Expo
rter
Non
-exp
orte
r
Expo
rter
Non
-exp
orte
r
Expo
rter
Non
-exp
orte
r
Expo
rter
Non
-exp
orte
r
Size Size Size Size Margin Import duties
Total supply
Domestic Exporter
Size
Resi
dent
s ex
pend
iture
ab
road
By m
argi
n in
dust
ry:
who
lesa
le, r
etai
l, tr
ansp
ort e
tc.
By im
port
ing
unit
char
acte
ristic
Taxe
s an
d su
bsid
ies
on
prod
ucts
Non-exporter
Foreign Exporter
Size Non-exporter
Table 7.6 Use Table
Domestic Foreign Exports
Expo
rter
Non
-exp
orte
r
Expo
rter
Non
-exp
orte
r
Dom
estic
Fore
ign
of which
Size Size HHFC + NPISH
GGFC GFCF Inventories Size
Domestic Exporter
Size
USE – broken down by domestic and imports
non-
resi
dent
s ex
pend
iture
mer
chan
ting Non-
exporter
Foreign Exporter
Size Non-exporter
Value added
of which
C of E GOS
Output
Property income payments to abroad
of which
Interest Distributed income of corporations Reinvested earnings on FDI Investment income disbursement
Property income receipts from abroad
of which
Interest Distributed income of corporations Reinvested earnings on FDI Investment income disbursement
Current taxes on income, wealth etc.
Employment
Hours worked
Emissions
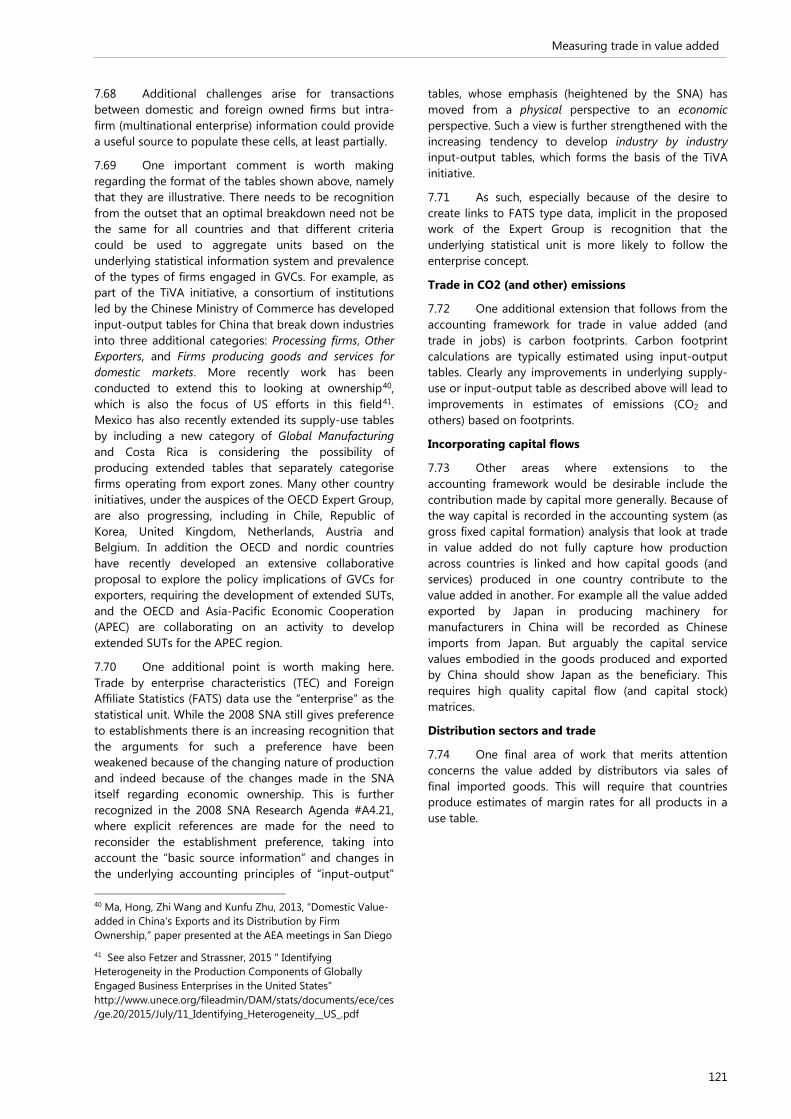
Measuring trade in value added
121
7.68 Additional challenges arise for transactions between domestic and foreign owned firms but intra-firm (multinational enterprise) information could provide a useful source to populate these cells, at least partially.
7.69 One important comment is worth making regarding the format of the tables shown above, namely that they are illustrative. There needs to be recognition from the outset that an optimal breakdown need not be the same for all countries and that different criteria could be used to aggregate units based on the underlying statistical information system and prevalence of the types of firms engaged in GVCs. For example, as part of the TiVA initiative, a consortium of institutions led by the Chinese Ministry of Commerce has developed input-output tables for China that break down industries into three additional categories: Processing firms, Other Exporters, and Firms producing goods and services for domestic markets. More recently work has been conducted to extend this to looking at ownership40, which is also the focus of US efforts in this field41. Mexico has also recently extended its supply-use tables by including a new category of Global Manufacturing and Costa Rica is considering the possibility of producing extended tables that separately categorise firms operating from export zones. Many other country initiatives, under the auspices of the OECD Expert Group, are also progressing, including in Chile, Republic of Korea, United Kingdom, Netherlands, Austria and Belgium. In addition the OECD and nordic countries have recently developed an extensive collaborative proposal to explore the policy implications of GVCs for exporters, requiring the development of extended SUTs, and the OECD and Asia-Pacific Economic Cooperation (APEC) are collaborating on an activity to develop extended SUTs for the APEC region.
7.70 One additional point is worth making here. Trade by enterprise characteristics (TEC) and Foreign Affiliate Statistics (FATS) data use the “enterprise” as the statistical unit. While the 2008 SNA still gives preference to establishments there is an increasing recognition that the arguments for such a preference have been weakened because of the changing nature of production and indeed because of the changes made in the SNA itself regarding economic ownership. This is further recognized in the 2008 SNA Research Agenda #A4.21, where explicit references are made for the need to reconsider the establishment preference, taking into account the “basic source information” and changes in the underlying accounting principles of “input-output” 40 Ma, Hong, Zhi Wang and Kunfu Zhu, 2013, “Domestic Value-added in China's Exports and its Distribution by Firm Ownership,” paper presented at the AEA meetings in San Diego
41 See also Fetzer and Strassner, 2015 " Identifying Heterogeneity in the Production Components of Globally Engaged Business Enterprises in the United States" http://www.unece.org/fileadmin/DAM/stats/documents/ece/ces/ge.20/2015/July/11_Identifying_Heterogeneity__US_.pdf
tables, whose emphasis (heightened by the SNA) has moved from a physical perspective to an economic perspective. Such a view is further strengthened with the increasing tendency to develop industry by industry input-output tables, which forms the basis of the TiVA initiative.
7.71 As such, especially because of the desire to create links to FATS type data, implicit in the proposed work of the Expert Group is recognition that the underlying statistical unit is more likely to follow the enterprise concept.
Trade in CO2 (and other) emissions
7.72 One additional extension that follows from the accounting framework for trade in value added (and trade in jobs) is carbon footprints. Carbon footprint calculations are typically estimated using input-output tables. Clearly any improvements in underlying supply-use or input-output table as described above will lead to improvements in estimates of emissions (CO2 and others) based on footprints.
Incorporating capital flows
7.73 Other areas where extensions to the accounting framework would be desirable include the contribution made by capital more generally. Because of the way capital is recorded in the accounting system (as gross fixed capital formation) analysis that look at trade in value added do not fully capture how production across countries is linked and how capital goods (and services) produced in one country contribute to the value added in another. For example all the value added exported by Japan in producing machinery for manufacturers in China will be recorded as Chinese imports from Japan. But arguably the capital service values embodied in the goods produced and exported by China should show Japan as the beneficiary. This requires high quality capital flow (and capital stock) matrices.
Distribution sectors and trade
7.74 One final area of work that merits attention concerns the value added by distributors via sales of final imported goods. This will require that countries produce estimates of margin rates for all products in a use table.

122

Multiterritory enterprises
123
Chapter 8 Multiterritory enterprises Introduction 8.1 The activities of multiterritory enterprises provide measurement challenges to national statistics compilers. Multiterritory enterprises operate their activities on a temporary or permanent basis in more than one economic territory. In the Balance of Payment and International Investment Position Manual, sixth edition (BPM6) (4.41) these enterprises are described as follows:
“Some enterprises may operate as a seamless operation over more than one economic territory. Although the enterprise has substantial activity in more than one economic territory, it is run as an indivisible operation with no separate accounts or decisions, so that no separate branches can be identified. Such enterprises may have operations including shipping lines, airlines, hydroelectric schemes on border rivers, pipelines, bridges, tunnels and undersea cables. Some NPISHs also may operate in this way.”
8.2 Multiterritory enterprises are well-described in the System of National Accounts 2008 (2008 SNA) and BPM6. However, their appearance does not match well with the model of national accounts. National accounting requires that all economic activities, including those of multiterritory enterprises, are properly assigned to individual and clearly defined economic territories.
8.3 Allocating economic output to individual economic territories is often quite challenging. Several measurement issues related to methods used and to data availability have to be addressed. Splitting the economic activities of multiterritory enterprises by country on the basis of “prorating” or the creation of “notional units” is recommended in the 2008 SNA (26.35) and BPM6 (4.43) in case separate branches with accounts or decisions are impossible to identify. The creation of notional units may give rise to imputations of cross border economic transactions, which may be difficult to account for in practice. As some of the examples in the chapter show, there are few alternatives to implementing notional units, given the need to follow the SNA/BPM framework.
8.4 This chapter reviews the concepts and principles of multiterritory enterprises as discussed in the 2008 SNA and BPM6. In addition, it discusses the difficulties and measurement problems related to applying methods and obtaining the required data.
These challenges are exemplified by several case studies presented in the chapter. Finally, the chapter will give some recommendations on the way forward.
8.5 Some examples discussed below pertain to situations where BPM6 recommends identifying notional units (i.e. branches) because significant economic activity is undertaken by a non-resident enterprise that has not created a separate local legal unit (such as long-term construction projects) or where a non-resident acquires ownership of land, buildings or other immovable structures. Although these activities may not meet every element of the BPM6 definition of a multiterritory enterprise, they are nonetheless described in this chapter for completeness.
Conceptual background Institutional units
8.6 National accounts map the economy of a nation. A fundamental question to be answered in building the accounts is how to define the economy of one particular nation and to delimit it consistently from the economy of other nations. The point of departure is a universe of economic units (institutional units) and mainly geographically determined economic territories. The connection of units to a particular economic territory is determined by criteria such as physical presence and being subject to the jurisdiction of the government of the territory under observation. The most commonly used concept of economic territory is the area under the effective economic control of a single government (2008 SNA, 4.10).
8.7 One fundamental rule is that one economic unit can be resident in one and only one economic territory and, thus, resident of only one country. The residents of a country are those units with a centre of predominant economic interest in its territory, meaning those engaged in economic activity in the country’s territory for an extended period (2008 SNA, 4.13). However, in the same paragraph it is stated that exceptions may be made for multiterritory enterprises that operate in a seamless operation over more than one economic territory. If it is not possible to identify a parent or separate branches, it is necessary to prorate the total operations of the enterprise into the individual economic territories.
8.8 The economy of one particular country as defined by the system of national accounts can, thus, be seen as the aggregate of the economy of its resident
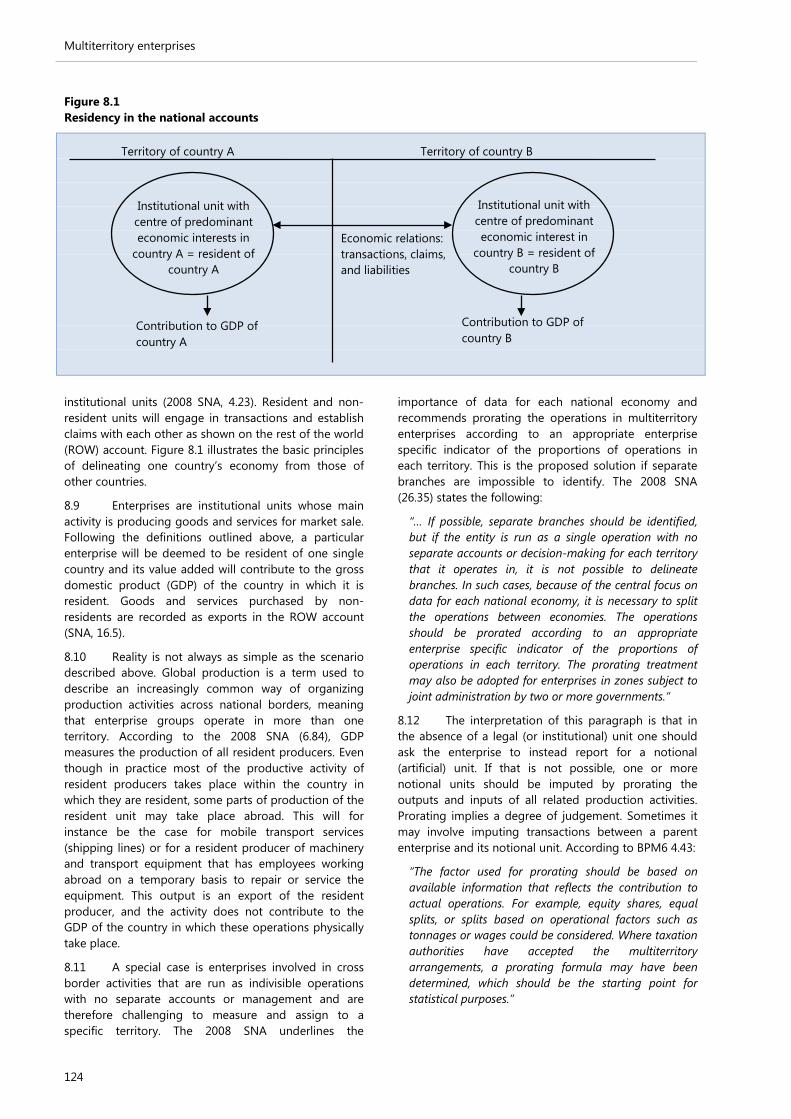
Multiterritory enterprises
124
Figure 8.1 Residency in the national accounts
institutional units (2008 SNA, 4.23). Resident and non-resident units will engage in transactions and establish claims with each other as shown on the rest of the world (ROW) account. Figure 8.1 illustrates the basic principles of delineating one country’s economy from those of other countries.
8.9 Enterprises are institutional units whose main activity is producing goods and services for market sale. Following the definitions outlined above, a particular enterprise will be deemed to be resident of one single country and its value added will contribute to the gross domestic product (GDP) of the country in which it is resident. Goods and services purchased by non-residents are recorded as exports in the ROW account (SNA, 16.5).
8.10 Reality is not always as simple as the scenario described above. Global production is a term used to describe an increasingly common way of organizing production activities across national borders, meaning that enterprise groups operate in more than one territory. According to the 2008 SNA (6.84), GDP measures the production of all resident producers. Even though in practice most of the productive activity of resident producers takes place within the country in which they are resident, some parts of production of the resident unit may take place abroad. This will for instance be the case for mobile transport services (shipping lines) or for a resident producer of machinery and transport equipment that has employees working abroad on a temporary basis to repair or service the equipment. This output is an export of the resident producer, and the activity does not contribute to the GDP of the country in which these operations physically take place.
8.11 A special case is enterprises involved in cross border activities that are run as indivisible operations with no separate accounts or management and are therefore challenging to measure and assign to a specific territory. The 2008 SNA underlines the
importance of data for each national economy and recommends prorating the operations in multiterritory enterprises according to an appropriate enterprise specific indicator of the proportions of operations in each territory. This is the proposed solution if separate branches are impossible to identify. The 2008 SNA (26.35) states the following:
“… If possible, separate branches should be identified, but if the entity is run as a single operation with no separate accounts or decision-making for each territory that it operates in, it is not possible to delineate branches. In such cases, because of the central focus on data for each national economy, it is necessary to split the operations between economies. The operations should be prorated according to an appropriate enterprise specific indicator of the proportions of operations in each territory. The prorating treatment may also be adopted for enterprises in zones subject to joint administration by two or more governments.”
8.12 The interpretation of this paragraph is that in the absence of a legal (or institutional) unit one should ask the enterprise to instead report for a notional (artificial) unit. If that is not possible, one or more notional units should be imputed by prorating the outputs and inputs of all related production activities. Prorating implies a degree of judgement. Sometimes it may involve imputing transactions between a parent enterprise and its notional unit. According to BPM6 4.43:
“The factor used for prorating should be based on available information that reflects the contribution to actual operations. For example, equity shares, equal splits, or splits based on operational factors such as tonnages or wages could be considered. Where taxation authorities have accepted the multiterritory arrangements, a prorating formula may have been determined, which should be the starting point for statistical purposes.”
Territory of country A Territory of country B
Institutional unit with centre of predominant economic interests in
country A = resident of country A
Institutional unit with centre of predominant economic interest in
country B = resident of country B
Economic relations: transactions, claims, and liabilities
Contribution to GDP of country A
Contribution to GDP of country B

Multiterritory enterprises
125
8.13 It should be noted that creating a notional unit is only done out of necessity and is an exception to the general 2008 SNA/BPM6 rule of not imputing transactions.
Rules for establishing notional units
8.14 According to international recommendations, a non-resident unit that has substantial operations over a significant period in an economic territory but no separate legal entity for those operations should be identified as an institutional unit or branch (BPM6, 4.26). This unit is identified for statistical purposes, because the operations have a strong connection to the location of operations in all ways other than incorporation. However, the identification of branches as institutional units requires indications that substantial operations can be separated from the rest of the entity.
8.15 To be identified as a branch requires either that a complete set of accounts, including a balance sheet, exists for the branch, or that it is possible and meaningful, from both an economic and legal viewpoint, to compile these accounts if they were to be required (BPM6, 4.27 and 2008 SNA, 26.30). In addition, in general, the branch should undertake production on a significant scale in a territory outside that of its head office for a significant period. Sometimes for statistical purposes this criterion is interpreted to mean for one year or more. Indicators that could confirm the location include purchasing or renting business premises, acquiring capital equipment and recruiting local staff. Another indication is whether the branch is recognized as being subject to the income tax system of the economy in which it is located even if it may have a tax-exempt status.
8.16 The identification of branches has implications for the statistical reporting of both the parent and the branch. The operations of the branch should be excluded from the institutional unit of its head office in its home territory, and the delineation of parent and branch should be made consistently in both of the affected economies. Each branch is a direct investment enterprise (BPM6, 4.28).
8.17 To conclude, a notional unit, separate from the institutional unit of its head office, should be established if (BPM6 4.27 and 2008 SNA 26.30):
a) it has substantial production in a territory outside that of its head office;
b) the operations can be separated from the rest of the entity and identified as an institutional unit, i.e. as a branch;
c) it has a complete set of accounts, including a balance sheet, or it is possible and meaningful to compile these accounts if they were to be required.
8.18 As noted in the introduction, institutional units with substantial production in a territory outside that of the head office may not, in some cases, meet in every
aspect the BPM6 definition of a multiterritory enterprise, but they are nonetheless included in the international guidelines. These exceptions include construction projects, production from a base, and land and other natural resources owned by a non-resident.
Case studies 8.19 This section introduces a range of case studies of various kinds of activities undertaken by enterprises operating in more than one territory or using resources owned by more than one economy. The main purpose of these cases is to provide practical guidance obtained from statisticians that have encountered these examples.
8.20 Some of these examples show that practical solutions are not always strictly in line with international standards, for example because a breakdown of economic activities on a territory by territory basis is not very meaningful or simply infeasible.
(i) Affiliates abroad
8.21 In practice, the population of resident enterprises is often determined by the statistical establishment-enterprise register. This is the case in Norway, where the target population receives different statistical surveys designed for compiling national accounts. The starting point for determining the population is obtaining information from various administrative registers covering Norwegian legal units. The basis for data collection of economic variables is the business accounts of the legal units. Normally, these accounts reflect economic activities that should be included in the Norwegian national accounts.
8.22 However, an enterprise resident in Norway often engages in economic relations with other countries through ownership of economic units, for example a subsidiary in the host country. The subsidiary will then normally be a resident of the host country and contribute to the GDP of that country, while the parent company will receive returns in the form of primary income.
8.23 Sometimes the permanent activity abroad is not organized through a separate legal unit of the host country, i.e. a subsidiary, but rather as a direct operation. In Norway, such examples are found within the petroleum extraction industry. The accounts of the parent company will include both balance sheet and profit and loss accounts items that reflect activities carried out abroad on a permanent basis. In Norway, there are examples of companies with limited activities and no domestic employment or reported productive activity that nevertheless include in their accounts activities taking place abroad, and over which they have full ownership.
8.24 These examples are multinationals that do not fit the general description of a multiterritory enterprise, operating as a seamless operation over several territories. When the activity abroad is continued on a
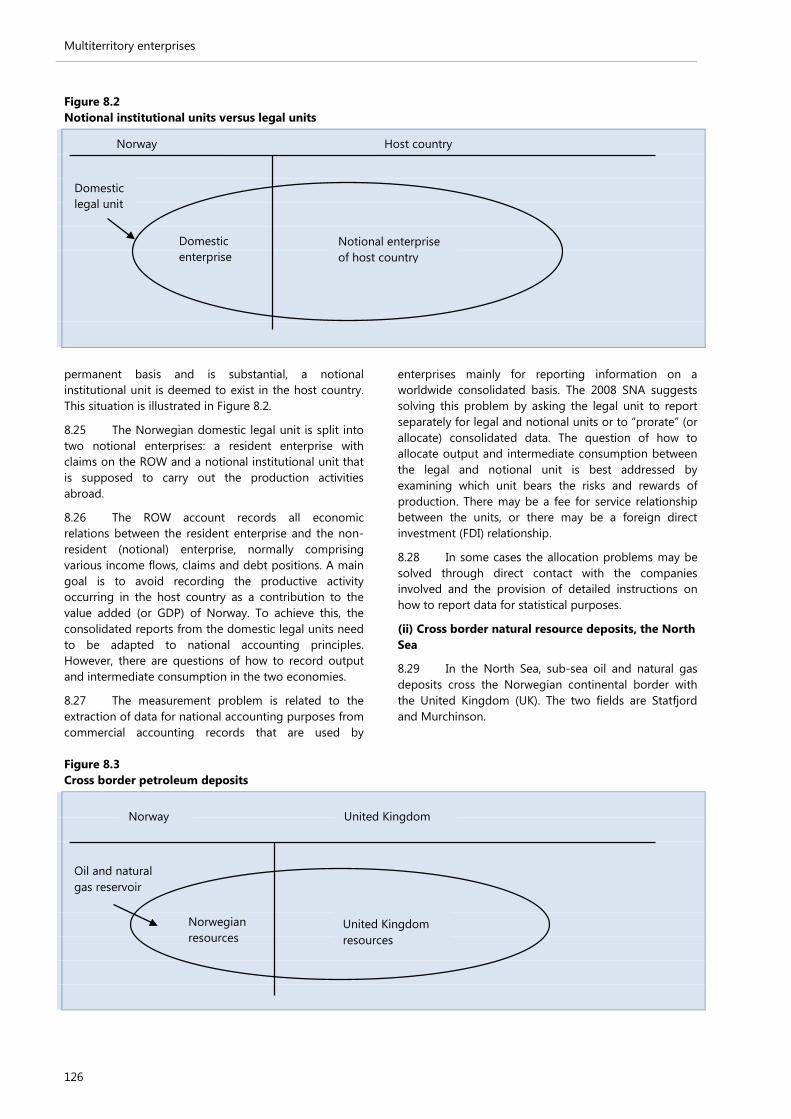
Multiterritory enterprises
126
Figure 8.2 Notional institutional units versus legal units
permanent basis and is substantial, a notional institutional unit is deemed to exist in the host country. This situation is illustrated in Figure 8.2.
8.25 The Norwegian domestic legal unit is split into two notional enterprises: a resident enterprise with claims on the ROW and a notional institutional unit that is supposed to carry out the production activities abroad.
8.26 The ROW account records all economic relations between the resident enterprise and the non-resident (notional) enterprise, normally comprising various income flows, claims and debt positions. A main goal is to avoid recording the productive activity occurring in the host country as a contribution to the value added (or GDP) of Norway. To achieve this, the consolidated reports from the domestic legal units need to be adapted to national accounting principles. However, there are questions of how to record output and intermediate consumption in the two economies.
8.27 The measurement problem is related to the extraction of data for national accounting purposes from commercial accounting records that are used by
enterprises mainly for reporting information on a worldwide consolidated basis. The 2008 SNA suggests solving this problem by asking the legal unit to report separately for legal and notional units or to “prorate” (or allocate) consolidated data. The question of how to allocate output and intermediate consumption between the legal and notional unit is best addressed by examining which unit bears the risks and rewards of production. There may be a fee for service relationship between the units, or there may be a foreign direct investment (FDI) relationship.
8.28 In some cases the allocation problems may be solved through direct contact with the companies involved and the provision of detailed instructions on how to report data for statistical purposes.
(ii) Cross border natural resource deposits, the North Sea
8.29 In the North Sea, sub-sea oil and natural gas deposits cross the Norwegian continental border with the United Kingdom (UK). The two fields are Statfjord and Murchinson.
Figure 8.3 Cross border petroleum deposits
Oil and natural gas reservoir
Norway Host country
Domestic legal unit
Domestic enterprise
Notional enterprise of host country
Norway United Kingdom
Norwegian resources
United Kingdom resources

Multiterritory enterprises
127
8.30 One field is fully operated by Norwegian oil companies, while UK companies operate the other. This means that both the Norwegian and the UK oil companies are running seamless operations over their own and the other country’s economic territory. According to 2008 SNA (4.15) extraction of subsoil resources can only be undertaken by resident institutional units. Hence, in the case of Norway, the operations should be regarded as undertaken by a direct investment enterprise in the UK and Norway’s receipts should be in the form of direct investment income, rather than exports.
8.31 However, all the installations such, as extraction rigs, are placed on the Norwegian territory, although part of the deposit itself crosses over to the British territory and is owned by the UK. In that sense, all economic production activities take place permanently on Norwegian territory and are conducted by units resident in Norway.
8.32 The agreed treatment between Statistics Norway and the UK Office for National Statistics (ONS) for recording those activities in the two countries’ national accounts and balance of payments has been to prorate the operations as recommended in the 2008 SNA and BPM6. Both income and costs are prorated according to the two countries’ ownership shares of the resources. The ownership shares are based on accepted knowledge of the exact physical location of the oil and natural gas deposits.
8.33 For the field operated from Norway, the Norwegian national accounts record as output only the value of the petroleum representing its ownership share to the reservoir. However, 100 per cent of the operating costs for the operation of the field are recorded as costs (intermediate consumption) in the Norwegian national accounts, which leads to underestimating of the Norwegian value added. Therefore an offsetting item is recorded as an income receipt, reflecting a Norwegian produced service rendered to the UK by operating their part of the field and bringing the Norwegian value added up to its correct level, as determined by the ownership share. For the other cross border field, which is operated by UK, a similar accounting procedure is followed in reverse.
8.34 On a practical level, as all activities take place and are organized on Norwegian territory, all statistical information are obtained from Norwegian units only. Seen from the ONS's point of view, recognizing a branch on the British territory would raise some practical problems in collecting detailed data on its activity. On the other hand, the ONS need to know the import of the extraction service. In Norway, the requested information is collected with the help of a joint survey between Statistics Norway and the Norwegian Petrol Directorate (a census of all units involved in oil and gas activities). The information obtained is broken down by oil field.
(iii) Cross border natural resource deposits, the Timor Sea
8.35 This case study is not an example of activities by multiterritory enterprises, but rather a case where the boundary of economic territory is unclear and unsettled. The Timor Sea area is not owned by the Designated Authorities (DA) that administer the Joint Petroleum Development Area (JPDA). Units operating in this area are resident in Australia, in Timor-Leste or in both according to the distribution of resource royalties between the two countries. The primary purpose of the DA is to act as an agent for each government and to channel funds (mainly royalty payments) to the Australian and Timor-Leste governments. For the purposes of economic statistics, the DA is considered to be operating in the JPDA itself and hence its residency should be split 50:50 between Australia and Timor-Leste. The two conceptual entities will then be shown to transact with Australia, Timor-Leste and the ROW according to standard principles.
8.36 The treaty arrangements between Australia and Timor-Leste referred to in this section reflect the understanding of the Australian Bureau of Statistics of the Treaty's statistical implications and are presented to place the statistical treatment described in context.
8.37 In measuring the economic activity of each country, a logical sequence is followed to determine which economic activities should be attributed to each country. The sequence is to:
a) split the world into discrete economic territories;
b) assign residence for all individuals, businesses, governments and other organizations (referred to as economic units) to specific economic territories;
c) calculate the economic activity of an economic territory as the sum of the activities of all economic units assigned residence in that economic territory.
8.38 A key feature in this sequence is that each economic unit can have residence in only one economic territory. In this regard, the situation in the Timor Sea is not straightforward, since there is no defined political or maritime boundary that can be used in the determination of economic territory. Indeed, since both Australia and Timor-Leste claim sovereign rights over 100 per cent of the JPDA seabed, a definition following political boundaries would result in overlapping economic territories and a double counting of economic activity. For statistical purposes it has been decided to treat the JPDA as part of the economic territory of both Australia and Timor-Leste, rather than allocate the area exclusively to one country.
8.39 In other words, the JPDA is to be treated as a multi-jurisdictional area, without either country having a predominant claim from a jurisdictional perspective. Both Timor-Leste and Australia consider themselves to hold sovereign rights over the seabed to the exclusion of all other countries. This being the case, the treatment
Multiterritory enterprises
128
of the JPDA as international waters would not be appropriate.
8.40 In recording Timor Sea economic activity in Australia's economic statistics, each aspect, e.g. production, income and net worth, must be considered separately with a focus on the particular units involved and the underlying economic measurement principles. Differences in allocation between measures of production, income and net worth are a reflection of the fact that a clear delineation of economic territory does not exist in this case. Importantly, though, there is coherence across the different aspects of economic activity because of the use of common underlying principles.
8.41 The measurement of production covers the measurement of GDP and its components, including the value of output, gross fixed capital formation, imports and exports, compensation of employees and gross operating surplus. In national accounts, production is allocated to the country in which the producer is supposed to be resident. For this reason, the production of an American-owned company operating in Australia is recorded as Australian production, even though a proportion of the income from that production will ultimately flow to the United States (U.S.).
8.42 As the JPDA is treated as multi-jurisdictional for the purposes of Australia's economic statistics, production in the JPDA has to be allocated between Australia and Timor-Leste. Given that neither country has ceded sovereign rights over the JPDA, it is considered that, on balance, production should be allocated 50:50 between Australia and Timor-Leste. This reflects the allocation of production in the national accounts on a jurisdictional basis, rather than in terms of the ultimate beneficiary of any income flow from the production. In practice, this is achieved by treating all units operating within the area as consisting of two nominal entities - one with residence in the economic territory of Timor-Leste and one with residence in the economic territory of Australia.
8.43 One impact of this approach is that there will be a range of international flows recorded between the two countries. For example, suppose an entity operating in the JPDA employs people who are residents of Australia. In this case, 50 per cent of the wages paid would be treated as payments by an Australian entity to Australian residents and the other 50 per cent of the wages would be treated as payments by a Timor-Lestese entity to Australian residents - a flow that is captured in the balance of payments. These and other production related flows can be measured and recorded following standard principles.
8.44 An exception to the allocation of production on a 50:50 basis concerns the pipeline under development between the JPDA and the Northern Territory. In this case, the pipeline is not considered to be part of the multi-jurisdictional area covered by the JPDA but is
considered under the jurisdiction of Australia. Hence the economic territory can be clearly defined as Australian and the activity associated with the construction of the pipeline and the output from the pipeline itself can be allocated 100 per cent to Australia.
8.45 In the measurement of production, some elements of income are covered. These are compensation of employees, gross operating surplus and taxes less subsidies on production and imports. But there are other relevant income flows that must be considered, such as flows of interest, dividends, rent on natural assets (commonly referred to as royalties with respect to mineral deposits) and taxation other than taxation on production and imports. In order to measure a country's gross national income and its gross disposable income, as distinct from its GDP, it is necessary to take into account income flows between the country and the rest of the world.
8.46 The Treaty between Australia and Timor-Leste defines how the resource royalty and taxation income flows relating to the JPDA are to be apportioned between the two countries. For resource royalties, 90 per cent are payable to the Timor-Leste government and 10 per cent to the Australian government. For taxation, in general, Australia applies its tax system to 10 per cent of income earned in the JPDA, and Timor-Leste applies its tax system to 90 per cent of the income earned in the JPDA. These proportions are applied to the relevant activities of each conceptual entity in order to estimate the income transactions between Australia and Timor-Leste that are recorded in the balance of payments.
8.47 The final income result for each country is unaffected by the decisions relating to economic territory, residence and production in respect of the JPDA. At the same time, changes to the Treaty that affect the allocation of resource royalty and taxation flows between the countries will not affect the measured production of each country. Both of these outcomes are sound from an economic measurement perspective.
8.48 Since the JPDA is considered a multi-jurisdictional area, only a proportion of the sub-seabed petroleum deposits in the JPDA need to be recorded on the national balance sheet of each country. In Australia, all sub-soil assets are deemed to be owned by the general government sector. Without a precise delineation of economic territory, the allocation of assets within the JPDA will be based on the future income stream accruing to the various owners of the asset. For the Australian government, the future income stream from its ownership of the mineral resources is directly related to the value of future resource royalty flows. As it will receive 10 per cent of these flows, 10 per cent of the total value of the petroleum deposits in the JPDA will be recorded in the Australian balance sheets.
8.49 No consideration has been given to any other natural resource assets that may be present within the JPDA. The allocation of the value of any other assets in

Multiterritory enterprises
129
the JPDA between Australia and Timor-Leste would need to be considered separately.
(iv) Cross border pipelines, Norway
8.50 Crude oil and natural gas are transported from the Norwegian petroleum fields in the North Sea to ashore in the UK and North Sea continental countries. Parts of these pipelines are located on other countries’ continental shelves but nevertheless for most part owned and operated by Norwegian companies. As illustrated in Figure 8.4, this truly represents a multiterritory operation.
Figure 8.4 Sub-sea pipeline transport system in the North Sea
8.51 Following previous discussions, the pipeline should be recognized as constituting a branch if there are substantial operations over a significant period for which separate accounts are available or meaningful to compile. In this specific case there is no substantial presence and no information available to set up separate accounts for the different territories outside Norway. Allocating production to the territories by prorating is also difficult as no suitable allocation method seems to exist. Therefore, agreements are made with the respective countries that the value added generated by transporting the petroleum to other North Sea countries are to be recorded as part of the Norwegian GDP and export.
8.52 A first agreement on this recording was entered with the UK in 1974. Historically, the solution was chosen for practical reasons, as the required statistics must be obtained from the Norwegian enterprises operating the transportation systems. Foreign statistical authorities will not easily be in a position to acquire this information. However, this solution is also based on the difficulties in developing separate financial statements and balance sheets. So one may conclude that the chosen treatment is in accordance with the recommendations in BPM6 (4.31).
(v) Cross border pipelines, Italy
8.53 The Bank of Italy records exports of pipeline transportation services in the Italian balance of payments. These exports represent the revenues obtained from Tunisian enterprises for the transport of gas through a pipeline owned by an Italian enterprise. The pipeline is mainly used to transport gas from Algeria to Italy, and since it passes through the Tunisian territory it is used also to transport gas from Algeria to Tunisia. The Italian enterprise owning the pipeline does not have a separate local branch managing the transport of gas from Algeria to Tunisia and, according to the enterprise, separate accounts are not available.
8.54 Under these circumstances prorating is not a very meaningful way forward, and as a logical consequence the provision of transport services to Tunisian enterprises has to be registered in the Italian balance of payments as exports of services (BPM6, 4.33). This recording is in line with these recommendations in a similar way as the Norwegian example.
(vi) The Nord Stream Pipeline
8.55 The Nord Stream twin pipeline system through the Baltic Sea runs from Vyborg, Russian Federation to Lubmin, near Greifswald, Germany. The pipelines were built and are operated by Nord Stream AG.
8.56 The Nord Stream route crosses the exclusive economic zones of the Russian Federation, Finland, Sweden, Denmark and Germany, as well as the territorial waters of the Russian Federation, Denmark and Germany. The two 1,224 km offshore pipelines are the most direct connections between the gas reserves in the Russian Federation and energy markets in the European Union (EU).
8.57 Construction of Line 1 of the twin pipeline system began in April 2010 and was completed in June 2011. Transportation of gas began in mid-November 2011. Construction of Line 2, which runs parallel to Line 1, began in May 2011 and was completed in April 2012. Gas transport through the second line began in October 2012.
8.58 Nord Stream AG, based in Switzerland, is an international consortium of five major companies. The five shareholders are a Russian company (with a 51% share of ownership), two German companies (15.5% each), one Dutch company (9%) and one French company (9%). For the Russian and German companies, Nord Stream resembles an FDI, while representing a portfolio investment for the Dutch and French partners (BPM6, 6.12 and 6.56).
8.59 The operation of the Nord Stream Pipeline system is remotely monitored and controlled from the Control Centre, located at the Nord Stream head office in Switzerland. This head office oversees and coordinates all commercial operations, meaning they are in contact with gas suppliers and consumers on a daily
Petroleum field
Borderline of Norwegian continental shelf
Norwegian owned and directly operated pipeline
Norway
Continental Europe

Multiterritory enterprises
130
basis. In Switzerland, Nord Stream is registered as an affiliate of the Russian major stake holder.
8.60 Although the pipelines pass through several territories, they are not operated by separate legal entities in those territories. The pipelines should be recognized as constituting a branch if there is a substantial presence and availability of separate accounts in the territories. A territorial breakdown of the economic operations is not very meaningful. Hence, all output and value added of the pipeline operator is recorded in Switzerland. This implies that full ownership of fixed assets (the pipelines) is also recorded in the balance sheet of Switzerland.
8.61 Given that the Russian company sells gas directly to customers in Europe, these sales in gas are unrelated to the pipeline operator, Nord Stream AG. Nord Stream AG obtains fees for transporting the gas. Under balance of payments conventions, goods are valued free on board, and importers are considered the purchasers of transport services from the exporting country’s border to that of the importer. If in fact payments to Nord Steam AG in Switzerland are made by the Russian gas producer, the payments should be re-routed, to be shown as imports of gas transportation services by the purchaser of the gas from Nord Stream (BPM6, 10.79).
(vii) Ocean transport
8.62 Statistical treatment of international maritime transport activities may be challenging. The following quotation from a Norwegian newspaper may serve as an illustration:
“The Norwegian shipping company X in Bergen recently sold 10 ships to an Arabian company Y. The ships are to be registered in Liberia. The company X has entered a
management contract with company Y. The ships will, however, be operated by the (Norwegian) company Z.”
8.63 This example illustrates the difficulties in allocating to various countries involved in the operation of transportation equipment. Ocean marine transport is an international service activity in more than one sense, which can be hard to grasp in statistical terms. The transport activity itself takes place in several countries’ economic territories or in international waters.
8.64 Due to complex organizational structures and operating arrangements, it can be difficult to identify which institutional unit (and which country) is the producer of a specific transport service. In international shipping, a vessel’s presence is often outside the territory of its operator. Furthermore, the vessel’s owner quite often is resident of yet another country, and the vessel itself may very well be registered in a third country (see Figure 8.5). Some decades back, the country of registration, the country of ownership and the country of operation of a ship were all one and the same. For various reasons, this is rarely the case today.
8.65 The main challenge is to determine the producer of these marine transport services and its country of residence. At least two fundamental problems should be addressed. Firstly, marine transport services must be separated from other types of services. In the last decades a growing trend of contracting out shipping services has been observed. The economic crisis in the shipping industry, starting in the mid-70s, forced many companies in Norway to sell their fleets, while others went bankrupt. Nevertheless, the knowledge of marine operations still existed. This led to the appearance of specialized enterprises, so-called ship management agencies, producing a range of services related to shipping on a contractual basis.
Figure 8.5 The multinational organization marine transport
Vessel
Country of residence of owner of vessel
Country of registration of vessel
Country of residence of operator of vessel
Leasing service - leasing of vessel
Service of registration (often considered a tax)
Transportation service
Operation Ownership
Registration
Multiterritory enterprises
131
8.66 This development made statistical recording of marine transport services somewhat more difficult than before, as the borderline between marine transport activities and other business service activities became blurred. The dispersion of ship management functions and fleet ownership can make it difficult to identify the statistical unit actually producing the transport service.
8.67 Even when it is clear who owns the vessel, who produces the transport services and where the owner and operator of the vessel reside, it may still be challenging to compile data consistent with preferred statistical methodologies. This is because it can be difficult to adjust data for commercial or regulatory reporting needs to fit statistical purposes.
8.68 A consistent and comprehensive statistical treatment of the services requires identifying the production units involved, and this may be best accomplished through improvement of a business register. To support this task, operational criteria for distinguishing the various types of service producers need to be defined.
8.69 The second issue is that the trend toward increasing internationalisation of the shipping industry has highlighted some questions of residency. It is not always obvious to which country the production and hence the export of shipping services must be assigned. Even the fleet ownership is not always clearly identified.
8.70 A general principle is that it is the operator, i.e. the enterprise operating the vessel, who will often be the producer of the transport service. This implies that the allocation of the transportation activity should follow the country in which the operator of the vessel is resident, that is, the country of the operator's predominant centre of economic interest (BPM6, 4.136).
8.71 The country of residence of the owner of the vessel determines on whose national balance sheet the value of the vessel should be recorded. The country of registration is irrelevant in this respect. The economic link between the country of registration and country of ownership of the vessel is that a registration service42 is to be recorded between the two countries.
8.72 The international shipping industry is sometimes organized in a way, which makes it difficult to determine the actual owner of a vessel. In practice one may need to accept formal ownership even knowing that lease agreements and shipping registers may not reflect economic ownership. Recording exports and imports of vessels requires that (change in) economic ownership is identified. Identifying the operator is a prerequisite for determining the geographic location of the transport service produced.
42 In the case where the registration fee is provided for little or no work on the part of government, the fee should be considered as a tax (BPM6 10.180).
(viii) Non-resident crew on Norwegian ships
8.73 At present the crew on board ships under Norwegian operation or ownership represents 45,000 employees. In the national accounts it needs to be determined which part of this staff is actually employed by the Norwegian companies and which part represents non-resident employees.
8.74 In the past, the full crew was assumed to be resident of Norway, i.e. belonging to the domestic household sector. Part of the compensation of employees paid to staff with a foreign nationality was assumed to be spent on shore in foreign ports and therefore recorded as part of travel expenditure debits (or imports). The remaining part of their labour income was assumed to be transferred to their home countries as remittances.
8.75 This recording was changed in the Norwegian balance of payments and national accounts after the System of National Accounts 1993 (1993 SNA) implementation when foreign crew members were treated as non-residents. Their labour income was recorded as compensation of employees paid to the rest of the world. For example, staff from the Philippines working on Norwegian operated vessels are classified as Philippine residents receiving compensation of employees from Norway. This treatment is in accordance with the recommendations in the 2008 SNA (26.38 c). The required information is obtained from administrative registers and from the Norwegian Ship Owners’ Association.
8.76 Another issue is that part of the crew may in fact be contracted by foreign employers companies and subsequently outsourced to the Norwegian shipping companies. Such payments for labour services should be recorded as imports of services and not as compensation of employees.
(ix) Unincorporated joint ventures and transport equipment – the case of “Smooth Airways”
8.77 There are institutional units for which it is infeasible or meaningless to determine unambiguously their countries of residence. The economic activities of such units may be performed on two or more countries’ territories and organized in an inseparable way that makes it impossible to identify, either in real or notional terms, separate institutional units (affiliates) in each of the countries involved. In such cases the activity may be allocated to these countries in accordance with ownership relations.
8.78 Ever since its establishment as a multinational consortium, Smooth Airways has had strong involvement from three governments, which have the following ownership shares: country A 3/7, country B 2/7 and country C 2/7. The government ownership is organized through national enterprises with 50 per cent central government ownership share. The agreement

Multiterritory enterprises
132
was the foundation of a joint aviation policy of the three countries.
8.79 The agreement laid down the operational principles of the joint aviation activity and established its boundaries. It also governed the registration of airplanes in the three countries in accordance with their ownership shares. According to the agreement, Smooth Airways is to perform all air services and aviation activities on behalf of the national owner companies, which act solely as owners. The national owner companies themselves do not perform any aviation activities.
8.80 The national accounts and balance of payments in the three countries follow the same rules in terms of recording the production activities of Smooth Airways. Both turnover and capital stocks are prorated to the respective countries in accordance to their ownership shares. The consequence is that the national accounts of countries A, B and C may include certain activities that are on a permanent basis operated and performed outside their economic territories (similar to the treatment of offshore pipelines).
8.81 The challenge is then to divide or prorate all economic activities on a country-by-country basis. The 1993 SNA (paragraph 14.25) provided specific guidelines for operators of mobile equipment according to three criteria that must be fulfilled before following such an approach:
a) The production must take place using transport equipment, implying that production activities operating stationary fixed capital fall outside the scope of this special case. Smooth Airways, an aviation company conducting international aviation operations, clearly meets the first criterion.
b) The unit must be founded by joint legislation of two or more governments. It seems plausible to assume that the underlying reasoning is that such a close governmental cooperation in this policy area implies joint operations. Smooth Airways was founded and is operated to meet joint regional policy objectives within the aviation sector. The second criterion is thus also met.
Figure 8.6 Ownership structure Smooth Airways
Smooth Airways
(SA)
SA
Country B
Private
SA Consortium
(joint air operations)
SA
Country C
SA
Country A
14.3%
3/7
Government
A
Government
B
Government
C
2/7 2/7
100%
14.3% 21.4%
50.0%

Multiterritory enterprises
133
c) The unit must be registered in all involved countries, underlining the objective of joint governmental control over the activities. If the unit in question is registered in one of the countries only, this could be used to determine the country allocation of the activities. The three national ownership companies related to Smooth Airways were registered in each of the three countries, reflecting the policy objectives of joint governmental control and, thus, the third criterion is also met.
8.82 For cases meeting these three criteria, the former international guidelines suggested two alternative treatments in the national accounts and balance of payments:
a) All transactions and positions are allocated to each country according to their share of corporate equity, or;
b) The unit and all its transactions and positions are allocated to the country where the headquarters is located. Units in the other countries are treated as direct investment enterprises.
8.83 This guidance from 1993 SNA has been superseded by new guidance in both 2008 SNA and BPM6. Although it is still a possibility to use corporate equity to prorate operations in this context, as mentioned in the first alternative above, the “factor used for prorating should be based on available information that reflects the contributions to actual operations. For example, equity shares, equal splits, or splits based on operational factors such as tonnages or wages could be considered.” (BPM6, paragraph 4.43).
8.84 The new guidelines recommend searching for indicators that reflect the contributions to actual operations. SNA recommends the second method. However, practical considerations may result in choosing the first treatment mentioned under a in paragraph 8.82. But most importantly, all countries involved should follow the same pro-rating method. In the case of Smooth Airways, the first method is followed. The reasoning is that Smooth Airways produces international air transport services and at the same time answers to a joint inter-governmental aviation policy.
Compilation issues
8.85 The national statistical institutes (NSI) of the three countries involved, agreed on the following recording of Smooth Airways:
a) Output, intermediate consumption, gross fixed capital formation and financial transactions are all prorated according to ownership shares (3/7 for country A and 2/7 each for Countries B and C).
b) A dedicated survey is run by country A. This survey collects information on turnover and production costs and balance sheet on a quarterly basis. The results are disseminated to the NSIs of the other two countries and data compilations are mutually consistent.
c) International trade in aviation services between the three countries is derived from information on domestic sales in each country. Imports of intermediate goods per country are determined in a similar way.
8.86 Country A captures 3/7 of output and production costs. Exports equal domestic output minus domestic sales. Intermediate consumption equals 3/7 of the total costs and the imports are calculated as the difference between the intermediate consumption in country A and production related purchases in country A. This approach is illustrated in the tables 8.1 and 8.2..
Import and export of aircrafts
8.87 Estimates of gross fixed capital formation are derived from information on purchases and sales of aircrafts, which is also collected by the NSI in country A. This information includes the nationality of the counterpart of these capital transactions. This information is also shared with the NSIs of the other countries.
8.88 The same allocation method is applied for capital goods. A 3/7 share of the value of aircrafts is recorded on the balance sheet of country A. The country of registration is not relevant in this regard. Countries B and C own 2/7 shares of the aircrafts each. Of course, for each country the recording of imports and exports of aircrafts is brought in line with the prorated investment estimates.
Table 8.1 Calculation of the production and the exports in country A
a) b) c) d) Company’s income Sales to units in
country A Production in country A
Exports in country A
source survey survey 3/7*a) c)-b) Passenger 700 200 300 100 Freight 280 50 120 70 Other traffic revenues 140 55 60 5 Aircraft rental 350 130 150 20 Engineering services 70 28 30 2 Ground services 70 10 30 20
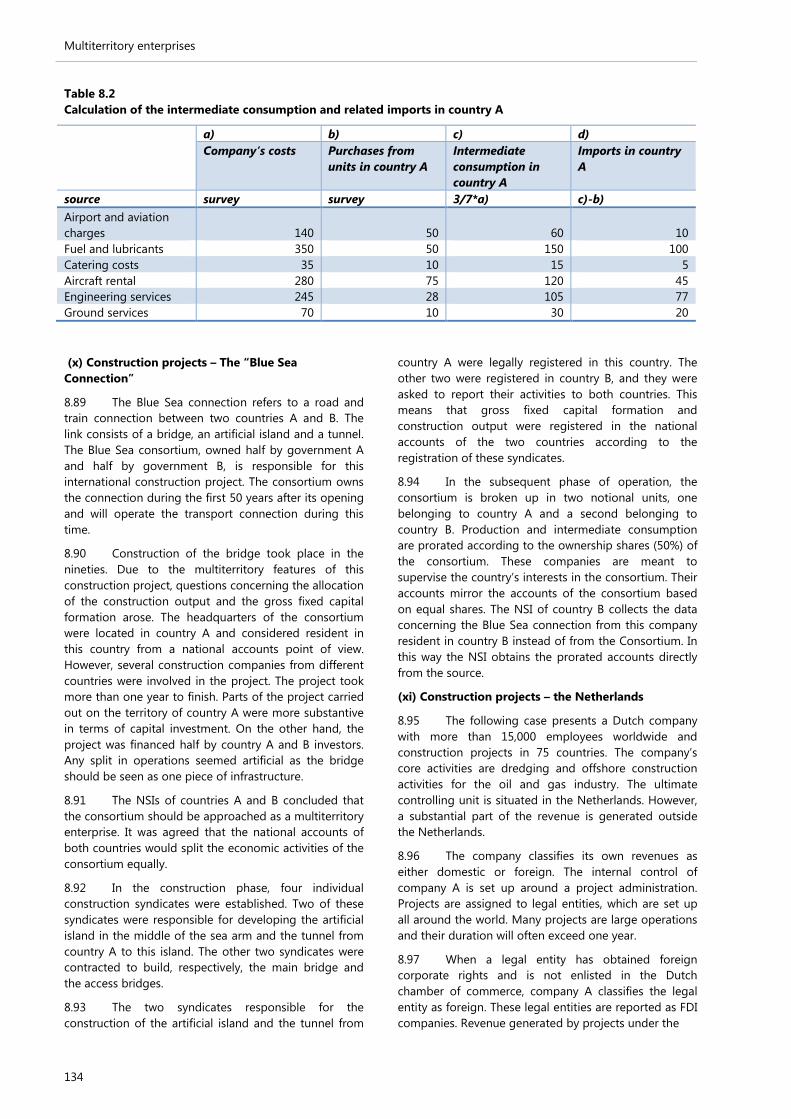
Multiterritory enterprises
134
Table 8.2 Calculation of the intermediate consumption and related imports in country A
a) b) c) d) Company’s costs Purchases from
units in country A Intermediate consumption in country A
Imports in country A
source survey survey 3/7*a) c)-b) Airport and aviation charges 140 50 60 10 Fuel and lubricants 350 50 150 100 Catering costs 35 10 15 5 Aircraft rental 280 75 120 45 Engineering services 245 28 105 77 Ground services 70 10 30 20
(x) Construction projects – The “Blue Sea Connection”
8.89 The Blue Sea connection refers to a road and train connection between two countries A and B. The link consists of a bridge, an artificial island and a tunnel. The Blue Sea consortium, owned half by government A and half by government B, is responsible for this international construction project. The consortium owns the connection during the first 50 years after its opening and will operate the transport connection during this time.
8.90 Construction of the bridge took place in the nineties. Due to the multiterritory features of this construction project, questions concerning the allocation of the construction output and the gross fixed capital formation arose. The headquarters of the consortium were located in country A and considered resident in this country from a national accounts point of view. However, several construction companies from different countries were involved in the project. The project took more than one year to finish. Parts of the project carried out on the territory of country A were more substantive in terms of capital investment. On the other hand, the project was financed half by country A and B investors. Any split in operations seemed artificial as the bridge should be seen as one piece of infrastructure.
8.91 The NSIs of countries A and B concluded that the consortium should be approached as a multiterritory enterprise. It was agreed that the national accounts of both countries would split the economic activities of the consortium equally.
8.92 In the construction phase, four individual construction syndicates were established. Two of these syndicates were responsible for developing the artificial island in the middle of the sea arm and the tunnel from country A to this island. The other two syndicates were contracted to build, respectively, the main bridge and the access bridges.
8.93 The two syndicates responsible for the construction of the artificial island and the tunnel from
country A were legally registered in this country. The other two were registered in country B, and they were asked to report their activities to both countries. This means that gross fixed capital formation and construction output were registered in the national accounts of the two countries according to the registration of these syndicates.
8.94 In the subsequent phase of operation, the consortium is broken up in two notional units, one belonging to country A and a second belonging to country B. Production and intermediate consumption are prorated according to the ownership shares (50%) of the consortium. These companies are meant to supervise the country’s interests in the consortium. Their accounts mirror the accounts of the consortium based on equal shares. The NSI of country B collects the data concerning the Blue Sea connection from this company resident in country B instead of from the Consortium. In this way the NSI obtains the prorated accounts directly from the source.
(xi) Construction projects – the Netherlands
8.95 The following case presents a Dutch company with more than 15,000 employees worldwide and construction projects in 75 countries. The company’s core activities are dredging and offshore construction activities for the oil and gas industry. The ultimate controlling unit is situated in the Netherlands. However, a substantial part of the revenue is generated outside the Netherlands.
8.96 The company classifies its own revenues as either domestic or foreign. The internal control of company A is set up around a project administration. Projects are assigned to legal entities, which are set up all around the world. Many projects are large operations and their duration will often exceed one year.
8.97 When a legal entity has obtained foreign corporate rights and is not enlisted in the Dutch chamber of commerce, company A classifies the legal entity as foreign. These legal entities are reported as FDI companies. Revenue generated by projects under the

Multiterritory enterprises
135
Figure 8.7 Structure of company A
control of these foreign entities remains unreported in the Dutch national accounts.
8.98 When a legal entity has Dutch corporate rights and is enlisted in the Dutch chamber of commerce, its revenue classification is based on the geographic location of its operations. Activities carried out on Dutch territory are classified as domestic. Revenue classified as foreign means that these activities are supposed to take place outside Dutch territory and are, therefore, not recorded as output in the national accounts of the Netherlands. If a project is conducted through a joint venture, the company only recognizes the share it has in the joint venture.
8.99 Prorating, as recommended by the international guidelines, follows logically from the companies structuring of international projects. The largest foreign projects are operated by foreign legal units, which makes the distinction between domestic and foreign operations from a national accounting point of view quite transparent.
8.100 One additional point is that the 2008 SNA recommends taking into consideration the duration of a construction project. Normally, when a corporation or incorporated enterprise engages in production over a long period of time (often taken to be one year or more as an operational definition) without creating a subsidiary corporation for the purpose, the site is considered to be a quasi-corporation resident in the country in which it is located (2008 SNA 4.15 and 26.36). The choice of one year is somewhat arbitrary, and other factors, such as being subject to income tax, may lead to classifying a project that takes less than a year to perform as a resident institutional unit in the country of location. In this case, information on the duration of projects is not readily available, and this
information cannot be used when classifying the revenue as either foreign or domestic. However, legal units are typically created in case of large construction projects that may be expected to take more than one year. This means that this accounting solution is still broadly in line with the 2008 SNA and the BPM6.
Challenges with regard to source statistics 8.101 Challenges with regard to multiterritory enterprises are mainly related to methods applied for prorating when it is not possible to identify separate (legal) institutional units. The purpose of proration is to achieve approximately the same result as if data were reported by the enterprise itself. The SNA/BPM leave it to the statisticians to devise methods that are appropriate to the circumstances encountered.
8.102 The factors used for prorating should be based on the available information reflecting the contribution to actual operations. Such information may not always be available and compilers will have to consult the enterprises involved by, for example, conducting sample surveys that are specially designed for this purpose.
8.103 If the taxation authorities have accepted the multiterritory arrangements, a prorating formula may have been determined and could be the starting point for statistical purposes. However, such taxation information can be difficult to obtain or to exchange between countries.
8.104 It is clear that the prorating treatment is complex to implement and has implications for other statistics. It should be coordinated between countries involved for the sake of consistency. Thus, compilers
Projects
Legal entity withforeign corporate
rights
Treat entity as FDI: report result on
investment
Legal entity with Dutch corporate
rights
Activities conducted in the Netherlands
Classify revenue as domestic
Activities conducted outside the Netherlands
Classify revenue as foreign

Multiterritory enterprises
136
across countries involved in multiterritory enterprises should cooperate to develop consistent data and avoid data gaps.
8.105 At the same time, statistical agencies across countries have been increasingly concerned about respondent and compilation burden and have taken steps to minimize these burdens. The approach followed in the “Smooth Airways” case is efficient, as one NSI conducts a special survey and shares the results with the other involved NSIs.
8.106 Compared to administrative data, sample surveys have the advantage of being designed to observe multiterritory enterprises and obtain the information required for prorating. The disadvantage is that they increase response burden. One possibility is to combine administrative data with a survey that covers only the most substantive questions.
8.107 As a way of reducing response burden, many statistical agencies use administrative data in their compilation of national accounts. The challenges with regard to administrative data are that they normally are set up for legal or other administrative purposes and are not designed to answer questions that pertain to national accounts and balance of payments. If one uses tax records, particular attention should be paid both to the risk of overestimating domestic value added as well as the risk of double counting activities across the borders. Such measurement problems must be solved through direct contact with the companies involved with instructions on how to report data for statistical purposes.
8.108 Regardless of the statistical data sources employed, proration is resource intensive work for statisticians. If the incidence of proration increases because more activity is undertaken globally, then the workload of statisticians will also increase. The accuracy of the results could be questioned, because proration implies a degree of judgement, such as selecting the variable(s) used for prorating.
8.109 Prorating or setting up notional units means that transactions such as imports and exports have to be imputed. The general rule of SNA/BPM is to avoid imputing transactions. However, in the context of multiterritory enterprises, these imputations are a regrettable necessity.
8.110 The significance of these issues depends on the circumstances. Most international operations of multinationals are formally organized as corporations or branches, and governments can usually routinely collect relevant data from them for statistical purposes. However, for small open economies, and for some countries that participate in customs and currency unions, multiterritory enterprises may be sizable and can create compilation challenges. Hence, recommendations on how to compile and prorate these enterprises are important, even though the
number of units that require such treatment may be limited in most countries.
Recommendations 8.111 Based on the conceptual discussions and case studies presented in this chapter, the following recommendations are made:
a) The recording of multiterritory enterprises should be done on a case-by-case basis. Because of its data and resource intensive nature it should be carefully planned and organized similarly to the other work related to large and complex enterprises.
b) The preferred option is to identify separate branches. However, the identification of branches as institutional units on their own requires that their operations can be quantified separately from the rest of the entity. A complete set of accounts, including a balance sheet, should exist for the branch, or it should be possible and meaningful, from both an economic and legal viewpoint, to compile these accounts if they were to be required. Each branch is a direct investment enterprise.
c) The creation of notional units should only be done out of necessity, i.e. for compiling data for each national economy.
d) Where needed, special surveys should be conducted for tracking multiterritory enterprises and for developing prorating factors. Alternatively, administrative data can be used in combination with special surveys. Administrative data are often insufficient to develop accounts on the basis of prorating. Appropriate prorating factors that are often easily available include shares of ownership, employment, wages, etc. Surveys can also help track other prorating factors, such as turnover shares. If turnover shares are available, one should be cautious about internal transfer pricing, which can distort the shares.
e) The Timor Sea case could be used as an example how prorating can be applied to all relevant transactions.
f) Best practices in survey design should be shared among NSIs.
g) Compilers in different countries should share data with each other to develop consistent data and avoid data gaps and double counting.
h) A coordinated treatment of multiterritory enterprises requires thorough exchange of experiences and accounting practices. This should be facilitated by international organizations by way of organizing national accounts experts meetings to discuss these (and other) globalization issues. It is essential that statistical agencies are committed
Multiterritory enterprises
137
to the idea of sharing experience and data. Unfortunately, the possibility of data exchanges is often limited due to data confidentiality constraints.
i) Exchange of experiences helps mitigate problems
through the common development of data sources and methods. Since customized solutions are often needed, this may consume resources from NSIs. Solutions should be not only conceptually correct but also practical.


Measurement issues associated with quasi-transit trade and similar phenomena
139
Chapter 9 Measurement issues associated with quasi-transit trade and similar phenomena Introduction 9.1 This chapter discusses statistical measurement issues associated with so-called “quasi-transit trade” and similar phenomena. “Transit trade” occurs when goods are admitted under special customs procedures that allow the goods to physically pass through an economy, en route to another destination; in the case of transit trade, the goods are excluded from the goods trade statistics of the economy through which the goods physically pass. In contrast, quasi-transit trade occurs when goods enter an economy and are declared as imports for customs purposes at values that differ from those that are declared when the goods leave the same economy, without the transit economy having acquired ownership of the good. This phenomenon is most relevant in customs unions, such as the European Union (EU), where goods often enter the union without having changed ownership (so-called fiscal representatives may declare the goods in imports).
9.2 According to the Balance of Payment and International Investment Position Manual, sixth edition (BPM6), these goods should not be recorded as imports in the balance of payments goods account. In contrast, customs regulations may require the reporting of the value of the goods when they physically cross a customs border, even when there is no change in ownership of the goods. In particular, EU Regulations followed by Extrastat43 prescribe that the goods be declared as imports upon their arrival to the EU. These same goods would be declared as exports/dispatches if they are sold to a resident in a different EU country. Under statistical rules adopted for estimating EU and euro area (EA) balance of payments aggregates (but not followed in national balance of payments estimates), the difference between the value declared upon entry to the EU and the value upon the change of ownership in the country
43 The EU has two separate statistical systems for the physical movement of traded goods: (i) Extrastat is a statistical data collection that is based on the customs declarations of goods entering and leaving the EU; and (ii) Intrastat collects information from VAT-registered traders on trade flows between countries within the EU.
of the final consumer is to be shown as an import of “branding” in the country of transit.
9.3 A related phenomenon to quasi-transit trade may occur if the goods that originally entered for transit trade are instead sold to a resident of that economy for a price that differs from the declared value upon arrival. (This is not transit or quasi-transit trade, because the goods do not physically pass through the economy.) This case may result in a statistical discrepancy for the importing economy (because recorded imports may not equal the settlement payment that is recorded in the financial account), and may also result in a statistical discrepancy in global trade (because imports declared by the fiscal representative may not be equal to exports declared by the merchant, assuming that the economy of the merchant records the full selling price of the exported goods in its estimates).
9.4 Price differences, resulting in a net trade flow in the transit economy, also may occur when goods are traded under merchanting or as goods for processing, or a combination of the two. Thus, there are a number of different situations that may pose compilation challenges for compilers.
9.5 As noted in previous chapters, compared to their predecessors a significant change in the BPM6 and the System of National Accounts 2008 (2008 SNA) is the consistent application of the change in ownership principle to the goods and services account. As a consequence, unlike the treatment in Balance of Payments Manual, fifth edition (BPM5), the imputation of transactions when goods cross a customs frontier without a change in economic ownership is eliminated in BPM6.
9.6 Practical challenges exist in implementing both the BPM5 and the BPM6 methodologies. As already discussed in Chapter 5 it is sometimes difficult to adjust International Merchandise Trade Statistics (IMTS) with the methodology used in compiling the balance of payments and national accounts. IMTS often serve as inputs for balance of payments and national accounts. Physical movement of goods across customs frontiers is a key principle for recording data in IMTS.

Measurement issues associated with quasi-transit trade and similar phenomena
140
Background Value added tax (VAT) registration in the EU
9.7 Each of the 28 EU member states follows the rules of the EU Directive on EU VAT compliance governed by the European Commission.44 Although the Directive establishes broad rules and rates for the management of VAT in the EU (e.g. the minimum “standard rate” at 15%), member states are able to vary from the standard rate and to develop rules of implementation in specific areas.45
9.8 Non-resident companies providing taxable supplies of goods and/or services in the EU need to register for VAT purposes; this applies, for instance, to non-resident companies releasing goods for free circulation in one EU member state, and subsequently dispatching the goods to other member states of the EU. In principle, import duties and VAT at import are payable at the moment the import declaration is submitted, although a few member states have VAT deferment systems in place.
9.9 Non-EU importers registering for VAT have to appoint local fiscal representatives in most European countries. The fiscal representative is responsible for all of the importer's VAT compliance, including the filing of returns (see below). In some EU countries, non-resident businesses may register themselves directly in the EU country and obtain a VAT number that identifies their non-resident nature.
9.10 Non-resident traders are issued tax numbers and use these numbers to execute their trade-related VAT payments. They are not considered part of the host economy; consequently, their transactions with residents of the host economy need to be included in balance of payments statistics and national accounts. Intrastat is the EU-wide system of collecting information from VAT-registered traders to provide an overview of the dispatch and acquisition of goods between member states of the EU; thus non-resident VAT entities in a host country also are obliged to report their transactions (above a threshold) to Intrastat.
Role of fiscal representatives in the EU
9.11 Fiscal representative companies specialize in taking care of the management and settlement of VAT on behalf of non-resident companies in accordance with the local (sometimes complex) regulations, including customs clearing and Intrastat filing. The tax authorities regard a fiscal representative as the local agent of the non-resident trader. 44 The detailed application of VAT varies according to the administrative customs and practices of each member state within the framework set out by Community legislation.
45 See http://ec.europa.eu/taxation_customs/taxation/vat/how_vat_works/
9.12 Apart from the locational advantage for entering the EU through a specific member state, there are a number of other reasons why a non-resident company would ship its products through one EU member state to sell them in another. For instance, as noted above, some EU members offer VAT deferral schemes that can improve an importer’s cash flow.
9.13 Another advantage is that, once the goods have been cleared in one member state, the goods are free for transport elsewhere in the EU without any further customs clearance, and as such can be stored within the EU and eventually transported and delivered quickly. It is often the case that goods are stored as inventory in one EU member state before being delivered to a purchaser in another member state. With fiscal representation, there is no need for a bonded warehouse or the posting of a customs bond – the goods may be stored anywhere. Often the shipments are cleared for customs on a consolidated basis, which saves additional costs.
9.14 Furthermore, in global wholesale arrangements, the non-resident merchants often buy in bulk for a reduced price, and sell in smaller lots to final customers for prices including mark-up, such as royalties or commissions, and costs for planning, marketing, and advertising (see also BPM6, paragraph 10.44 (b)). Under this arrangement, merchants may be able to keep confidential from customers the wholesale prices that were declared at the time of import, as well as to provide a more tailor-made door-to-door service for their end customers.
Value adding services through value added logistics
9.15 In the above cases, goods pass through an economy without being further processed by the economy through which they passed. There are also cases where value is added in the transit country.
9.16 It is common for fiscal representation companies to also offer or sub-contract tailor-made so-called “value added logistics”. These services include, for instance, “consolidating” 46 goods for the end-customer from multiple sources; “differentiation” 47 of products before delivery through, for example, uploading of software; quality inspections; or repacking and resizing
46 Generally speaking, “consolidation” means bundling, e.g. goods are bundled in a way that could include delaying the delivery to improve the utilization of transport capacity; or the transport flows are bundled, for instance, by including stopping at several pick-up and drop-off stations along the way.
47 Product differentiation is a process that can be achieved in many ways; for instance, by packaging of goods in a unique way; or even as elaborate as incorporating new features, such as customized software.

Measurement issues associated with quasi-transit trade and similar phenomena
141
Figure 9.1 Recording of quasi-transit trade
Country Y Country A
Goods under merchanting with X -100 CR Trade-related services 20 CR Goods under merchanting with B +150 CR Financial account – net change in
external assets 20 DR
Net exports of goods under merchanting
50 CR
Trade-related services 20 DR Country B
Financial account – net change in external assets
30 DR General merchandise import from Y 150 DR
Financial account – net change in external assets
150 CR
Country X
General merchandise export to Y 100 CR Financial account – net change in external assets
100 DR
of products. After this light processing48, the goods are physically dispatched to the final customer in another EU member state, who pays the full transactions price directly to the non-resident merchant. The non-resident merchant separately pays the processor in the transit economy for the services it provided. Thus, in the economy of the value added services provider, services (and not goods) exports should be recorded, and the services exports should be equal to the amount that the services provider charged for its services.
Application of BPM6 and 2008 SNA to quasi-transit trade 9.17 This section first addresses the treatment of quasi-transit trade in national balance of payments data, and, second, addresses the BPM6-recommended recording in a customs union (i.e. the EU). Both cases are illustrated by quantitative examples that also address the treatment of any value added being generated in the transit economy. The third example displays the recording of quasi-transit trade in EU statistics.
48 BPM6 Box 10.1 contrasts merchanting with manufacturing services that do or do not change the condition of the goods: when manufacturing services are performed on goods that do not change condition.
Recording of quasi-transit trade in national balance of payments
9.18 In the national balance of payments it is important that the compiler identify cases where its own country does not acquire economic ownership of goods (transit trade and quasi-transit trade), to ensure that it does not record goods imports and exports. 49 In many EU countries, it is much easier to identify and properly record (exclude) transit trade than it is to properly handle quasi-transit trade.
9.19 In the first example presented in Figure 9.1, the merchant in country Y buys goods from country X for the wholesale price of 100 and sells these goods to country B for the transactions price of 150 (including purchased services and profit). A local fiscal representative in transit country A, in addition to taking care of the customs arrangements, sub-contracts to a specialized enterprise the undertaking of quality
49 If the compiler publishes data on transit or quasi-transit trade, such as in preparing a table that reconciles data on an IMTS basis with data that are recorded in the balance of payments accounts, it could be useful to explain reasons for differences in the values of goods received and goods dispatched, e.g. profit margin of the merchant, or fees that are recorded as manufacturing services in the balance of payments data.
Country Y
Country X Country A Country B
20 100
physical movement of goods financial settlement
150
Measurement issues associated with quasi-transit trade and similar phenomena
142
inspections before the goods are shipped. He gets reimbursed for his services by the merchant in country Y with 20 (5 for customs clearance, and 15 for quality management). These services are reflected in the higher goods value when dispatched to country B; however, they also need to be recorded as separate transactions in the balance of payments of country A, because residents of member state A provided services to country Y for which they were explicitly compensated.
9.20 As shown in Figure 9.1 goods under merchanting are recorded in the accounts of the merchanting country Y (owner of the goods), with the difference in price representing the merchant’s margin. The transit country A records only services exports to country Y50, while country X and country B record exports and imports of goods, respectively, to and from country Y.51
9.21 In many countries, compilers use IMTS as the main source of data to compile the balance of payments goods account. As noted, the IMTS primarily cover goods physically entering (imports) or leaving (exports) the economic territory of a country, which differs from the balance of payments concept of recording goods trade when there is a change of economic ownership between residents and non-residents. It should be noted, that, conceptually, the IMTS 2010 provides recommendations to exclude goods simply being transported through a country (in transit, or in trans-shipment), irrespective of the customs procedure applied, if it is known that their destination is a third country (see IMTS 2010, paragraph 1.42). 52,53
9.22 Compilers should be aware of the extent to which IMTS source data comply with requirements of the BPM6, and make adjustments, as needed, to coverage, classification, timing, and valuation.54 The 50 Transport costs are neglected in this example. Goods under merchanting are valued at transaction prices, not free on board, see BPM6 paragraph 10.44(d).
51 See also BPM6 Box 10.1
52See International Merchandise Trade Statistics (IMTS): Concepts and Definitions 2010, http://www.un.org/en/development/desa/publications/international-merchandise-trade-statistics-concepts-and-definitions-2010-imts-2010.html
53 In regard to partner country attribution, IMTS 2010 recommends that partner country data be recorded for exports against the country of last known destination or the country of consignment, and for imports the country of origin or the country of consignment (IMTS 2010, paragraphs 6.25–6.26). Therefore, in Figure 9.1, country X may declare general merchandise exports to country A (country of consignment) or to country B (country of final destination), but not to partner Y; and country B will declare general merchandise imports from country A (country of consignment) or from country X (country of origin), but not from country Y.
54 See BPM6 Compilation Guide, Chapter 11 (www.imf.org/external/pubs/ft/bop/2007/bop6comp.htm).
backgrounds of these adjustments are presented in Chapter 5. Recording of quasi-transit trade in EU aggregates.
9.23 Figure 9.2 repeats the first example; however, country X and country Y are both outside the EU, and country A and country B are inside the EU. The merchant in country Y buys goods from country X for the price of 100. The goods are first cleared for customs in EU member state A by a local fiscal representative. In addition, he sub-contracts to a specialized enterprise (also in country A) the responsibility to performing quality inspections before the goods are shipped and dispatched to the end-consumer in country B. He is reimbursed for his services by the merchant in country Y with 20 (5 for customs clearance, and 15 for quality management).
9.24 Generally in the EU, national balance of payments data are used for compiling the rest of the world (ROW) account in the integrated economic and financial accounts by institutional sector (integrated accounts); national data are also sent to the International Monetary Fund (IMF) for publication. In contrast, for the production of EU/EA balance of payments aggregates, member states report data to Eurostat and European Central Bank (ECB) following the “community principle”, in which goods transactions are recorded using the economy of origin and the economy of last destination in the case of Extra EU imports/exports, and the economy of consignment in the case of Intra-EU trade.
9.25 Based on EU Regulations, Extrastat captures the value of the goods when they cross the EU borders and are cleared for free circulation. Therefore, in country A, the goods are recorded as imports from country X at a price of 100. When these goods are dispatched to country B at a price of 150 (see example 2), they are declared by country B as imports/arrivals from country A (country of consignment), and not from country X. Intrastat requires the strict application of the country of consignment, both for imports and exports, with the purpose of avoiding double counting (in country A and in country B) of the EU imports from X. The difference between the value reported by country A for the import and the subsequent export to country B is recorded in the transit economy as an import of “branding-quasi-transit trade adjustment” from outside the EU, notably, from the country of the merchant, country Y.55 While “branding” was considered to be part of services by Eurostat and ECB under the BPM5 framework, it will be considered by Eurostat and ECB as part of goods under the BPM6 framework. The imputation made under “branding” assures that the trade balance (goods plus
55 See Eurostat 2015 Eurostat Balance of Payments Vademecum and Guide on The Impact of Globalization on National Accounts, Chapter 9.

Measurement issues associated with quasi-transit trade and similar phenomena
143
Figure 9.2 Recording of quasi-transit trade inside the EU
Country Y EU
Goods under merchanting with X -100 CR General merchandise import (B) from Y 150 DR
Goods under merchanting with B/EU +150 CR Manufacturing services on physical inputs owned by others (A)
15 CR
Net exports of goods under merchanting
50 CR Other business services – legal services (A)
5 CR
Manufacturing services on physical inputs owned by others
15 DR Financial account – net change in external assets (A+B)
130 CR
Other business services – legal services
5 DR
Financial account – net change in external assets
30 DR
Country X
General merchandise export to Y 100 CR
Financial account – net change in external assets
100 DR
services) of the EU/EA aggregates (based on the community principle, and including quasi-transit trade) equals the trade balance of the EU/EA integrated accounts (based on national/BPM6 principles, and excluding quasi-transit trade). The recording of the branding adjustment is illustrated in Figure 9.3. It is important to emphasize that the EU treatment does not have an effect on global discrepancies, as it only affects the EU/EA aggregate figures and not the national balance of payments data published by the IMF.
9.26 For recording merchanting transactions according to BPM6, the price charged by the owner for the sale of the goods should be recorded as the import price. The arrival price in A should be disregarded in the accounts, because no change of ownership or transaction related to the price difference has occurred in country A. As noted, the import value should be the value at dispatch to country B, at the time of change in ownership, as displayed in Figure 9.4.
9.27 A separate transaction constitutes the generating of value in form of services exported from the transit country A to the country of the merchant, for instance in form of trade-related services. These services
may be one of the reasons for the higher goods value when dispatched to member state B. To avoid errors and omissions, they should be recorded as separate transactions in the balance of payments of country A and country Y only in the case where residents of member state A provided services to country Y for which they were compensated.
9.28 Through the combination of Intrastat and Extrastat figures, the EU compilers may be able to record the amount that appropriately reflects the change of ownership from the seller outside the EU to the buyer within the EU. With regard to the services transactions within the transit economy, it may be possible to obtain data from a survey of resident companies specializing in fiscal representation and value added logistics, or to use international transactions reporting system (ITRS) 56 data to generate estimates.
56 The ITRS evolved as a by-product of foreign exchange control systems and differs from country to country depending on a country’s legal framework, accounting systems, and foreign exchange regulations.
Country Y
Country X Country A Country B
150 20
100
physical movement of goods financial settlement
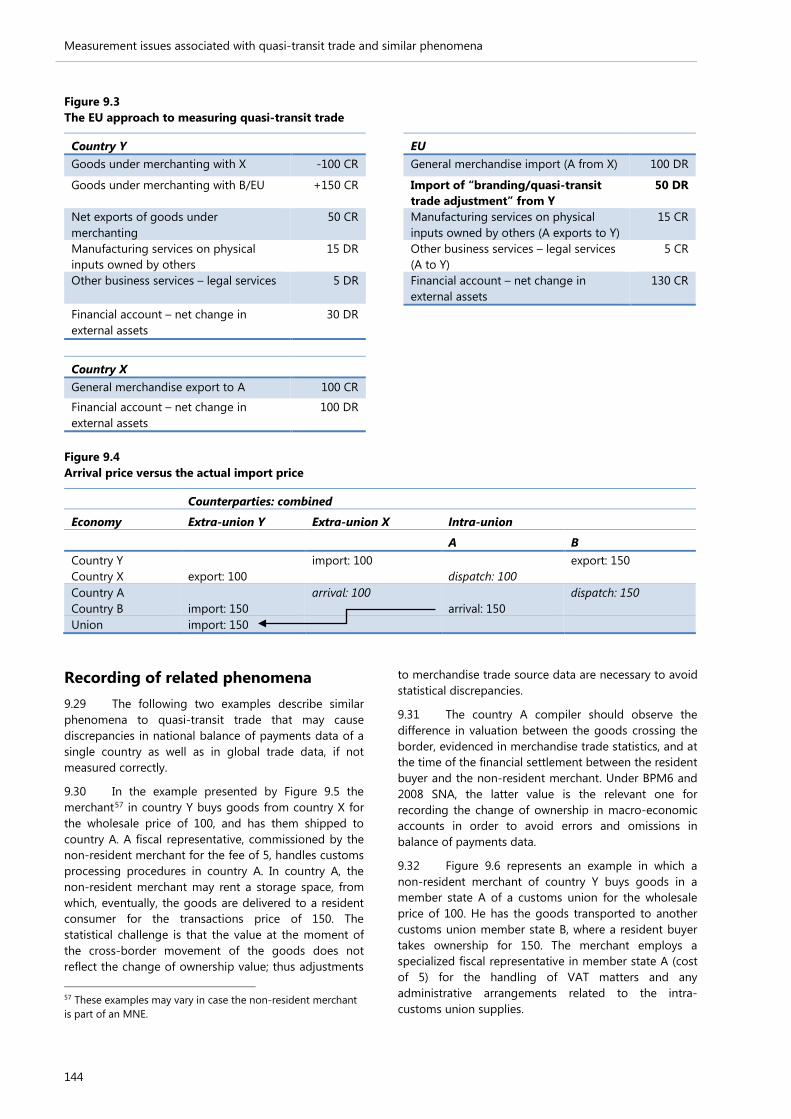
Measurement issues associated with quasi-transit trade and similar phenomena
144
Figure 9.3 The EU approach to measuring quasi-transit trade
Country Y EU
Goods under merchanting with X -100 CR General merchandise import (A from X) 100 DR
Goods under merchanting with B/EU +150 CR Import of “branding/quasi-transit trade adjustment” from Y
50 DR
Net exports of goods under merchanting
50 CR Manufacturing services on physical inputs owned by others (A exports to Y)
15 CR
Manufacturing services on physical inputs owned by others
15 DR Other business services – legal services (A to Y)
5 CR
Other business services – legal services 5 DR Financial account – net change in external assets
130 CR
Financial account – net change in external assets
30 DR
Country X
General merchandise export to A 100 CR
Financial account – net change in external assets
100 DR
Figure 9.4 Arrival price versus the actual import price
Counterparties: combined
Economy Extra-union Y Extra-union X Intra-union A B Country Y import: 100 export: 150 Country X export: 100 dispatch: 100 Country A arrival: 100 dispatch: 150 Country B import: 150 arrival: 150 Union import: 150
Recording of related phenomena 9.29 The following two examples describe similar phenomena to quasi-transit trade that may cause discrepancies in national balance of payments data of a single country as well as in global trade data, if not measured correctly.
9.30 In the example presented by Figure 9.5 the merchant57 in country Y buys goods from country X for the wholesale price of 100, and has them shipped to country A. A fiscal representative, commissioned by the non-resident merchant for the fee of 5, handles customs processing procedures in country A. In country A, the non-resident merchant may rent a storage space, from which, eventually, the goods are delivered to a resident consumer for the transactions price of 150. The statistical challenge is that the value at the moment of the cross-border movement of the goods does not reflect the change of ownership value; thus adjustments 57 These examples may vary in case the non-resident merchant is part of an MNE.
to merchandise trade source data are necessary to avoid statistical discrepancies.
9.31 The country A compiler should observe the difference in valuation between the goods crossing the border, evidenced in merchandise trade statistics, and at the time of the financial settlement between the resident buyer and the non-resident merchant. Under BPM6 and 2008 SNA, the latter value is the relevant one for recording the change of ownership in macro-economic accounts in order to avoid errors and omissions in balance of payments data.
9.32 Figure 9.6 represents an example in which a non-resident merchant of country Y buys goods in a member state A of a customs union for the wholesale price of 100. He has the goods transported to another customs union member state B, where a resident buyer takes ownership for 150. The merchant employs a specialized fiscal representative in member state A (cost of 5) for the handling of VAT matters and any administrative arrangements related to the intra-customs union supplies.
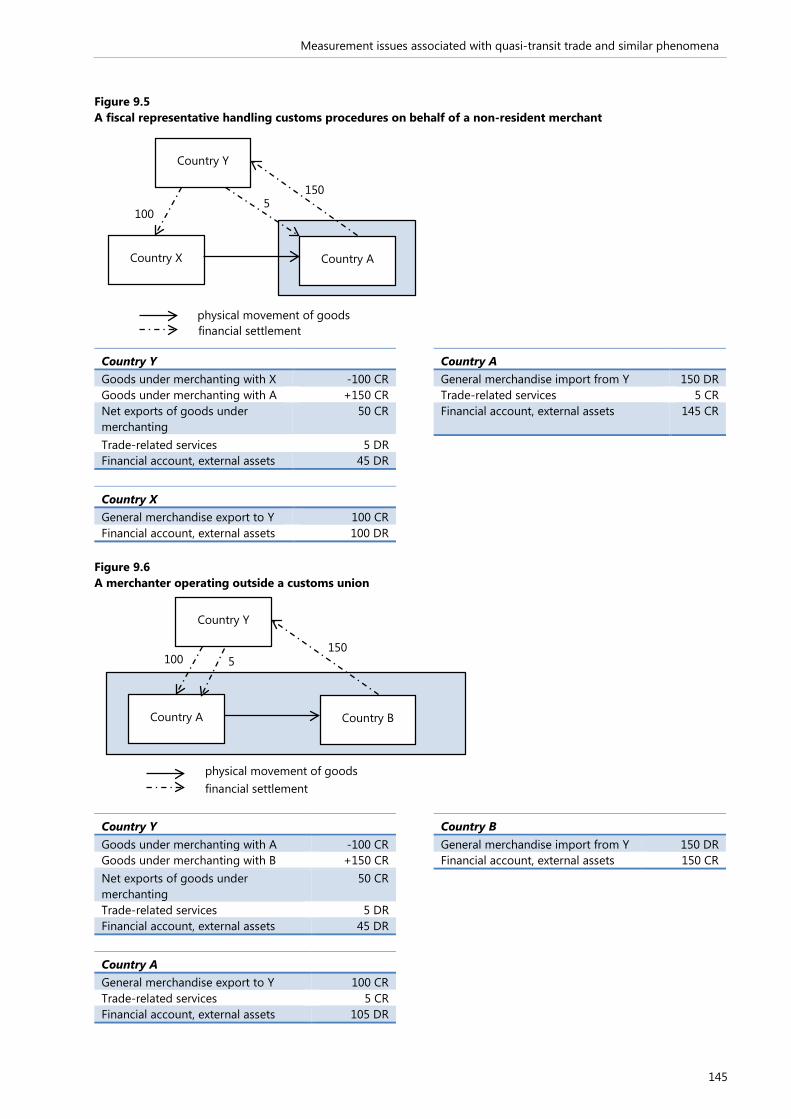
Measurement issues associated with quasi-transit trade and similar phenomena
145
Figure 9.5 A fiscal representative handling customs procedures on behalf of a non-resident merchant
Country Y Country A
Goods under merchanting with X -100 CR General merchandise import from Y 150 DR Goods under merchanting with A +150 CR Trade-related services 5 CR Net exports of goods under merchanting
50 CR Financial account, external assets 145 CR
Trade-related services 5 DR Financial account, external assets 45 DR
Country X
General merchandise export to Y 100 CR Financial account, external assets 100 DR
Figure 9.6 A merchanter operating outside a customs union
Country Y Country B
Goods under merchanting with A -100 CR General merchandise import from Y 150 DR Goods under merchanting with B +150 CR Financial account, external assets 150 CR Net exports of goods under merchanting
50 CR
Trade-related services 5 DR Financial account, external assets 45 DR
Country A
General merchandise export to Y 100 CR Trade-related services 5 CR Financial account, external assets 105 DR
Country Y
Country X Country A
150 5
100
physical movement of goods financial settlement
Country Y
Country A Country B
150 5 100
physical movement of goods financial settlement

Measurement issues associated with quasi-transit trade and similar phenomena
146
9.33 The statistical challenge is to correctly record the export value of 100 by country A to country Y, and an import value of 150 by country B from country Y. When these recordings are made, statistical discrepancies may be avoided.58
Conclusions and recommendations 9.34 In implementing the 2008 SNA and BPM6, compilers are challenged to make necessary adjustments to primary source data, such as IMTS, and integrate new data collection methods, in order to distinguish between goods that change economic ownership and those that are connected with transit and quasi-transit trade. There are several data sources compilers may consult or develop many of which are discussed in Chapter 5. In general, central banks often have responsibility for obtaining data from financial institutions, while national statistical agencies often have responsibility for nonfinancial entities. Involving all the relevant agencies will improve the coverage and accuracy of the compiled estimates. The relevance of two data sources should be highlighted in the context of quasi-transit trade and related phenomena:
a) In many countries, compilers of external sector statistics make use of the ITRS, a data collection system that typically obtains data from banks and enterprises at the level of individual cross-border transactions. The ITRS is focused on collecting transactions going through banks’ correspondent
58 In a related case, the non-resident merchant buys goods in country A and, with assistance from a fiscal representative, on-sells the goods to another resident in country A. The statistical challenge will be to correctly record the import and export values even though the goods never cross the national borders and, thus, are not declared in IMTS. A survey of resident companies providing fiscal representation may be an alternative.
accounts and, thus, provides data on the financial settlement between the resident seller or buyer of goods and the non-resident merchant. The information derived from this data source may be relevant for determining that a change of ownership has occurred (for more information on the ITRS see BPM6 Compilation Guide, Chapter 4, http://www.imf.org/external/pubs/ft/bop/2007/bop6comp.htm).
b) Another potential source of information may be a sample survey of the most relevant companies providing local fiscal representation for international clients. These companies could provide details on the residence of the non-resident transactors, the types and value of services provided to the non-residents, and the size and nature of the elements included in the selling price. In the country of the non-resident, the data may need to be collected directly from the enterprises involved. Such enterprises may be identified through a business register maintained by the national statistical institute (NSI). Model forms are available from the BPM6 Compilation Guide.
9.35 To better approximate the value of the transaction between resident units and non-residents, compilers may also be able to make use of VAT declarations filed on behalf of the non-residents in adjusting the values of imports and exports reported by the resident units.
Merchanting of services
147
Chapter 10 Merchanting of services Introduction 10.1 Most of the global production arrangements introduced in Chapter 2 involve the manufacturing of goods. This chapter pays attention to services related arrangements. Although clear evidence is still limited and scattered, it seems that the international trading of services through an intermediary is a newly emerging business model. The Globalization Guide mentions that merchanting of services is an area where considerable growth in activity has already been observed.
10.2 The international statistical standards, the Balance of Payment and International Investment Position Manual, sixth edition (BPM6) and Manual on Statistics of International Trade in Services (MSITS) 2010, both speak of services merchanting or services subcontracting. This topic is further explored in this chapter, which has a more experimental character compared to other chapters of the Guide. The purpose of this chapter is primarily giving guidance where possible and identifying issues for future research, rather than providing strong recommendations on the recording of merchanting of services.
10.3 A key characteristic of services merchanting and services subcontracting is that the intermediary, the service producer and the service consumer are each located in a different country. Together they form a triangle of services related transactions which may blur a proper recording of these transactions in the balance of payments in several ways. The following accounting issues are further discussed in this chapter (but there are probably more):
a) Are only the producer and the consumer engaged in the purchase/sale of a service, or does the presence of an intermediary lead to a triangular sequence of service transactions?
b) A related question addresses the nature of the output of the intermediary. Does it obtain an implicit or explicit margin, and if so, how should this margin be recorded?
c) What is the best way to present the transactions of a country in which such activities are important or where a relatively large number of international intermediaries of services are active? For example, guidance already provided in BPM6 and MSITS 2010 suggests supplementary tables showing a net recording of services merchanting which may give a
better reflection of transactions for some analytical viewpoints.
10.4 In this chapter an attempt is made to tentatively answer these questions. However, at this point in time, given the lack of compiling experiences it is impossible to provide firm guidance.
10.5 Before starting a discussion on each of these questions, the next section of the chapter summarizes the guidance already given in the international standards. It should be emphasised that although this chapter analyzes the concepts presented in existing statistical frameworks, the intention is not to revise the existing guidelines. It puts forward a number of conceptual arguments that may help clarify the concept of merchanting of services. It also explores ways in which imports and exports of services that are supposedly subject to a merchanting arrangement could be presented in supplementary tables in order to improve the understanding of underlying transactions.
Related concepts in existing international guidelines 10.6 Merchanting of goods is explained in the System of National Accounts 2008 (2008 SNA), BPM6 and in Chapters 2 and 5 of this Guide. Under this global production arrangement the domestic entity buys goods from a supplier abroad and resells them to a customer abroad without further transformation. The key features of this arrangement are that (a) the goods never enter the domestic entity’s territory while the sales are credited to the domestic entity, and (b) the physical form of the goods, while owned by the domestic entity, does not change. Following the recording principles of merchanting in the 2008 SNA and BPM6, the domestic entity’s country records a negative export when the good is acquired and a positive export when the good is sold. The difference between the import and export values represents the trade margin received by the merchant. The details of this recording can be found in the Globalization Guide, Chapter 6.
10.7 The concept of merchanting of services is not entirely new and a reference can already be found in BPM3 (1961). BPM6 and the MSITS 2010 discuss service merchanting or subcontracting of services as being “similar in some ways to merchanting of goods, because the services are purchased and resold” (BPM6 paragraph 10.160 and MSITS 2010 paragraph 3.62) without any significant transformation. Both manuals recommend
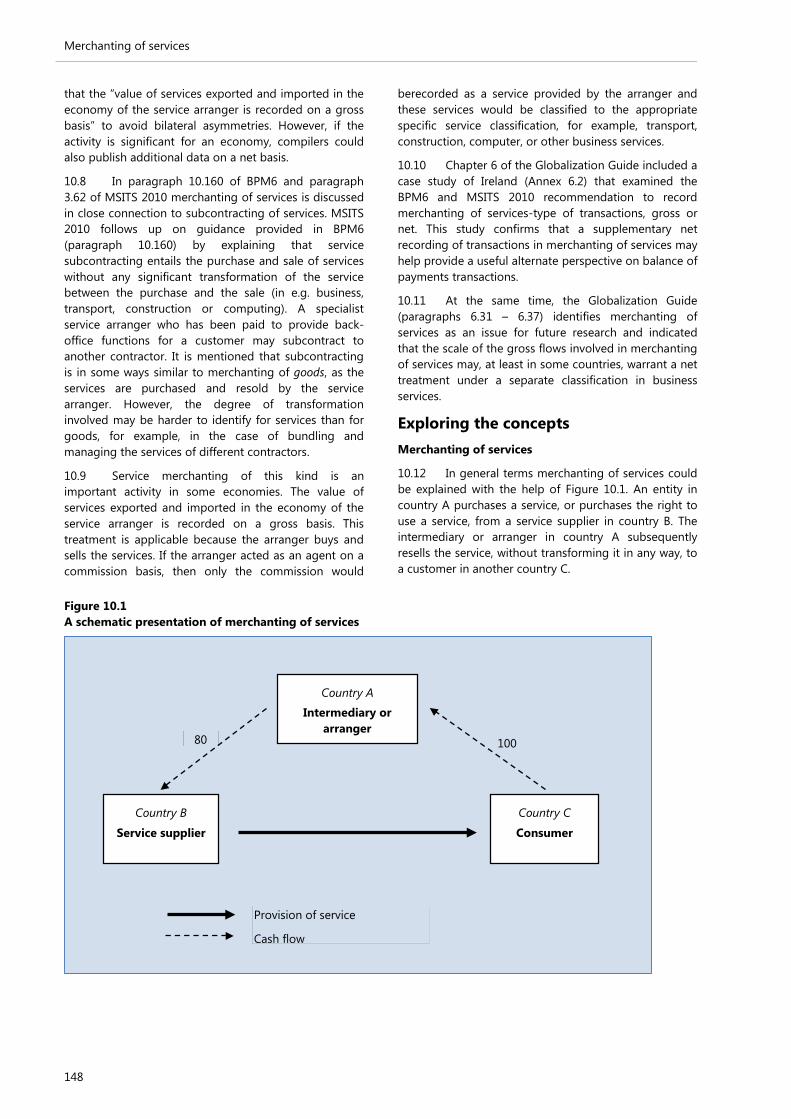
Merchanting of services
148
that the “value of services exported and imported in the economy of the service arranger is recorded on a gross basis” to avoid bilateral asymmetries. However, if the activity is significant for an economy, compilers could also publish additional data on a net basis.
10.8 In paragraph 10.160 of BPM6 and paragraph 3.62 of MSITS 2010 merchanting of services is discussed in close connection to subcontracting of services. MSITS 2010 follows up on guidance provided in BPM6 (paragraph 10.160) by explaining that service subcontracting entails the purchase and sale of services without any significant transformation of the service between the purchase and the sale (in e.g. business, transport, construction or computing). A specialist service arranger who has been paid to provide back-office functions for a customer may subcontract to another contractor. It is mentioned that subcontracting is in some ways similar to merchanting of goods, as the services are purchased and resold by the service arranger. However, the degree of transformation involved may be harder to identify for services than for goods, for example, in the case of bundling and managing the services of different contractors.
10.9 Service merchanting of this kind is an important activity in some economies. The value of services exported and imported in the economy of the service arranger is recorded on a gross basis. This treatment is applicable because the arranger buys and sells the services. If the arranger acted as an agent on a commission basis, then only the commission would
berecorded as a service provided by the arranger and these services would be classified to the appropriate specific service classification, for example, transport, construction, computer, or other business services.
10.10 Chapter 6 of the Globalization Guide included a case study of Ireland (Annex 6.2) that examined the BPM6 and MSITS 2010 recommendation to record merchanting of services-type of transactions, gross or net. This study confirms that a supplementary net recording of transactions in merchanting of services may help provide a useful alternate perspective on balance of payments transactions.
10.11 At the same time, the Globalization Guide (paragraphs 6.31 – 6.37) identifies merchanting of services as an issue for future research and indicated that the scale of the gross flows involved in merchanting of services may, at least in some countries, warrant a net treatment under a separate classification in business services.
Exploring the concepts Merchanting of services
10.12 In general terms merchanting of services could be explained with the help of Figure 10.1. An entity in country A purchases a service, or purchases the right to use a service, from a service supplier in country B. The intermediary or arranger in country A subsequently resells the service, without transforming it in any way, to a customer in another country C.
Figure 10.1 A schematic presentation of merchanting of services
100 80
Country B
Service supplier
Country A
Intermediary or arranger
Country C
Consumer
Provision of service
Cash flow
Merchanting of services
149
10.13 This triangular sequence of service related transactions clearly has a resemblance to merchanting of goods. Merchanting of goods leads to an arrangement in which the traded goods do not cross the borders of the resident country of the trader. In the case of merchanting of services, the intermediary arranges the supply of a service without being engaged in the actual operation of the service. This is highlighted by the service flow in Figure 10.1 moving directly from country B to country C.
10.14 Another similarity is that both merchanting of goods and merchanting of services lead to the generation of a (trade) margin (20) which is the difference between the purchase (80) and sales value (100).
10.15 A crucial step in this investigation involves identifying the “business models” that underlie a merchanting of services arrangement. The evidence is currently too scarce to provide definitive answers, but a priori the following models could be envisaged (without the assertion of being exhaustive):
a) As mentioned, BPM6 and MSITS 2010 in particular discuss merchanting of services in connection to subcontracting. The degree of transformation is considered decisive in determining whether or not the service is actually traded, i.e. bought and resold without any change in the characteristics of the service. Some additional reference to other international standards (International Standard Industrial Classification of All Economic Activities Revision 4 (ISIC Rev.4)) is given below to more closely examine the notion of merchanting of services in the context of subcontracting.
b) A second possible business model is the distribution of intellectual property products (IPP). A head office in country A, creates a unit in country B with the main purpose of distributing copies (or licences to use) to yet another range of countries. Such a model is expected to be applied particularly inside the multinational enterprise (MNE) and may be tax driven, in the sense that the distributor is expected to be located in a country (B) having a favourable tax jurisdiction.
c) A third model is an intermediary that functions as an agent with the competency of bringing together foreign producers and foreign consumers of a particular service; however, without working on a commission basis. This model comes closest to the “classic” model of merchanting of goods, but it is probably limited to some specific services sectors. At the time of writing, although there were indications that such a business model existed, no firm evidence was available as such information was not collected, nor compiled.
10.16 It is important to note that a net recording of merchanting of goods in the balance of payments is particularly motivated by the possible existence of
speculative trade (gold, grain) and the huge expansion of imports and exports that may result from this. It is unlikely that such arbitrage opportunities exist in the area of service trading.
10.17 The possible existence of merchanting in services is further evaluated below by looking at seemingly related trade activities, and by looking at the main characteristics of services that could be subject to a merchanting arrangement. This evaluation is based on guidance given in the current international standards.
Other global services arrangements
10.18 The international standards provide guidance on international services transactions which may have a correspondence with merchanting of services. For example, BPM6 clarifies the role of agents and the nature of transactions they are undertaking. Paragraph 3.10 states that an agent arranges a transaction to be carried out between two other units in return for a fee from one or both parties to the transaction. In such a case, the transaction is recorded exclusively in the accounts of the two parties engaging in the transaction and not in the accounts of the agent facilitating the transaction. In other words, the agent obtains a fee which is not the same as the trade margin obtained by a merchant from purchasing and selling goods or services.
10.19 MSITS 2010 refers to a separate category for trade-related services in its classification of balance of payments services transactions (consistent with BPM6 definition). Trade-related services cover commissions on goods and service transactions payable to merchants, commodity brokers, dealers, auctioneers and commission agents. Again, these commissions should not be confused with margins obtained from merchanting, or trading more generally.
10.20 As mentioned, BPM6 and MSITS introduce merchanting of services in close connection to subcontracting of services. ISIC Rev.4 refers to subcontracting in the context of outsourcing which is explained as a contractual agreement according to which the principal requires the contractor to carry out a specific production process. ISIC indicates (paragraph 136) that outsourcing activities on a fee or contract basis may apply to both goods and services. ISIC makes the following recommendation about the principal of a subcontracting arrangement (paragraph 142): “In general, if the principal outsources the complete production process of a good or service, it is classified as if it were carrying out the production process itself. This applies in particular to all service-producing activities, including construction”. In other words, a principal outsourcing part (or all) of its production of services to a contractor abroad does not become a trader (of services). The principal is regarded as being the producer of the service, and this classification principle is in line with the gross recording of related foreign purchases and sales of services in the balance of payments as recommended by BPM6.

Merchanting of services
150
Figure 10.2 A schematic presentation of subcontracting of services
10.21 A principal may subcontract parts of its final output. For example, the complexity of large software development projects can be such that dedicated software developers must be subcontracted for taking care of particular parts of the project. The principal is responsible for bringing the different parts together, and takes the responsibility of the final product. Under such conditions the principal cannot be considered to act as a trader and the purchases of software development services needs to be recorded as intermediate consumption. The subcontracting model is illustrated in Figure 10.2.
10.22 Another related example is bundling of services. Generally it may be difficult to separate bundling of services from transformation which implies that agents involved in bundling of services should generally not be regarded as traders (or engaged in merchanting) of services. A reference to the European system of national and regional accounts 2010 (ESA 2010), paragraph 3.62, may help support this point of view. In ESA 2010 travel agencies and tour operator services are distinguished by the fact that travel agency services amount only to intermediation on behalf of the traveller, while tour operators create a new product called a tour, in which travel, accommodation and entertainment services are bundled. This means that bundling of services should be understood as a form of transformation of services. In order to separately identify individually the embodied tourism related services, unbundling of package tours is recommended in the Recommended Framework on Tourism Satellite Accounts (paragraph 3.49). In case this unbundling is feasible, the tour operator could be identified as being engaged in merchanting of tourism related services.
Characteristics of services subject to a merchanting arrangement
10.23 BPM6 and MSITS 2010 follow the 2008 SNA definition of services (2008 SNA, paragraph 6.17): “Services are the result of a production activity that changes the conditions of the consuming units, or facilitates the exchange of products or financial assets. These types of services may be described as change-effecting services and margin services, respectively.” Change-effecting services, or transformation services, change the condition of (consumer) goods, or the physical or mental condition of persons. Margin services result when one institutional unit facilitates the change of ownership of goods, knowledge-capturing products, some services or financial assets between two other institutional units. Margin services are provided by wholesalers and retailers and by many types of financial institutions.
10.24 Usually, services are not separate entities over which ownership rights can be established. They cannot be traded separately from their production and by the time their production is completed, they must have been provided to the consumers. In other words, they cannot be held in inventory. A clear exception to this principle is IPPs which can be subject to trading and storage.
10.25 Given the fact that transformation and margin services cannot be stored, a service transaction should be recorded at the moment of delivery and consumption. The provision of services should be recorded on an accrual basis in each accounting period, i.e. they should be recorded as they are provided, not when payments are made. This would imply that the service is indeed directly delivered by the producer in
Country B
Software developer B
Country A Software developer A: the principal
Country C
Customer C
Provision of consultancy services
Cash flow

Merchanting of services
151
country B to the consumer in country C, as pointed out in Figure 10.1.
10.26 Otherwise, the role of the intermediary is bringing the producer and consumer of services together. The intermediary purchases the service on behalf of a client without actually consuming this service himself. This pragmatic view is supported by the international standards, for example when recording the tourism related services of tour operators. Similarly, in MSITS 2010 (paragraph 3.3) services transactions are defined with respect to the residence of transactors, without a distinction with regard to the way the service is actually supplied (and consumed). Going back to Figure 10.1, according to MSITS the service is indeed traded (or purchased and resold) by the intermediary in country A. This means that the model of merchanting of services is not restricted to IPPs but may also apply to transformation services.
Tentative conclusions
10.27 The concept of merchanting of services is not well explained in the current international standards. The recommendations of the industrial classification, national accounts and balance of payments all point in the direction of a gross recording (instead of trade margins), and the units engaged in merchanting type of transactions should be regarded as the producers of the services they obtained from other suppliers.
10.28 Certainly, this does not mean that merchanting of service is a non-existent phenomenon that can be ignored altogether by national accountants and balance of payments compilers. Under specific conditions explored in this section, merchanting of services can be understood as the distribution of services, and the principals of these arrangements could be regarded as traders of services. This alternative point of view is supported by the BPM6 and the MSITS 2010 by acknowledging that if the activity is significant for an economy, information on merchanting of trade in services based on a net (instead of gross) recording could be provided on a supplementary basis. The next section explores how such a net recording could be accomplished and discusses its advantages and disadvantages.
Recording merchanting of services on a gross or a net basis 10.29 As already noted, one of the important reasons for recommending a net recording basis for merchanting of goods is that it eliminates potential problems associated with recording international transactions of commodity traders. Commodity traders often buy and almost immediately resell commodities (such as gold or grain) in order to generate short-term trading profits. The net basis of recording eliminates the
distortion in goods imports and exports that would otherwise exist in commodity trading centres if gross transactions in tradable commodities were included in goods imports and exports.
10.30 Similar problems will not arise in the domain of services, i.e. the goal of service intermediaries is usually not generating short-term trading profits. However the gross recording of services transactions in the country of the intermediary can, for some analytical purposes, still be considered distorting the picture of the actual production of services and the international trade in services taking place in that country. Further expansion of merchanting of services as a new business model could generate shifts in a country’s bilateral trade balances. Understanding the macro-economic effects of these shifts seems to have policy relevance beyond doubt.
10.31 Either gross or net data may serve certain analytic purposes. The significance of merchanting of services can also be emphasised quite easily by classifying related trade flows as separate ‘of which’ items or by presenting net information in supplementary tables.
10.32 Disadvantages of a net recording are that these may understate exposures to counterparties (suppliers and customers), and eliminate bilateral detail, because the net figure is typically recorded by merchants against the country to whom they export, and not against the country from whom they import and, thus, cause bilateral asymmetries in trade data.
10.33 One way to overcome some of these negative side effects is to carefully define merchanting of services. According to BPM6 (paragraph 10.44), for merchanting of goods, the acquisition of goods by merchants is shown under goods as a negative export of the economy of the merchant, and the sale of goods is shown under goods sold under merchanting as a positive export of the economy of the merchant. The difference between sales over purchases of goods for merchanting is shown as the item “net exports of goods under merchanting”.
10.34 As presented in Table 10.1, this format can be adopted to merchanting of services in the supplementary tables, as recommended by BPM6. The figures in the table correspond to those in Figure 10.1. The advantage of both showing “services acquired under merchanting” (as a negative item on the credits side) and “net exports of services under merchanting” is that the trade relationships at bilateral level are maintained. The net item shows the margin obtained by the intermediary in country A. The gross flows correspond to how these intermediaries are represented in the regular balance of payments and in the national accounts.

Merchanting of services
152
Table 10.1 Recording merchanting of services in supplementary tables
Country A Country B Country C Exports
Services 20 80
Net exports of services under merchanting 20
Services acquired under merchanting -.80
Services sold under merchanting 100
Imports
Services 100
Some evidence
10.35 The Globalization Guide indicates that certain examples in telecommunications and internet services could be placed under the heading of merchanting of services. In this section some additional evidence is provided on the international trade in computer software and transformation services.
Computer software
10.36 Previously the example of distribution of computer software was addressed as a possible example of merchanting of services. It is possible that other types of IPPs are subject to similar kinds of arrangements. The “intermediary” may obtain a licence to distribute copies of computer software to customers in a designated area. This intermediary may resell this right in whole or in part. For example, it might sell exclusive rights to two different final purchasers, each covering only a portion of the designated area covered by the licensing agreement purchased by the merchant. The fact that the intermediary has been granted the rights to resell rights
to use, i.e. selling copies, the software to multiple customers does not necessarily interfere with the general principles of regarding the transactions as a merchanting arrangement. One may argue that the suggested intermediary is not engaged in any transformation of the service provided to customers in case the characteristics of the software product remain unchanged.
10.37 The above mentioned arrangement may typically occur inside an MNE. A priori there is no reason to reject the possible presence of a merchanting of services arrangement inside the MNE group. However, it may be difficult to determine what kind of service the intermediary is actually providing, particularly because of problems with identifying economic ownership of IPPs inside the MNE (cf. Chapter 4). The intermediary could be an IPP holding special purpose entity (SPE) (a license to sell copies) when the main purpose of such an entity is minimising tax payments.
Case study 10.1 Merchanting of goods and software and telecommunication services in Ireland
In some countries merchanting is having a substantial influence on the bilateral trade, a striking example in this respect being Ireland which is illustrated by the following table.
Merchanting related transactions in Ireland, 2011, billion euros
Merchanting Debit Credit NET Goods 47.3 52.5 5.2 Services 7.4 8.2 0.8 Computer software (services) 7.4 8.2 0.8 Telecommunications 0.017 0.04 0.023
Total 54.7 60.7 6
Given that Ireland's exports of services for 2011 were around USD 112 billion and imports approximately USD 116 billion (BPM5 basis) if a gross treatment would be applied for the transactions relating to merchanting of services, this would increase its exports of services by 7 and its imports by 6 per cent. This would also influence income flows. If a gross treatment was to be kept (as indicated in annex 6.2 of the Globalization Guide) a decision by a major MNE to transfer the role of the entity in Ireland, which serves to route the various transactions within the group to another country, may result in a large discontinuity in the service data and profit/loss information.
Merchanting of services
153
10.38 The intermediary is clearly not engaged in a merchanting type of arrangement in the case where a commission is being received from a parent for carrying out the software distribution. In such cases, the parent will directly obtain the turnover from the software sales. The intermediary is not expected to obtain economic ownership of the services distributed to customers.
10.39 Another case of merchanting of software is when an entity located in A has a web shop which also is value added tax (VAT) registered outside A and provides software from a producer in B to customers in C. The cases when VAT is paid to foreign tax authorities for transactions of software produced and consumed outside A may qualify as merchanting.
Transformation services
10.40 Besides computer software, other types of services may be distributed via online transactions or via business hubs such as Asia. Such hubs are used by overseas service providers as a marketing and sourcing platform for doing business with other economies of the region, as well as a springboard for service providers of other countries of the region for doing business worldwide.
10.41 Some specialized companies will also bundle various types of services (and goods) and the final client will only make one payment for a package of goods and services (which will also cover the service fee for arranging these products). If it is not possible to unbundle the various components it may be a strong indication that the client is buying a different product than the ones the intermediary initially paid for. However, the Central Product Classification (CPC) may not necessarily identify these bundled products as a separate product. In that case the full amounts should be recorded as transactions of the arranger. Without significant bundling or transformation such activities may be identified as merchanting of services.
10.42 Other examples may relate to performing arts activities, where talent agents (intermediaries) may bill and collect the amounts due to the performance of actors, and then remit the net amount (i.e. retaining a commission) to the actors. In this example, it is possible that merchanting of services occurred. However, if the arranger sold a performance but still holds intellectual property rights (such as a recording of that performance) that could be rented or sold to multiple customers, this should not be regarded as merchanting of services.
10.43 In any case, merchanting of services can only occur in case the intermediary is buying the service. For example, the business hubs providing marketing and sourcing platforms are operating under merchanting of services regimes if they do buy the services being marketed in the platform. Similarly, talent agents are engaging in merchanting of services if they buy up the performance of the actors in the first place.
Concluding remarks 10.44 This chapter is an attempt at conceptualizing statistically "merchanting of services". Further discussions are needed to make this concept sound and statistically operational. This requires additional evidence such as case studies which are needed to help sizing the respective trade flows and to judge their possible impact in the context of globalization.
10.45 Despite several measurement uncertainties, it seems merchanting of services is of increasing importance for several major service trading economies throughout the world. Once the conceptual underpinnings are more precisely defined, it may be worthwhile undertaking a survey of compilers to assess the size of merchanting of services in several of these countries. At present the existence of merchanting of services related activities is difficult to evaluate, particularly since their separate identification is currently not required in the relevant international manuals (e.g. BPM6, MSITS 2010).
10.46 If in questionnaires respondents report substantial outlays and receipts for specific services this may indicate the presence of a case of merchanting of services. Similarly, the respondents may report relatively minor local costs which equally points in this direction. The development of more advanced detection methods is clearly an area for future research. Paragraph 6.27 of the Globalization Guide provides some guidelines for identifying entities active in the merchanting of goods. This guidance could be used as a point of departure for detecting cases of merchanting of services.
10.47 In some countries such as Ireland, merchanting related service flows are already separately identified since they significantly influence the international trade picture. In such cases, supplementary tables may show merchanting of services on a net basis, following the principles of Table 10.1. As mentioned, such supplementary presentations are already proposed in BPM6.
10.48 The preliminary findings in this chapter are summarized as follows:
a) The concept of merchanting of services is not well explained by the current international standards. The recommendations on the industrial classification, national accounting and balance of payments all point in the direction of a gross recording.
b) There is evidence from a limited number of countries that merchanting of services may substantially influence bilateral trade flows. For these countries it is recommended to present this new phenomenon in supplementary tables on a net basis (cf. Table 10.1).
c) An item for future research is the examination of new cases, and based on this new evidence, the

Merchanting of services
154
further refinement of detection methods and compilation guidance which should address, among other things, the main characteristics of services arrangers in terms of service transformation, the correct measurement of trade margins and income
obtained from commission fees. The examination of new evidence could be supported by examining the significance of merchanting of services in a range of countries in the various economic regions.
Conclusions and recommendations for future work
155
Chapter 11 Conclusions and recommendations for future work Introduction 11.1 Each chapter in the Guide contains a detailed list of recommendations. This chapter brings the most important conclusions together, summarizes the main findings of the Task Force on Measuring Global Production (TFGP) and provides action points for future work.
Key conclusions and recommendations Recommendation 1: A typology of global production arrangements
11.2 Chapter 2 provides a typology of global production arrangements. The main purpose of this typology is enhancing international comparability by helping national accountants and balance of payments compilers to determine:
a) The roles of the various actors in a global value chain;
b) Who are the economic owners of inputs, outputs and assets along the production chain;
c) The nature of transactions taking place inside the global value chain.
11.3 It is advised to keep the typology up to date with emerging types of global production arrangements and to test the usefulness of the existing typology on the basis of new case studies.
11.4 The typology for arrangements involving the manufacturing of goods is comprehensively developed. However, global production has also entered the domain of services. The TFGP discussion on ‘merchanting of services’, as reflected in Chapter 10, shows that further research in this area is needed, exploring in more detail the business models followed by so-called international service arrangers. Examination of new cases is recommended as future work. At this point in time, the obtained evidence on the international value chains of services was too limited to develop further guidance.
11.5 In updating and advancing the typology it is advised that national accountants and balance of payments compilers continue to closely cooperate with economic classification experts, business register specialists and experts in the field of the most relevant
source statistics (e.g. business surveys, foreign affiliates statistics (FATS), foreign direct investment (FDI), international merchandise trade statistics (IMTS), statistics of international trade in services (SITS), research and development (R&D)).
Recommendation 2: Industrial classification of factoryless goods producers and recording of their transactions
11.6 Factoryless goods producers (FGP) are producers outsourcing their manufacturing activities but owning the underlying intellectual property products (IPP) and controlling the outcome of the production process. A strict interpretation of the International Standard Industrial Classification of All Economic Activities, Revision 4 (ISIC Rev.4) means that an FGP should be classified as a distributor if the FGP does not provide (and own) the material inputs subject to transformation, even though the FGP provides the technical specifications of the output and owns and supplies other critical inputs such as the IPPs used in production.
11.7 There is an emerging consensus among national accountants and balance of payments compilers that the current treatment of FGPs is not satisfactory. The provision of critical inputs such as IPP services (i.e. the blueprints of products) implies that FGPs are engaged in activities other than trade. Therefore, the criterion of ownership of material inputs in ISIC Rev.4 should be broadened to include critical service inputs such as those related to IPPs. While Chapter 2 of the Guide puts forward an alternative view that classifies FGPs as manufacturers, arguments that FGPs are neither distributors nor manufacturers but a totally new category of producers, which at present are not separately identified in the current industry classifications, also exist. As a first step it is recommended to develop rules for identification of FGPs in order to allow for better analysis of their characteristics. The separate identification will facilitate the testing of the alternative accounting treatment presented in Chapter 2.
11.8 The Guide explores the borderline between FGPs and distributors by providing further guidance on how to examine the significance of IPPs in the production activities of such firms.
Conclusions and recommendations for future work
156
11.9 The recommendations on FGPs were discussed in May 2013 and in September 2014 by the Advisory Expert Group on National Accounts. Their conclusions are in line with those reflected above. Priority area for further work is to collect more practical experience from countries that will allow further elaboration of the proposed criteria for classification of FGPs and recording of their transactions in national and balance of payments accounts.
11.10 Nowadays most high-tech products have product (the hardware) and service (software, R&D) components which are hard to disentangle. Similarly, the output of companies active in a global value chain may be goods or services related. The distinction between goods and services, and between goods and services providers may often be blurred. Nonetheless, under current statistical standards, it is apparent that the output of the contractor should usually be recorded in goods (and not in services), if the contractor owns the material supplies and material inputs that it transforms into manufactured products. The goods-services distinction should be further examined in future revisions of the System of National Accounts (SNA), Balance of Payment and International Investment Position Manual (BPM), ISIC and Central Product Classification (CPC).
Recommendation 3: Economic ownership - theory and practice
11.11 The 2008 SNA recommends that imports and exports should be recorded on a strict change of ownership basis (2008 SNA, A3.155). The recommended recording in the 2008 SNA and BPM6 of manufacturing services on physical inputs owned by others (i.e. goods for processing) and merchanting are brought in agreement with this general principle. This new guidance leads to better coherence of the national accounts and balance of payments.
11.12 However, a strict recording of international transactions on a transfer of ownership basis can be challenging in the following cases:
a) Multinational enterprises (MNE) may set up their geographical structure using legal entities such as special purpose entities (SPE) which allows them to maximize profits after taxation. The parent may assign legal ownership of IPPs to such SPEs which otherwise do not contribute to the MNE´s production activities. National accountants will not easily be able to deviate from such legal arrangements. Usually they will be forced to follow reported earnings on IPP investment, despite the fact that these SPEs may not be considered as the economic owners according to the 2008 SNA principles. The TFGP recommends explicitly identifying these “artificial” IPP services in the national accounts or balance of payments, for example by presenting them in supplementary tables, to inform users about the significance of
these flows. The precise design of such supplementary tables is a topic for future research.
b) Even without the existence of SPEs, the principles of economic ownership of IPPs are sometimes difficult to apply inside MNEs. Inside MNEs, the creation of IPPs, their legal ownership and their economic use in production may involve different entities that are resident in a broad range of countries. This seriously complicates the recording of IPP related trade flows. The decision tree introduced in Chapter 4 provides guidance in properly linking IPP use to the individual economic activities inside global value chains. However, the information required to make solid judgements may still be difficult to obtain.
c) Recording the output of multiterritory enterprises, or similar enterprises such as construction companies carrying out large projects abroad, on a country-by-country basis may require the creation of notional units and prorating of transactions and asset ownership. Applying the principles of economic ownership in the context of multiterritory enterprises may be challenging. Practical guidance is given in Chapter 8 where it is advised to carry out prorating as a concerted exercise of all the national statistical institutes (NSI) involved. Also it is advised to continue the exchange of country experiences with recording the activities of multiterritory enterprises.
11.13 Globalization is an on-going process that will expectedly lead to new types of global production arrangements. This implies that accounting methods, including the rules of assigning economic ownership in global value chains, must be adapted accordingly. Maintaining regular dialogue between the national accounts community and the International Accounting Standards Board (IASB) will allow following and adapting to new developments in business accounting. The new work on reconsideration of the units used in national accounts launched by the Inter-Secretariat Working Group on National Accounts (ISWGNA) is another development to which the recommendations of this Guide may need to be aligned in the future.
Recommendation 4: New data sources needed to measure global production
11.14 Chapter 5 discusses the changing accounting conventions between the 1993 and 2008 SNA, and differences between the fifth and sixth editions of the BPM, with respect to recording processing of goods owned by others, merchanting and FGPs. While the changes in concepts may be well understood, the required modifications in data collection are not always straightforward.
11.15 Compared to the 2008 SNA and BPM6 the IMTS 2010 have a different conceptual basis, i.e. recording of imports and exports of goods when they physically cross the border. Reconciling IMTS statistics with the imports and exports required in national

Conclusions and recommendations for future work
157
accounts and balance of payment involves several steps. Chapter 5 discusses these steps for inward and outward processing, merchanting and factoryless goods production, highlighting the data requirements for each. Depending on circumstances in individual countries, these data may not be readily available and adjustments in data collection are recommended. More specifically, the additional data needs relate to:
a) Identifying import and export of goods in IMTS statistics which are not subject to transfer of economic ownership (goods sent abroad for processing or repair) and which should not be recorded as imports and exports in the national accounts or balance of payments. In addition to processing other corrections in IMTS may be needed, particularly when shipped goods are not subject to change in ownership (e.g. goods sent for repair).
b) Identifying purchases and sales of goods abroad which need to be recorded as imports and exports in the national accounts and balance of payments, but which remain unobserved in IMTS statistics, as these goods do not physically cross the borders of the domestic economic territory.
c) The design of business surveys should be such that the principle of ownership, and not that of territory, is used as a key concept in questions on inventories held by the surveyed unit. Changes in inventories of goods held abroad need to be recorded in supply-use tables. Similarly inventories held abroad need to be recorded in the national balance sheets. The explicit recording of inventories held abroad (apart from domestically held inventories) is also recommended for measuring trade margins correctly (excluding holding gains or losses).
d) The data collection on international trade in services is a challenge in many countries. It is advised to include explicit questions about intra-group services in international trade in services surveys, depending of course on the relative size of MNE activities and related output or consumption of intra-group services. Respondents of MNE affiliated companies could be asked to report payments as contributions from affiliated enterprises for management services, which are not reported under any other heading. The refined classification as presented in MSITS 2010 provides a solid point of departure. The funding questions in the R&D survey are considered a second best alternative to obtain information on R&D related international trade flows.
11.16 In many countries, a sound coverage of the items above (a. to d.) requires expanding the scope of existing surveys. Aspects of global production may be difficult to measure with existing sets of source statistics, or may even remain unobserved altogether (e.g. transactions in goods under merchanting, inventories held abroad). Yet, many NSIs are facing strong
constraints in this regard. The optimal use of existing data may be the only feasible way forward. One important step in this direction is data validation by bringing together, and reconciling, the results from business surveys, merchandise trade statistics and the international trade in services statistics. This should preferably be done on the basis of an integrated business register that allows bridging the statistical business register and the customs register. It is also recommended to utilize existing customs data or information from the tax authorities to the fullest extent.
Recommendation 5: New methods to measure global production
11.17 With the help of a questionnaire, the TFGP collected information on operational aspects of so-called large and complex enterprises units (LCU), which were set up in recent years by several NSIs. These LCUs can be efficient in collecting and compiling data on the largest and most complex MNEs in a consistent and effective way. Typical LCU activities include integrated data collection (including register data), data compilation and consistency analysis. In the context of further improving the performance of LCUs, the TFGP recommends developing sufficient cooperation mechanisms and collaboration among producers of statistics, both nationally and internationally.
11.18 Issues related to global production may oblige NSI’s to combine efforts in completing their views on MNEs and global production and international trade more generally. While ways of international cooperation and coordination have not been examined in detail by the TFGP, the following areas of further development were identified:
a) The development of common international business registers for the most complex MNEs (such as the Euro Groups Register) will assist in assigning the economic activities of the enterprises on a country-by-country basis in a mutually consistent way. Such registers may become the platform supporting the production of micro data based statistics on globalization and may assist in identifying the economic relationships and transactions taking place between the various member units of an MNE. The Guidelines on Statistical Business Registers (UNECE, 2015) provide recommendations and practical guidance on establishing and maintaining statistical business registers, targeting both developed and less developed statistical systems. The Guidelines also give some instructions on how to handle MNEs and enterprise groups in a systematic way. However, further work to address issues related to globalization and particularly aspects of global production is needed and has been brought into the future research agenda on statistical business registers.
b) Improving the recording of intra-company services flows of MNEs in international trade in services

Conclusions and recommendations for future work
158
statistics could be a joint effort by NSIs. The IPP ownership decision tree presented in Chapter 4 shows that the producers of IPPs are much easier to identify than the users. When the producing and consuming units of intra-company services are not situated in the same country, the observation and recording of international flows of intra-company services should preferably be coordinated between the NSIs, at least for the largest MNEs, in order to avoid asymmetries in trade statistics. Confidentiality policies and existing restrictions to data exchange have to be taken into account. Further work is needed to explore the possibilities for exchanging micro data between NSIs strictly for statistical purposes such as data validation. International organisations should consider what role they could play to facilitate this process.
c) A clear request expressed by national accounst and balance of payments compilers is to establish a permanent forum where country experts could share information and experiences on measurement issues related to global production arrangements. Globalization will continue to lead to new global production related issues that have not been examined so far. Such a forum could support stocktaking of new cases, identifying best practices and further harmonization of accounting practices.
Recommendation 6: Price and volume measurement
11.19 One of the key indicators of national accounting is economic growth, i.e. the volume growth of gross domestic product (GDP) and its components such as output, (intermediate) consumption, capital formation, imports and exports. Changes in these components are systematically decomposed in price and volume changes. Price and volume measurement in light of globalization is not an issue examined in the Guide, although it is acknowledged that this is important. It is recommended that the international guidelines for measuring prices (and volumes) should be adapted to some of the key characteristics of the output of global producers.
11.20 Inevitably this work will require the engagement of price statisticians. Representative producer prices indices (PPI) as laid down in the Producer Price Index Manual (PPIM) 2004 and the Export and Import Price Index Manual (2009) are essential in this context. The representativeness of price indices is determined by their coverage in terms of product features and geographic boundaries. According to PPIM 2004 (1.177) a PPI could cover all output (domestic and exports), or be limited to domestic output only, depending on representativeness.
11.21 Global production may involve (imports and exports of) goods and services which have different characteristics than those typically produced for the domestic market. The following list of goods and services should be part of a future research agenda on
price and volume measurement in the context of global production:
a) Industrial processing services;
b) The output of principal and contract producers in an FGP arrangement;
c) Trade services in connection to merchanting;
d) Head office services;
e) Other intra-company services;
f) IPP related services (specifically R&D);
g) Inventories held abroad.
Recommendation 7: Analysing trade in value added amplifies the need of high quality statistics on global production
11.22 One key requirement of carrying out input-output analysis for measuring trade in value added is reconciling trade statistics with input-output tables at bilateral level. Key in this process is avoiding (or otherwise eliminating) asymmetries in trade statistics. In addition, the analysis of global value chains requires that national statistics build in a global dimension from the outset. This could be done by developing aggregations, not only on the basis of industrial classification, but also on the basis of business functions, for example by showing separate sub-groupings of processors, FGPs, foreign owned firms, etc. Doing so would allow countries to construct supply-use tables, broken down by these new groupings, that would certainly have a higher degree of homogeneity, compared to aggregations which focus only the industrial classification of firms, where, and as this Guide illustrates, there exists considerable heterogeneity. This supplementary classification, which is expected to help identifying the business functions along the global value chain, is an issue for future research.
Organization of future work 11.23 As a follow up to the Guide, it is recommended to set up an information exchange platform for stocktaking of complex cases, identifying best practices and further harmonization of accounting practices. Part of this work will also encompass testing and further refining or expanding the typology of global production arrangements presented in Chapter 2 based on the examination of new case studies.
11.24 Similarly, continued research in the domain on trade in value added is expected to expand our knowledge on global production, particularly in respect to the proposed classification of business functions.
11.25 The proposed platform could also be used for:
a) The exchange of practical experience on data collection, compilation methods, organizational issues and the involvement and operation of LCUs;
b) International data confrontations;

Conclusions and recommendations for future work
159
c) Improving, in cooperation with price statisticians, the price and volume measurement of the characteristic transactions inside global production arrangements.
11.26 The platform could take the form of face-to-face meetings but may also include a (protected) website for the collection and dissemination of case studies and new methodology.
11.27 It is suggested to revise the Guide to Measuring Global Production once new and supplementary evidence requires an update of its current version.
Proposed list of action points addressing future research 11.28 In addition to establishing the above-mentioned platform, this section summarizes all other action points in the recommendations highlighting suggestions for future international cooperation and research.
a) The typology of global production arrangements should frequently be updated based on the examination of new case studies, particularly in the area of FGPs and global services producers, combining all relevant expertise in the areas of e.g. national accounts, balance of payments, business registers, economic classifications, FATS, FDI, IMTS, SITS and R&D. This also requires maintaining a regular dialogue between the national accounts community and IASB which will allow following and adapting to new developments in business accounting.
b) The TFGP’s work on the economic classification and accounting treatment of FGPs is not yet finalised and requires follow up. Immediate steps are developing rules for identification of FGPs in ISIC
classes and testing by NSIs of the alternative accounting recommendations provided in Chapter 2. Ultimately, a firm decision on the classification and recording of FGPs is needed in the course of future updates of the ISIC, the SNA and the BPM.
c) As the goods-services distinction inside global production becomes less and less clear, this distinction should be examined in future revisions of SNA, BPM, ISIC and CPC.
d) Supplementary tables should be developed for identifying “artificial” IPP services in the national accounts or balance of payments to inform users about the significance of these flows.
e) The exchange of accounting experiences concerning the treatment of multiterritory enterprises and the identification of best practices (prorating methods) should be continued. More generally, a forum should be put into place for a systematic exchange of information on new survey methods, data sources and compilation method in respect to measuring global production (goods for processing, merchanting and factoryless goods production).
f) Price and volume measures of those goods and services categories typically observed inside global production should be picked up, preferably in future updates of the Price and Volume Measurement Handbook (Eurostat) and PPIM (International Monetary Fund).
g) Data comparison programs should be established which help to overcome the substantial bilateral asymmetries in statistics on imports and exports of goods and services. Classifications supplementary to ISIC and CPC, global chain fragments or business functions, should be developed to enhance international trade data comparability and data validation.