ecg easy way
TRANSCRIPT

ECG
A to Z

What is an ECG?
The electrocardiogram (ECG) is a
representation of the electrical events of the
cardiac cycle.
Each event has a distinctive waveform, the
study of which can lead to greater insight into a
patient’s cardiac pathophysiology.

What types of pathology can we identify
and study from ECGs?
• Arrhythmias
• Myocardial ischemia and infarction
• Pericarditis
• Chamber hypertrophy
• Electrolyte disturbances (i.e. hyperkalemia, hypokalemia)
• Drug toxicity (i.e. digoxin and drugs which prolong the QT interval)

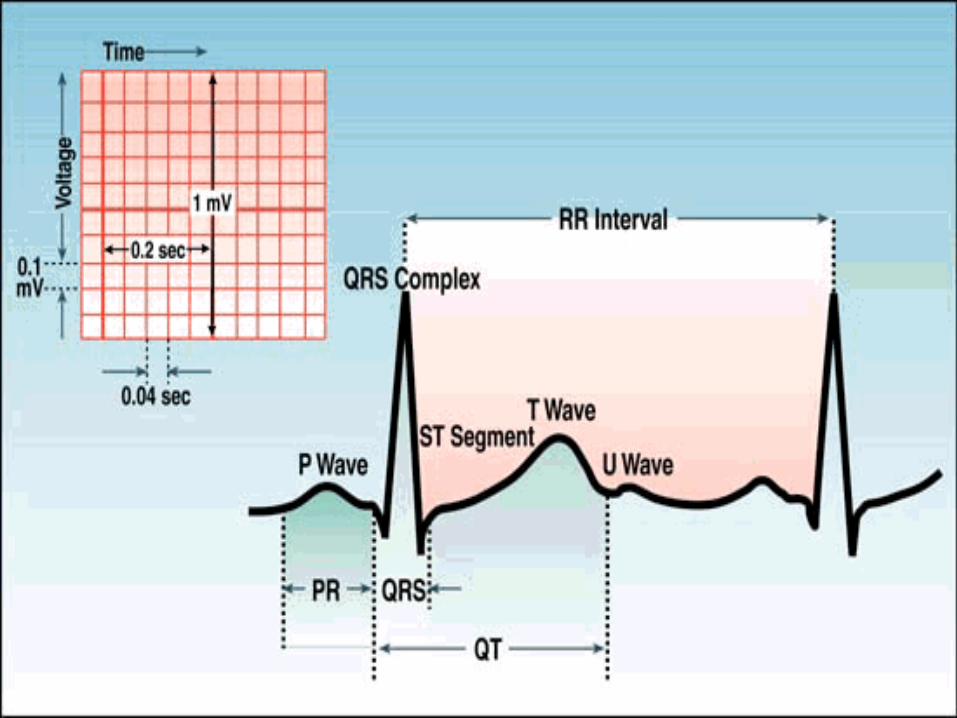
ECG PAPER
• Light lines small squares- 1 X 1 mm
• Bold lines large squares 5 X 5 mm
• Horizontal axis=time
1. Distance across small square=0.04 sec.
2. Distance across large square=0.2 sec.
• Vertical axis=voltage
1. Distance across small square=0.1 mV
2. Distance across large square=0.5 mV

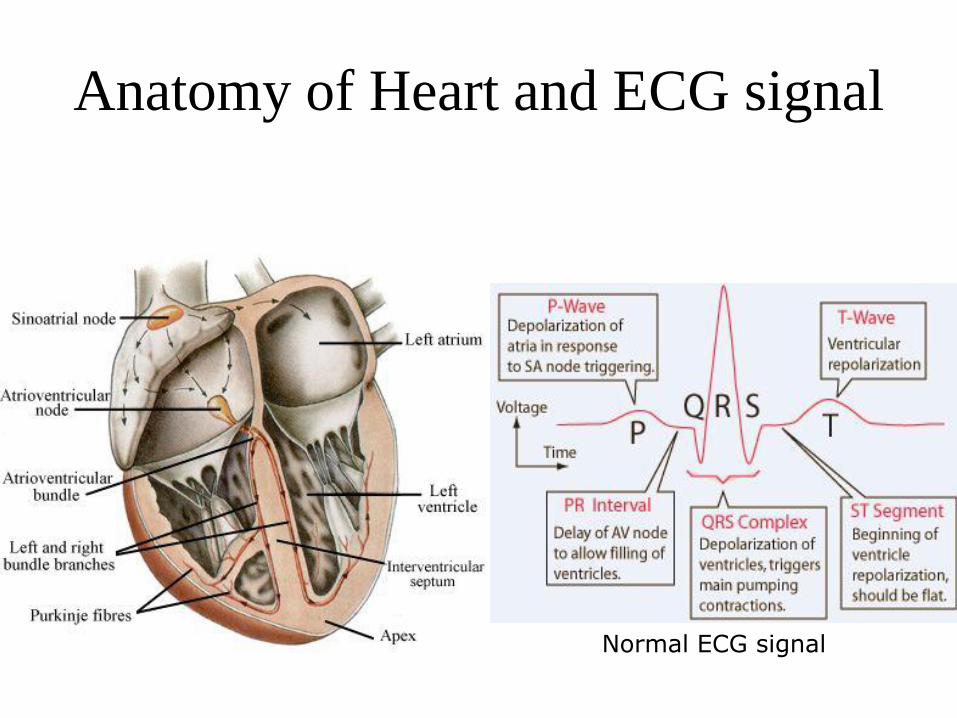
Anatomy of Heart and ECG signal
Normal ECG signal
Conducting System of Heart


ECG Leads
Leads are electrodes which measure the
difference in electrical potential between
either:
1. Two different points on the body (bipolar leads)
2. One point on the body and a virtual reference point
with zero electrical potential, located in the center of
the heart (unipolar leads)
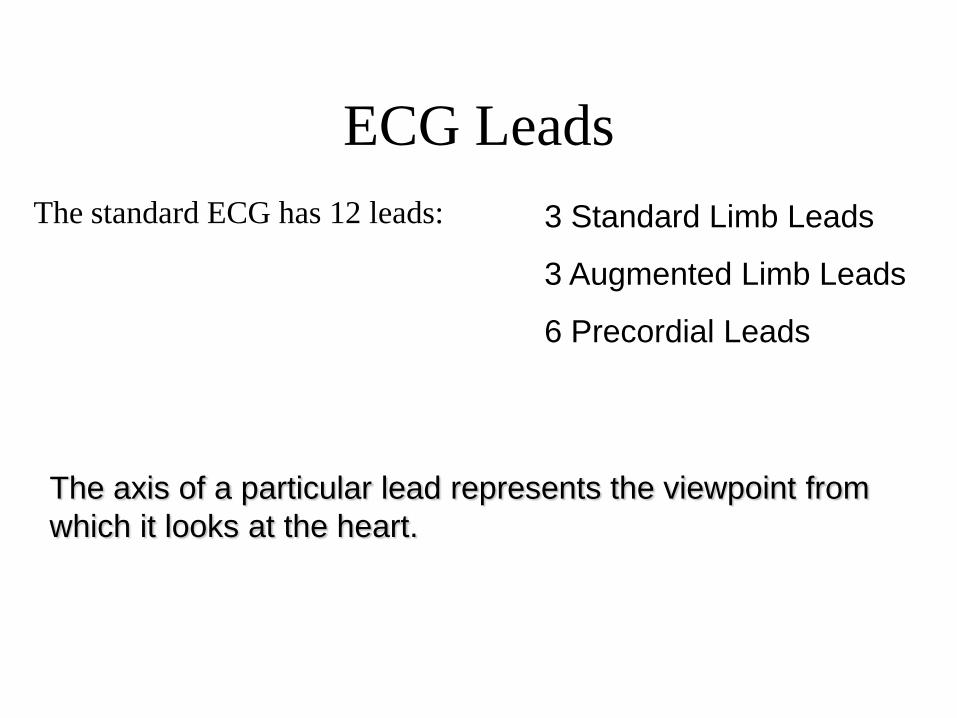
ECG Leads
The standard ECG has 12 leads: 3 Standard Limb Leads
3 Augmented Limb Leads
6 Precordial Leads
The axis of a particular lead represents the viewpoint from
which it looks at the heart.
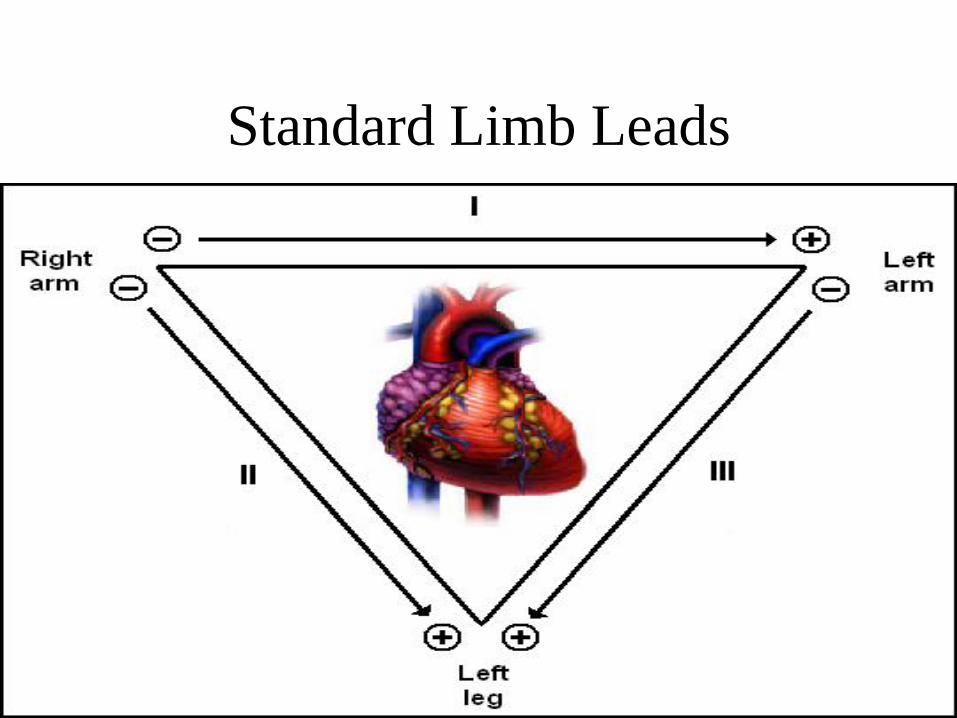
Standard Limb Leads


Precordial Leads

Precordial Leads

Summary of Leads
Limb Leads Precordial Leads
Bipolar I, II, III(standard limb leads)
-
Unipolar aVR, aVL, aVF (augmented limb leads)
V1-V6

Arrangement of Leads on the ECG
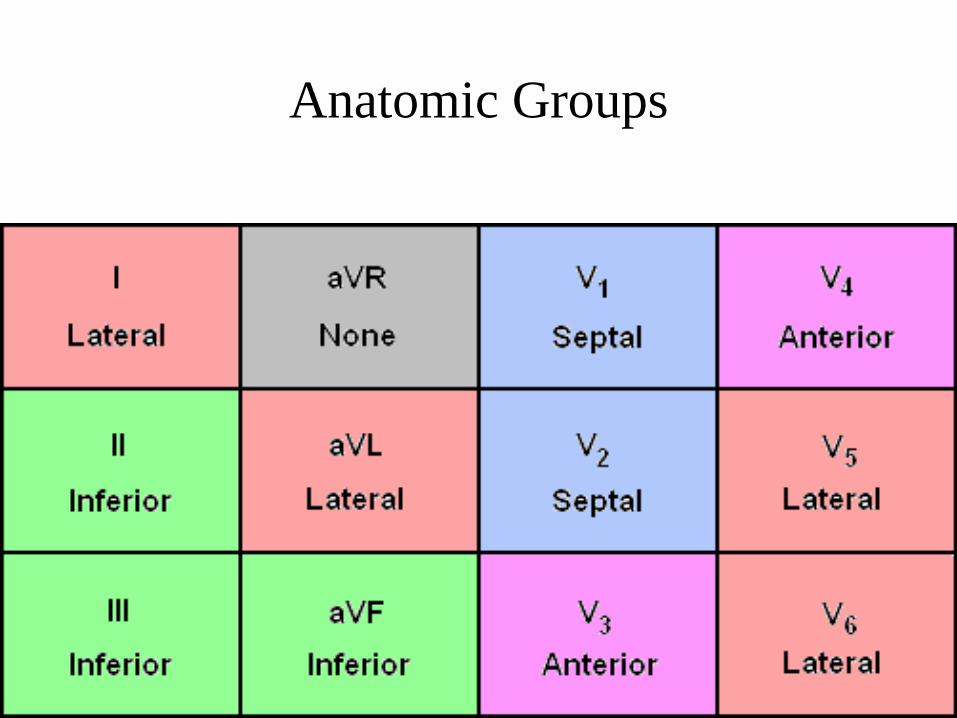
Anatomic Groups


Heart Rate
measurements
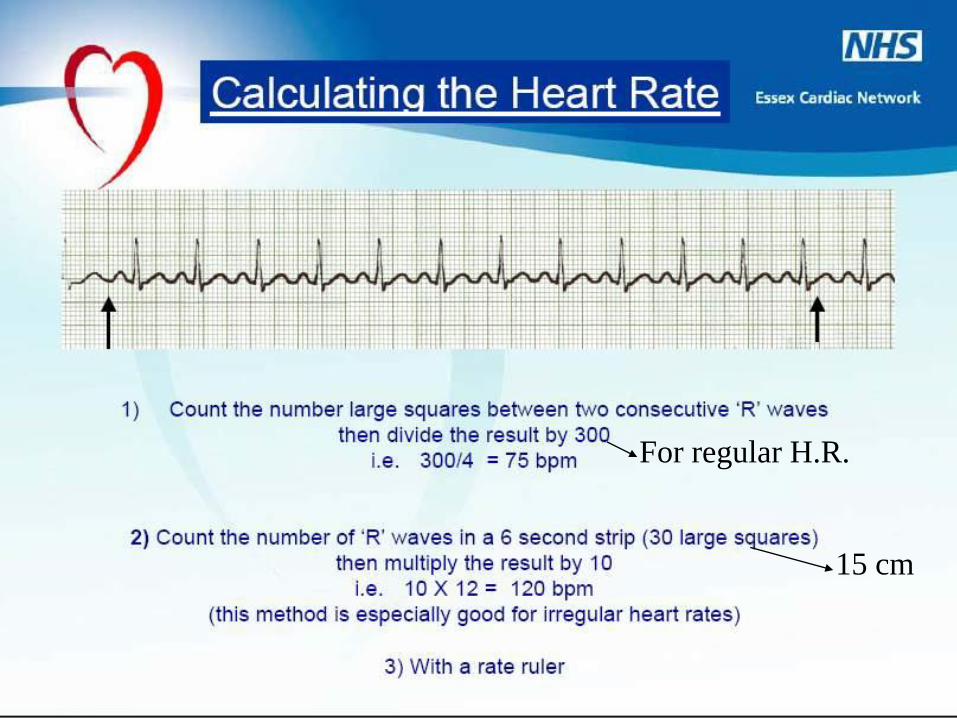
For regular H.R.
15 cm

What is the heart rate?
(300 / 6) = 50 bpm

What is the heart rate?
(300 / ~ 4) = ~ 75 bpm

What is the heart rate?
(300 / 1.5) = 200 bpm

What is the heart rate?
20 x 10 = 200 bpm

Normal H.R. 60-90 bpm
Bradycardia less than 60 bpm
Tachycardia less than 100 bpm

Rhythm


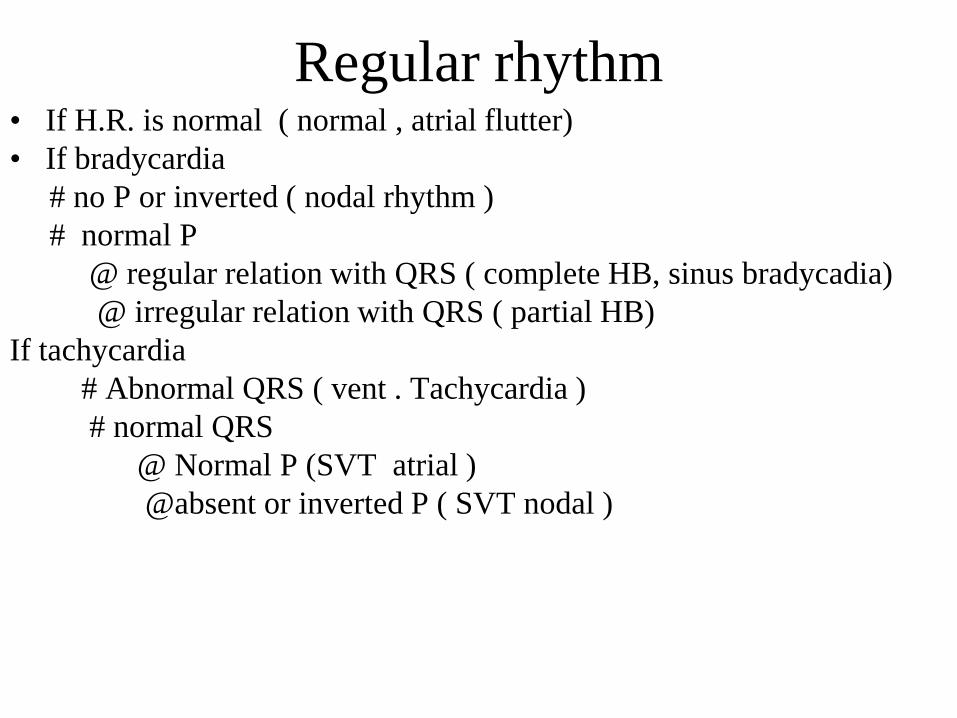
Regular rhythm• If H.R. is normal ( normal , atrial flutter)
• If bradycardia
# no P or inverted ( nodal rhythm )
# normal P
@ regular relation with QRS ( complete HB, sinus bradycadia)
@ irregular relation with QRS ( partial HB)
If tachycardia
# Abnormal QRS ( vent . Tachycardia )
# normal QRS
@ Normal P (SVT atrial )
@absent or inverted P ( SVT nodal )
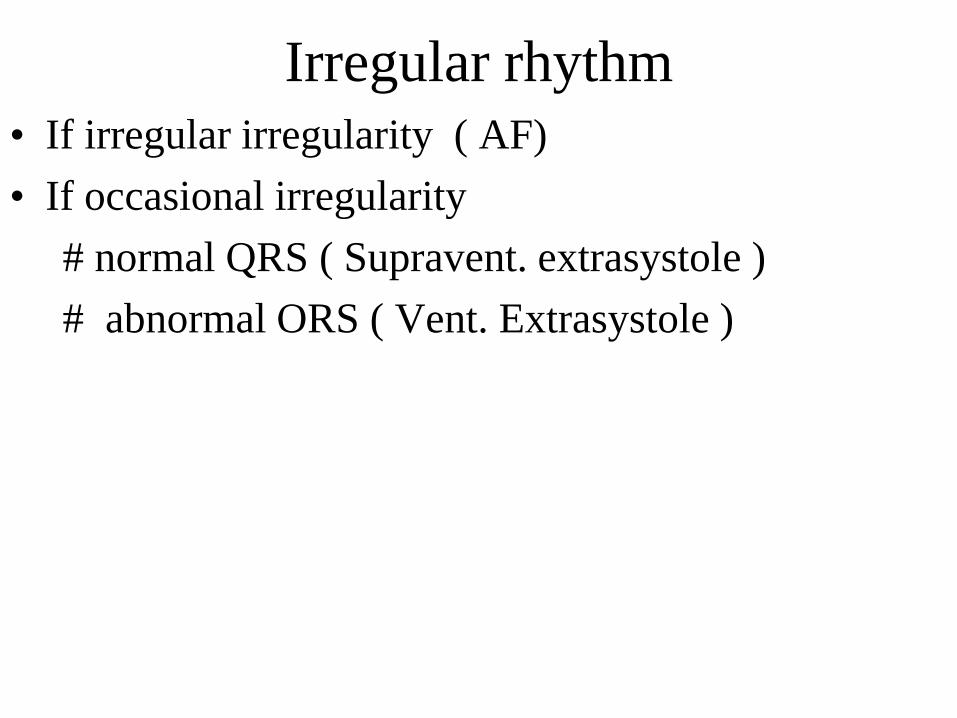
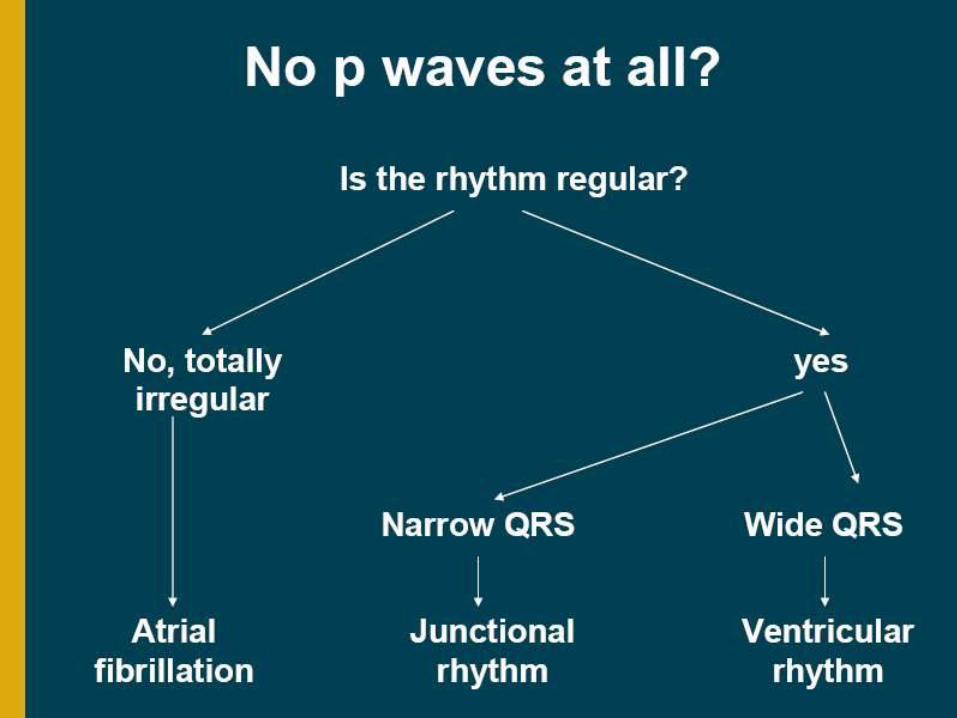
Irregular rhythm
• If irregular irregularity ( AF)
• If occasional irregularity
# normal QRS ( Supravent. extrasystole )
# abnormal ORS ( Vent. Extrasystole )

Normal Sinus Rhythm – the rules!
• P before every QRS
• PR interval <0.2 seconds (5 baby squares)
• QRS after every P wave
• QRS <0.12 seconds (3 baby squares)
• Regular and identical
• Rate 60-100 bpm
– <60 bpm – sinus bradycardia
– >100 bpm – sinus tachycardia

Sinus rhythm


Bigeminy VPC

Trigeminy VPC
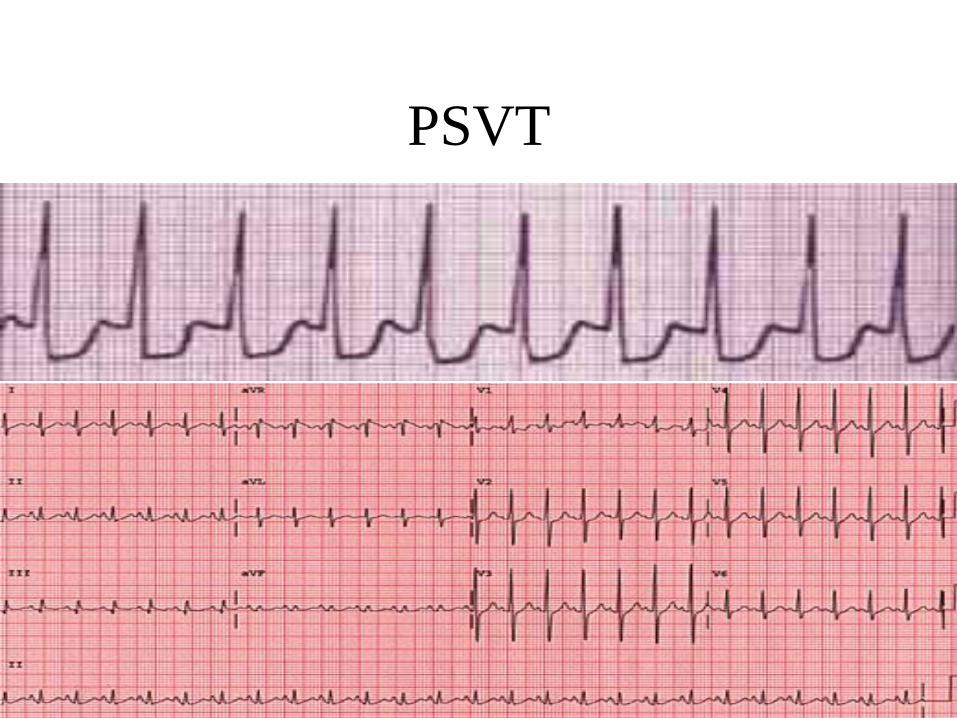
PSVT

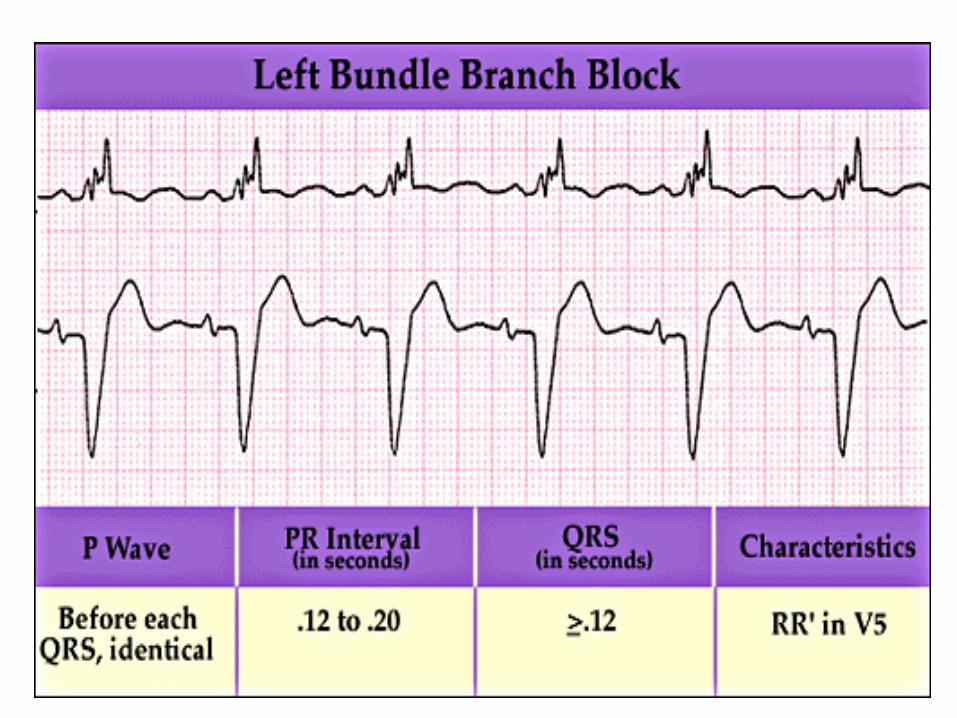
Left Bundle Branch Block
Criteria
• QRS duration ≥ 120ms
• Broad R wave in I and V6
• Prominent QS wave in V1
• Absence of q waves (including physiologic
q waves) in I and V6

Left Bundle Branch Block

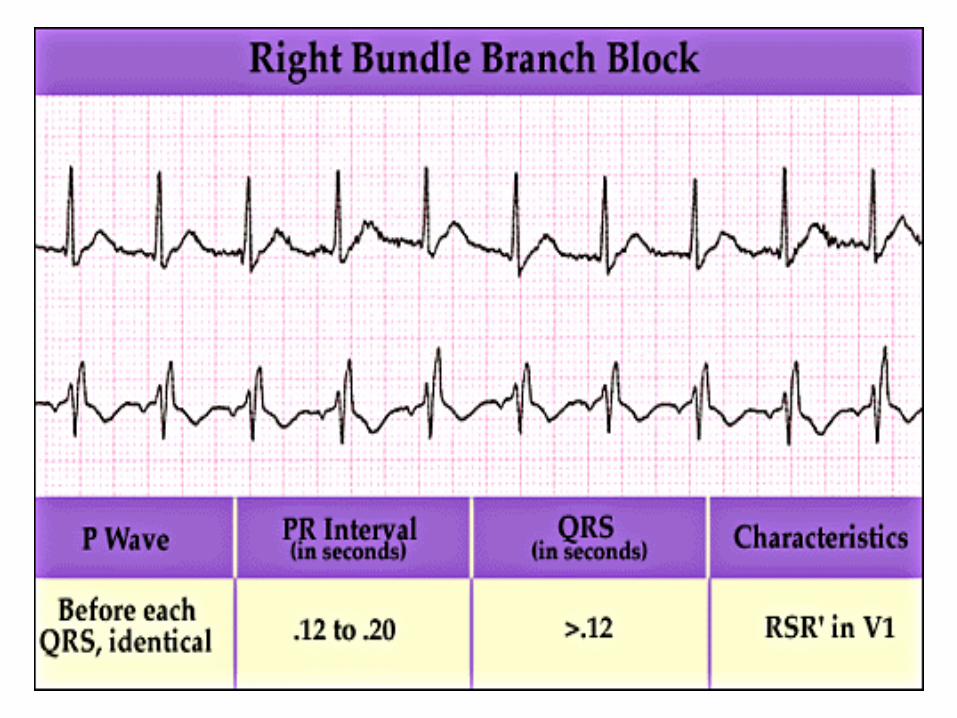
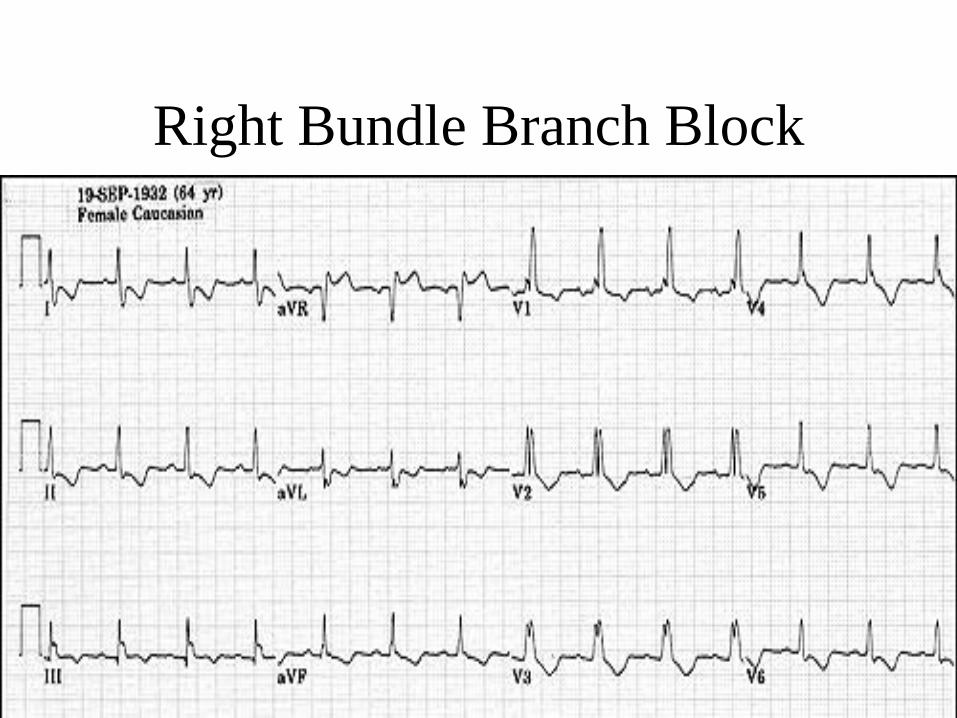
Right Bundle Branch Block
Criteria
• QRS duration ≥ 110ms
• rSR’ pattern or notched R wave in V1
• Wide S wave in I and V6

Right Bundle Branch Block


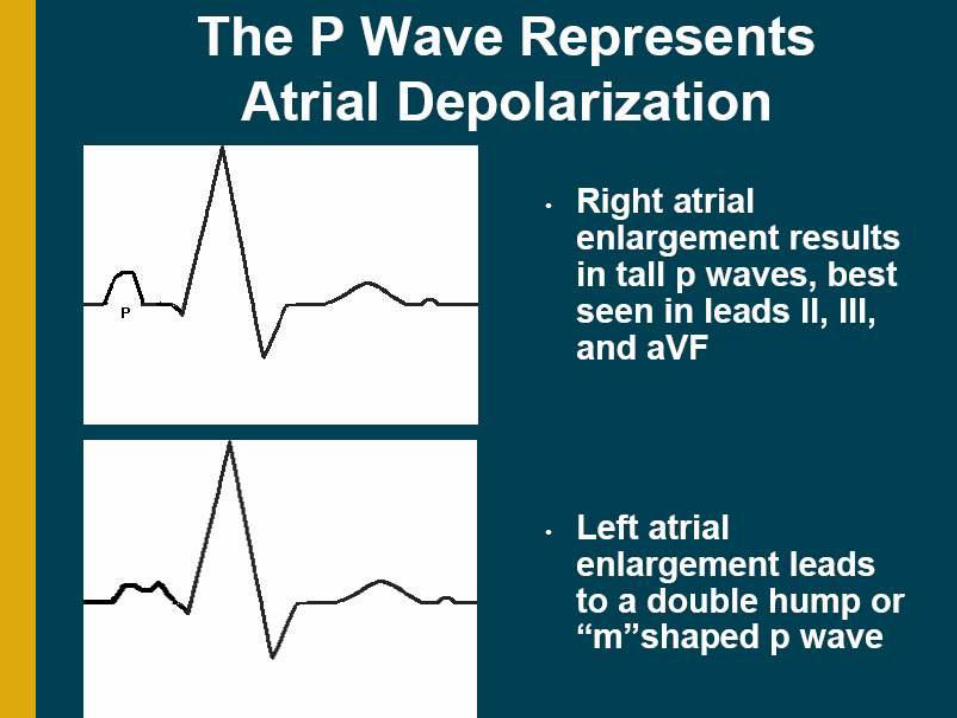
P wave

P waves• It is important to remember that the P wave represents the
sequential activation of the right and left atria, and it is common to see notched or biphasic P waves of right and left atrial activation.
• Does not exceed 2.5 mm (height) in lead II
• Less than 0.12 seconds (width) in lead II
• Abnormal P:
– RAE ( P Pulmonale )
– LAE ( P mitrale )
– Atrial flutter
– Nodal rhythm ( absent with regular rhythm )
– AF( absent with irregular rhythm )
– Dextrocardia

RAE LAE
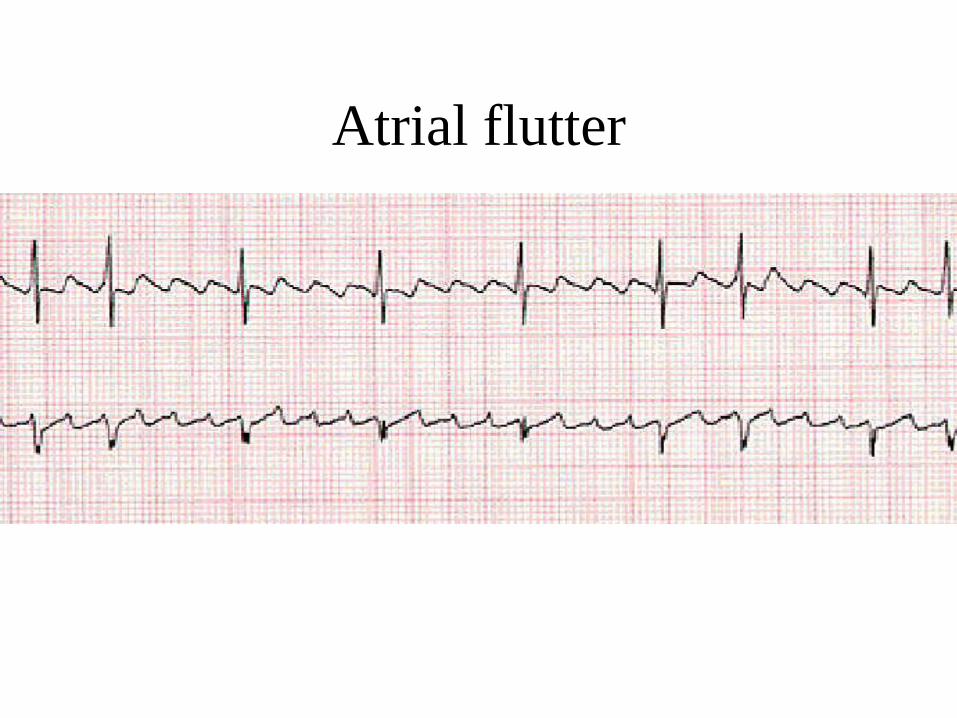
Atrial flutter
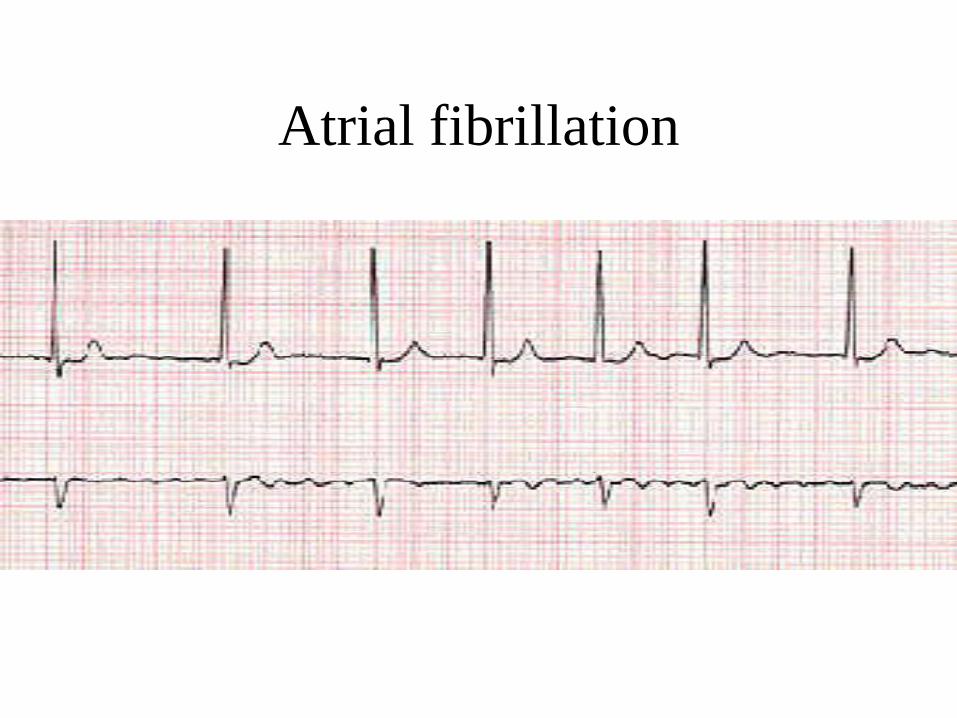
Atrial fibrillation

Left Atrial Enlargement
Criteria
P wave duration in II ≥120ms
or
Negative component of
biphasic P wave in V1 ≥ 1
“small box” in area
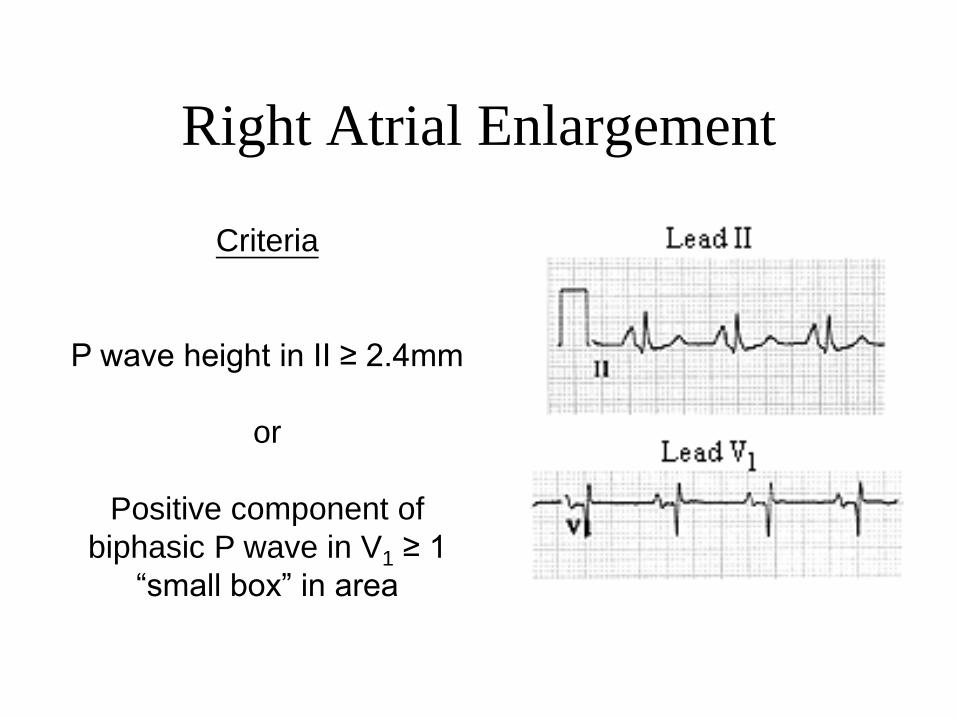
Right Atrial Enlargement
Criteria
P wave height in II ≥ 2.4mm
or
Positive component of
biphasic P wave in V1 ≥ 1
“small box” in area


Dextrocardia

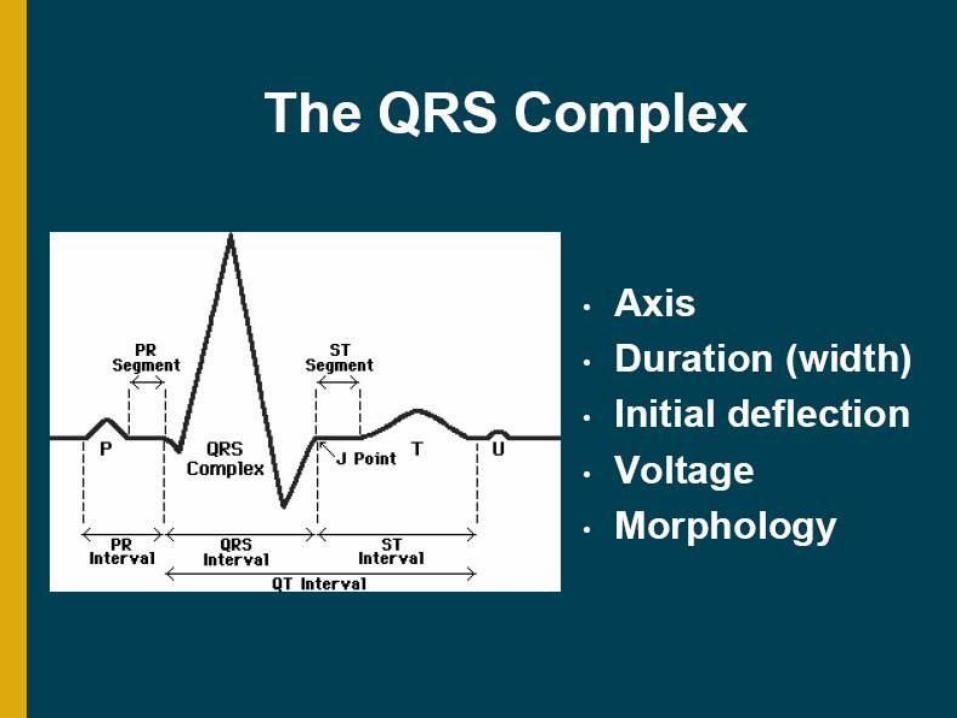
PR Interval
Look at it !


PR interval
• measured from beginning of P to beginning
of QRS
• 0.12-0.20 s ( 3-5 small squares).
• Best seen in lead II .

PR interval
.
Short PR: < 0.12s
1- Preexcitation syndromes:
*WPW (Wolff-Parkinson-White) Syndrome: An accessory pathway
connects the right atrium to the right ventricle or the left atrium to
the left ventricle, and this permits early activation of the ventricles
(delta wave) and a short PR interval.


WPW syndrome

PR interval
.2- AV Junctional Rhythms with retrograde atrial activation (inverted
P waves in II, III, aVF): Retrograde P waves may occur before the
QRS complex (usually with a short PR interval), in the QRS
complex (i.e., hidden from view), or after the QRS complex (i.e., in
the ST segment).
3- Ectopic atrial rhythms originating near the AV node (the PR
interval is short because atrial activation originates close to the AV
node; the P wave morphology is different from the sinus P)
4- Normal variant
5- tachycardia

PR interval
.
Prolonged PR: >0.20s
1-First degree AV block (PR interval usually constant)
2-Second degree AV block (PR interval may be normal or
prolonged; some P waves do not conduct)
Type I (Wenckebach): Increasing PR until nonconducted P wave
occurs
Type II (Mobitz): Fixed PR intervals plus nonconducted P waves
3-AV dissociation: Some PR's may appear prolonged, but the P
waves and QRS complexes are dissociated .
4- Rheumatic fever
5- Digitalis

First degree AV block

Second degree AV block (mobitz
I)-Wenckebach
QRS complex


Standard Limb Leads

Augmented Limb Leads

The QRS Axis
The QRS axis represents the net overall
direction of the heart’s electrical activity.
Abnormalities of axis can hint at:
Ventricular enlargement
Conduction blocks (i.e. hemiblocks)

The QRS AxisBy near-consensus, the
normal QRS axis is defined
as ranging from -30° to +90°.
-30° to -90° is referred to as a
left axis deviation (LAD)
+90° to +180° is referred to as
a right axis deviation (RAD)

Determining the Axis
• The Quadrant Approach
• The Equiphasic Approach
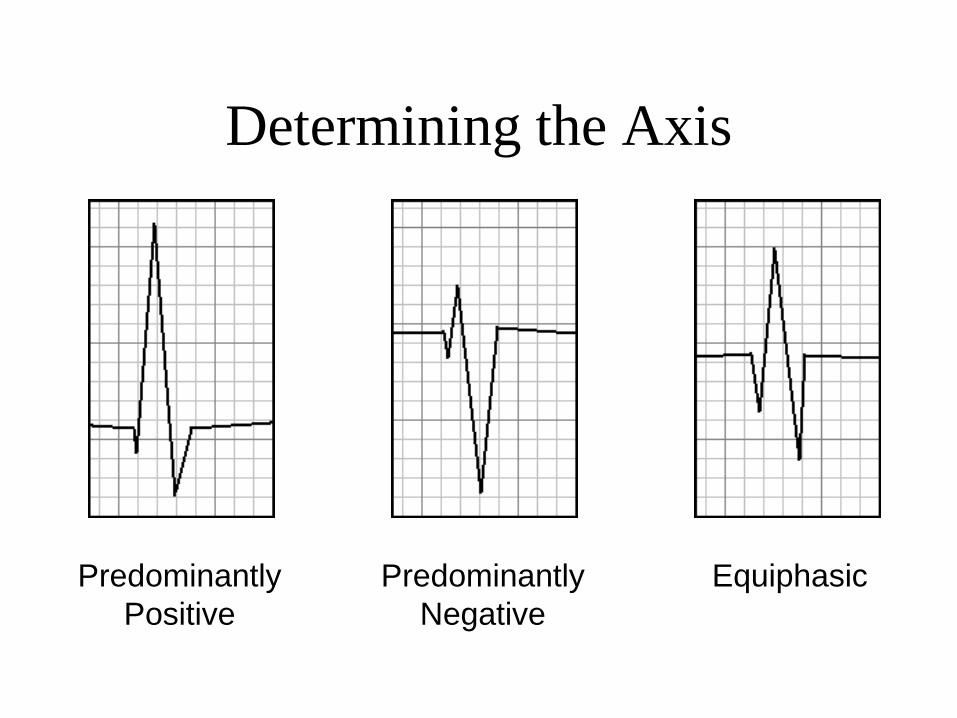
Determining the Axis
Predominantly
Positive
Predominantly
Negative
Equiphasic
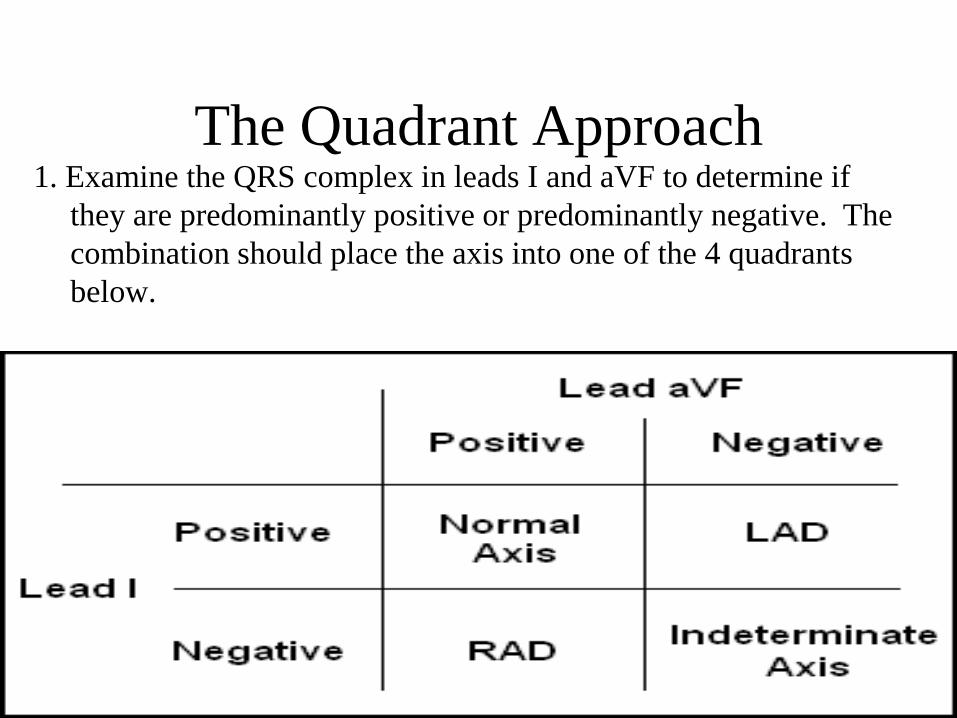
The Quadrant Approach1. Examine the QRS complex in leads I and aVF to determine if
they are predominantly positive or predominantly negative. The
combination should place the axis into one of the 4 quadrants
below.

The Quadrant Approach2. In the event that LAD is present, examine lead II to determine if
this deviation is pathologic. If the QRS in II is predominantly
positive, the LAD is non-pathologic (in other words, the axis is
normal). If it is predominantly negative, it is pathologic.

Quadrant Approach: Example 1
Negative in I, positive in aVF RAD

Quadrant Approach: Example 2
Positive in I, negative in aVF Predominantly positive in II
Normal Axis (non-pathologic LAD)

The Equiphasic Approach
1. Determine which lead contains the most equiphasic QRS complex. The fact that the QRS complex in this lead is equally positive and negative indicates that the net electrical vector (i.e. overall QRS axis) is perpendicular to the axis of this particular lead.
2. Examine the QRS complex in whichever lead lies 90° away from the lead identified in step 1. If the QRS complex in this second lead is predominantly positive, than the axis of this lead is approximately the same as the net QRS axis. If the QRS complex is predominantly negative, than the net QRS axis lies 180° from the axis of this lead.
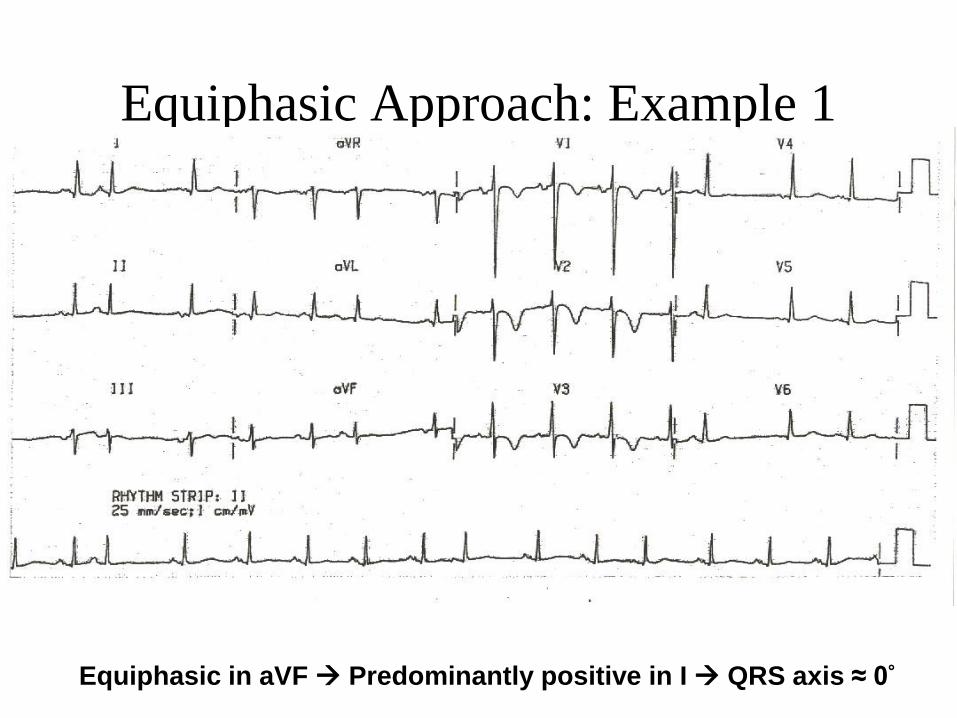
Equiphasic Approach: Example 1
Equiphasic in aVF Predominantly positive in I QRS axis ≈ 0°

Equiphasic Approach: Example 2
Equiphasic in II Predominantly negative in aVL QRS axis ≈ +150°

QRS complex• Normal: 0.06 - 0.10s
Prolonged QRS Duration (>0.10s):
A-QRS duration 0.10 - 0.12s
1- Incomplete right or left bundle branch block
2-Nonspecific intraventricular conduction delay (IVCD)
3-Some cases of left anterior or posterior fascicular block
B-QRS duration > 0.12s
1-Complete RBBB or LBBB
2-Nonspecific IVCD
3-Ectopic rhythms originating in the ventricles (e.g., ventricular tachycardia, pacemaker rhythm)

Left Bundle Branch Block
Criteria
• QRS duration ≥ 120ms
• Broad R wave in I and V6
• Prominent QS wave in V1
• Absence of q waves (including physiologic
q waves) in I and V6

LBBB

Left Bundle Branch Block


Right Bundle Branch Block
Criteria
• QRS duration ≥ 110ms
• rSR’ pattern or notched R wave in V1
• Wide S wave in I and V6

RBBB
Right Bundle Branch Block


Left Ventricular Hypertrophy

Right Ventricular Hypertrophy
• Right axis deviation
• Right atrial enlargement
• Down sloping ST depressions in V1-V3 (RV strain
pattern)
• Tall R wave in V1
Although there is no widely accepted criteria for
detecting the presence of RVH, any combination of
the following ECG features is suggestive of its
presence:

Right Ventricular Hypertrophy

Q Wave
• Normal (physiologic) or due to pathology
(pathologic).
• Depth and width are determining criteria
– Q wave >0.04 (40 ms) wide is considered a
significant finding (pathologic)


Antero -Lateral MI


The
ST segment

ST segment
From the end of QRS ( J point ) to beginning
of T wave .
isoelectric

ST Segment
• The ST segment is normally level with the
T-P segment rather than the PR segment
• Examine every lead for ST segment
elevation of 1 mm or more.


Differential Diagnosis of ST
Segment Elevation1-Normal Variant "Early Repolarization" (usually concave upwards,
ending with symmetrical, large, upright T waves)
2- Ischemic Heart Disease (usually convex upwards, or straightened) Acute transmural injury - as in this acute anterior MI
3- Persistent ST elevation after acute MI suggests ventricular aneurysm
4-ST elevation may also be seen as a manifestation of Prinzmetal's (variant) angina (coronary artery spasm)
5-ST elevation during exercise testing suggests extremely tight coronary artery stenosis or spasm (transmural ischemia)
•

Differential Diagnosis of ST
Segment Elevation6-Acute Pericarditis
#Concave upwards ST elevation in most leads except aVR
# No reciprocal ST segment depression (except in aVR)
#Unlike "early repolarization", T waves are usually low amplitude, and heart rate is usually increased.
#May see PR segment depression, a manifestation of atrial injury


Pericarditis

Ventricle aneurysm

ST depression
• >2mm usually indicates ischemia
• Common in normal ECG, especially in
pregnancy
• But:
– Non specific not more than 2mm below
baseline
– It is convex downward or slopes upwards from
the S wave
Differential Diagnosis of ST
Segment Depression1-Normal variants or artifacts: Pseudo-ST-depression (wandering baseline due to poor skin-electrode contact)
2-Physiologic J-junctional depression with sinus tachycardia (most likely due to atrial repolarization)
3-Hyperventilation-induced ST segment depression
Differential Diagnosis of ST
Segment Depression4-Ischemic heart disease
Subendocardial ischemia (exercise induced or during angina attack )
ST segment depression is often characterized as "horizontal", "upsloping", or "downsloping"
5-Non Q-wave MI
6- Reciprocal changes in acute Q-wave MI (e.g., ST depression in leads I & aVL with acute inferior MI)

Differential Diagnosis of ST
Segment Depression7-Nonischemic causes of ST depression
#RVH (right precordial leads) or LVH (left precordial leads, I, aVL)
# Digoxin effect on ECG
# Hypokalemia
#Mitral valve prolapse (some cases)
#Secondary ST segment changes with IV conduction abnormalities (e.g., RBBB, LBBB, WPW, etc)
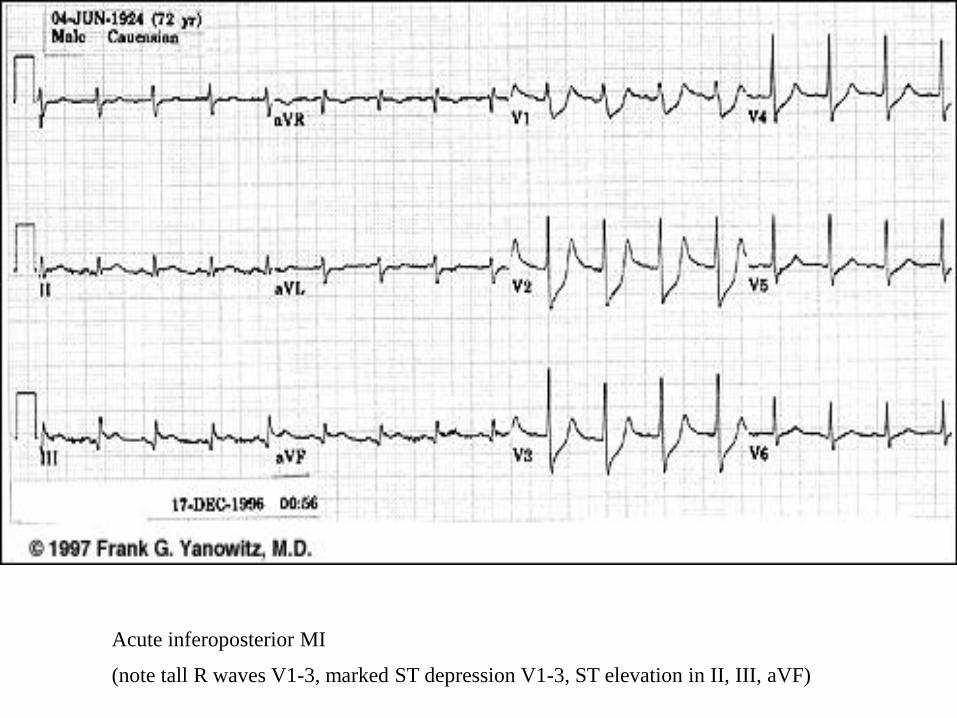
Acute inferoposterior MI
(note tall R waves V1-3, marked ST depression V1-3, ST elevation in II, III, aVF)


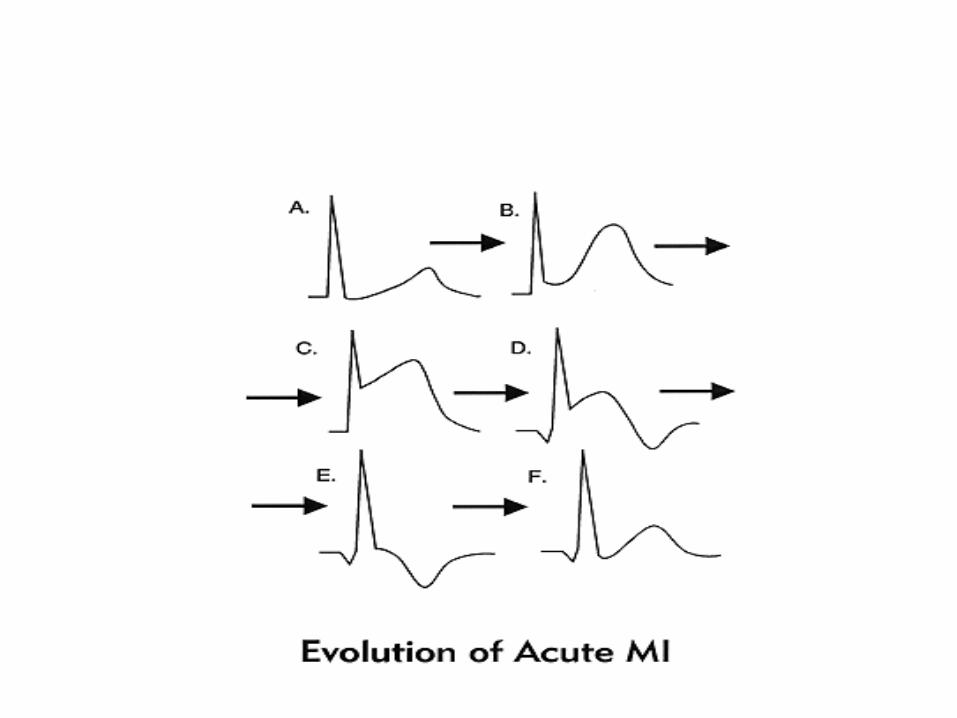
The ECG signs of Infarct!
• Abnormal Q waves
• ST segment elevation (Greater than 1mm in 2 or more
adjacent leads)
• Inverted T waves

ST Elevation - Myocardial Infarction
• ST elevation in two or more leads
– Must be at least 1mm in limb leads
– Must be at least 2mm in chest leads


Antero -Lateral MI
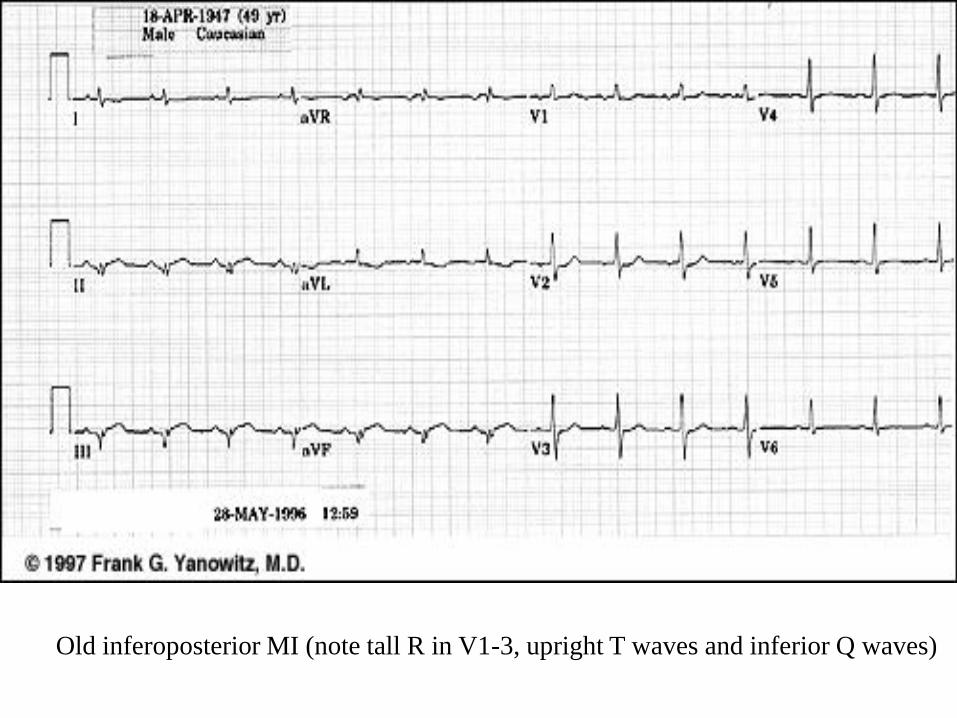
Old inferoposterior MI (note tall R in V1-3, upright T waves and inferior Q waves)

T wave


T wave: tall T waves( more than 2
big squares)
• Hyperkalaemia
• Hyperacute myocardial infarction
• Left bundle branch block (LBBB)

T waves: small, flattened or
inverted
• Ischemia
• age, race
• hyperventilation, anxiety, drinking iced water
• LVH
• drugs (e.g. digoxin)
• pericarditis, PE
• intraventricular conduction delay (e.g. RBBB)
• electrolyte disturbance


QT Interval

QT interval
• measured from beginning of QRS to end of T wave
• QT Interval (QTc < 0.40 sec) upper limit for QTc = 0.44 sec
1-Bazett's Formula: QTc = (QT)/SqRoot RR (in seconds) 2-Poor Man's Guide to upper limits of QT: For HR = 70 bpm, QT<0.40 sec; for every 10 bpm increase above 70 subtract 0.02 sec, and for every 10 bpm decrease below 70 add 0.02 sec. For example: QT < 0.38 @ 80 bpm
QT < 0.42 @ 60 bpm


QT interval
• Prolonged QT :
A. Familial long QT Syndrome (LQTS)
B. Congestive Heart Failure
C. Myocardial Infarction
D. Hypocalcemia & Hypokalaemia
E. Hypomagnesemia
F. Type I Antiarrhythmicdrugs & Cispride
G. Rheumatic Fever
H. Myocarditis
I. Congenital Heart Disease
• Short QT :
A. Digoxin (Digitalis)
B. Hypercalcemia
C. Hyperkalemia


The U wave is the only remaining enigma of the ECG, and probably
not for long. The origin of the U wave is still in question, although
most authorities correlate the U wave with electrophysiologic events
called "afterdepolarizations" in the ventricles.. The normal U wave
has the same polarity as the T wave and is usually less than one-third
the amplitude of the T wave. U waves are usually best seen in the
right precordial leads especially V2 and V3. The normal U wave is
asymmetric with the ascending limb moving more rapidly than the
descending limb (just the opposite of the normal T wave).

Prominent upright U waves
1-Sinus bradycardia accentuates the U wave
2-Hypokalemia (remember the triad of ST segment depression, low
amplitude T waves, and prominent U waves)
3- Quinidine and other type 1A antiarrhythmics

Negative or "inverted" U waves
1- Ischemic heart disease (often indicating left main or LAD
disease) Myocardial infarction (in leads with pathologic Q waves)
2-During episode of acute ischemia (angina or exercise-induced
ischemia)
3- During coronary artery spasm (Prinzmetal's angina)
4- Nonischemic causes Some cases of LVH or RVH (usually in
leads with prominent R waves)

Thanks