eclipse and the parallel tools platform - o'reilly...
TRANSCRIPT

Eclipse and the Parallel Tools Platform
Beth Tibbitts, IBM [email protected] Greg Watson, IBM [email protected]
"This material is based upon work supported by the Defense Advanced Research Projects Agency (DARPA) under its
Agreement No. HR0011-07-9-0002“
OSCON 7/22/08

Tutorial Outline Time Module Outcomes Presenter
8:30-9:30 1. Overview of Eclipse and PTP
Introduction to PTP Eclipse basics Configuring Resource
Managers & setup
Greg
9:30-10:00 2. Creating and Running MPI Programs
PTP project creation New project wizards PTP Runtime Perspective
Beth
10:00 - 10:30 Break
10:30 – 10:55 3. Parallel Language Development Tools (PLDT)
MPI, OpenMP analysis features
Beth
10:55- 11:25 4. Parallel Debugger Debug Perspective, breakpoints, variables, stepping, etc.
Greg
11:25 – 11:45 5. Advanced Eclipse and PTP features
CVS, Makefiles, autoconf, Search, Refactoring, UPC, Remote debugging, MPICH2, IBM PE & LoadLeveler
Greg
11:45- 12:00 6. Other, Summary, Wrapup
Perf. Tools, website, mailing lists, future features, etc.
Beth
PTP Tutorial 1-0 Module 1
Module 1: Overview of Eclipse and PTP
Objective To introduce the Eclipse platform and PTP To learn the basics of Eclipse
Contents What is Eclipse? Who is using Eclipse? What is PTP? Eclipse basics Configuring a Resource Manager
PTP Tutorial 1-1 Module 1
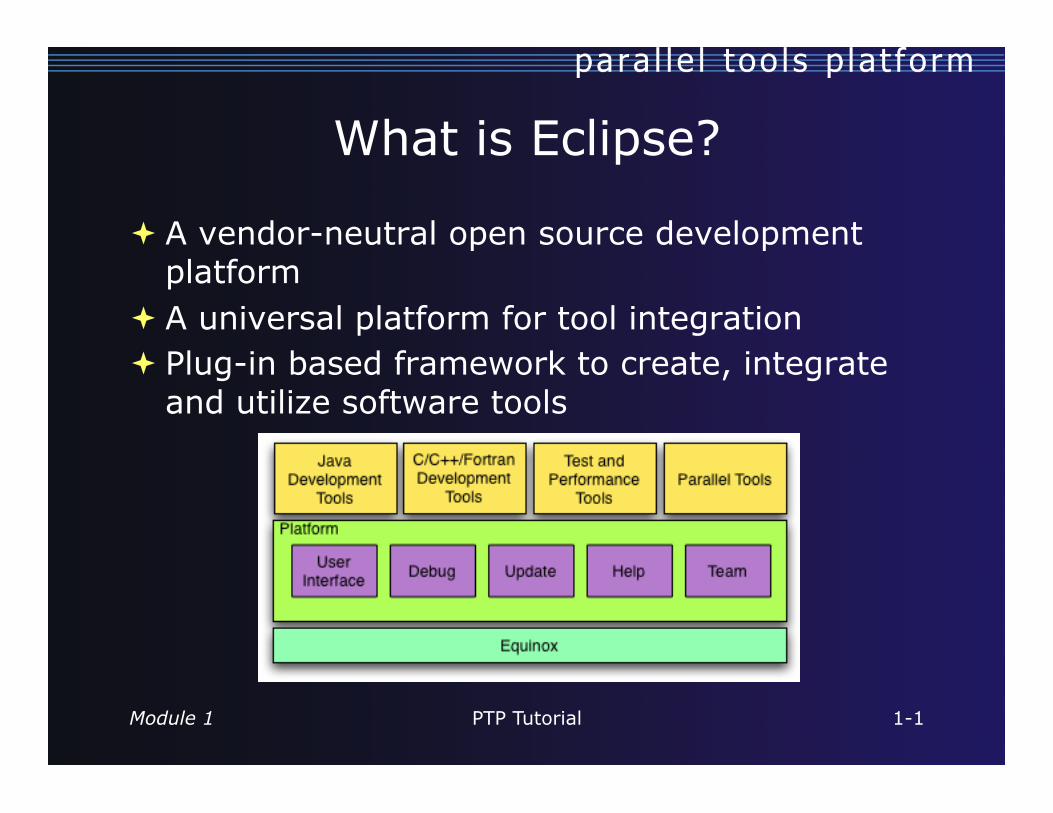
What is Eclipse?
A vendor-neutral open source development platform
A universal platform for tool integration Plug-in based framework to create, integrate
and utilize software tools
PTP Tutorial 1-2 Module 1
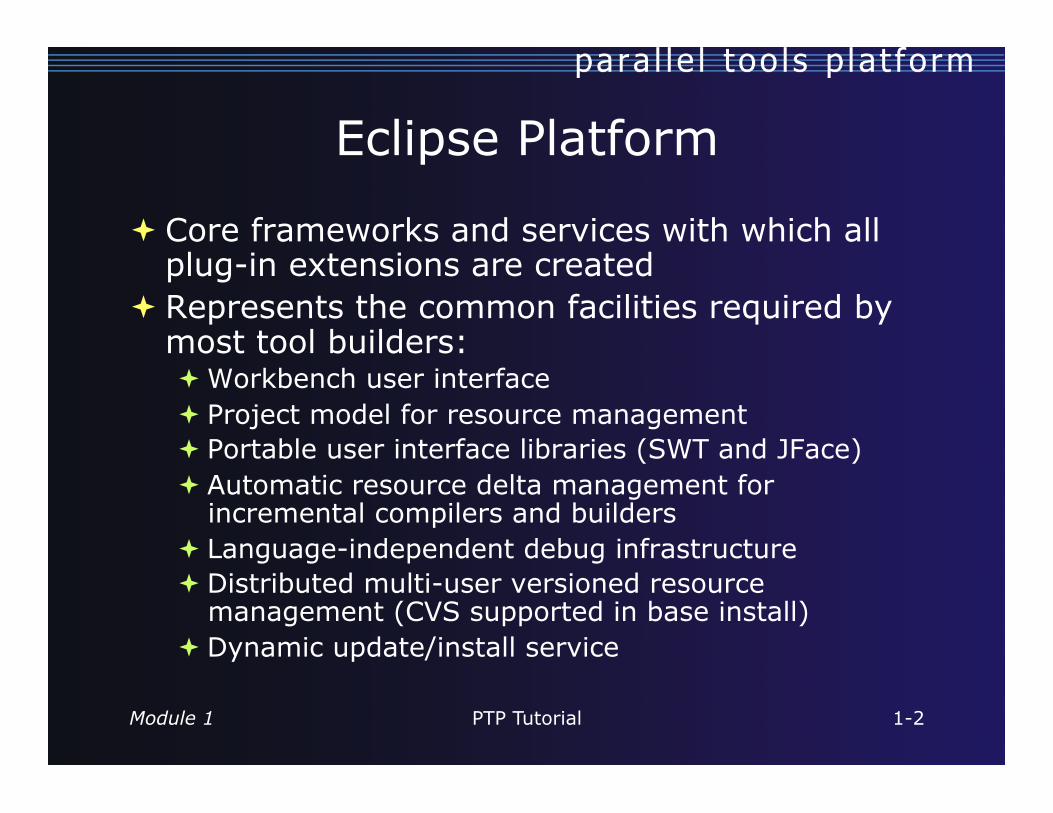
Eclipse Platform
Core frameworks and services with which all plug-in extensions are created
Represents the common facilities required by most tool builders: Workbench user interface Project model for resource management Portable user interface libraries (SWT and JFace) Automatic resource delta management for
incremental compilers and builders Language-independent debug infrastructure Distributed multi-user versioned resource
management (CVS supported in base install) Dynamic update/install service

PTP Tutorial 1-3 Module 1
Plug-ins
Java Development Tools (JDT) Plug-in Development Environment (PDE) C/C++ Development Tools (CDT) Parallel Tools Platform (PTP) Fortran Development Tools (Photran) Test and Performance Tools Platform (TPTP) Business Intelligence and Reporting Tools (BIRT) Web Tools Platform (WTP) Data Tools Platform (DTP) Device Software Development Platform (DSDP) Many more…
1-4
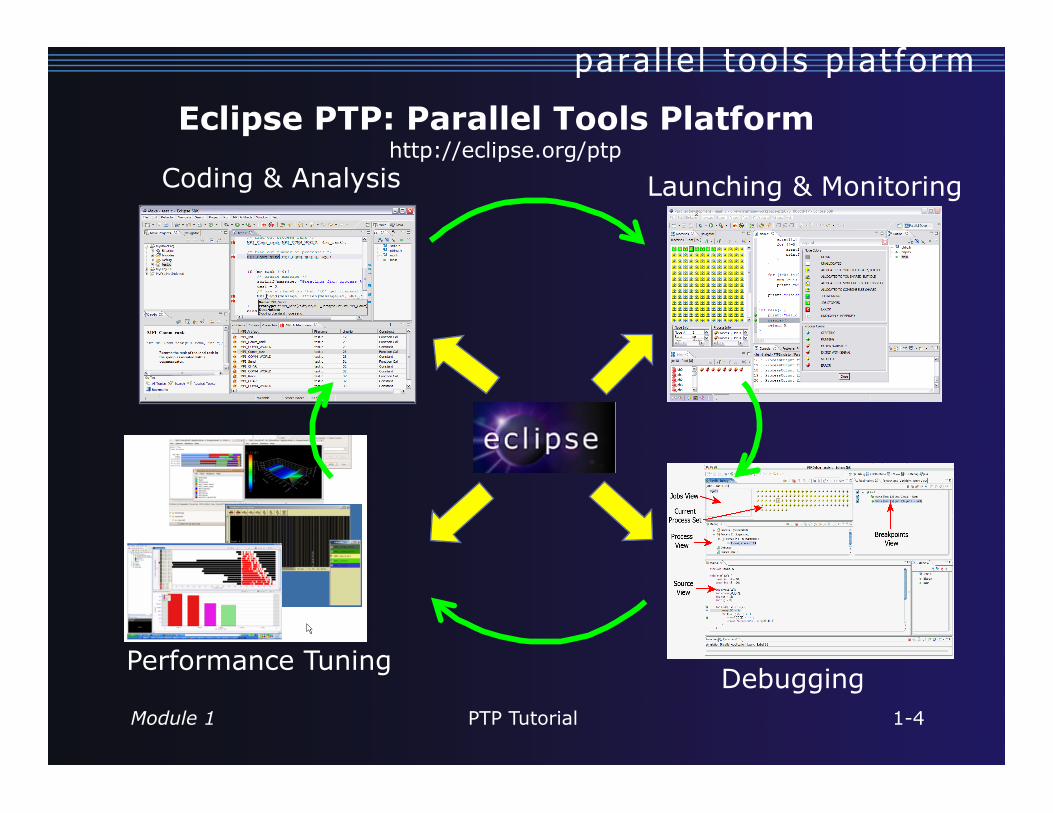
Launching & Monitoring
Eclipse PTP: Parallel Tools Platform http://eclipse.org/ptp
Debugging
Coding & Analysis
Performance Tuning
PTP Tutorial Module 1

PTP Tutorial 1-5 Module 1
Eclipse History
Originally developed by Object Technology International (OTI) and purchased by IBM for use by internal developers
Released to open-source community in 2001, managed by consortium Eclipse Public License (EPL) Based on IBM Common Public License (CPL)
Consortium reorganized into independent not-for-profit corporation, the Eclipse Foundation, in early 2004 Participants from over 100 companies

PTP Tutorial 1-6 Module 1
Eclipse Foundation & Members
Board of Directors and full-time Eclipse management organization
Councils guide the development done by Eclipse Open Source projects
180 members (March ‘08) 21 strategic members
942 committers, representing 50+ organizations
PTP Tutorial 1-7 Module 1 1-7

PTP Tutorial 1-8 Module 1
Eclipse Member companies
PTP Tutorial 1-9 Module 1
Parallel Tools Platform (PTP)
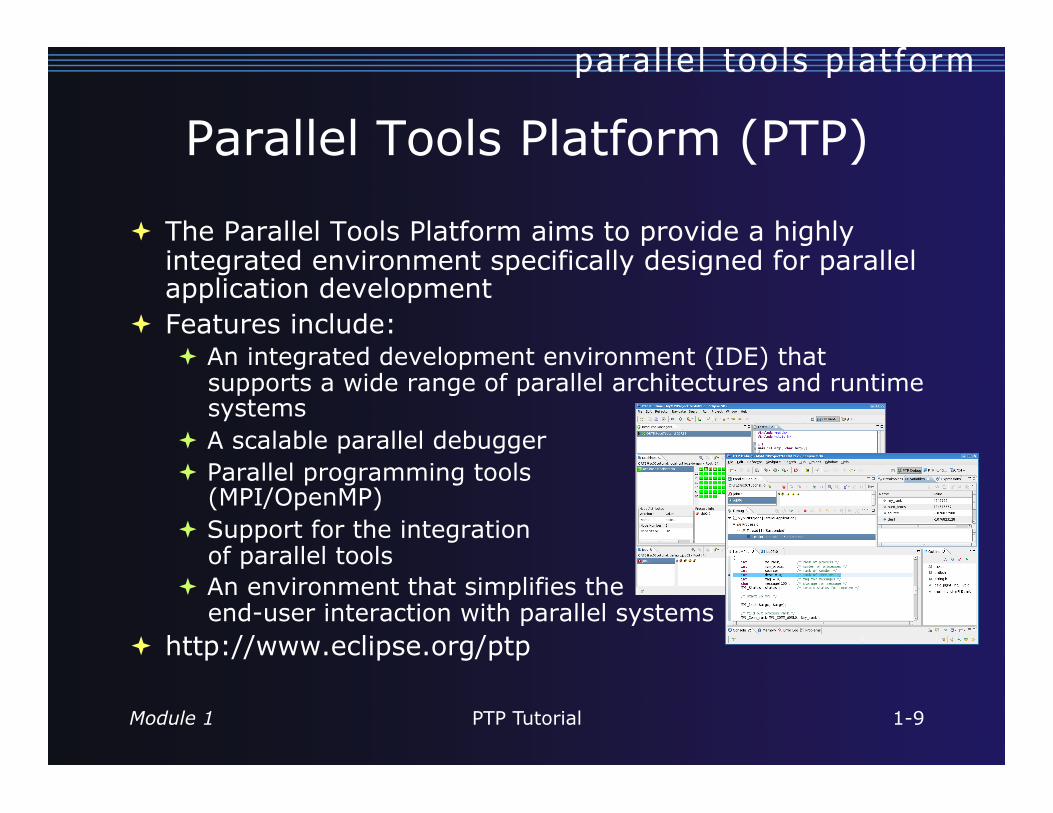
The Parallel Tools Platform aims to provide a highly integrated environment specifically designed for parallel application development
Features include: An integrated development environment (IDE) that
supports a wide range of parallel architectures and runtime systems
A scalable parallel debugger Parallel programming tools
(MPI/OpenMP) Support for the integration
of parallel tools An environment that simplifies the
end-user interaction with parallel systems http://www.eclipse.org/ptp

PTP Tutorial 1-10 Module 1
PTP Software Prerequisites
Java (1.5 or later) Cygwin or MinGW (for Windows) make, gcc, and gdb (or other vendor
compilers) OpenMPI or MPICH2 (only required for PTP
Runtime)
Note: Linux & Mac have full PTP support Windows can be used for Eclipse, targeting a
remote parallel machine

PTP Tutorial 1-11 Module 1
Java Prerequisite
Eclipse requires Sun or IBM versions of Java Only need Java runtime environment (JRE) Java 1.5 is the same as JRE 5.0 The GNU Java Compiler (GCJ), which comes standard
on Linux, will not work!
PTP Tutorial 1-12 Module 1
Eclipse and PTP Installation
Eclipse is installed in two steps First, the ‘base’ Eclipse is downloaded and installed
This provides a number of pre-configured ‘features’ Additional functionality is obtained by adding more
‘features’ This can be done via an `update site’ that
automatically downloads and installs the features Features can also be downloaded and manually
installed
PTP requires the following features C/C++ Development Tools (CDT) Parallel Tools Platform (PTP)
PTP Tutorial 1-13 Module 1
Eclipse Installation
Two alternatives for installation: The Eclipse Classic is the full software development kit
(SDK), including Java and Plug-in development tools The Eclipse IDE for C/C++ developers is the base Eclipse
platform plus the CDT (C/C++ Development tools). This is ideal for PTP use (included on the tutorial CD)
Eclipse is downloaded as a single zip or gzipped tar file from http://eclipse.org/downloads Eclipse 3.4 (Ganymede) made available on June 25 This tutorial is based on Eclipse 3.3 (Europa) PTP Tutorial CD contains all you need to install Eclipse, CDT & PTP
You must have the correct file for your operating system and windowing system
Unzipping or untarring this file creates a directory containing the main executable

PTP Tutorial 1-14 Module 1
Platform Differences
Single button mouse (e.g. MacBook) Use Control-click for right mouse / context menu
Context-sensitive help key differences Windows: use F1 key Linux: use Shift-F1 keys MacOS X
Full keyboard, use Help key MacBooks or aluminum keyboard, create a key binding
for Dynamic Help to any key you want
Accessing preferences Windows & Linux: WindowPreferences… MacOS X: EclipsePreferences…

PTP Tutorial 1-15 Module 1
Starting Eclipse
Linux From a terminal window, enter
MacOS X From finder, open the Applicationseclipse folder Double-click on the Eclipse application
Windows Open the eclipse folder Double-click on the eclipse executable
Accept default workspace when asked Select workbench icon from welcome page
<eclipse_installation>/eclipse/eclipse &

PTP Tutorial 1-16 Module 1
Specifying A Workspace
The prompt can be turned off
Eclipse prompts for a workspace location at startup time
The workspace contains all user-defined data Projects and resources such as folders and files
PTP Tutorial 1-17 Module 1
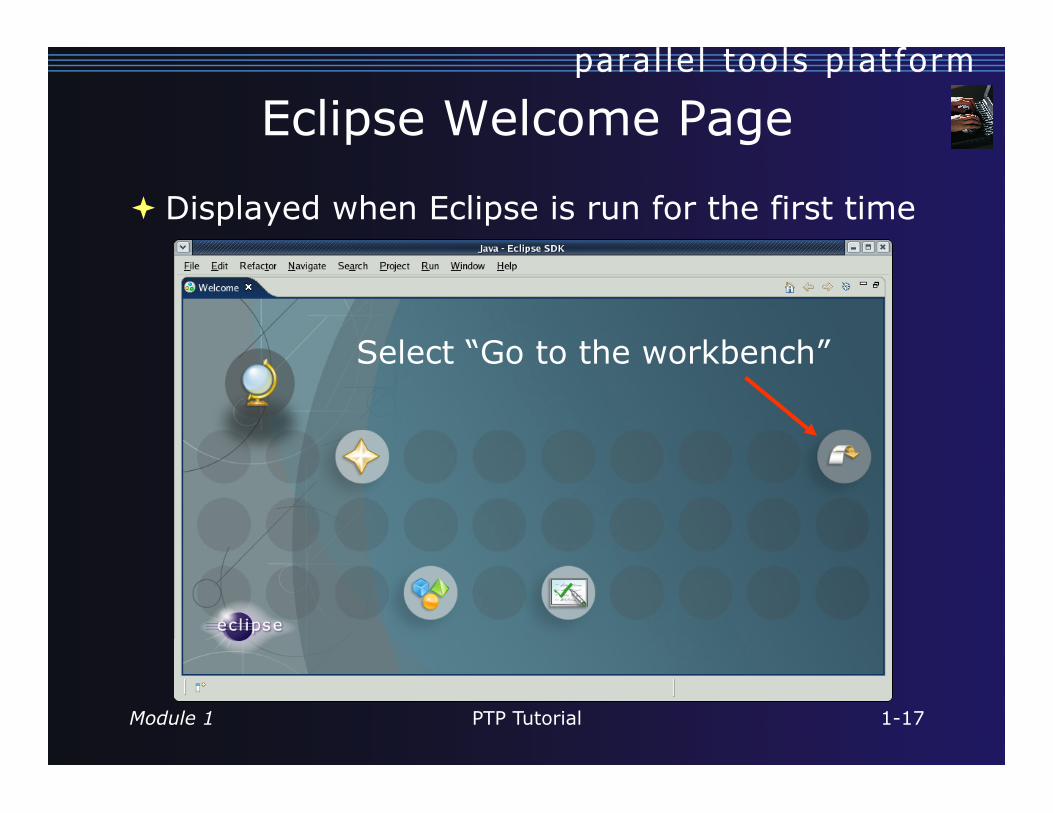
Eclipse Welcome Page
Displayed when Eclipse is run for the first time
Select “Go to the workbench”

PTP Tutorial 1-18 Module 1
Adding Features
New functionality is added to Eclipse using features Features are obtained and installed from an update site
(like a web site) Features can also be installed manually by copying files
to the features and plugins directories in the main eclipse directory

PTP Tutorial 1-19 Module 1
Installing Eclipse Features from an Update Site
Three types of update sites Remote - download and install from remote server Local - install from local directory Archived - a local site packaged as a zip or jar file
Eclipse 3.3.2 comes preconfigured with a link to the Europa Discovery Site This is a remote site that contains a large number of official
features Europa projects are guaranteed to work with Eclipse 3.3.2
Many other sites offer Eclipse features Use at own risk
PTP Tutorial 1-20 Module 1
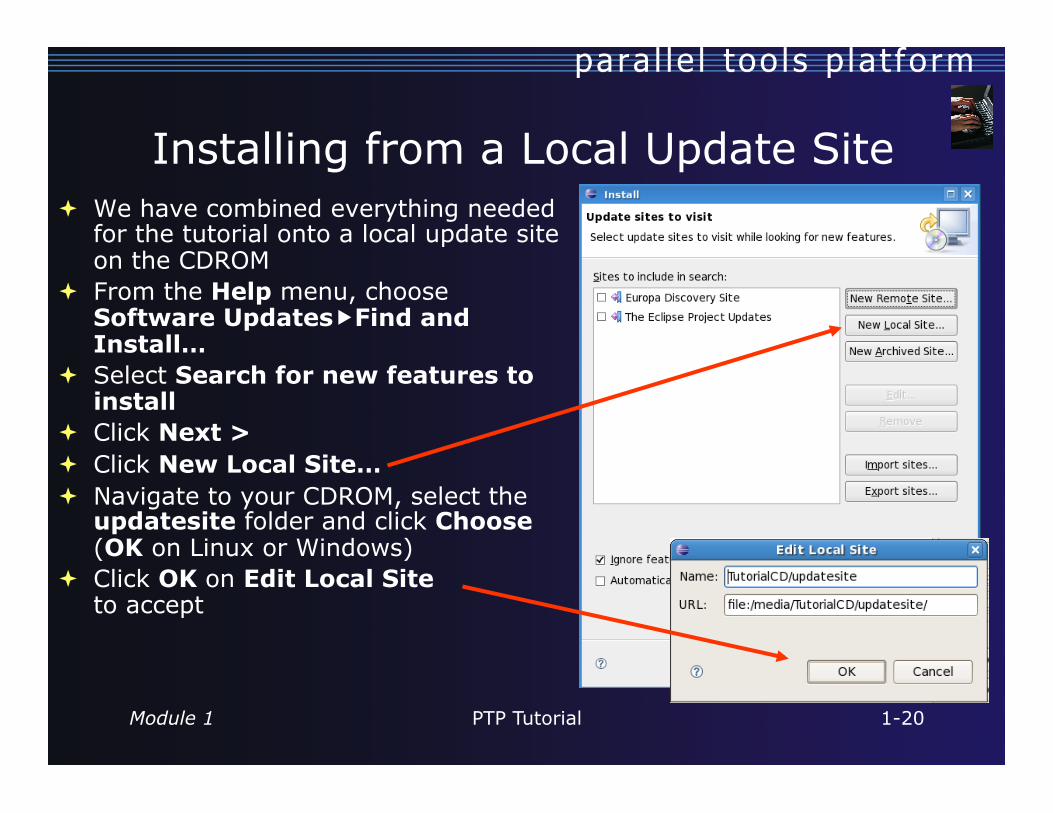
Installing from a Local Update Site We have combined everything needed
for the tutorial onto a local update site on the CDROM
From the Help menu, choose Software UpdatesFind and Install…
Select Search for new features to install
Click Next > Click New Local Site… Navigate to your CDROM, select the
updatesite folder and click Choose (OK on Linux or Windows)
Click OK on Edit Local Site to accept

PTP Tutorial 1-21 Module 1
Installing Tutorial Features
Make sure only TutorialCD/updatesite is selected
Click Finish to search the update site for features to install
From Search Results, check TutorialCD (open the twisty to see the contents)

PTP Tutorial 1-22 Module 1
Choose features
Choose PTP features to install
Easy way to choose: Select all Unselect anything
with red “X” This omits features
for which you lack the pre-requisites (e.g., RSE, TAU, Fortran)
PTP Tutorial 1-23 Module 1
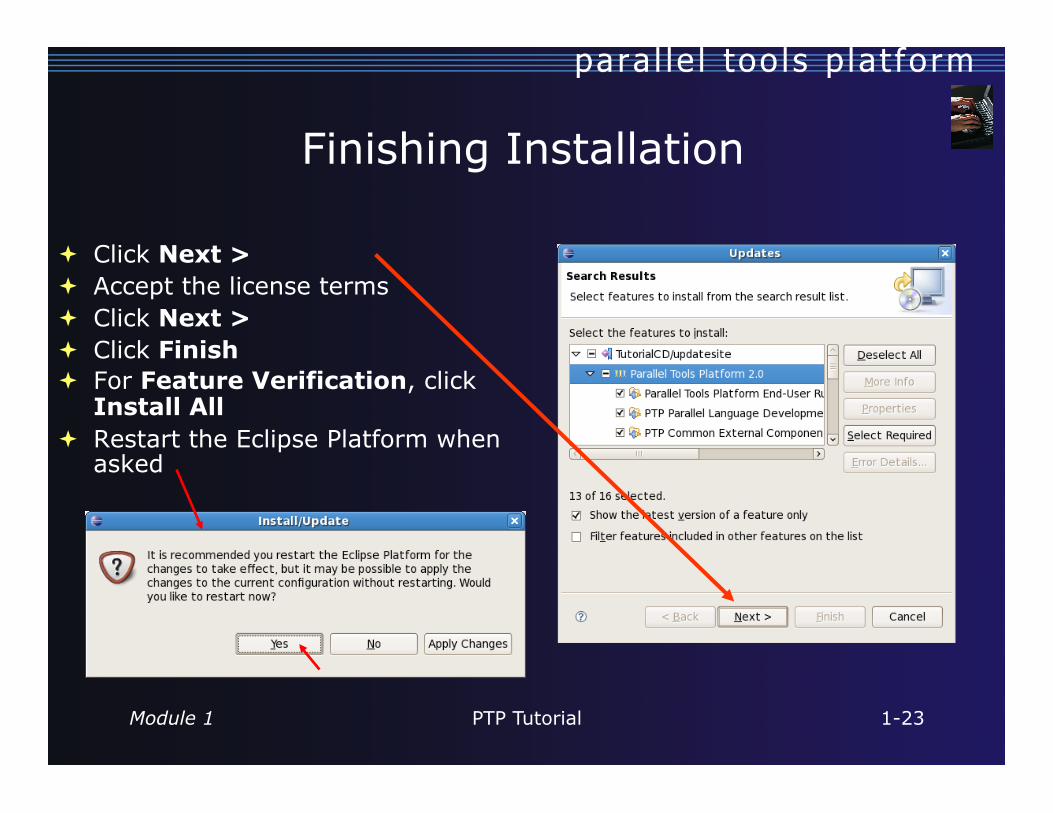
Finishing Installation
Click Next > Accept the license terms Click Next > Click Finish For Feature Verification, click
Install All Restart the Eclipse Platform when
asked

PTP Tutorial 1-24 Module 1
Restarting Eclipse
Yellow indicates new features just installed
Welcome page informs you of new features installed
Select workbench icon to go to workbench
Go to workbench

PTP Tutorial 1-25 Module 1
(Installing the PTP Proxy)
Normally installed on a parallel machine e.g. a cluster Can install on a non-parallel system
Not available for Windows Requires OpenMPI to be built and installed
This process depends on the type of machine Beyond the scope of this tutorial
To install the proxy, do the following steps from a terminal Change to your Eclipse installation directory Change to plugins/org.eclipse.ptp.os.arch_2.0*, where
os is your operating system (macosx or linux), arch is your architecture (ppc, x86, or x86_64)
Run the command: sh BUILD * Directory may include a suffix of build date timestamp.

PTP Tutorial 1-26 Module 1
Workbench
The Workbench represents the desktop development environment It contains a set of tools
for resource management It provides a common
way of navigating through the resources
Multiple workbenches can be opened at the same time
PTP Tutorial 1-27 Module 1
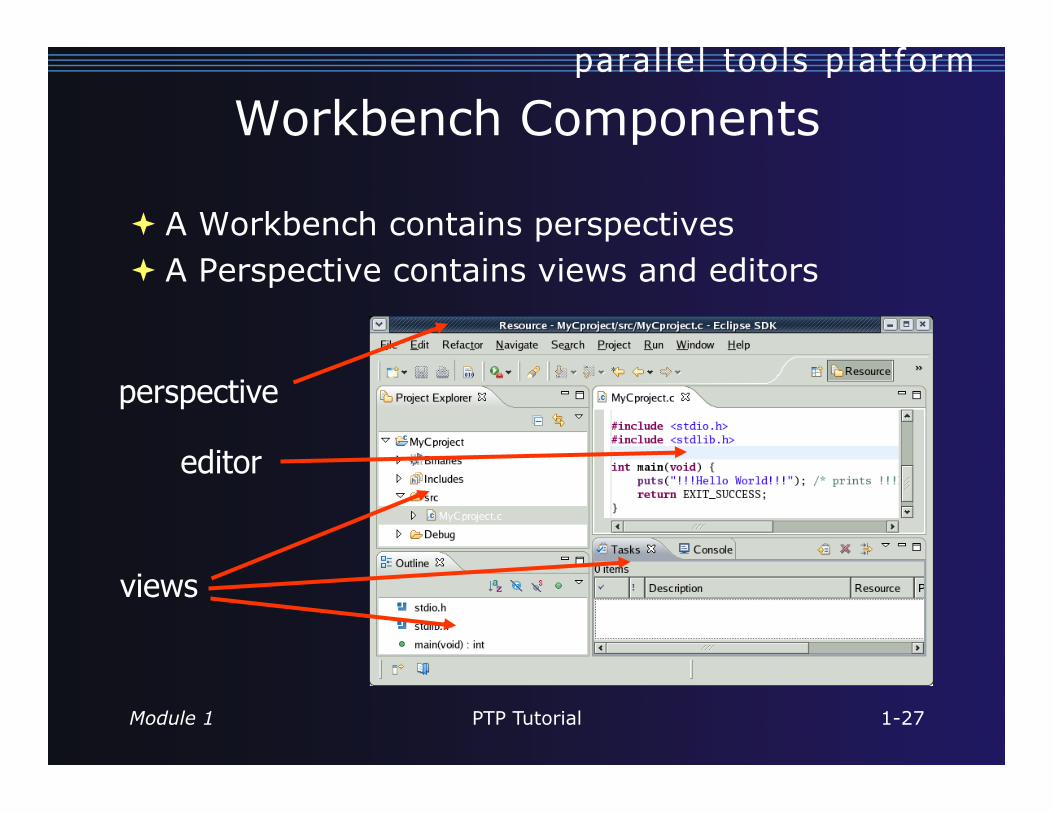
Workbench Components
A Workbench contains perspectives A Perspective contains views and editors
views
editor
perspective

PTP Tutorial 1-28 Module 1
Perspectives
Perspectives define the layout of views in the Workbench
They are task oriented, i.e. they contain specific views for doing certain tasks: There is a Resource Perspective for manipulating
resources C/C++ Perspective for manipulating compiled code Debug Perspective for debugging applications
You can easily switch between perspectives

PTP Tutorial 1-29 Module 1
Switching Perspectives
You can switch Perspectives by: Choosing the
WindowOpen Perspective menu option
Clicking on the Open Perspective button
Clicking on a perspective shortcut button

PTP Tutorial 1-30 Module 1
Available Perspectives
By default, certain perspectives are available in the Workbench
We’ll use: C/C++ PTP Runtime PTP Debug
Window Open Perspective

PTP Tutorial 1-31 Module 1
Views
The workbench window is divided up into Views
The main purpose of a view is: To provide alternative ways of presenting information For navigation For editing and modifying information
Views can have their own menus and toolbars Items available in menus and toolbars are
available only in that view Menu actions only
apply to the view
Views can be resized
view
view view
PTP Tutorial 1-32 Module 1
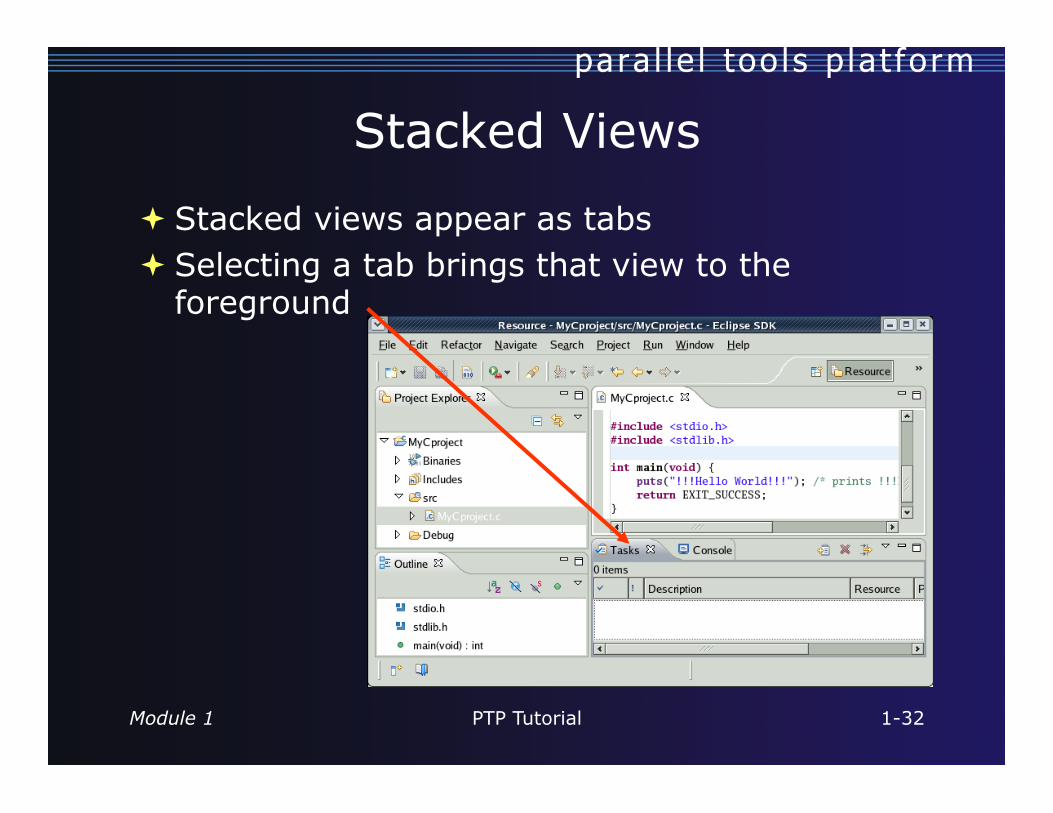
Stacked Views
Stacked views appear as tabs Selecting a tab brings that view to the
foreground

PTP Tutorial 1-33 Module 1
Help
Access help HelpHelp Contents HelpSearch HelpDynamic Help
Help Contents provides detailed help on different Eclipse features
Search allows you to search for help locally, or using Google or the Eclipse web site
Dynamic Help shows help related to the current context (perspective, view, etc.)

PTP Tutorial 1-34 Module 1
Open PTP Runtime Perspective Window > Open Perspective > Other…
PTP Tutorial 1-35 Module 1
Terminology
The PTP Runtime perspective is provided for monitoring and controlling applications
Some terminology Resource manager - Corresponds to an instance of
a resource management system (e.g. a job scheduler). You can have multiple resource mangers connected to different machines.
Queue - A queue of pending jobs Job – A single run of a parallel application Machine - A parallel computer system Node - Some form of computational resource Process - An execution unit (may be multiple
threads of execution)
PTP Tutorial 1-36 Module 1
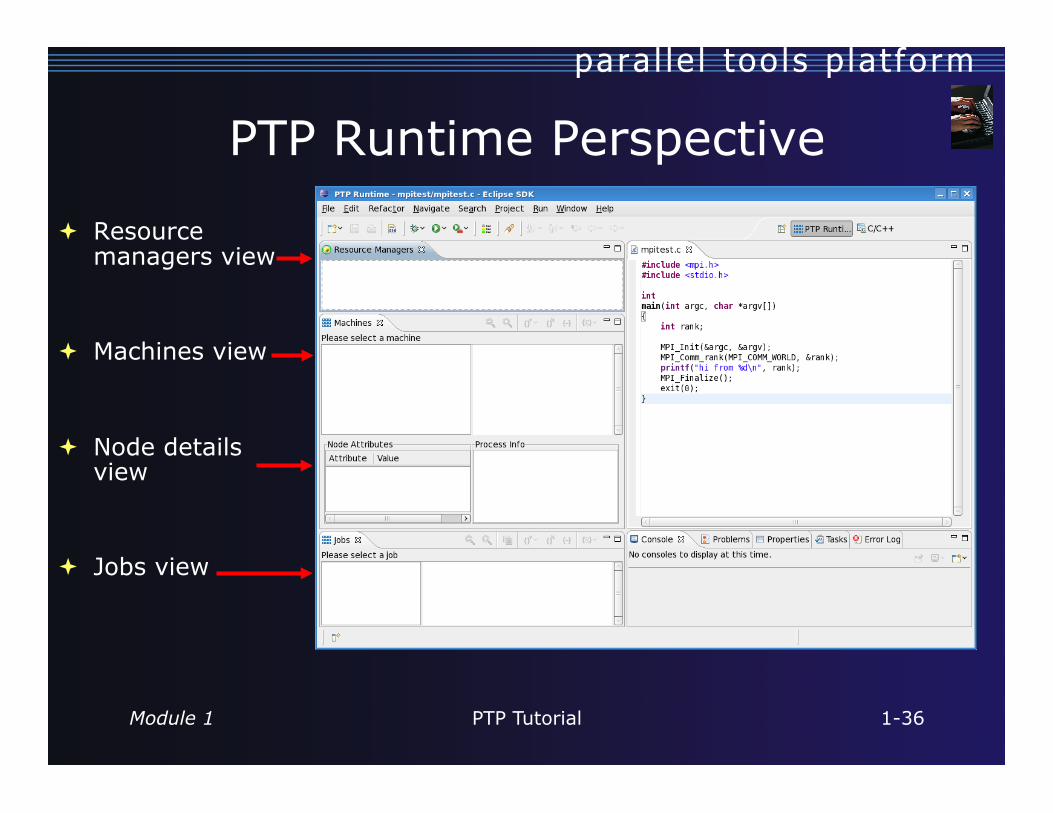
PTP Runtime Perspective
Resource managers view
Machines view
Node details view
Jobs view
PTP Tutorial 1-37 Module 1
Resource Managers
PTP uses the term resource manager to refer to any subsystem that controls the resources required for launching a parallel job.
Examples: Job scheduler (e.g. LoadLeveler) Open MPI Runtime Environment (ORTE)
Each resource manager controls one target system Resource Managers can be local or remote

PTP Tutorial 1-38 Module 1
Adding a Resource Manager
Right-click in Resource Managers view and select Add Resource Manager
Choose the ORTE Resource Manager Type
Select Next>
PTP Tutorial 1-39 Module 1
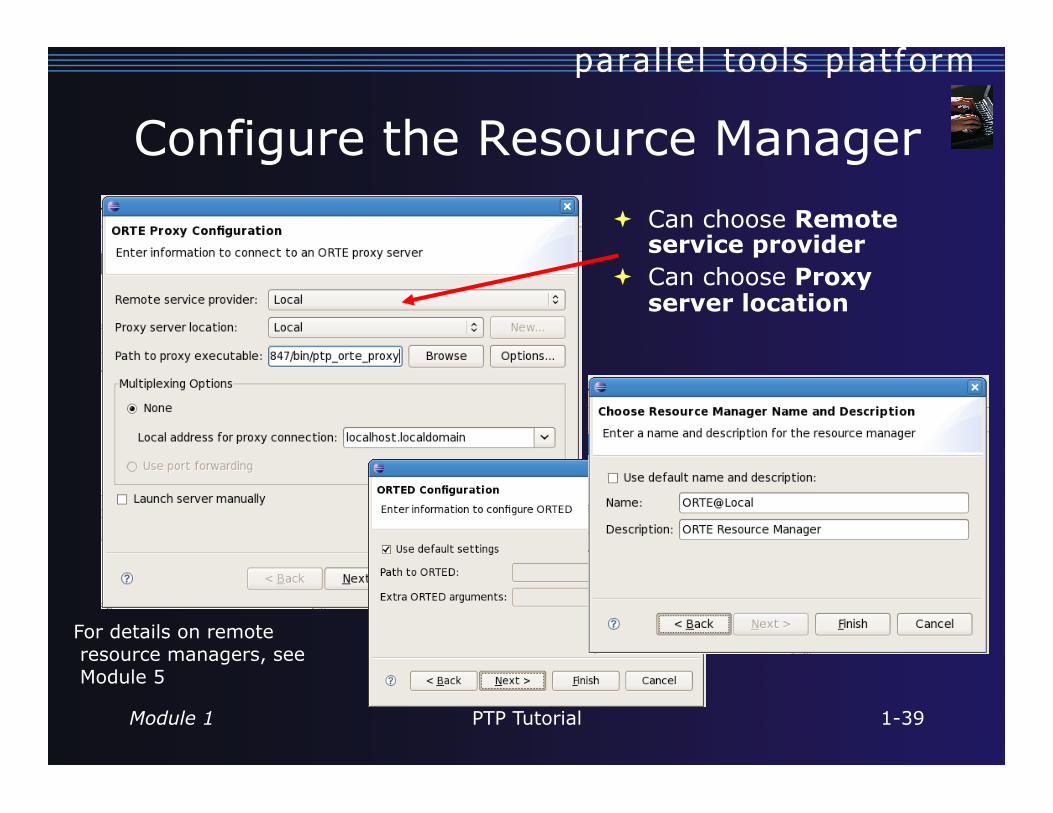
Configure the Resource Manager Can choose Remote
service provider Can choose Proxy
server location
For details on remote resource managers, see Module 5

PTP Tutorial 1-40 Module 1
Starting the Resource Manager
Right click on new resource manager and select Start resource manager
If everything is ok, you should see the resource manager change to green
If something goes wrong, it will change to red

PTP Tutorial 1-41 Module 1
System Monitoring
Machine status shown in Machines view
Node status also shown Machines view
Hover over node to see node name
Double-click on node to show attributes

PTP Tutorial 2-0 Module 2
Module 2: Creating and Running MPI Programs
Objective Learn how to use Eclipse to develop parallel programs Learn how to run and monitor a parallel program
Contents Brief introduction to the C/C++ Development Tools Create a simple application Learn to launch a parallel job and view it via the PTP
Runtime Perspective

PTP Tutorial 2-1 Module 2
Switch to C/C++ Perspective Only needed if
you’re not already in the perspective

PTP Tutorial 2-2 Module 2
Project Explorer View
Represents user’s data It is a set of user defined
resources Files Folders Projects
Collections of files and folders
Plus meta-data
Resources are visible in the Project Explorer View
PTP Tutorial 2-3 Module 2
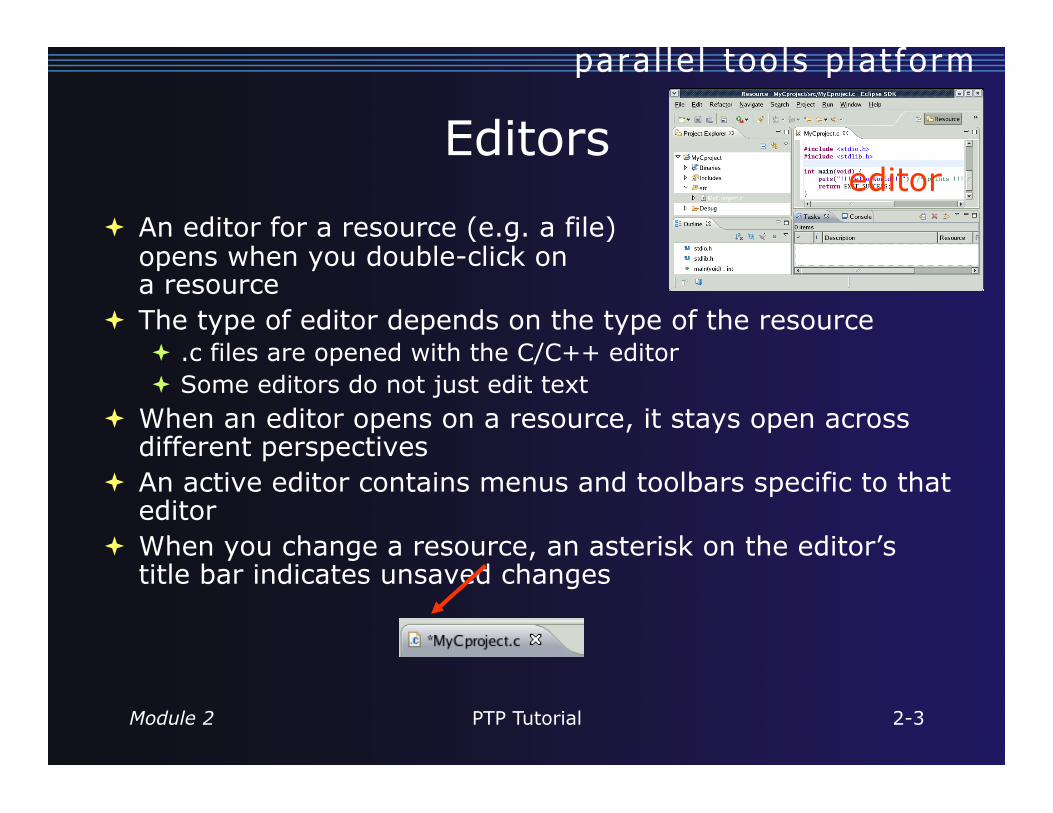
Editors
An editor for a resource (e.g. a file) opens when you double-click on a resource
The type of editor depends on the type of the resource .c files are opened with the C/C++ editor Some editors do not just edit text
When an editor opens on a resource, it stays open across different perspectives
An active editor contains menus and toolbars specific to that editor
When you change a resource, an asterisk on the editor’s title bar indicates unsaved changes
editor
PTP Tutorial 2-4 Module 2
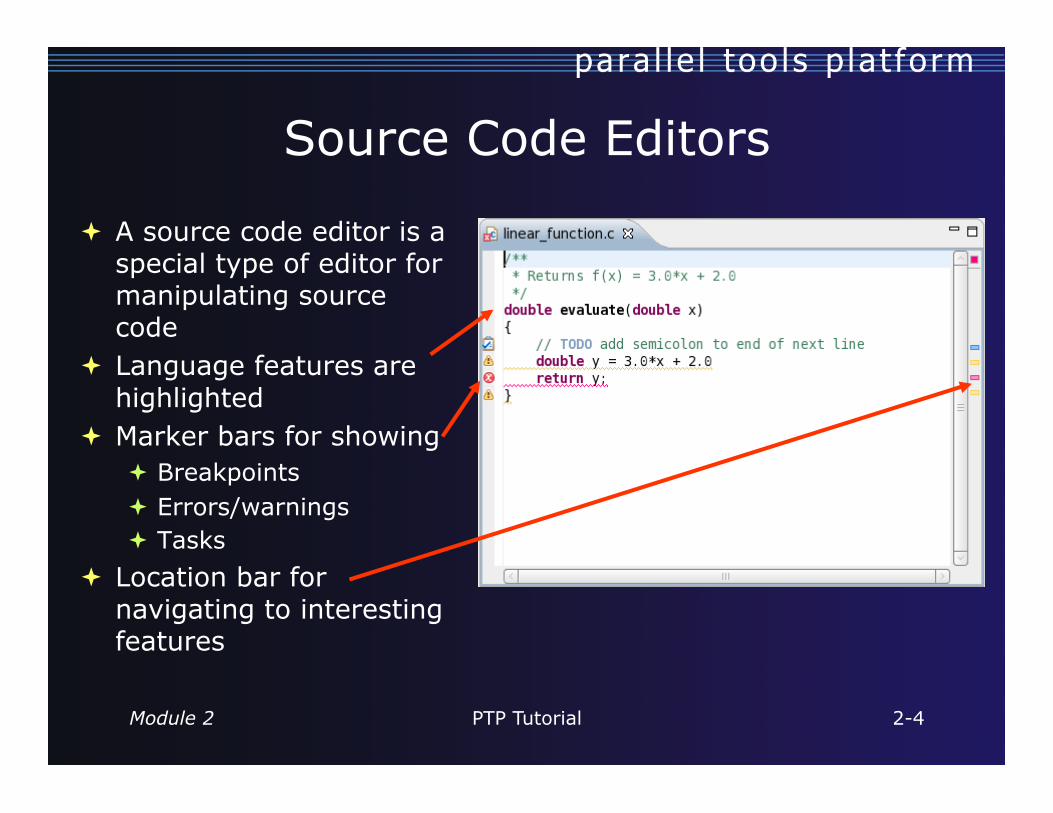
Source Code Editors
A source code editor is a special type of editor for manipulating source code
Language features are highlighted
Marker bars for showing Breakpoints Errors/warnings Tasks
Location bar for navigating to interesting features
PTP Tutorial 2-5 Module 2
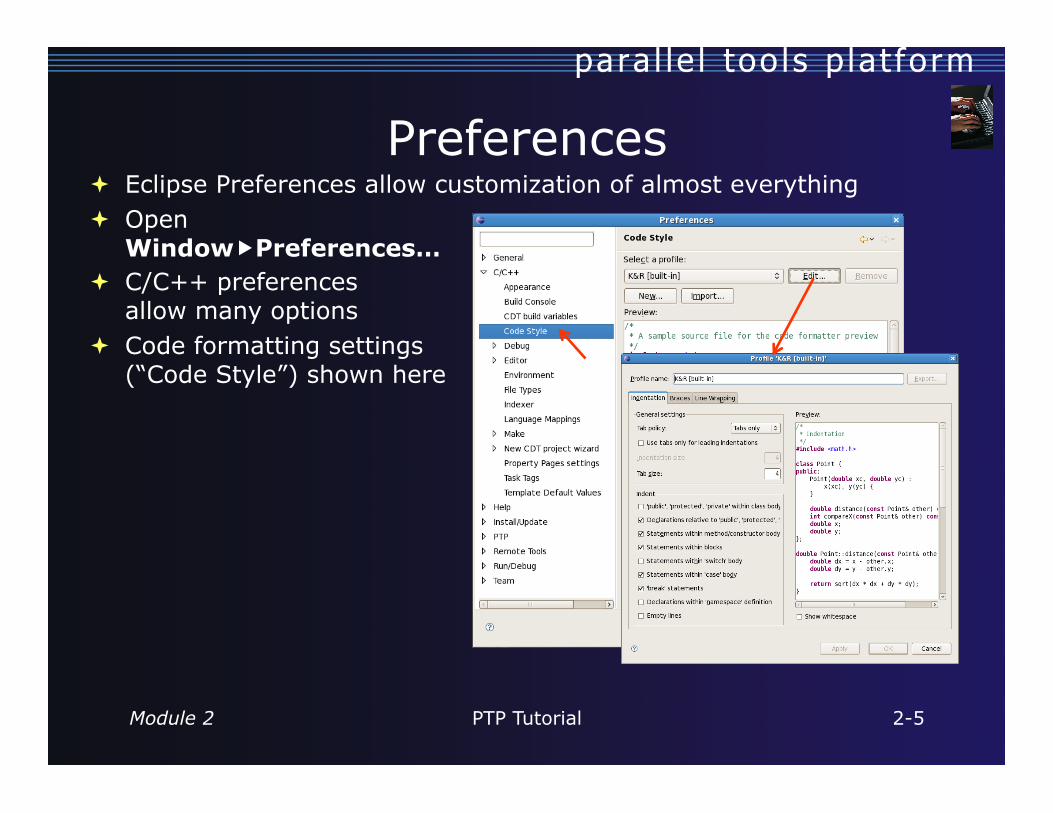
Preferences Eclipse Preferences allow customization of almost everything Open
WindowPreferences… C/C++ preferences
allow many options Code formatting settings
(“Code Style”) shown here
PTP Tutorial 2-6 Module 2
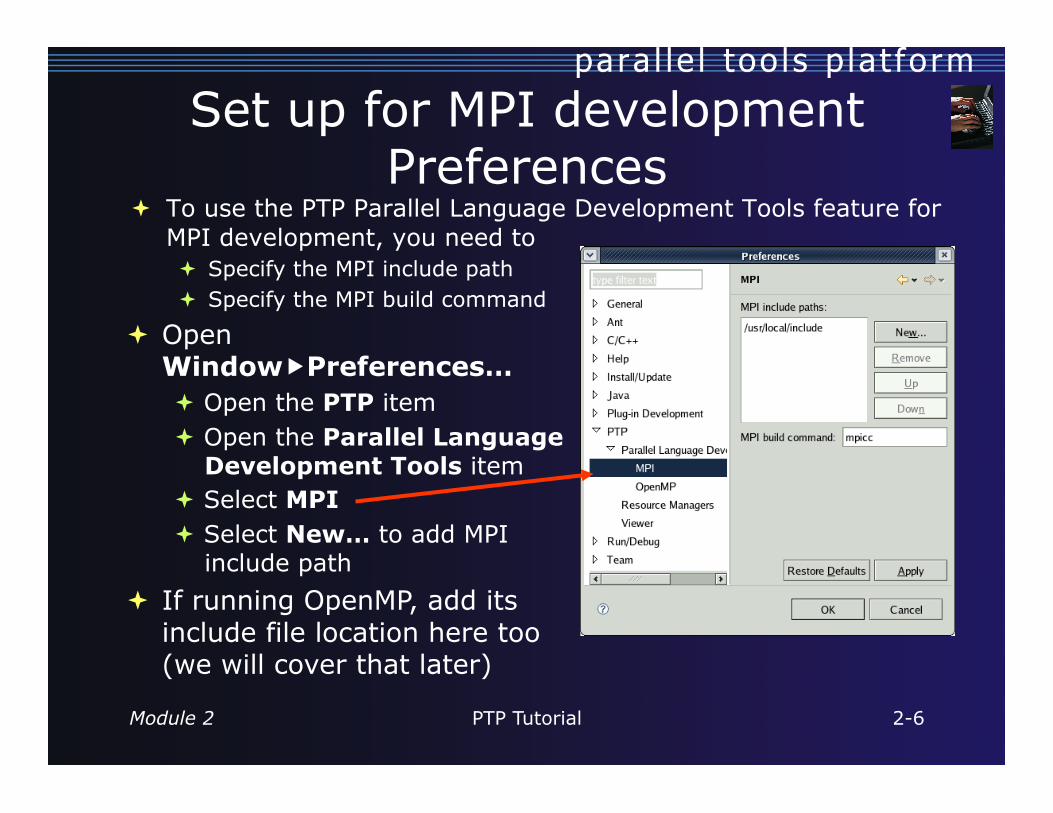
Set up for MPI development Preferences
To use the PTP Parallel Language Development Tools feature for MPI development, you need to Specify the MPI include path Specify the MPI build command
Open WindowPreferences… Open the PTP item Open the Parallel Language
Development Tools item Select MPI Select New… to add MPI
include path If running OpenMP, add its
include file location here too (we will cover that later)
PTP Tutorial 2-7 Module 2
Creating a Parallel Application
Steps: Create a new C project Edit source code Save and build

PTP Tutorial 2-8 Module 2
Creating a simple MPI Project (1)
Create a new MPI project FileNewC Project Name the project
‘MyHelloProject’ Under Project types, under
Executable, select MPI Hello World C Project and hit Next
On Basic Settings page, fill in information for your new project (Author name etc.) and hit Next
PTP Tutorial 2-9 Module 2
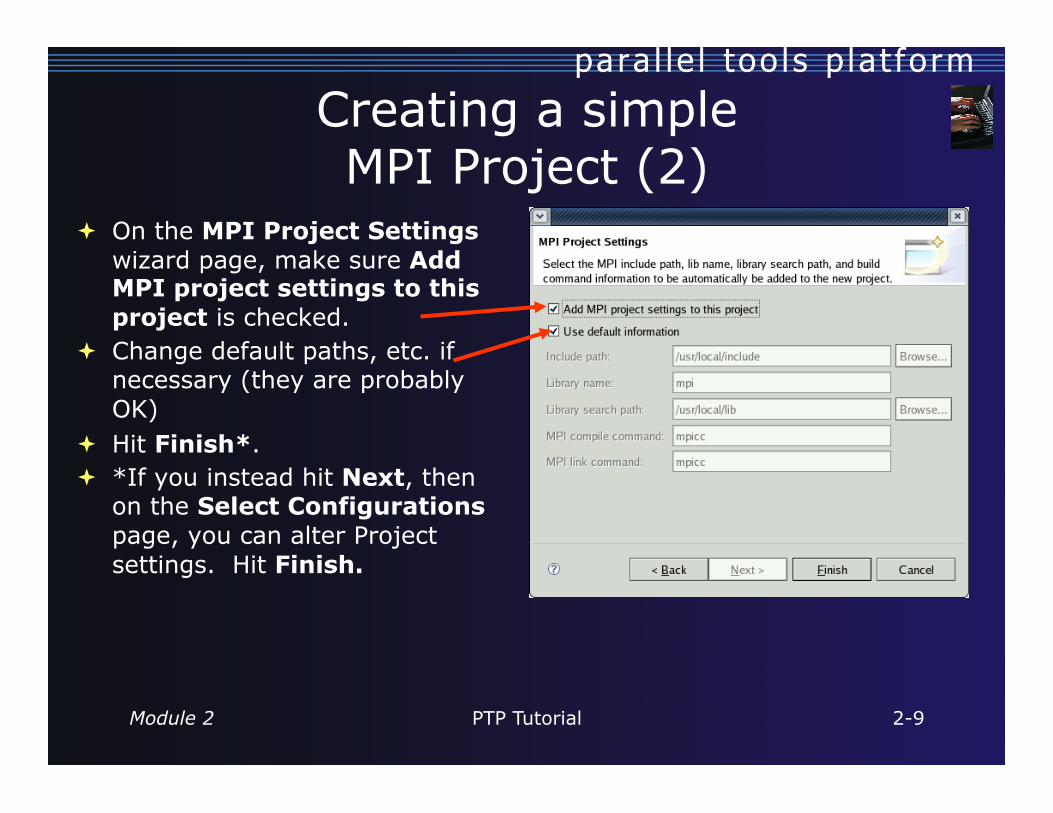
Creating a simple MPI Project (2)
On the MPI Project Settings wizard page, make sure Add MPI project settings to this project is checked.
Change default paths, etc. if necessary (they are probably OK)
Hit Finish*. *If you instead hit Next, then
on the Select Configurations page, you can alter Project settings. Hit Finish.

Open the project properties by right-mouse clicking on project and select Properties
Open C/C++ Build Select Settings Select GCC C Compiler to
change compiler settings Select GCC C Linker to
change linker settings It’s also possible to change
compiler/linker arguments
PTP Tutorial 2-10 Module 2
Changing the C/C++ Build Settings Manually
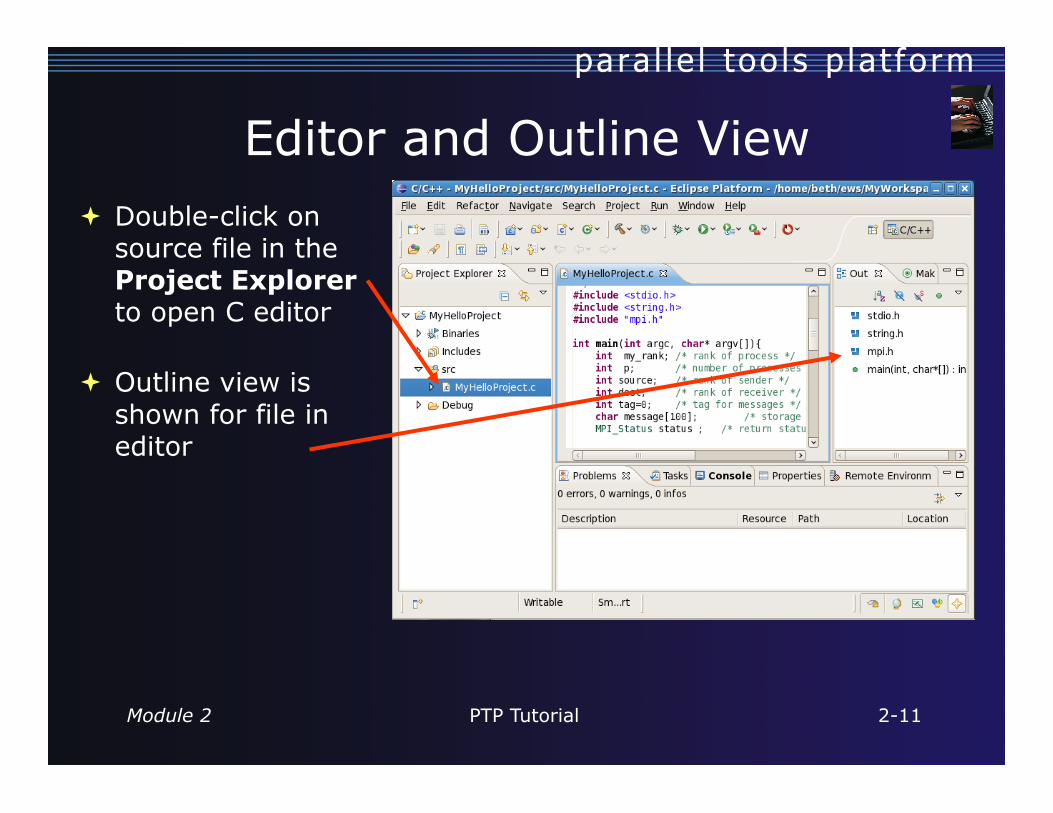
Editor and Outline View Double-click on
source file in the Project Explorer to open C editor
Outline view is shown for file in editor
PTP Tutorial 2-11 Module 2
PTP Tutorial 2-12 Module 2
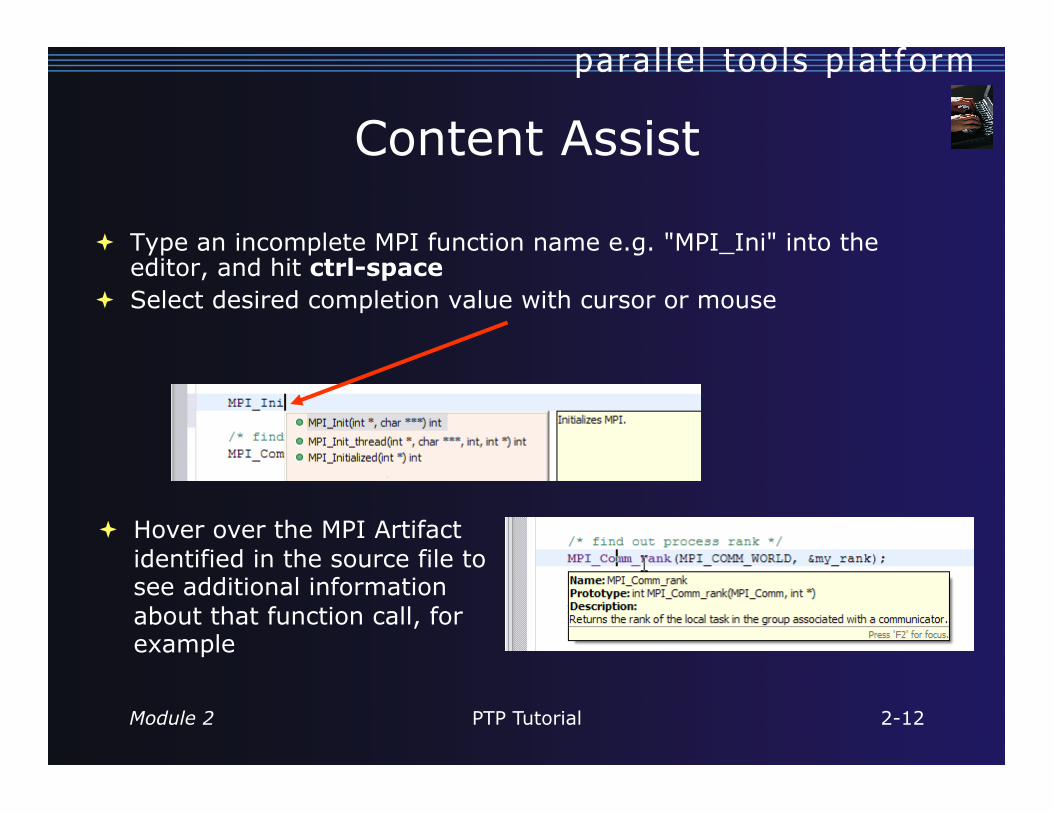
Hover over the MPI Artifact identified in the source file to see additional information about that function call, for example
Content Assist
Type an incomplete MPI function name e.g. "MPI_Ini" into the editor, and hit ctrl-space
Select desired completion value with cursor or mouse

PTP Tutorial 2-13 Module 2
Context Sensitive Help Click mouse, then press help
key when the cursor is within a function name Windows: F1 key Linux: ctrl-F1 key MacOS X: Help key or
HelpDynamic Help A help view appears (Related
Topics) which shows additional information
Click on the function name to see more information
Move the help view within your Eclipse workbench, if you like, by dragging its title tab
PTP Tutorial 2-14 Module 2
Running a Parallel Application
Steps: Create a launch configuration Run the application Monitor its progress in the PTP Runtime
Perspective
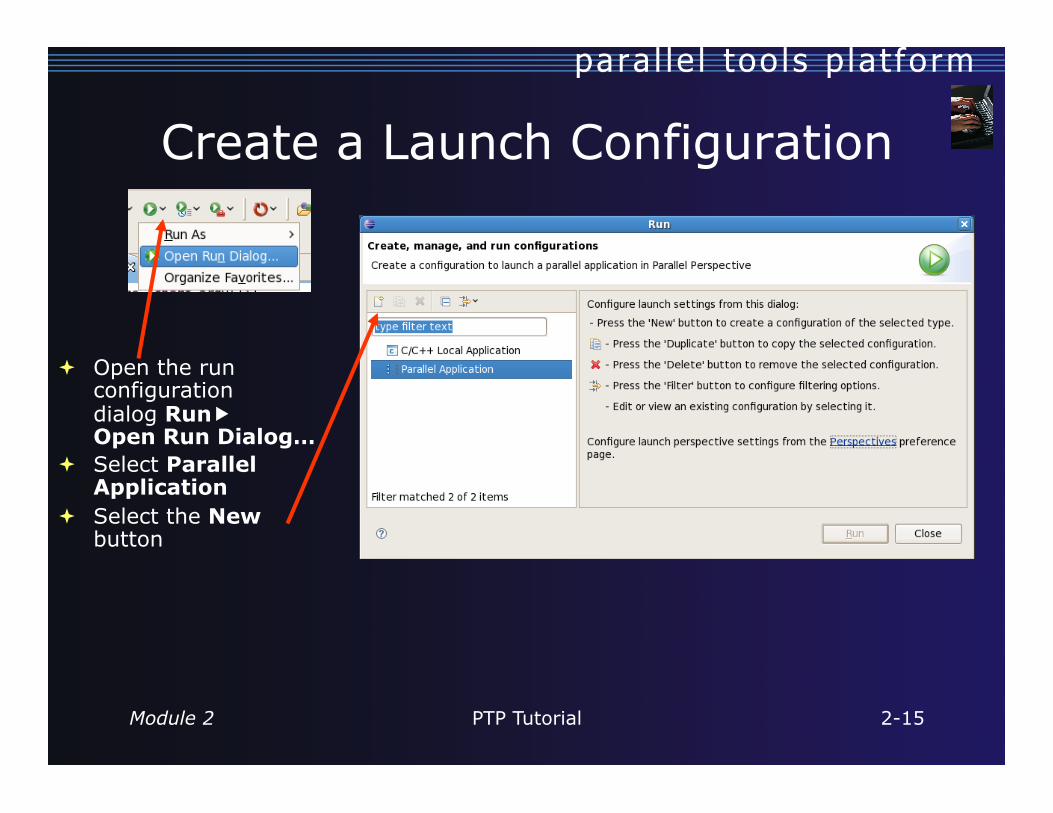
Open the run configuration dialog Run Open Run Dialog…
Select Parallel Application
Select the New button
PTP Tutorial 2-15 Module 2
Create a Launch Configuration

PTP Tutorial 2-16 Module 2
Complete the Resources Tab In Resources tab, select
the resource manager you want to use to launch this job
Enter a value in the Number of Processes field
PTP Tutorial 2-17 Module 2
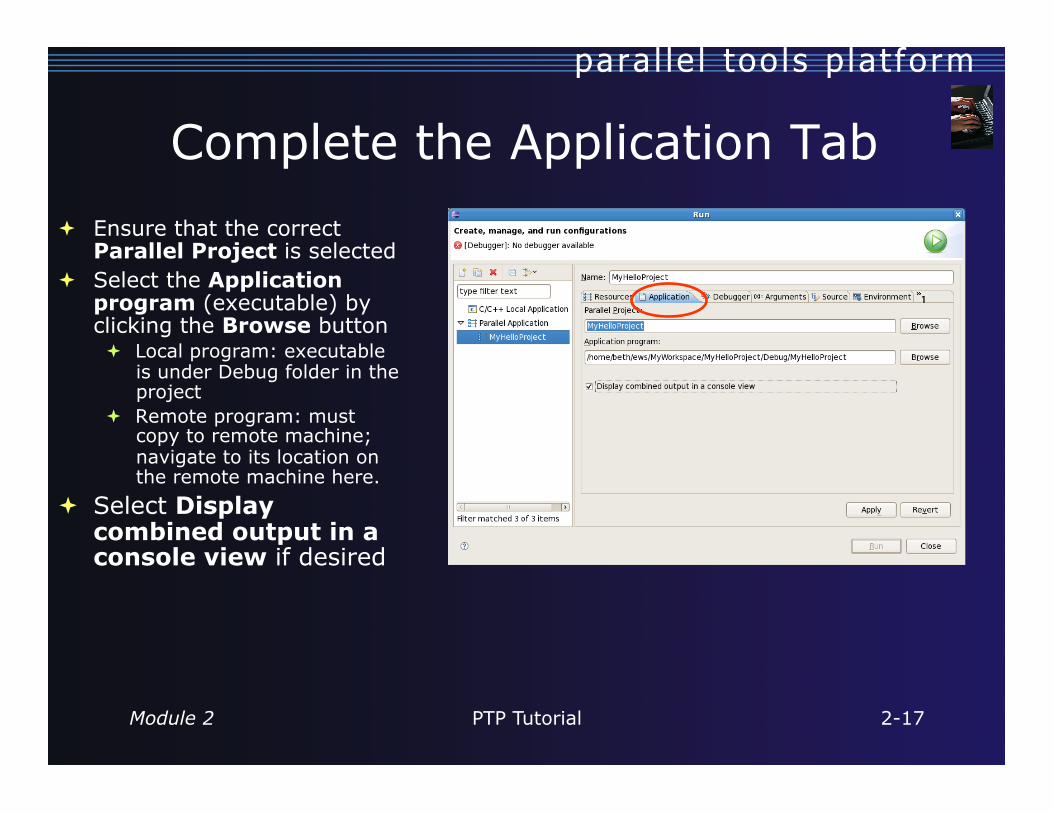
Complete the Application Tab Ensure that the correct
Parallel Project is selected Select the Application
program (executable) by clicking the Browse button Local program: executable
is under Debug folder in the project
Remote program: must copy to remote machine; navigate to its location on the remote machine here.
Select Display combined output in a console view if desired
PTP Tutorial 2-18 Module 2
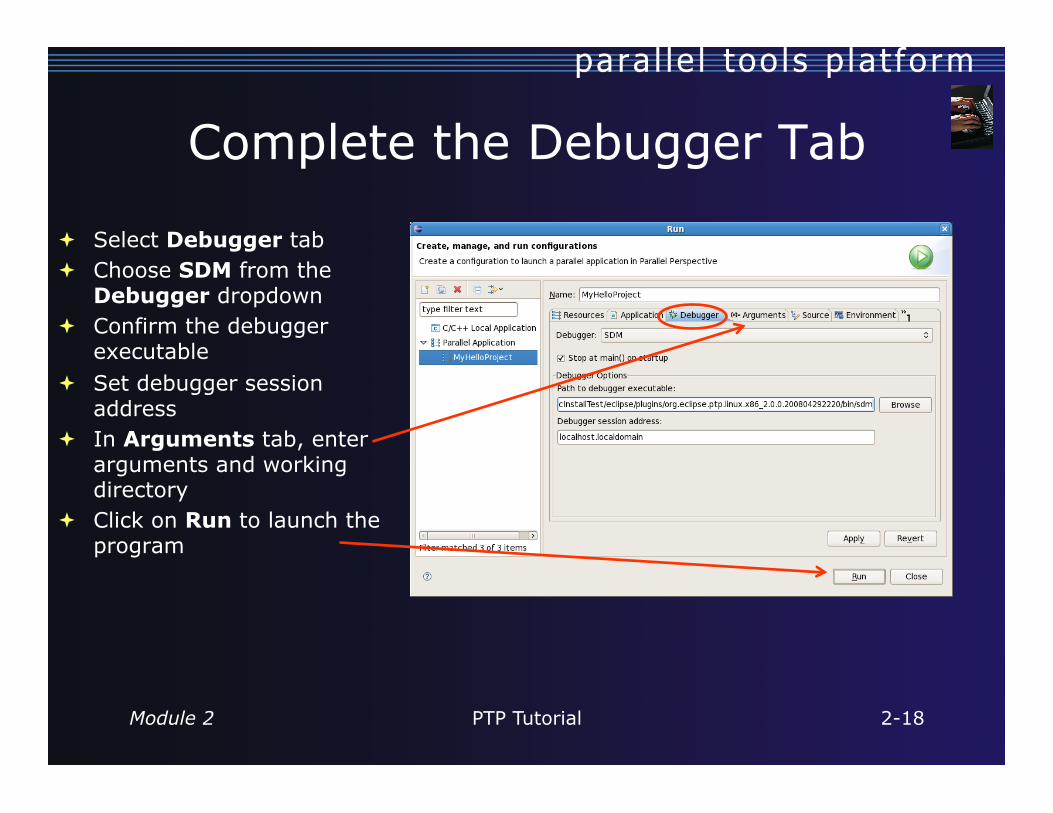
Complete the Debugger Tab
Select Debugger tab Choose SDM from the
Debugger dropdown Confirm the debugger
executable Set debugger session
address In Arguments tab, enter
arguments and working directory
Click on Run to launch the program
PTP Tutorial 2-19 Module 2
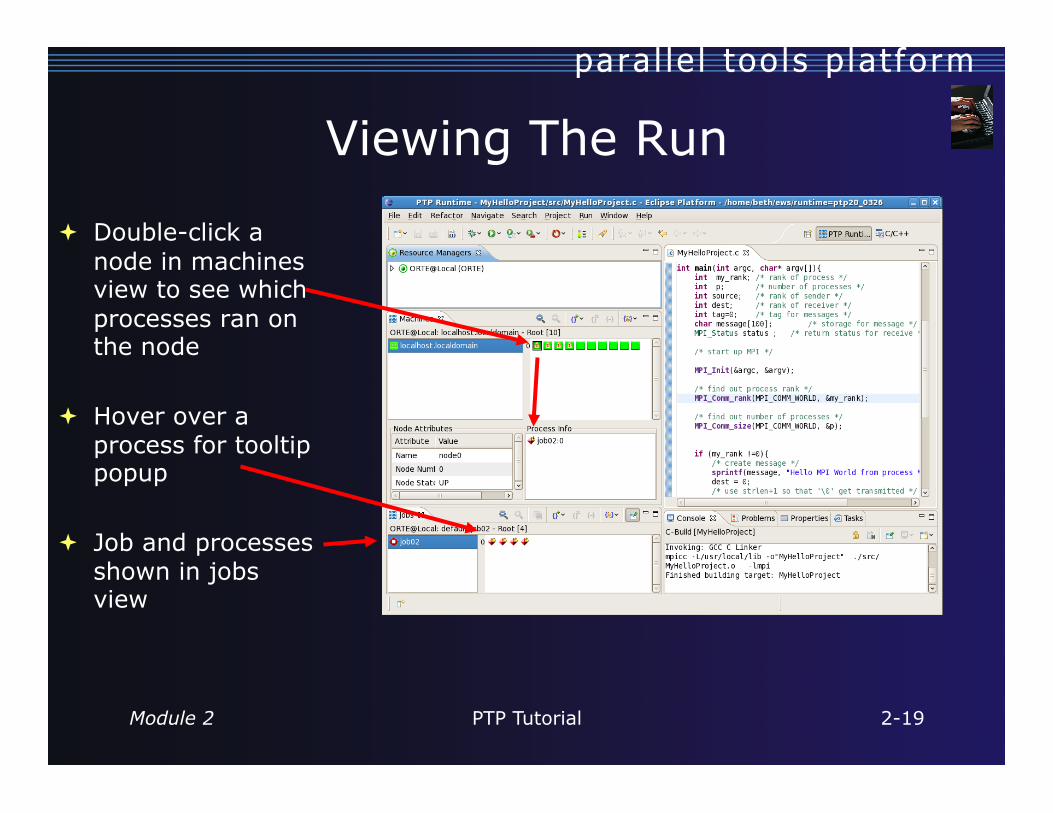
Viewing The Run
Double-click a node in machines view to see which processes ran on the node
Hover over a process for tooltip popup
Job and processes shown in jobs view

PTP Tutorial 2-20 Module 2
Viewing Program Output
Double-click a process to see process detail and standard output from the process
PTP Tutorial 2-21 Module 2
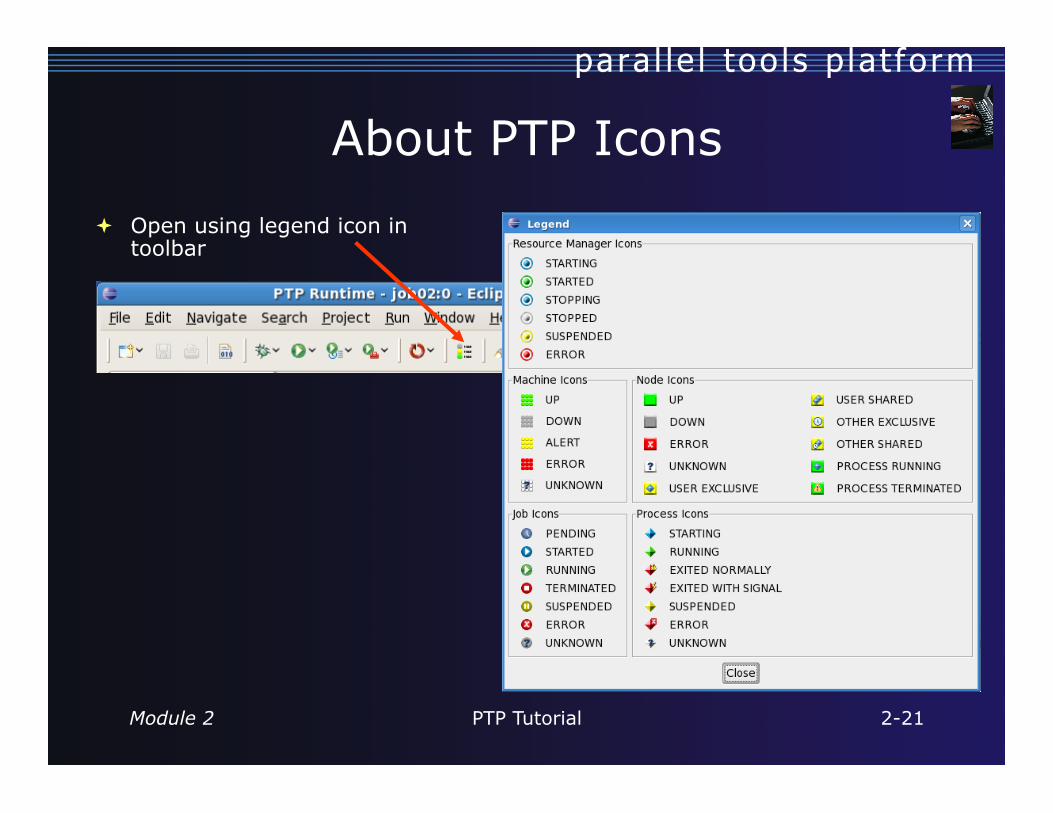
About PTP Icons Open using legend icon in
toolbar
Module 3 3-0 PTP Tutorial
Module 3: PTP and Parallel Language Development Tools
Objective Learn to develop a parallel program Learn to analyse with PLDT
Contents Learn to use PTP’s Parallel Language Development
Tools Learn to find MPI & OpenMP artifacts Learn how to do MPI and OpenMP Specific analysis

Module 3 3-1 PTP Tutorial
Parallel Language Development Tools (1)
Features Analysis of C and C++ code to determine the location
of MPI and OpenMP Artifacts (Fortran planned) "Artifact View" indicates locations of Artifacts found in
source code Navigation to source code location of artifacts Content assist via ctrl+space (“completion”) Hover help Reference information about the MPI and OpenMP calls
via Dynamic Help
Module 3 3-2 PTP Tutorial
Parallel Language Development Tools (2)
More PLDT features: New project wizard automatically configures
managed build projects for MPI & OpenMP OpenMP problems view of common errors OpenMP “show #pragma region” action OpenMP “show concurrency” action MPI Barrier analysis - detects potential deadlocks

Module 3 3-3 PTP Tutorial
Show MPI Artifacts Select source file; Run
analysis by clicking on drop-down menu next to the analysis button and selecting Show MPI Artifacts
Markers indicate the location of artifacts in editor
In MPI Artifact View sort by any column (click on col. heading)
Navigate to source code line by double-clicking on the artifact
Run the analysis on another file and its markers will be added to the view
Remove markers via

Module 3 3-4 PTP Tutorial
MPI Barrier Analysis Verify barrier synchronization in C/MPI programs Interprocedural static analysis outputs:
For verified programs, lists barrier statements that synchronize together (match) For synchronization errors, reports counter example that illustrates and explains the error.
Module 3 3-5 PTP Tutorial
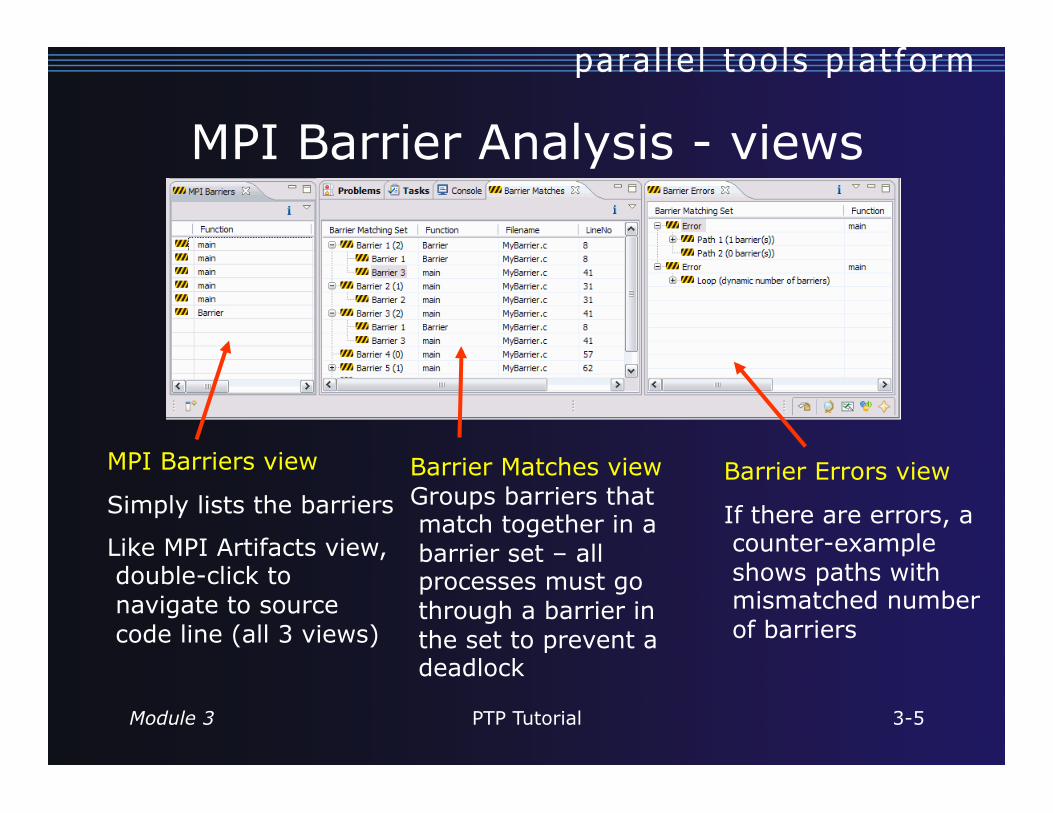
MPI Barrier Analysis - views
MPI Barriers view
Simply lists the barriers
Like MPI Artifacts view, double-click to navigate to source code line (all 3 views)
Barrier Matches view Groups barriers that match together in a barrier set – all processes must go through a barrier in the set to prevent a deadlock
Barrier Errors view
If there are errors, a counter-example shows paths with mismatched number of barriers
Module 3 3-6 PTP Tutorial
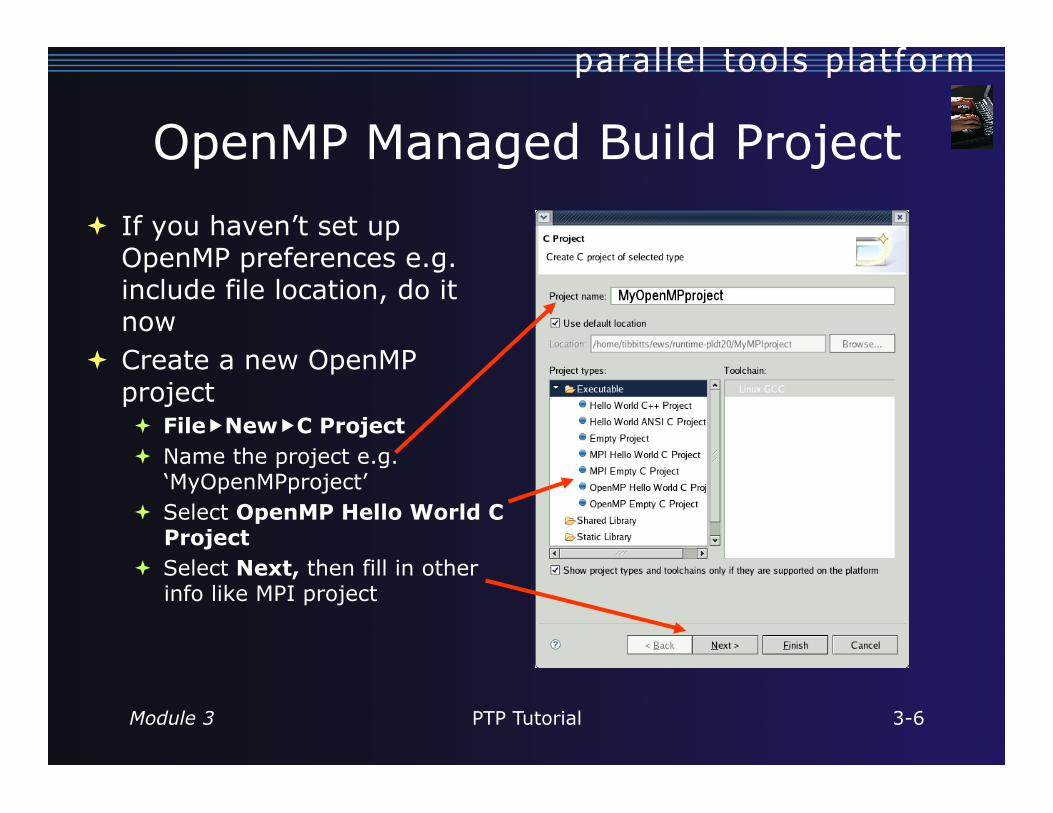
OpenMP Managed Build Project If you haven’t set up
OpenMP preferences e.g. include file location, do it now
Create a new OpenMP project FileNewC Project Name the project e.g.
‘MyOpenMPproject’ Select OpenMP Hello World C
Project Select Next, then fill in other
info like MPI project

Module 3 3-7 PTP Tutorial
Setting OpenMP Special Build Options
OpenMP typically requires special compiler options. Open the project
properties Select C/C++ Build Select Settings Select C Compiler
In Miscellaneous, add option(s).

Module 3 3-8 PTP Tutorial
Show OpenMP Artifacts
Select source file, folder, or project
Run analysis
See artifacts in OpenMP Artifact view

Module 3 3-9 PTP Tutorial
Show Pragma Region Run OpenMP
analysis Right click on
pragma in artifact view
Select Show pragma region
See highlighted region in C editor
Module 3 3-10 PTP Tutorial
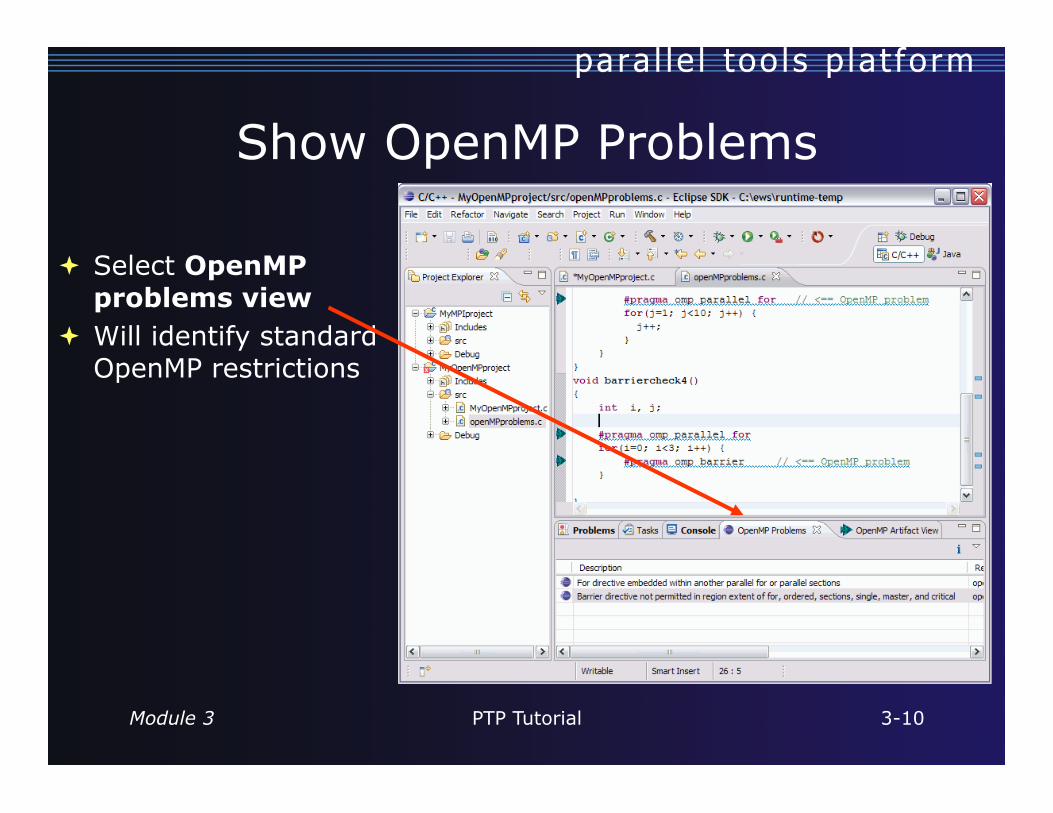
Show OpenMP Problems
Select OpenMP problems view
Will identify standard OpenMP restrictions

Module 3 3-11 PTP Tutorial
Show Concurrency Highlight a statement Select the context menu
on the highlighted statement, and click Show concurrency
Other statements will be highlighted in yellow
The yellow highlighted statements might execute concurrently to the selected statement
Module 4 PTP Tutorial 4-0
Module 4: Parallel Debugging
Objective Learn the basics of debugging parallel programs with
PTP
Contents Launching a parallel debug session The PTP Debug Perspective Controlling sets of processes Controlling individual processes Parallel Breakpoints Terminating processes

Module 4 PTP Tutorial 4-1
Launching A Debug Session Use the drop-down next to
the debug button (bug icon) instead of run button
Select the project to launch The debug launch will use
the same number of processes that the normal launch used (edit the Debug Launch Configuration to change)
Module 4 PTP Tutorial 4-2
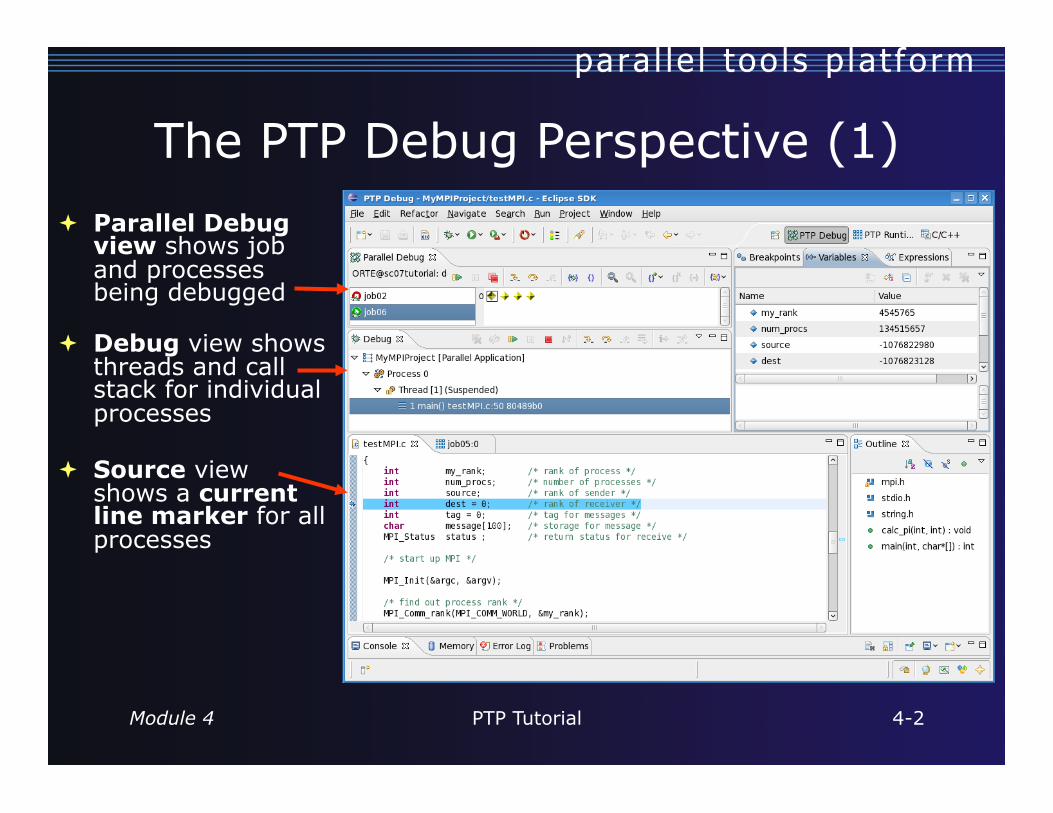
Parallel Debug view shows job and processes being debugged
Debug view shows threads and call stack for individual processes
Source view shows a current line marker for all processes
The PTP Debug Perspective (1)

Module 4 PTP Tutorial 4-3
The PTP Debug Perspective (2)
Breakpoints view shows breakpoints that have been set (more on this later)
Variables view shows the current values of variables for the currently selected process in the Debug view
Outline view (from CDT) of source code
Module 4 PTP Tutorial 4-4
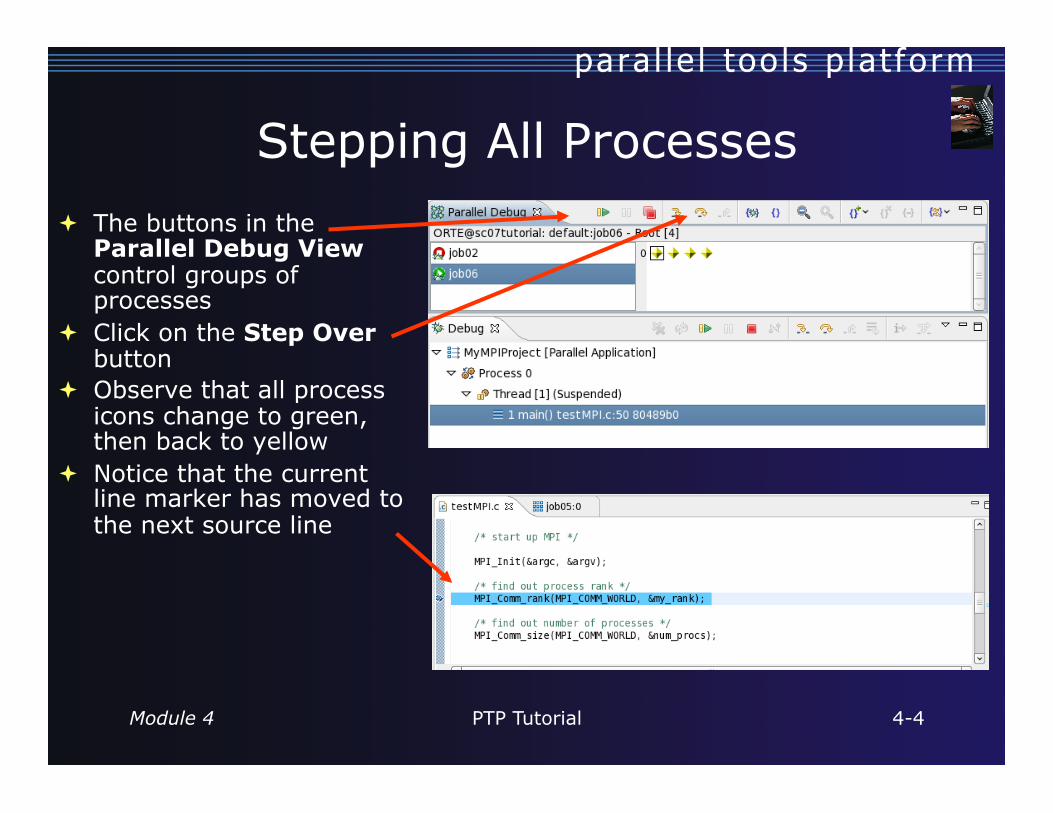
Stepping All Processes The buttons in the
Parallel Debug View control groups of processes
Click on the Step Over button
Observe that all process icons change to green, then back to yellow
Notice that the current line marker has moved to the next source line
Module 4 PTP Tutorial 4-5
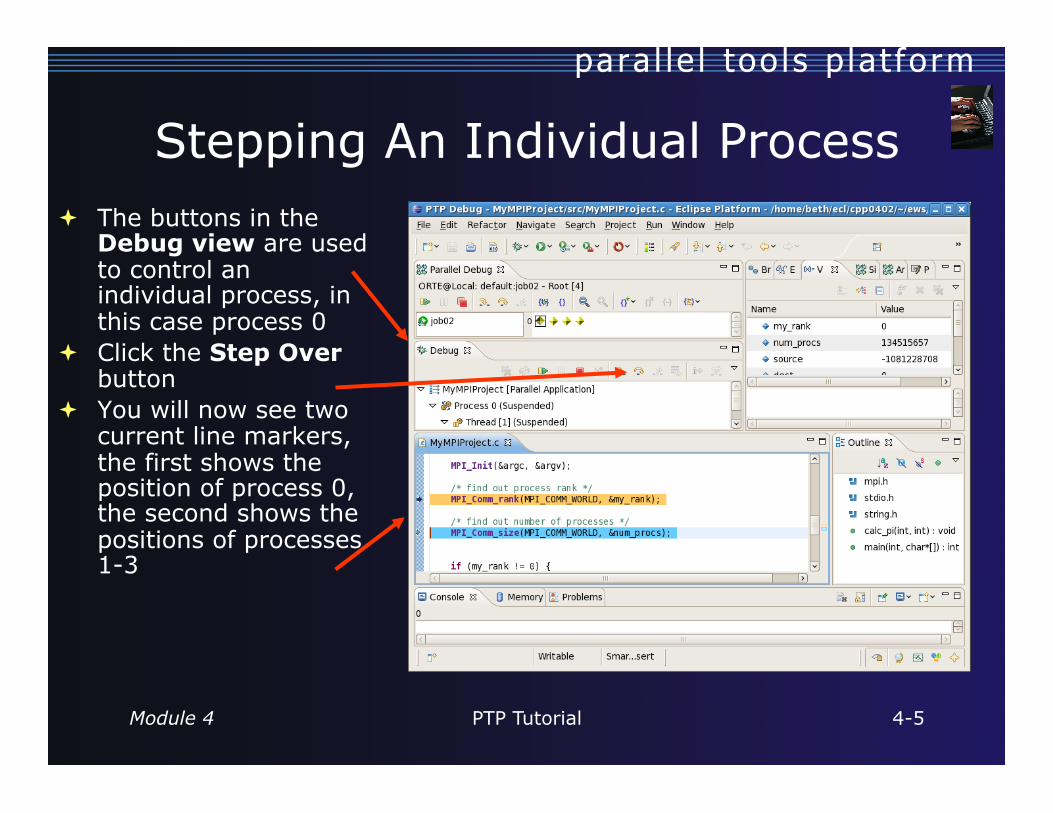
Stepping An Individual Process The buttons in the
Debug view are used to control an individual process, in this case process 0
Click the Step Over button
You will now see two current line markers, the first shows the position of process 0, the second shows the positions of processes 1-3
Module 4 PTP Tutorial 4-6
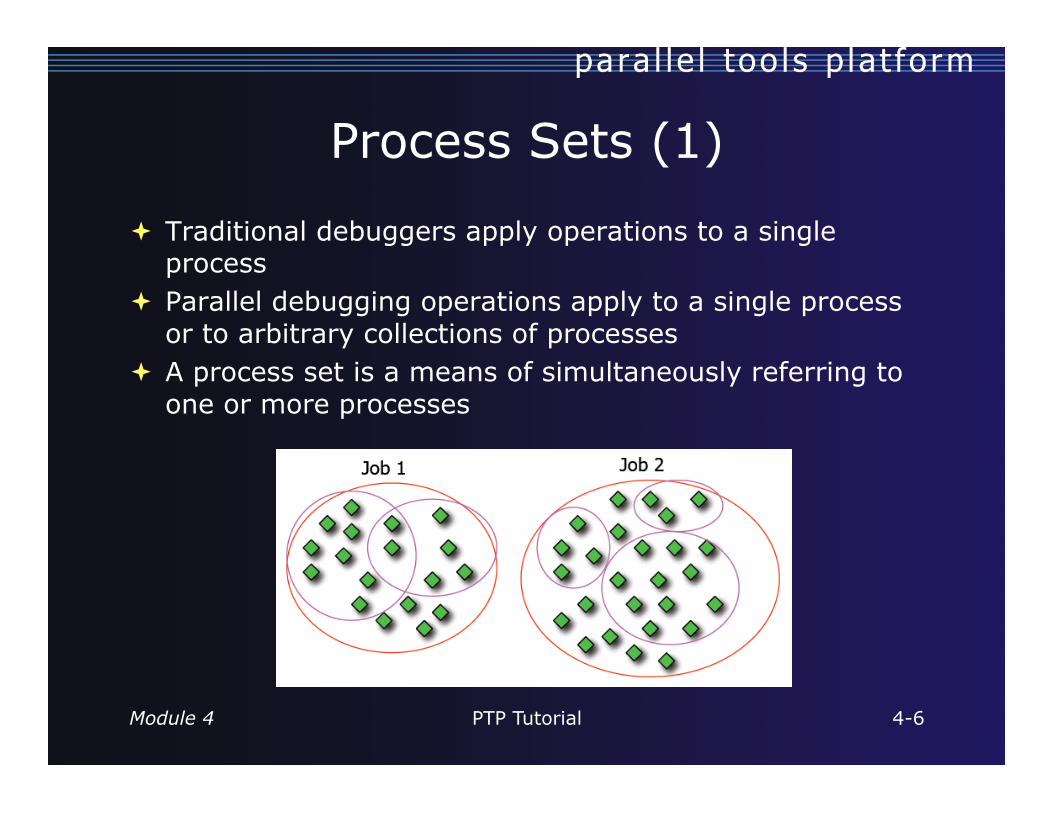
Process Sets (1)
Traditional debuggers apply operations to a single process
Parallel debugging operations apply to a single process or to arbitrary collections of processes
A process set is a means of simultaneously referring to one or more processes

Module 4 PTP Tutorial 4-7
Process Sets (2)
When a parallel debug session is first started, all processes are placed in a set, called the Root set
Sets are always associated with a single job A job can have any number of process sets A set can contain from 1 to the number of processes in
a job

Module 4 PTP Tutorial 4-8
Operations On Process Sets Debug operations on the
Parallel Debug view toolbar always apply to the current set: Resume, suspend, stop,
step into, step over, step return
The current process set is listed next to job name along with number of processes in the set
The processes in process set are visible in right hand part of the view
Root set = all processes

Module 4 PTP Tutorial 4-9
Create set Remove from set
Delete set
Change current set
Managing Process Sets
The remaining icons in the toolbar of the Parallel Debug view allow you to create, modify, and delete process sets, and to change the current process set
Module 4 PTP Tutorial 4-10
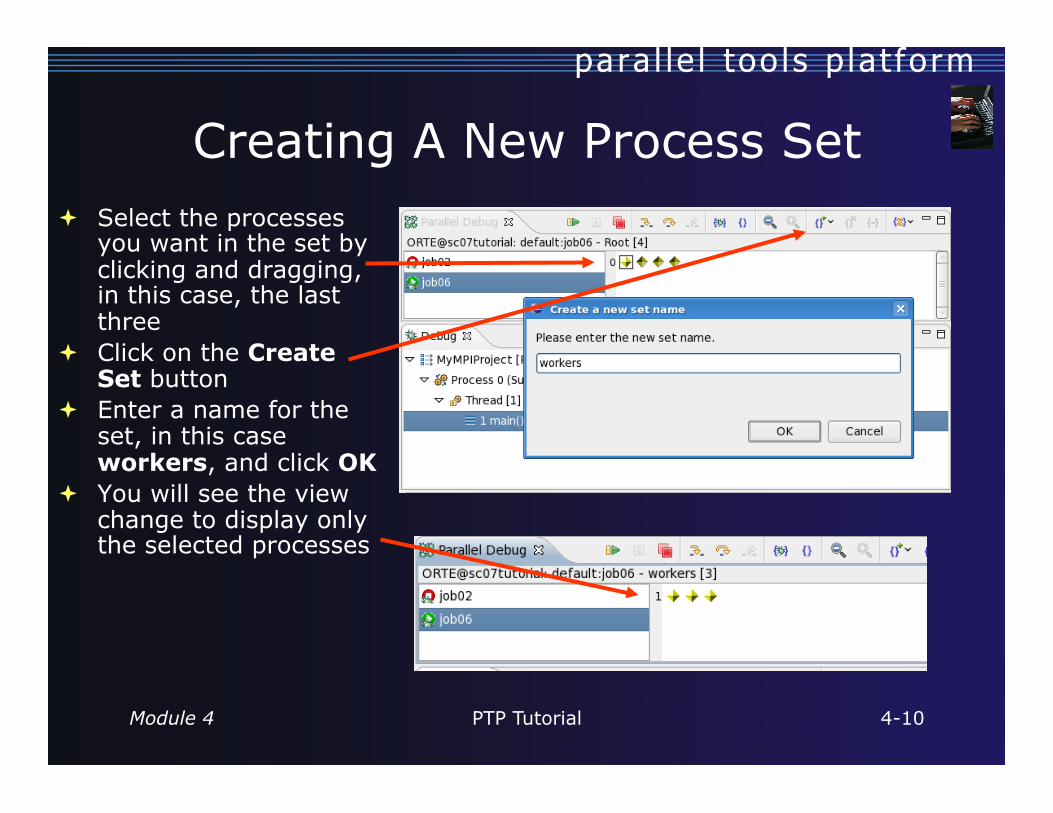
Creating A New Process Set Select the processes
you want in the set by clicking and dragging, in this case, the last three
Click on the Create Set button
Enter a name for the set, in this case workers, and click OK
You will see the view change to display only the selected processes

Module 4 PTP Tutorial 4-11
Stepping Using New Process Set With the workers set
active, click the Step Over button
You will see only the first current line marker move
If all processes are now at the same line, you will only see one line marker again
Module 4 PTP Tutorial 4-12
Process Registration
Process set commands apply to groups of processes
For finer control and more detailed information, a process can be registered and isolated in the Debug view
Registered processes, including their stack traces and threads, appear in the Debug view
Any number of processes can be registered, and processes can be registered or un-registered at any time
Module 4 PTP Tutorial 4-13
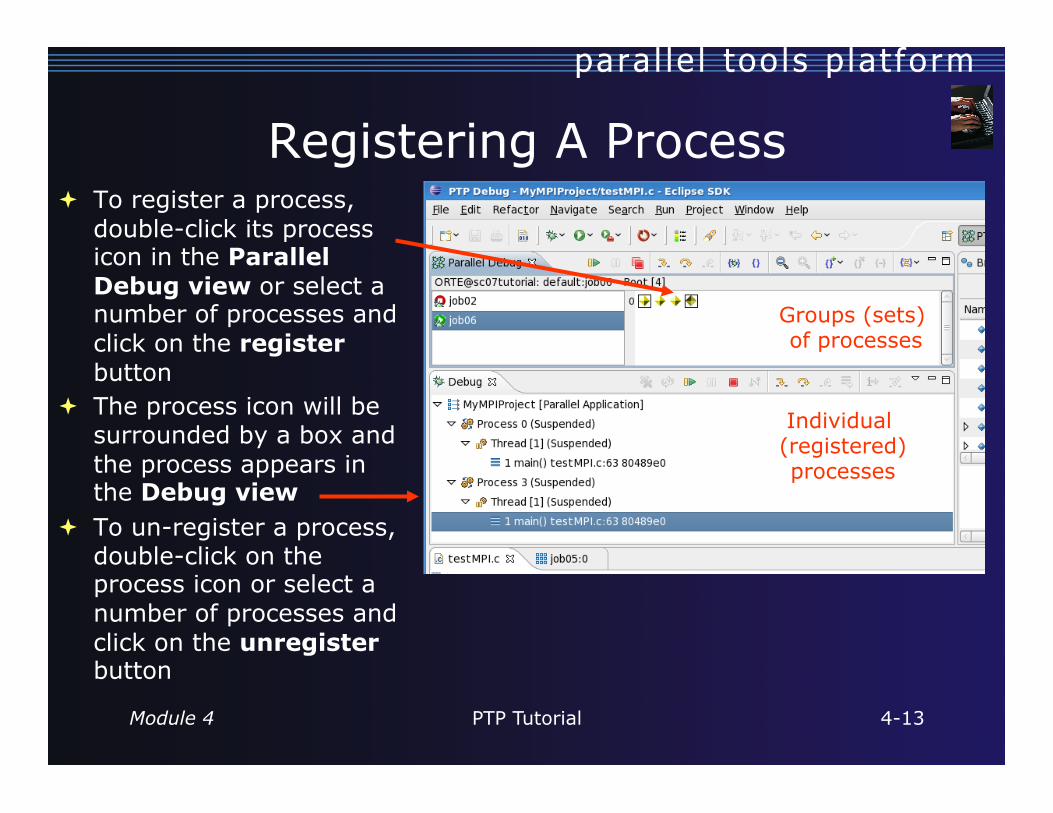
Registering A Process To register a process,
double-click its process icon in the Parallel Debug view or select a number of processes and click on the register button
The process icon will be surrounded by a box and the process appears in the Debug view
To un-register a process, double-click on the process icon or select a number of processes and click on the unregister button
Individual (registered) processes
Groups (sets) of processes

Module 4 PTP Tutorial 4-14
Current Line Marker
The current line marker is used to show the current location of suspended processes
In traditional programs, there is a single current line marker (the exception to this is multi-threaded programs)
In parallel programs, there is a current line marker for every process
The PTP debugger shows one current line marker for every group of processes at the same location

Module 4 PTP Tutorial 4-15
Multiple processes marker
Registered process marker
Un-registered process marker
Colors And Markers The highlight color depends on
the processes suspended at that line: Blue: All registered process(es) Orange: All unregistered
process(es) Green: Registered or unregistered
process with no source line (e.g. suspended in a library routine)
The marker depends on the type of process stopped at that location
Hover over marker for more details about the processes suspend at that location

Module 4 PTP Tutorial 4-16
Apply only to processes in the particular set that is active in the Parallel Debug view when the breakpoint is created
Breakpoints are colored depending on the active process set and the set the breakpoint applies to: Green indicates the breakpoint set is the same
as the active set. Blue indicates some processes in the breakpoint set are
also in the active set (i.e. the process sets overlap) Yellow indicates the breakpoint set is different from the
active set (i.e. the process sets are disjoint) When the job completes, the breakpoints are
automatically removed
Breakpoints
Module 4 PTP Tutorial 4-17
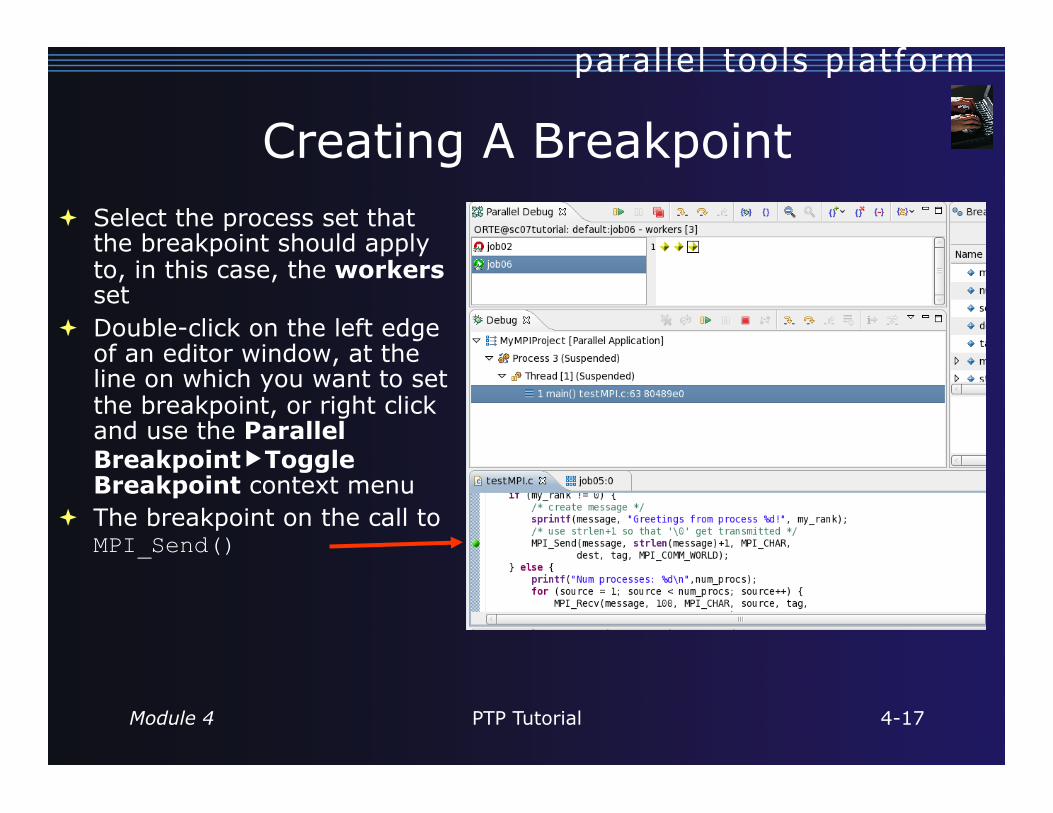
Creating A Breakpoint Select the process set that
the breakpoint should apply to, in this case, the workers set
Double-click on the left edge of an editor window, at the line on which you want to set the breakpoint, or right click and use the Parallel BreakpointToggle Breakpoint context menu
The breakpoint on the call to MPI_Send()
Module 4 PTP Tutorial 4-18
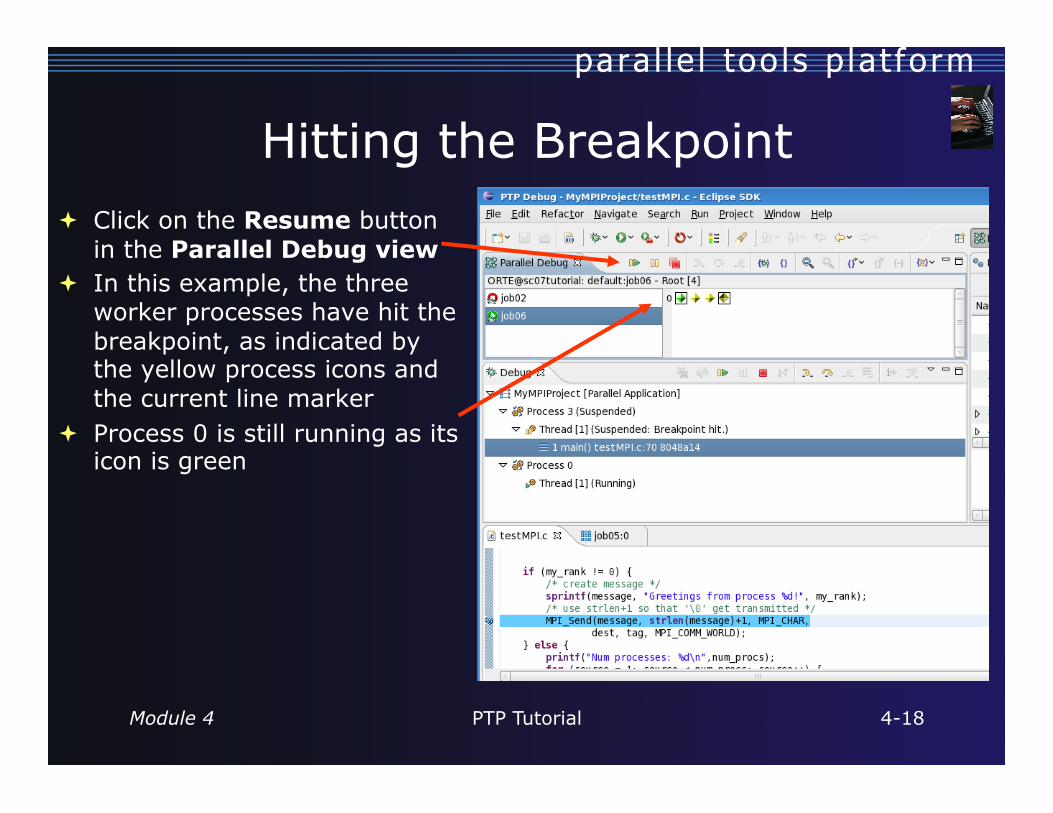
Hitting the Breakpoint Click on the Resume button
in the Parallel Debug view In this example, the three
worker processes have hit the breakpoint, as indicated by the yellow process icons and the current line marker
Process 0 is still running as its icon is green

Module 4 PTP Tutorial 4-19
More On Stepping The Step buttons are only
enabled when all processes in the active set are suspended (yellow icon)
In this case, process 0 is still running
Switch to the set of suspended processes (the workers set)
You will now see the Step buttons become enabled

Module 4 PTP Tutorial 4-20
Breakpoint Information
Hover over breakpoint icon Will show the sets this breakpoint applies to
Select Breakpoints view Will show all breakpoints in all projects

Module 4 PTP Tutorial 4-21
Breakpoints View
Use the menu in the breakpoints view to group breakpoints by type
Breakpoints sorted by breakpoint set (process set)

Module 4 PTP Tutorial 4-22
Apply to all processes and all jobs Used for gaining control at debugger startup To create a global breakpoint
First make sure that no jobs are selected (click in white part of jobs view if necessary)
Double-click on the left edge of an editor window Note that if a job is selected, the breakpoint will apply to
the current set
Global Breakpoints
Module 4 PTP Tutorial 4-23
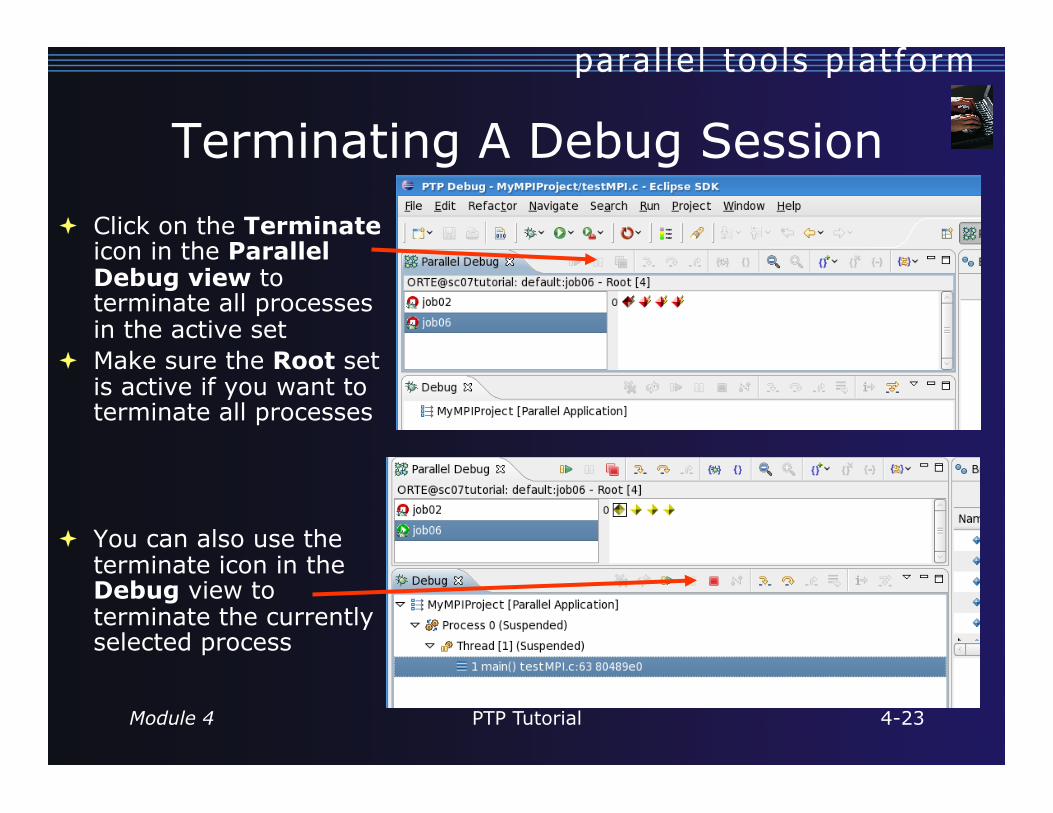
Terminating A Debug Session Click on the Terminate
icon in the Parallel Debug view to terminate all processes in the active set
Make sure the Root set is active if you want to terminate all processes
You can also use the terminate icon in the Debug view to terminate the currently selected process
Module 5 PTP Tutorial 5-0 Module 5 PTP Tutorial 5-0
Module 5: Advanced Development
Objective Explore advanced features of Eclipse and PTP
Contents Advanced Eclipse Features Advanced PTP Features
PTP Tutorial Module 5 5-1
Advanced Eclipse Concepts
Perspectives, views and preferences Version control Makefiles and autoconf Task Tags Searching Refactoring

Module 5 PTP Tutorial 5-2
Customizing Perspectives
Items such as shortcuts, menu items and views may be customized WindowCustomize Perspective…
Save changes WindowSave Perspective As…
Close Perspective Right-click on perspective title and select Close
Reset Perspective WindowReset Perspective resets the current
perspective to its default layout

Module 5 PTP Tutorial 5-3
Opening New Views
To open a view: Choose WindowShow ViewOther… The Show View dialog comes up Select the view to be shown Select OK
Module 5 PTP Tutorial 5-4
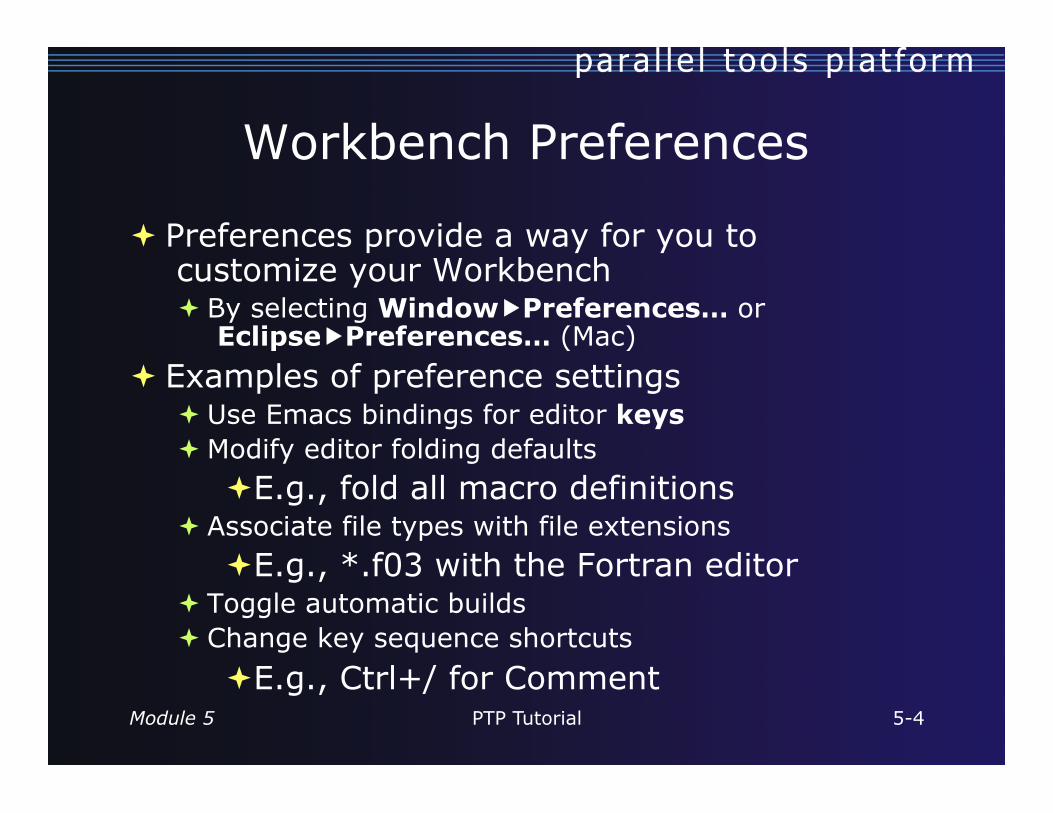
Workbench Preferences
Preferences provide a way for you to customize your Workbench By selecting WindowPreferences… or
EclipsePreferences… (Mac) Examples of preference settings
Use Emacs bindings for editor keys Modify editor folding defaults
E.g., fold all macro definitions Associate file types with file extensions
E.g., *.f03 with the Fortran editor Toggle automatic builds Change key sequence shortcuts
E.g., Ctrl+/ for Comment
Module 5 PTP Tutorial 5-5 Module 5 PTP Tutorial 5-5
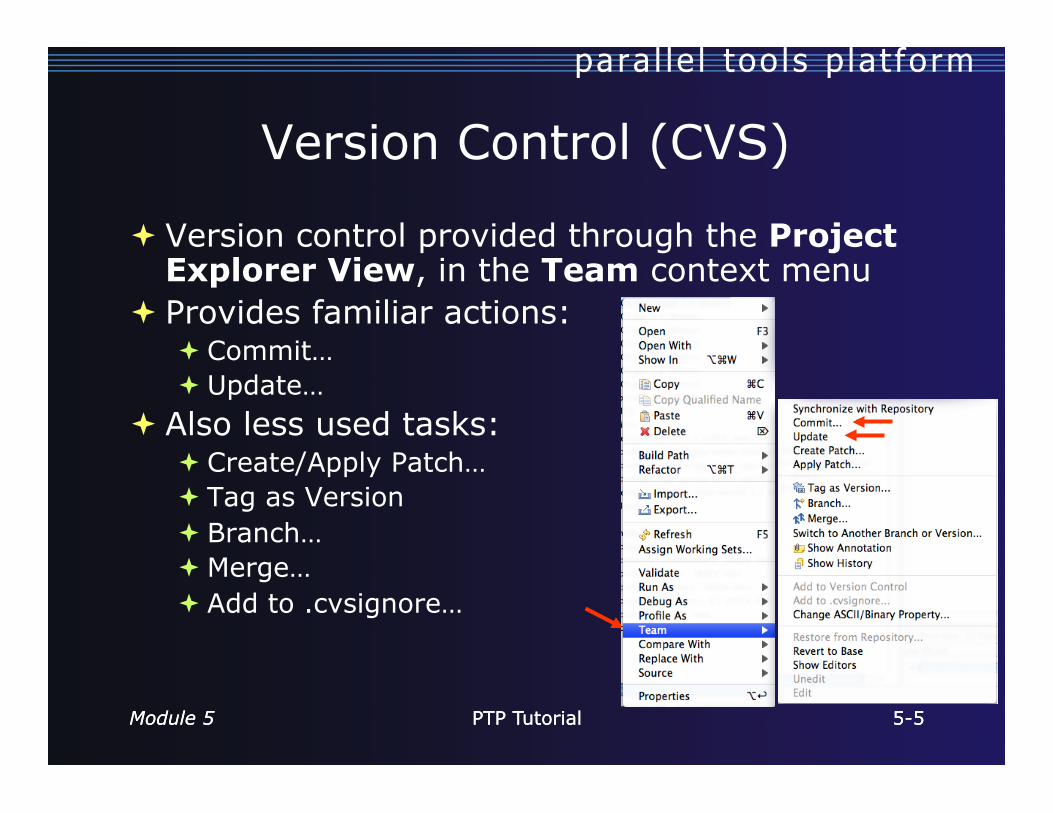
Version Control (CVS)
Version control provided through the Project Explorer View, in the Team context menu
Provides familiar actions: Commit… Update…
Also less used tasks: Create/Apply Patch… Tag as Version Branch… Merge… Add to .cvsignore…

Module 5 PTP Tutorial 5-6 Module 5 PTP Tutorial 5-6
Specify Repository Locations Select WindowOpen
PerspectiveOther… Select CVS Repository Exploring
then OK Right-click in CVS Repositories
View, then select NewRepository Location…
Set Host to the hostname of remote machine
Set Repository path Fill in Username and Password Set Connection type Check Save password Select Finish

Module 5 PTP Tutorial 5-7 Module 5 PTP Tutorial 5-7
Checkout a non-Eclipse project as an Eclipse C Project
Open Repository, open HEAD Locate project, right-click on
ProjectCheck out As… Make sure Check out as a project
configured using the New Project Wizard is selected
Select Finish Select CC project Select Next>
Enter Project name Under Project Types, select Makefile
project Ensures that CDT will use existing
makefiles Select Finish Switch to the C/C++ Perspective

Module 5 PTP Tutorial 5-8 Module 5 PTP Tutorial 5-8
About Makefiles and autoconf
Can create project Makefiles with the Makefile Editor Syntax highlighting and Outline view
autoconf often used to create Makefiles for open source projects
Run configure manually, or from External Tools Launch Configuration Must refresh after running configure script
Refresh whenever file system is modified outside of Eclipse

Module 5 PTP Tutorial 5-9 Module 5 PTP Tutorial 5-9
Building with Makefiles
Create a Make Target named ‘all’ Right-click on the
project in Make Targets View
Select Add Make Target
Select Create Double click on new
make target to initiate the build

Module 5 PTP Tutorial 5-10 Module 5 PTP Tutorial 5-10
Task Tags Task tags are identifiers in C/
C++ comments TODO is a built-in task tag The build locates task tags
during compilation View task tags in Tasks View
If it’s not shown, Window Show View Other… Open General and select Tasks
Configure your own task tag in Window Preferences Under C/C++, select Task
Tags

Module 5 PTP Tutorial 5-11 Module 5 PTP Tutorial 5-11
Searching
Language-based searching
Search for Language Elements e.g., C++ Class,
Function, Method, Variable, Field, Namespace
Can Limit search to Declarations, Definitions, References
Type navigation
Module 5 PTP Tutorial 5-12 Module 5 PTP Tutorial 5-12
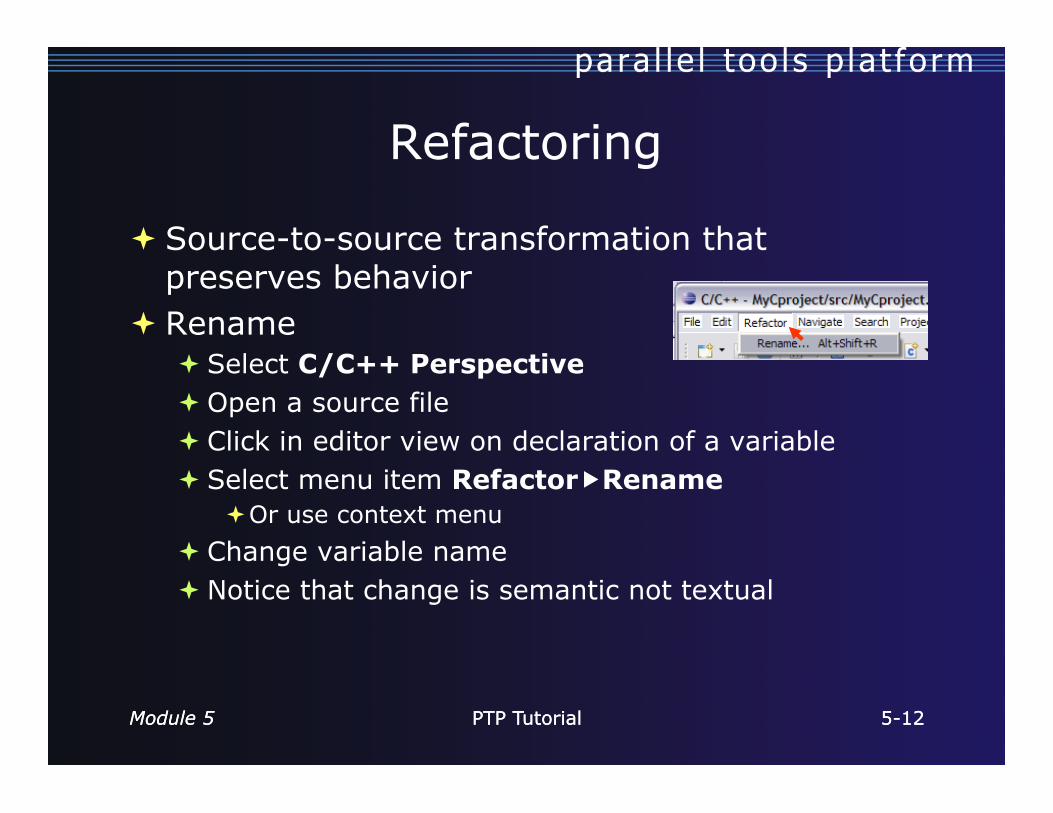
Refactoring
Source-to-source transformation that preserves behavior
Rename Select C/C++ Perspective Open a source file Click in editor view on declaration of a variable Select menu item RefactorRename
Or use context menu Change variable name Notice that change is semantic not textual
Module 5 PTP Tutorial 5-13 Module 5 PTP Tutorial 5-13
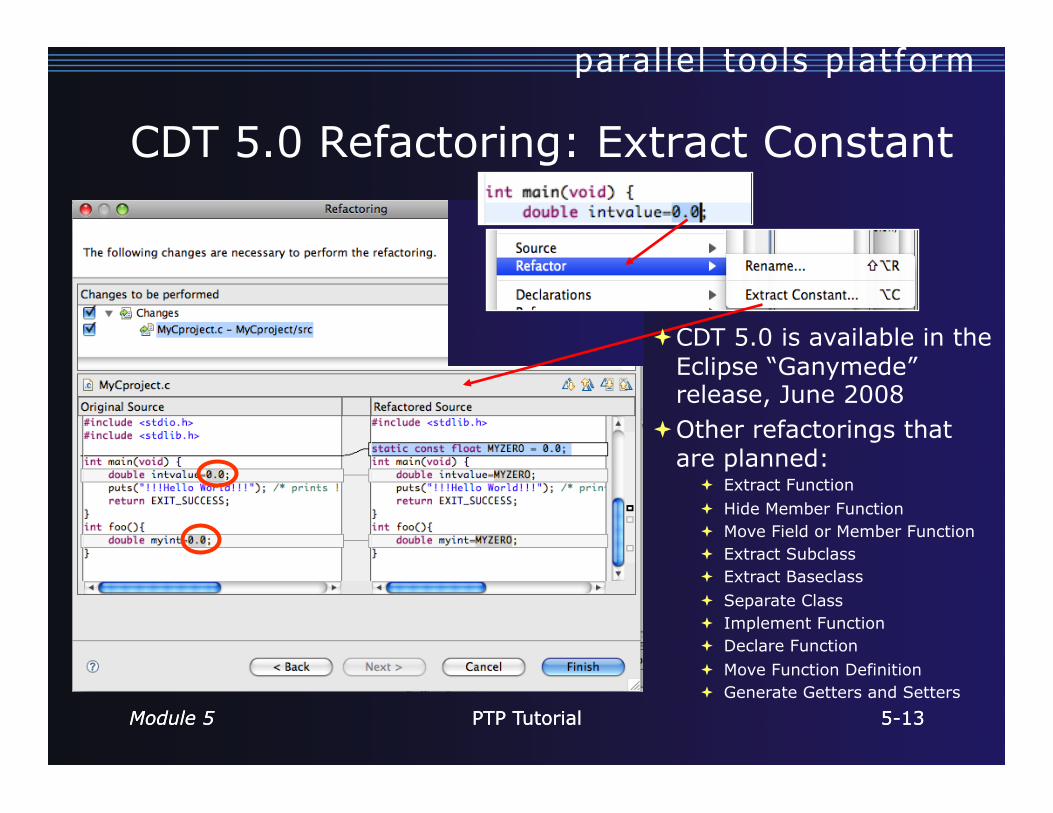
CDT 5.0 Refactoring: Extract Constant
CDT 5.0 is available in the Eclipse “Ganymede” release, June 2008
Other refactorings that are planned:
Extract Function Hide Member Function Move Field or Member Function Extract Subclass Extract Baseclass Separate Class Implement Function Declare Function Move Function Definition Generate Getters and Setters

Module 5 PTP Tutorial 5-14 Module 5 PTP Tutorial 5-14
UPC Support
To see UPC support in C editor, install the optional feature from CDT
Filetypes of “upc” will get UPC syntax high- lighting, content assist, etc.
Module 5 PTP Tutorial 5-15
Advanced PTP Concepts
Remote resource managers Debugging remotely MPICH2, IBM PE and LoadLeveler
Module 5 PTP Tutorial 5-16
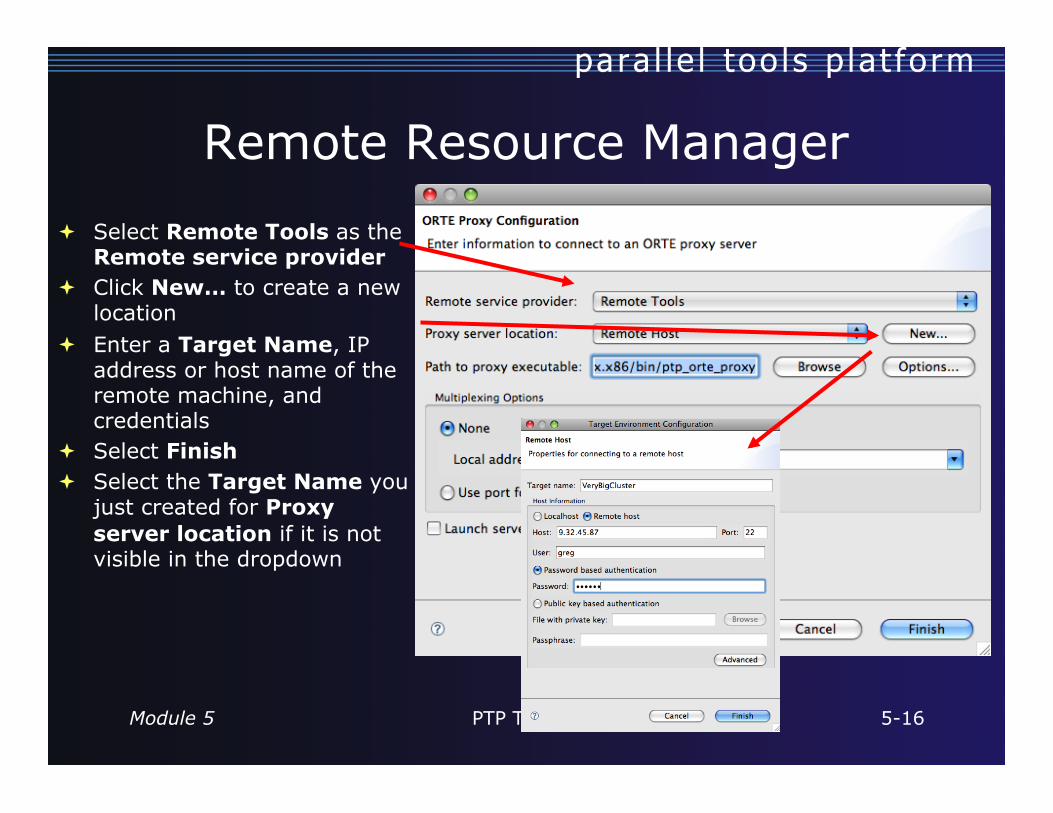
Remote Resource Manager
Select Remote Tools as the Remote service provider
Click New… to create a new location
Enter a Target Name, IP address or host name of the remote machine, and credentials
Select Finish Select the Target Name you
just created for Proxy server location if it is not visible in the dropdown
Module 5 PTP Tutorial 5-17
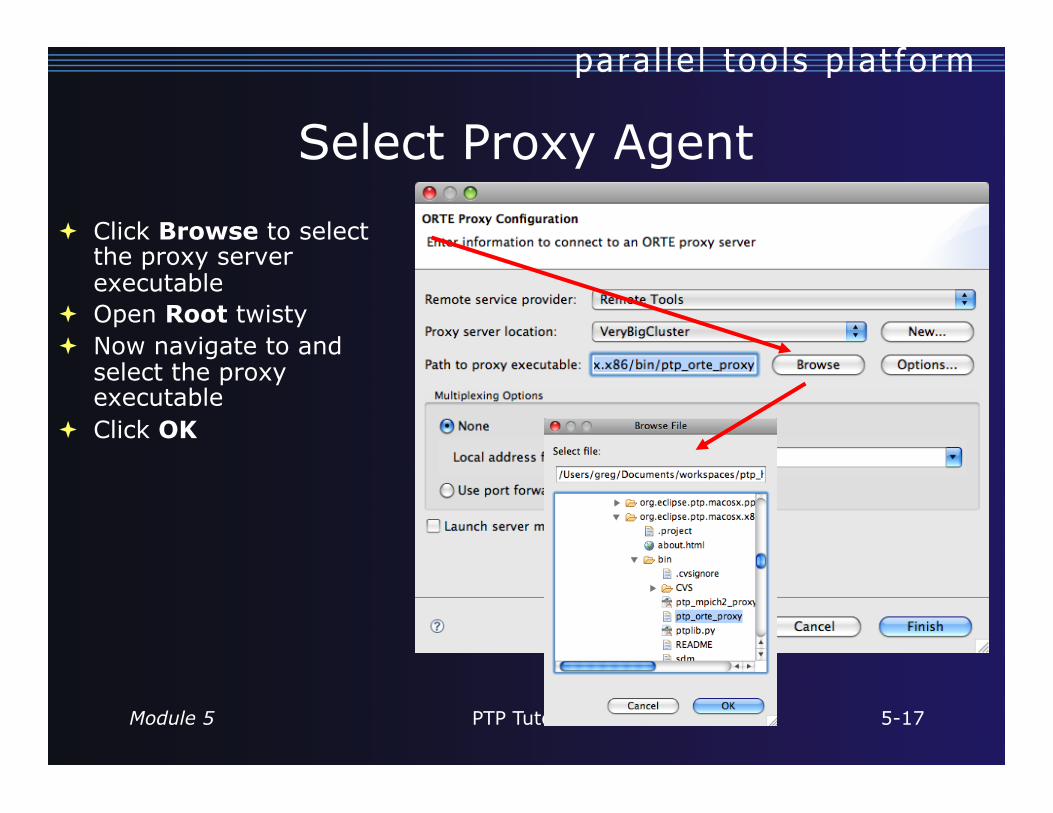
Select Proxy Agent
Click Browse to select the proxy server executable
Open Root twisty Now navigate to and
select the proxy executable
Click OK

Module 5 PTP Tutorial 5-18
Using Port Forwarding
Port forwarding can be enabled to tunnel all communication over a single connection
If you don’t want to use port forwarding, your local machine must be accessible from the remote machine Select your local machine’s
IP address from the dropdown
Enter it manually if it’s not visible
Click Finish

Module 5 PTP Tutorial 5-19
Debugging Remotely
Choose remote resource manager in Main tab
Click Browse and select sdm executable on remote machine (if path is not correct)
Set Debugger session address to the address of the machine running the proxy agent The address must be
accessible from a cluster node
Click Finish
Module 5 PTP Tutorial 5-20
Alternate Resource Managers
An MPICH2 resource manager is provided Use ptp_mpich2_proxy when selecting proxy executable
PE and LoadLeveler See help documentation that comes with PTP for
information on configuring and using Debugging support for alternate resource managers will
be available in next version of PTP

Module 6 PTP Tutorial 6-0
Module 6: Where To Go Next
Objective How to find more information on PTP Learn about other tools related to PTP See PTP upcoming features
Contents Links to other tools, including performance tools Planned features for new versions of PTP Additional documentation How to get involved

Module 6 PTP Tutorial 6-1
Information About PTP
Main web site for downloads, documentation, etc. http://eclipse.org/ptp
Developers’ wiki for designs, planning, meetings, etc. http://wiki.eclipse.org/PTP
Mailing lists Major announcements (new releases, etc.) - low volume
http://dev.eclipse.org/mailman/listinfo/ptp-announce User discussion and queries - medium volume
http://dev.eclipse.org/mailman/listinfo/ptp-user Developer discussions - high volume
http://dev.eclipse.org/mailman/listinfo/ptp-dev
Module 6 PTP Tutorial 6-2
PTP-Related Tools
Performance Tools Framework Tuning and Analysis Utilities (TAU) Photran – Fortran Development Tools

Module 6 PTP Tutorial 6-3
PTP / Performance Tools Framework
Goal: Reduce the “eclipse plumbing”
necessary to integrate tools Provide integration for
instrumentation, measurement, and analysis for a variety of performance tools
Dynamic Tool Definitions: Workflows & UI
Tools and tool workflows are specified in an XML file
Tools are selected and configured in the launch configuration window
Output is generated, managed and analyzed as specified in the workflow
Module 6 PTP Tutorial 6-4
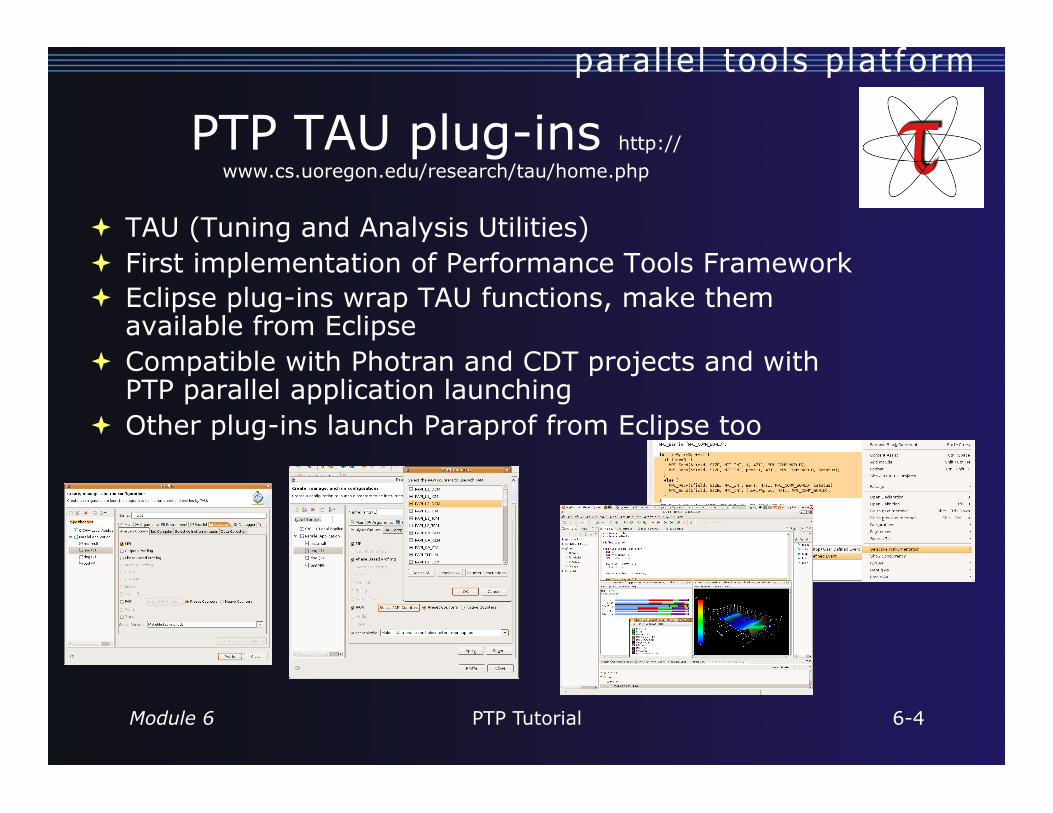
PTP TAU plug-ins http://www.cs.uoregon.edu/research/tau/home.php
TAU (Tuning and Analysis Utilities) First implementation of Performance Tools Framework Eclipse plug-ins wrap TAU functions, make them
available from Eclipse Compatible with Photran and CDT projects and with
PTP parallel application launching Other plug-ins launch Paraprof from Eclipse too
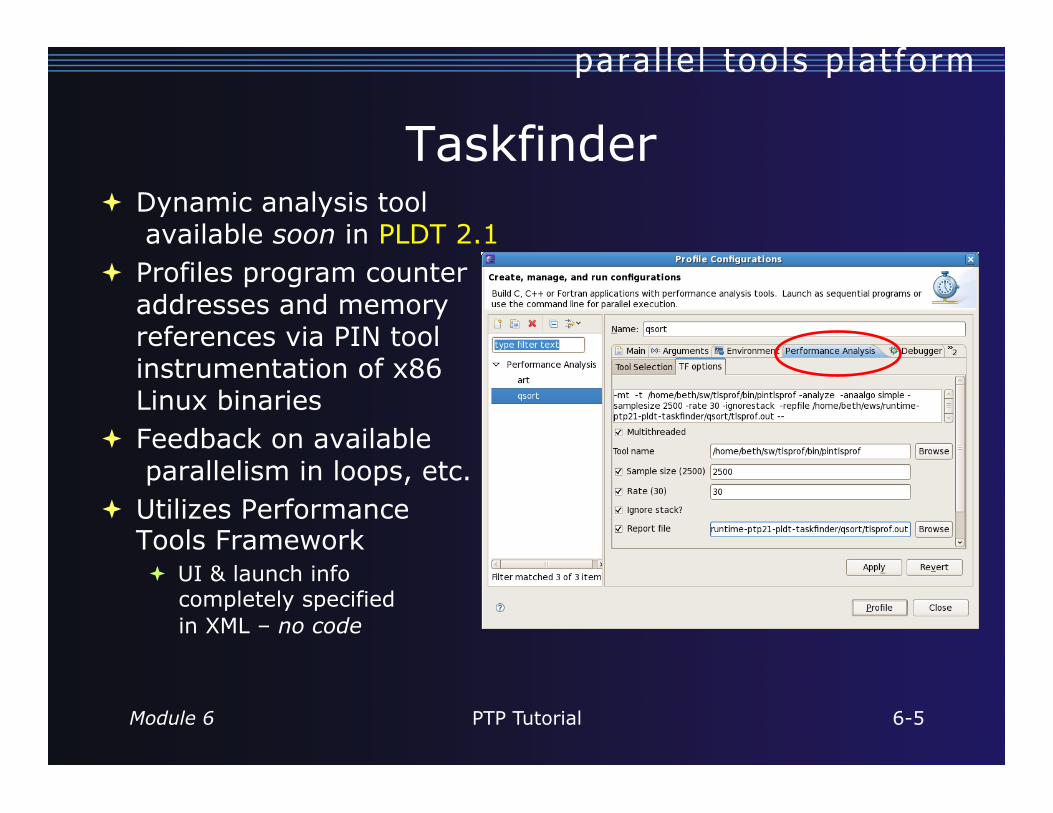
Taskfinder Dynamic analysis tool
available soon in PLDT 2.1 Profiles program counter
addresses and memory references via PIN tool instrumentation of x86 Linux binaries
Feedback on available parallelism in loops, etc.
Utilizes Performance Tools Framework UI & launch info
completely specified in XML – no code
Module 6 PTP Tutorial 6-5
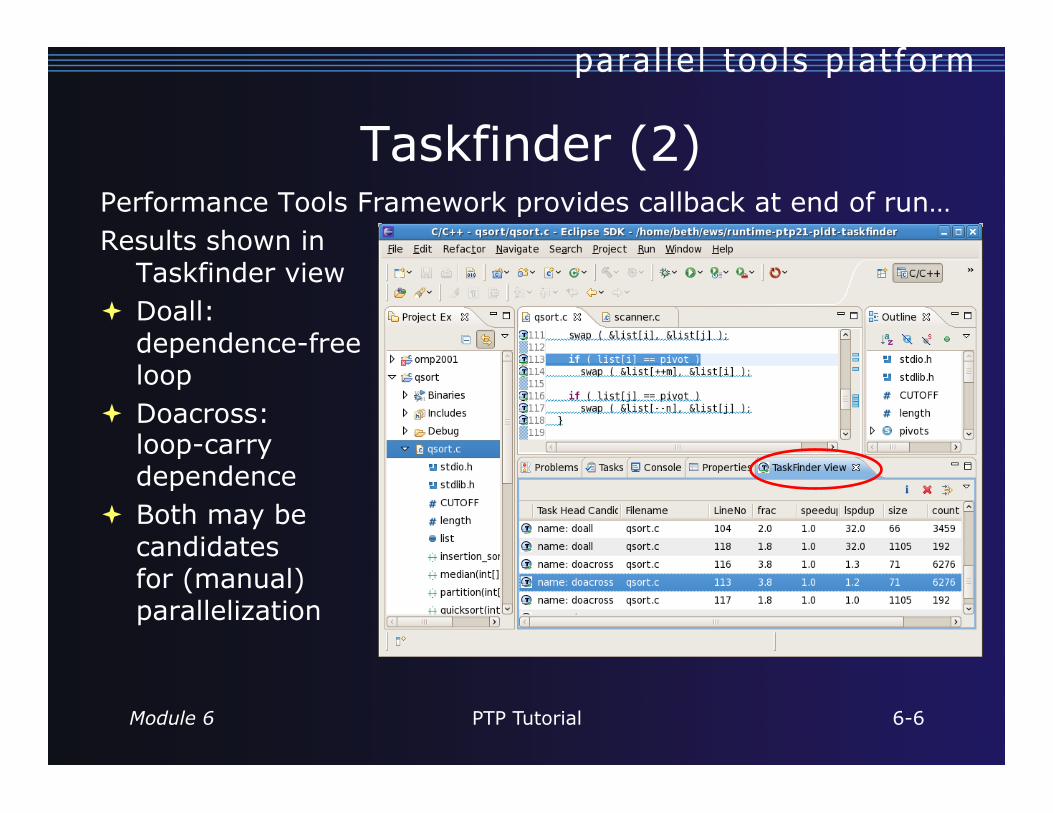
Taskfinder (2) Performance Tools Framework provides callback at end of run… Results shown in
Taskfinder view Doall:
dependence-free loop
Doacross: loop-carry dependence
Both may be candidates for (manual) parallelization
Module 6 PTP Tutorial 6-6

Module 6 PTP Tutorial 6-7
Photran Supports Fortran in
the Eclipse workbench Supports Fortran 77, 90,
and 95 It includes:
Syntax-highlighting editor CVS support GUI interface to gdb Makefile-based
compilation Compiler error extraction Outline view Open declaration Rename and Introduce
Implicit None refactorings
http://eclipse.org/photran

Module 6 PTP Tutorial 6-8
Useful Eclipse Tools
Python http://pydev.sourceforge.net
Subversion (CVS replacement) http://subclipse.tigris.org Now an Eclipse Technology project
… and many more!

Module 6 PTP Tutorial 6-9
Future PTP Features Multicore tools Resource manager support for SLURM, PBS,
LSF, BG/P Simplified runtime system interface (plus
support for other MPI runtimes) Debugging support for a broad range of
architectures Full remote project support (combined with
CDT) Remote build and indexing Remote launch/debug
More performance analysis tools integration
Module 6 PTP Tutorial 6-10
PTP Publications “Eclipse PTP: An Integrated Environment for the Development
of Parallel Applications,” Greg Watson, 2nd Parallel Tools Workshop, July 2008, Stuttgart, Germany (to appear)
“Developing Scientific Applications Using Eclipse,” Computing in Science & Engineering, vol. 8, no. 4, July/August 2006, pp. 50-61 Link on http://eclipse.org/ptp web page
“A Model-Based Framework for the Integration of Parallel Tools”, Proceedings of the IEEE International Conference on Cluster Computing, Barcelona, September 2006 Link on http://eclipse.org/ptp web page
IBM developerWorks article: http://www-128.ibm.com/developerworks/edu/os-dw-os-ecl-ptp.html
“An Integrated Tools Platform for Multi-Core Enablement,” Beth Tibbitts & Evelyn Duesterwald, STMCS: Second Workshop on Software Tools for Multi-Core Systems, March 2007 http://www.isi.edu/~mhall/stmcs07/program.html

Module 6 PTP Tutorial 6-11
Getting Involved
See http://eclipse.org/ptp Read the developer documentation on the wiki Join the mailing lists
[email protected]; [email protected] Attend the monthly developer teleconference Attend the annual workshop
PTP will only succeed with your participation!

Module 6 PTP Tutorial 6-12
Thanks for attending We hope you found it useful
PTP Tutorial Feedback
Please complete feedback form Your feedback is valuable!