eco efficiency study water vs solvent vs uv inks on...
TRANSCRIPT

BASF
Eco Efficiency Study Water vs
Solvent vs
UV inks
on flexible film

BASF Tools
Sustainability Screening AnalysisQualitative screening for use in PhaseGate process
Pollution Prevention (P2) FrameworkFate, exposure, toxicity, phys/chem, bioaccumulation.
Environmental Impact Assessment (EIA)Evaluate ecological impacts.
Total Cost of Ownership (TCO)Compares costs of two or more products or processes.
Eco-Efficiency Analysis (EEA)Compares ecological and economic impacts over product life-cycle.
Socio-eco-efficiency Analysis (SEE® Balance)BASF developed methodology for ecological, economic and societalimpacts.
Simple
Complex
BASF has SD tools and resources beyond our competitors
to measure sustainability

Eco-efficiency Analysis
BASF strategic tool to help drive towards and measure sustainability
Developed in Germany in 1996
Over 400 projects completed globally
Third-party certified by the German Technical Monitoring Association (TŰV) and pending with NSF International
Pending

What is Eco-Efficiency Analysis?
Methodology for measuring sustainability by comparing the economic and ecological impacts of a product or process over the life-cycle.
Life-cycle analysis that includes evaluation of production, use and disposal/reuse.
Ecological and economic aspects are given equal weight in assessments.
Ability to model results of changing input parameters (e.g. energy costs, new toxicity data).

Waste
Energy
LaborMaterials
Capital Investment
EconomicImpacts
Supply Chain
EHS Programs Incidents
EEA Impact Categories Economic

Water Emissions
SolidWastes
Global Warming Potential (GWP)
Photochemical Ozone Creation Potential
(POCP)
AcidificationPotential (AP)
Ozone Depletion Potential (ODP)
Risk Potential
Health Effects
Potential
Energy Consumption
Raw Materials
EnvironmentalImpactLand Use
Emissions
EEA Impact Categories Environmental

Ecological footprint
0.00
0.50
1.00Energy Consumption
Emissions
Toxicity Potential
Risk Potential
Raw Materials
Land Use
1.0 = greatest environmental burden
Development of Ecological Value
Life-cycle data is gathered in six environmental categories and depicted on an ecological footprint. The data are then weighted and aggregated to obtain an overall environmental impact.
Parameters considered
•Raw Materials
•Energy consumption
•Land Use
•Emissions
•Toxicity
•Risk potential
Ecological advantage
Relative environmental impact
Product 1
Product 2
Low
High
BASF

Economic footprint
0.00
0.50
1.00Energy
Wastes
Supply Chain
EHS Programs
Materials
Labor
1.0 = greatest environmental burden
Parameters considered
•Materials
•Energy
•Wastes
•Supply Chain
•Labor
•EHS Programs
Economic advantage
Relative Economic impact
Product 1
Product 2
Low
High
BASF
Development of Economic Value
0.0
1.0
2.00.01.02.0
Costs (normalized)
Envi
ronm
enta
l im
pact
(n
orm
aliz
ed)
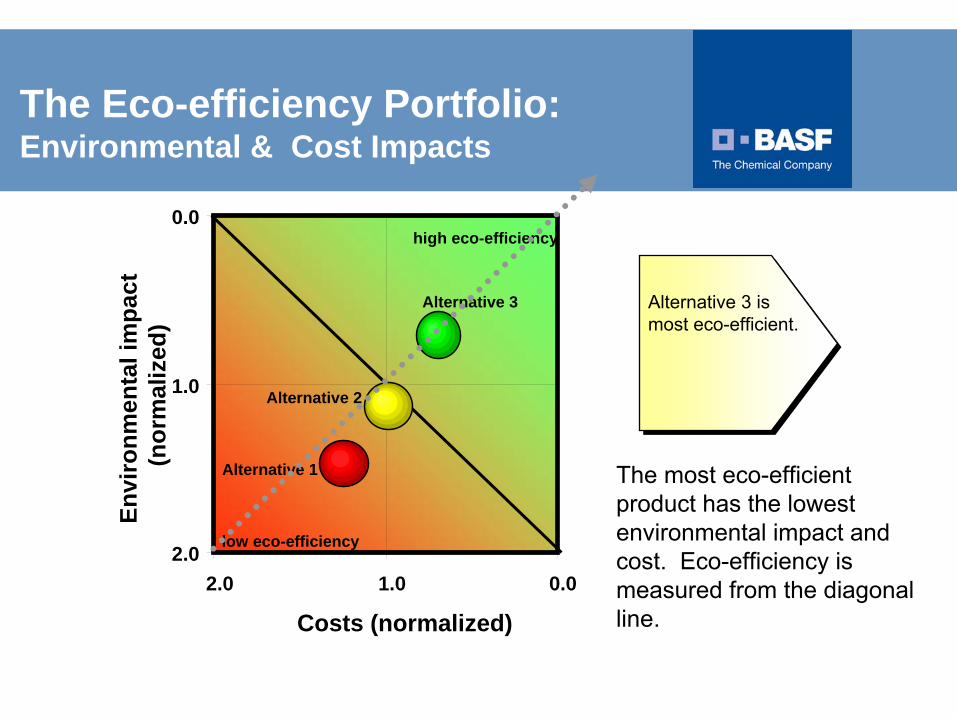
The Eco-efficiency Portfolio:Environmental & Cost Impacts
high eco-efficiency
low eco-efficiency
Alternative 3
Alternative 2
Alternative 1
Alternative 3 is most eco-efficient.
The most eco-efficient product has the lowest environmental impact and cost. Eco-efficiency is measured from the diagonal line.

Are Bio-Based Products Greener?
BASF has conducted 32 eco-efficiency studies that compared bio-based materials to conventional materials.
Approximately 71 bio-based materials were involved in these studies (e.g. one study included 5 forms of bio-ethanol).
Types of ProductsPlastics (automotive, packaging materials, bags, etc.)Building construction (insulation and roofing materials)Fuels (bio-diesel vs. diesel)Flooring (wood vs. vinyl)CoatingsNutritional and animal feed supplements.

Eco-efficiency of bio-based materials vs conventional materials
High ecoefficiency
Low ecoefficiency
High ecoefficiency
Low ecoefficiency Cost
Envi
ronm
enta
l Im
pact
Low
HighLow
n ~18
n ~24 n ~12
n ~17
Cost
Envi
ronm
enta
l Im
pact
Low
HighLow
n ~18
n ~24 n ~12
n ~17
Eco-Confusion ? Bio-based materials may not be better.
Need to do the analysis
BASF has conducted 32 eco-efficiency studies that compared bio-based materials to conventional materials.
Approximately 71 bio-based materials were involved in these studies.

This study compares water based, solvent based, and UV-cured inks formulated to surface print on polyethylene film.
The customer benefit is the production, use and disposal of1,000 m2 of 3 mil. LDPE film with 25% image coverage on each of 4 stations.
The ink systems evaluated are:Water – Styrene/ acrylic water-borne thermally curedSolvent - LMW polyamide/ nitrocellulose solvent-borne thermally cured
UVUV--Cured Cured –– Polyester/ acrylate UV-cured
The press conditions were modeled utilizing a 4 color CI press with appropriate curing and VOC abatement equipment.
Summary of EEA Study on Film Printing Inks
Eco-Efficiency Analysis of Flexo Water, Solvent and UV-Cured Inks in Film Applications

40 years
10 years
3 years
consumer
emerging
survival
global
regional
local
technology
competitve
regulatory
i
incremental
gap closure
step change
NGO/ external
supplier/customer
internal
SC
few products/1 market
consumer
post-consumer
full life cycle
all products/markets
Scenario and HorizonGeography
Drivers
Innovation Economy Product/Material
Engagement
Context of Study
1 product/market

Ink FormulationsInk Components units
Water ECO UV-CuredHeliogen Blue D 7092 % 16 Heliogen Blue D 7092 % 22
JONCRYL ECO 75 % 15 Laromer 9013 % 20JONCRYL ECO 2124 % 56.9 Laromer PO 94F % 15
Polyethylene wax emulsion (JONCRYL WAX 28) % 5 Laromer 8765 % 10Silicone Emulsion (Dow Corning 1101) % 1 DPGDA % 10
Water % 6 Laromer 8863 % 7Total 100 Disperbyk 168 % 3
Solvent Surfynol 104 PA % 0.95Heliogen Blue D 7092 % 12 Irgacure 369 % 3
alcohol soluble polyamide resin (Versamid 750) % 17 Irgacure 184 % 4 nitrocellulose % 3 TPO % 2
polyethylene wax - not an emulsion % 1 Esacure TZT % 3 titenate adhesion promoter (Vertec IA10) % 2 Total 100.0
nPropyl acetate % 11 nPropyl alcohol % 54
Total 100
Ink Formulations

Phthalo Blue Pigment Styrene Acrylic Resin
Acrylic Emulsion
Wax Emulsion
Silicon Emulsion
Water
LDPE Film
Water Ink
Ink Printed on Flexible Film
Film Disposal
Raw Materials: Acquisition and Transportation
Electricity
Natural Gas
Production Use Disposal
Ink DisposalNatural GasElectricity
Steam
System Boundaries: Water

Phthalo Blue Pigment
Polyamide Resin Adhesion Promoter
n-Propyl Acetate
PE Wax
LDPE Film
Solvent Ink
Ink Printed on Flexible Film
Film Disposal
Raw Materials: Acquisition and Transportation
Electricity
Natural Gas
Production Use Disposal
Nitrocellulose
Propanol
VOC Abatement
Ink DisposalNatural GasElectricity
Steam
System Boundaries: Solvent

Phthalo Blue Pigment
Polyester Acrylate
Amino Acrylate
Epoxy Acrylate
Monomers (2)
LDPE Film
UV-Cured Ink
Ink Printed on Flexible Film
Film Disposal
Dispersant
Raw Materials: Acquisition and Transportation
Electricity
Natural Gas
Production Use Disposal
Surfactant
Photo-initiator Blend (4)
Ink Disposal
Natural GasElectricity
Steam
System Boundaries: UV-Cured

Parameters

Energy Consumption
Ink and Film PricesInk costs were calculated based on the raw material costs plus an equal percentage mark-up.Film cost was based on film type and average pricing.
Parameters
Energy units Water Solvent UV-Cured
ElectricityDrive power kWh 108 180 159
Inter‐station ‐ Drying kWh ‐ ‐ 130Inter‐station ‐ Blower kWh 12 12 ‐Main (final) ‐ Drying kWh ‐ ‐ 65Main (final) ‐ Blower kWh 18 18 ‐
Inter‐station Cooling ‐ UV lamps kWh ‐ ‐ 24Main Cooling ‐ UV lamps kWh ‐ ‐ 36
Natural GasInter‐station ‐ Drying MBTU/hr 0.76 0.64 ‐Main (final) ‐ Drying MBTU/hr 1.14 0.96 ‐
Total MBTU/hr 1.9 1.6 ‐Total MJ/CB 98 50 ‐

0.00
0.50
1.00
Energy Consumption
Emissions
Toxicity Potential
Risk Potential
ResourceConsumption
Land Use
1 = max. environmental
impact0 = min. environmental
impact
=
Water=
Solvent = UV-Cured
Environmental Fingerprint

Solvent has highest overall energy consumption over the entire life cycle, and ink formulation is the key driver.
Energy Consumption
0
100
200
300
400
500
600
700
Water Solvent UV-Cured
MJ/
CB
Inks Diesel Use Truck Drive Power/Energy Curing VOC Abatement

0.00
0.50
1.00
Energy Consumption
Emissions
Toxicity Potential
Risk Potential
ResourceConsumption
Land Use
1 = max. environmental
impact0 = min. environmental
impact
=
Water=
Solvent = UV-Cured
Environmental Fingerprint

Emissions - Carbon footprint GWP
Electricity usage is more inefficient than natural gas, which contributes to higher GWP during the curing stage for UV-cured inks.
0
5
10
15
20
25
30
Water Solvent UV-Cured
kg C
O2-
equi
vale
nt/C
B
Inks Diesel Use Truck Drive Power/Energy Curing VOC Abatement

Emissions - Acid Rain Potential (AP)
Electricity consumption is key driver for Acid Rain Potential.
0
50
100
150
200
250
300
Water Solvent UV-Cured
g SO
2-eq
uiva
lent
s/C
B
Inks Diesel Use Truck Drive Power/Energy Curing VOC Abatement

0.00
0.50
1.00
Energy Consumption
Emissions
Toxicity Potential
Risk Potential
ResourceConsumption
Land Use
1 = max. environmental
impact0 = min. environmental
impact
=
Water=
Solvent = UV-Cured
Environmental Fingerprint
Includes worker accidents, fire and explosion hazards and transportation risks.
0.0
1.0
2.0
3.0
4.0
5.0
6.0
7.0
8.0
Water Solvent UV-Cured
Risk
Pot
entia
l Poi
nts
[wei
ghte
d]
Inks Diesel Use Truck Drive Power/Energy Curing VOC Abatement
Risk Potential

0.00
0.50
1.00
Energy Consumption
Emissions
Toxicity Potential
Risk Potential
ResourceConsumption
Land Use
1 = max. environmental
impact0 = min. environmental
impact
=
Water=
Solvent = UV-Cured
Environmental Fingerprint

Resource Consumption – Fossil Fuels
UV-cured and Water inks consume about the same amount of fossil fuels, while Solvent the most.VOC abatement contributes to higher consumption for Solvent.
0.0
1.0
2.0
3.0
4.0
5.0
Water Solvent UV-Cured
kg/(a
*mill
. t)1
/2/C
B
Coal Oil Gas Lignite

0.00
0.50
1.00
Energy Consumption
Emissions
Toxicity Potential
Risk Potential
ResourceConsumption
Land Use
1 = max. environmental
impact0 = min. environmental
impact
=
Water=
Solvent = UV-Cured
Environmental Fingerprint

Land use
Ink formulations and diesel use from drum transport are key drivers to land use impacts.
0.00
0.40
0.80
1.20
1.60
2.00
Water Solvent UV-Cured
wei
ghte
d ar
ea u
se m
²a /C
B
Inks Diesel Use Truck Drive Power/Energy Curing VOC Abatement

0.00
0.50
1.00
Energy Consumption
Emissions
Toxicity Potential
Risk Potential
ResourceConsumption
Land Use
1 = max. environmental
impact0 = min. environmental
impact
=
Water=
Solvent = UV-Cured
Environmental Fingerprint

Results - Costs
Water Solvent UV-CuredInk $22.70 $41.54 $63.91Film $290.00 $290.00 $290.00Electricity $0.63 $0.58 $1.29Natural Gas $0.10 $0.05 -Production Labor $4.26 $2.56 $2.90Drum Handling and Logistics $0.50 $0.71 $0.34Solid Wastes $0.35 $0.49 $0.25Thermal oxidizer - $1.30 -
$318.54 $337.21 $358.69
$0.00
$50.00
$100.00
$150.00
$200.00
$250.00
$300.00
$350.00
$400.00
Water Solvent UV-Cured
Thermal oxidizerSolid WastesDrum Handling and LogisticsProduction LaborNatural GasElectricityFilmInk

Results - Portfolio
0.5
1.0
1.50.51.01.5
costs (norm.)
envi
ronm
enta
l im
pact
(nor
m.)
Water Solvent UV-Cured 5% significance
Customer Benefit
Production, use and disposal of 1000 m2
of 3 mil. LDPE flexographic film with 25% imagecoverage.
Results
Water ink most eco-efficient alternativedue to slightly lowerenvironmental impactand lower costs.

Water-based Resins Technical Trends – Consistent with Eco-Efficiency
JONCRYL FLX 5000- self-crosslinking emulsion to improve the performance of water-based systems (vs. solvent-based systems) in flexible packaging applications
JONCRYL HPD 296- higher pigment dispersion efficiency to allow for higher color concentrations and reduced ink usage; achieve finer graphics; and reduce energy consumption in milling and dispersing operations
JONCRYL LMV- lower maintenance vehicles to improve on-press ease-of-use and minimize rework and waste
JONCRYL 636 and JONCRYL 2156- higher solids emulsions to improve upon dry speed and thereby reduce energy consumption

BASF Group: www.basf.com
BASF Corporation: www.basf.com/usa
BASF Resins: www.basf.com/naftaresins
http://www.basf.com/corporate/Sustainability/index.htm
Sustainability:

Contact information
BASF CorporationRick [email protected] [email protected] [email protected]
Thank You