École de technologie supÉrieure …espace.etsmtl.ca/1262/1/jimÉnez_luz_maria.pdf ·...
TRANSCRIPT

ÉCOLE DE TECHNOLOGIE SUPÉRIEURE UNIVERSITÉ DU QUÉBEC
THESIS PRESENTED TO ÉCOLE DE TECHNOLOGIE SUPÉRIEURE
IN PARTIAL FULFILLMENT OF THE REQUIREMENTS FOR THE DEGREE OF DOCTOR OF PHILOSOPHY
Ph. D.
BY Luz María JIMÉNEZ
DESIGN OF A COLLABORATIVE INFORMATION AND COMMUNICATION TECHNOLOGY PLATFORM TO SUPPORT CREATIVITY IN INNOVATION
ACTIVITIES - PROTOTYPING AND USER EXPERIENCE TEST
MONTREAL, DECEMBER 12TH 2013
Luz María Jiménez, 2013

This Creative Commons licence allows readers to download this work and share it with others as long as the author is credited. The content of this work can’t be modified in any way or used commercially.
BOARD OF EXAMINERS THESIS
THIS THESIS HAS BEEN EVALUATED
BY THE FOLLOWING BOARD OF EXAMINERS Mr. Mickaël Gardoni, Thesis Supervisor Department of Automated Production, École de technologie supérieure Mr. Antoine Tahan, President of the Board of Examiners Department of Mechanical Engineering, École de technologie supérieure Mrs. Sylvie Doré, Member of the jury Department of Mechanical Engineering, École de technologie supérieure Mr. Daniel Forgues, Member of the jury Department of Construction Engineering, École de technologie supérieure Mr. Clément Fortin, External Member of the jury President and Chief Executive Officer, Consortium for Research and Innovation in Aerospace in Quebec, CRIAQ
THIS THESIS WAS PRESENTED AND DEFENDED
IN THE PRESENCE OF A BOARD OF EXAMINERS AND THE PUBLIC
MONTREAL, NOVEMBER 13TH 2013
AT ÉCOLE DE TECHNOLOGIE SUPÉRIEURE

ACKNOWLEDGMENTS
Before I begin, all my acknowledgments are due to the Almighty Creator of the universe. He
makes all dreams possible. I would like to express my deep and sincere gratitude to all those
who assisted me during my Ph.D. studies, especially for the support I received from my fami-
ly and the École de technologie supérieure.
I would like to thank my supervisor, Professor Mickaël Gardoni. He was always available for
interesting discussions and gave me a real opportunity to deploy my creativity. This experi-
ence changed my professional life and the way I will manage my future creative projects.
Similarly, I would like to thank my colleagues, Mario Dubois and Ahmed Cherifi, also su-
pervised by Professor Gardoni, with whom I learned a lot about creative teamwork in all the
projects undertaken: “La Plateforme d’idéation: Innoluz” at Ingo, “Le Hub de Créativité de
Montréal” at the old Dow Planetarium, and the International Competition, “Les 24 heures de
l’innovation”. A special acknowledgment is due to Clément Jacquot, who, during his intern-
ship, developed the PHP prototype of the platform on which I tested the functionalities of
collaboration. The results of all our efforts can be seen at www.innokiz.com. The École de
technologie supérieure is currently in the process of securing intellectual property protection
for InnoKiz.
Special thanks to my Board of Examiners: Professor Sylvie Doré, Professor Daniel Forgues,
Professor Clément Fortin, and the president, Professor Antoine Tahan. Thanks for extending
me the honor of constituting my Ph.D. Committee, and for your valuable time and recom-
mendations during this process. Thanks to Professor Gregory Huet, Arturo Segrera, Rafael
Villa, Rodrigo Manyari, and Carlos Andrés Osorio for their appreciated comments, and to
Eric Kwati for the English revision of this thesis.
My gratitude is extended to my family: my husband Arturo Segrera for his unconditional
support at all times; to my two boys, Sergio and Jorge, who have been with me for all these

VI
years; my parents, Alfredo and Mercedes, who always have been patient with their daugh-
ters’ true love for studies, as well as to my brothers.
Finally, I would like to acknowledge the financial support received from my supervisor, Pro-
fessor Gardoni; from the Fonds Québécois de la Recherche sur la Nature et les Technologies
(FQRNT) Award of Excellence Grant, 2007-2010, and from the École de technologie supéri-
eure Internal Scholarship (2011).
CONCEPTION D’UNE PLATEFORME COLLABORATIVE BASÉE DANS LES TECHNOLOGIES DE L’INFORMATION ET DE LA COMMUNICATION POUR
SUPPORTER LA CRÉATIVITÉ DANS LES ACTIVITÉS D’INNOVATION - PROTOTYPAGE ET TEST DE L’EXPÉRIENCE-UTILISATEUR
Luz María JIMÉNEZ
RÉSUMÉ
Cette thèse porte sur la Conception d’une plateforme collaborative basée dans les technolo-
gies de l’information et de la communication pour supporter la créativité dans les activités
d’innovation - prototypage et test de l’expérience-utilisateur-. Ces activités de recherche ont
été développées pendant les sessions d’été 2010 à l’hiver 2013. Elles visaient à définir les
détails de la démarche suivis pour la réalisation de cette thèse.
La problématique de la recherche a été construite à partir de l’analyse de trois défis observés
dans les activités d’innovation, spécialement la collaboration créative des entreprises R-D et
les équipes créatives de « Les 24 heures de l’innovation ». Ces défis devront être surmontés
afin d’améliorer le processus de production collaborative des connaissances et le partage
d’idées. Trois types de défis sont identifiés :
- Communicatif : la communication des connaissances pour l’innovation, qui devraient être
transmises pour réussir à résoudre les problèmes complexes dans la proposition de nouveaux
produits ou de nouveaux services ;
- Organisationnel : élaborer les stratégies de partage d’idées quand les participants sont dis-
tribués. Identifier les stratégies de gestion de connaissances que l’organisation des entreprises
ou les équipes devront encourager afin de créer les plateformes de collaboration pour
l’innovation ;
- Technologique : transmettre des connaissances tacites, non structurées et informelles, spé-
cialement, en utilisant les technologies de collaboration, les technologies de l’information et
de la communication (TIC), les outils collaboratifs Web 2.0 ou Web 3.0.

VIII
Les défis permettent définir deux dimensions de notre problématique de recherche : la di-
mension théorique et la dimension pratique ou technologique. La dimension théorique porte
sur l’environnement des échanges d’idées et de connaissances qui supportent la collaboration
créative. Les dimensions pratique et technologique sont considérées dans la modélisation de
collaboration créative qui prendra la forme d’une plateforme pour les activités de production
de connaissances et de partage d’idées.
Le but de cette thèse est de supporter les équipes créatives pendant leur processus de concep-
tualisation d’un nouveau produit orienté vers l’innovation. Les objectifs de recherche sont :
1. Déterminer les besoins des équipes créatives pendant l’étape de conceptualisation
d’un nouveau produit
2. Proposer un système de gestion des connaissances (outils et connaissances) qui
permet le support pour la production de connaissances tacites résultantes de la
condition distribuée des membres des équipes
3. Modeler la plateforme qui supporte les besoins internes des équipes et de leur
contexte à l’externe pour l’innovation
4. Proposer l’estimation de la collaboration créative par rapport à l’expérience utili-
sateur et les tâches réalisées par les équipes créatives dans le prototype TIC
Avec la revue de littérature du Chapitre 1, l’étude de la collaboration parmi les entreprises de
R-D au Canada dans le Chapitre 2 et l’analyse des besoins des équipes créatives de « 24
heures de l’innovation » de novembre 2011 du Chapitre 4, le premier objectif sur la détermi-
nation des besoins des équipes créatives est atteint. Ainsi, dans le Chapitre 2 est défini le con-
texte de travail des équipes créatives en R-D, c’est à dire les conditions sociales et technolo-
giques au Canada et les interactions de ces équipes pour l’innovation. La problématique défi-
nie et la méthodologie pour la réalisation de cette thèse sont présentées au détail dans le Cha-
pitre 3.
Le deuxième objectif est atteint, d’une part, en analysant la production des connaissances
dans les équipes créatives et en proposant un modèle conceptuel, extrait des observations

IX
directes de la compétition d’innovation « Les 24 heures de l’innovation ». D’autre part, en
présentant un cahier des charges de la plateforme collaborative, basé sur le concept d’idéalité
de TRIZ, qui consiste dans la projection de l’analyse de l’état de l’art de la technologie du
support au partage de connaissances (Chapitre 5) en comparaison aux besoins des équipes
créatives et les fonctionnalités utiles des technologies actuelles de l’information et de la
communication (TIC).
Le troisième objectif est atteint en modélisant la plateforme collaborative et ses principales
fonctionnalités, à l’aide du langage de modélisation unifié UML 2 dans le Chapitre 5. De la
même manière, le quatrième objectif est atteint avec l’évaluation expérimental de de la plate-
forme de collaboration. Le Chapitre 7 et le Chapitre 8 résument les résultats obtenus sur
l’évaluation de l’expérience-utilisateur du prototype au moyen de : la validation des études
de cas UML, l’analyse de tâches des fonctionnalités utilisées, l’analyse de la performance
PAN (Performance Analysis) et le test d’utilisabilité.
Finalement, les autres sections de cette thèse sont les conclusions de la recherche, les retom-
bées, la recherche future et les recommandations. Dans les annexes est inclus le plan
d’éthique présenté au Comité d’Éthique de l’École de technologie supérieure et les résultats
obtenus dans l’édition de « 24 heures de l’innovation » qui a eu lieu en mai 2012.


DESIGN OF A COLLABORATIVE INFORMATION AND COMMUNICATION TECHNOLOGY PLATFORM TO SUPPORT CREATIVITY IN INNOVATION
ACTIVITIES - PROTOTYPING AND USER EXPERIENCE TEST
Luz Maria JIMÉNEZ
ABSTRACT
This research project reports the results of the thesis, “Design of a Collaborative Information
and Communication Technology Platform to support Creativity in Innovation Activities -
Prototyping and User Experience Test” and provides details of the procedure followed in
realizing the thesis. The research was conducted between Fall 2010 and Winter 2013.
The research problem was based on an analysis of three challenges observed in innovation
activities, especially at the level of creative collaboration among R&D enterprises and crea-
tive teams of “Les 24 heures de l’innovation”. These challenges must be overcome before the
knowledge production and ideas sharing process can be improved. Three types of challenges
were identified:
- Communication: The communication of knowledge for innovation, which must be transmit-
ted to successfully resolve complex issues, in the proposal of new products or new services
- Organizational: Development of knowledge management strategies for distributed idea
sharing, which should be encouraged by the organization to create or support teams by means
of a collaborative platform
- Technology: Transmission of tacit, unstructured, and informal knowledge, especially using
collaborative ICT and technologies Web 2.0 or Web 3.0 tools.
This thesis investigates two dimensions of the research problem: the theoretical and the prac-
tical (technology issues). The theoretical dimension examines the environment for the ex-
change of ideas and knowledge, which supports creative collaboration in distributed condi-
tions. The practical and technological dimensions involve a creative collaboration model
which will take the form of a platform for creative teams.
XII
The aim of this thesis is to support the creative teams in the process of conceptualization of a
new innovation-oriented product. Through this thesis, we seek to:
- Determine the needs of creative teams during the conceptualization stage of a new
product;
- Propose a Knowledge Management System (knowledge and tools) that enables the
support of tacit knowledge produced in distributed condition of team members;
- Modeling a Platform that supports internal creative team’s needs and the external
context for innovation;
- Propose the assessment of the creative collaboration meaning the user experience
testing and the realized task by creative teams on the ICT prototype.
We carry out a review of the literature in Chapter 1, a study of collaboration among creative
R&D teams in Canada in Chapter 2, and in Chapter 4, we perform a knowledge needs analy-
sis of creative teams in “Les 24 heures de l’innovation”. These will enable us to achieve the
first objective, the definition of the needs for supporting creative teams. Ultimately, we char-
acterize the context of R&D activities in Canada, as well as interactions among creative
R&D teams for innovation, with a theoretical study, by analyzing statistical data obtained
from Statistics Canada. A detailed presentation of the problem statement and the methodolo-
gy used for this thesis is provided in Chapter 3.
The second objective is fulfilled by analyzing the idea production process and the current
ICTs, for proposing a conceptual model based on the observation of creative teams partici-
pating in “Les 24 heures de l’innovation” November 2011. On the other hand, by proposing
the new specifications that support collaboration, we select a methodology based on the law
of ideality (TRIZ), in which we observe the evolution of technological state-of-the-art of cur-
rent functionalities (Chapter 5) in contrast with the needs and useful operations of ICT.
To realize the third objective, we model the collaborative platform, and its primary function-
alities are presented using the UML 2, Unified Modeling Language, also we describe the pro-
totype deployment at Chapter 6. The fourth objective is reached by an experimental evalua-

XIII
tion of the platform that is presented in Chapter 7 and in Chapter 8. These chapters summa-
rize the results obtained by the application of the following user experience test: validation of
UML use-cases user’s acceptance, the task analysis of the main used functionalities, the crea-
tive performance Analysis of user (PAN) and the usability test.
Finally, the other sections of this document are the conclusion, findings, proposals for further
research, and recommendations. In the Appendix, we include the ethical plan presented to the
École de technologie supérieure Ethical Review Board, as well as the results obtained from
“Les 24 heures de l’innovation” of May 2012.

TABLE OF CONTENTS
Page
INTRODUCTION .....................................................................................................................1
CHAPTER 1 CONCEPTUAL FRAMEWORK AND THEORETICAL INNOVATION MODELS REVIEW ...........................................................................................5
1.1 Theoretical framework for the study: Idea, information and knowledge ......................5 1.1.1 Idea .............................................................................................................. 5 1.1.2 Data and information .................................................................................. 6 1.1.3 Knowledge .................................................................................................. 7 1.1.4 Knowledge Production................................................................................ 8
1.2 Knowledge objects in design process ............................................................................9 1.3 Knowledge Management Design System ....................................................................12 1.4 Knowledge production in an innovation context .........................................................13
1.4.1 Innovation as Knowledge production by Amin & Cohendet (2004) ........ 13 1.4.2 Knowledge production by Nonaka & Takeuchi (1995) ............................ 14 1.4.3 Interactive Learning by Lundvall (2005) .................................................. 15 1.4.4 Systematic approach of innovation by Esser et al. (1996) ........................ 16 1.4.5 Creative Zone by Amesse & Cohendet (2001) ......................................... 17 1.4.6 Collective Invention and Open Innovation ............................................... 19 1.4.7 Co-creation of Value through Global Networks by
Prahalad & Krishnan (2008) ..................................................................... 20 1.5 Innovation theoretical models revisited .......................................................................21 1.6 Creative Collaboration in early design stages: ideas and knowledge sharing .............23
1.6.1 Distributed creative collaboration ............................................................. 23 1.6.2 eCollaboration: supporting collaboration by ICTs ................................... 24
1.7 Summary ......................................................................................................................26
CHAPTER 2 CONTEXT OF COLLABORATIVE NETWORKING FOR INNOVATION AMONG R&D FIRMS: ANALYSIS OF CANADIAN STATISTICS...........27
2.1 Nature of R&D teams and enterprises .........................................................................27 2.2 Sources of collaboration for R&D enterprises (Collaborative exchanges) ..................28
2.2.1 Embedded Knowledge: experts, expert thinking and informal collaborative network ................................................................. 31
2.3 Task flow of Knowledge Sharing: Strategic, Tactical and Operative knowledge .......33 2.4 Knowledge transfer between Strategic and Operative Tasks ......................................35 2.5 Summary ......................................................................................................................36
CHAPTER 3 PROBLEM STATEMENT, RESEARCH OBJECTIVES AND METHODOLOGY ...........................................................................................37
3.1 Problem-finding background .......................................................................................37 3.1.1 From tacit knowledge production to codified knowledge ........................ 37
XVI
3.1.2 Complexity of dissemination of the content of an idea through tacit knowledge ................................................................................................. 38
3.1.3 Lack of a knowledge management system for a creative collaboration ... 39 3.1.4 ICT impact on collaborative ideation process .......................................... 39 3.1.5 Impact of ICT on creative collaboration ................................................... 42
3.2 Problem statement ........................................................................................................44 3.3 Research question ........................................................................................................45 3.4 Research objectives ......................................................................................................45 3.5 Methodology ................................................................................................................46 3.6 Validation of the data collected ...................................................................................50
3.6.1 Identification of knowledge, strategies and methods used in creative collaboration ................................................................................ 50
3.6.2 Ideality (TRIZ) and ICT Collaborative Platform design .......................... 51 3.6.3 UML 2 and specifications ......................................................................... 52 3.6.4 Prototype and users test ............................................................................ 54
3.6.4.1 Use-cases acceptance by users ................................................... 55 3.6.4.2 Task Analysis of Knowledge Management System .................. 56 3.6.4.3 Performance Analysis: creative activities .................................. 56 3.6.4.4 Usability: qualitative analysis .................................................... 57
3.7 Limits of the study .......................................................................................................58 3.8 Summary ......................................................................................................................58
CHAPTER 4 UNDERSTANDING NEEDS OF CREATIVE TEAMS ..................................61 4.1 Knowledge acquisition process in a new product definition .......................................61 4.2 Defining the use of ICT to acquiring knowledge .........................................................62 4.3 Description of the study: Participants and Procedure ..................................................63 4.4 Results ..........................................................................................................................64
4.4.1 Knowledge acquired from internal and external sources .......................... 64 4.4.2 Knowledge and information exchange among team members ................. 66 4.4.3 Production of ideas by participants during internal teamwork ................. 67
4.5 Identification of ICT Tools used in product definition ................................................69 4.5.1 Cloud–computing and Internet as a critical source of knowledge
acquisition for innovation ......................................................................... 71 4.6 Discussion ....................................................................................................................73 4.7 Summary ......................................................................................................................74
CHAPTER 5 MODELING THE COLLABORATIVE PLATFORM AND SPECIFICATIONS ..........................................................................................75
5.1 Supporting creative collaboration: domain model .......................................................75 5.2 Modeling the Platform according to TRIZ ..................................................................77 5.3 Model of collective idea production supported by ICT ...............................................79 5.4 Definition of Collaborative Platform by Use Cases ....................................................80 5.5 Interaction between Participant, System Administration and Familiar Tools .............83 5.6 Collaborative Platform Architecture ............................................................................85
5.6.1 Classes and static structure of Platform .................................................... 85
XVII
5.7 Architecture Analysis ...................................................................................................87 5.7.1 Package components of Platform .............................................................. 87 5.7.2 Architecture ............................................................................................... 90
5.8 Addressing the Requirements of the Platform .............................................................91 5.8.1 Functional requirements ............................................................................ 91 5.8.2 Data and capacity requirements ................................................................ 92 5.8.3 Interface requirements .............................................................................. 92 5.8.4 Security and privacy ................................................................................. 93
5.9 Summary ......................................................................................................................93
CHAPTER 6 ICT SPECIFICATIONS AND PROTOTYPE DEVELOPMENT ....................95 6.1 Current collaborative tools in Web 2.0 and Web 3.0 ...................................................95
6.1.1 Collaborative platforms based in Social Media ........................................ 96 6.1.2 Current open-collaborative crowdsourcing platforms .............................. 97
6.2 ICT Specifications in collaborative platforms .............................................................97 6.2.1 Communication Specifications ............................................................... 100 6.2.2 Real-time Communication (synchronous) .............................................. 101
6.2.2.1 Verbal Communication ............................................................ 101 6.2.2.2 Graphics ................................................................................... 101
6.2.3 Offline communication (asynchronous) ................................................. 101 6.2.3.1 Asynchronous Verbal Communication .................................... 101 6.2.3.2 Graphics: .................................................................................. 101
6.2.4 Sharing knowledge objects (codified knowledge in files and/or contributions) .......................................................................................... 102
6.2.5 Explaining Ideas – contributions visualization ....................................... 102 6.2.6 Idea Evaluation, Questions, Criteria/Restrictions or Decisions .............. 102 6.2.7 Ideas space and interface (conceptual space) .......................................... 103
6.2.7.1 Visualization of Idea Evolution pathway ................................. 103 6.2.7.2 Visualization of Decisions ....................................................... 103
6.2.8 Personalization (personal space, authoring) ........................................... 103 6.2.9 Team space .............................................................................................. 103
6.3 Dynamic of creative collaboration in a cross-platform ..............................................104 6.3.1 Team Integration and Team Space ......................................................... 105 6.3.2 Personal idea space ................................................................................. 106 6.3.3 Project Pathway ...................................................................................... 107
6.4 Enriching collaboration: Graphic Folksonomy and Collaborative Tagging ..............107 6.4.1 Collaborative Tagging for supporting fuzzy production of ideas ........... 109 6.4.2 Graphical Folksonomy of ideas production ............................................ 109
6.5 Enriching ideas production by collaborative interaction ...........................................110 6.5.1 Awareness of teammates and ideas evolution ........................................ 111 6.5.2 Ideas questions ........................................................................................ 112 6.5.3 Ideas Evaluation ...................................................................................... 112
6.5.3.1 Matrix Evaluation by Criterion ................................................ 112 6.5.3.2 Ideas Selection Display ............................................................ 113 6.5.3.3 Emoticons ................................................................................ 114

XVIII
6.5.3.4 Alerts System ........................................................................... 114 6.5.3.5 Priority Information Needed .................................................... 115
6.6 Summarizing of objects of knowledge in a Global Team Space ...............................115 6.7 Deployment in the Platform Prototype ......................................................................116 6.8 Summary ....................................................................................................................119
CHAPTER 7 PLATFORM PROTOTYPE TESTING ..........................................................121 7.1 Study Description.......................................................................................................121
7.1.1 Subjects ................................................................................................... 121 7.1.2 Task ......................................................................................................... 122 7.1.3 Procedure ................................................................................................ 122
7.2 Description and evaluation of Use cases ...................................................................123 7.2.1 Use case 1: Participant Registration ....................................................... 124 7.2.2 Use case 2: Team Integration .................................................................. 124 7.2.3 Use case 3: Idea space ............................................................................. 125 7.2.4 Use case 4: Following ideas .................................................................... 127 7.2.5 Use case 5: Following the team space .................................................... 128 7.2.6 Results of use cases evaluation ............................................................... 132
7.3 Task Analysis: Variability of tasks and functionalities used in the Platform ............134 7.3.1 Stages and tasks accomplished by participants ....................................... 135
7.3.1.1 ICT Tools and media used in InnoKiz ..................................... 138 7.3.1.2 Media and tools used during 21 hours of
Project Development ................................................................ 139 7.3.2 Results of Task Analysis and the use of Prototype ................................. 141
7.4 Summary ....................................................................................................................142
CHAPTER 8 ANALYSIS OF THE CREATIVE COLLABORATION PERFORMANCE ON AN ICT PLATFORM ..............................................................................143
8.1 Testing Collaborative Platform through Performance Analysis (PAN) ....................143 8.2 Creative Collaboration Performance on the Platform ................................................144 8.3 Perceived Performance using the Platform ................................................................150
8.3.1 Perceived Creative Performance ............................................................. 150 8.3.2 Perceived Creative Team Performance ................................................... 150 8.3.3 Perceived Usefulness .............................................................................. 151 8.3.4 Perceived Accessibility ........................................................................... 151
8.4 Perceived Performance and Groupware Experience ..................................................152 8.5 Usability: qualitative Evaluation of the collaborative experience on InnoKiz ..........157 8.6 How can collaboration be achieved on the Platform? ...............................................159 8.7 Summary ....................................................................................................................160
CONCLUSION ......................................................................................................................163
CONTRIBUTION, FINDINGS AND ORIGINALITY OF THE RESEARCH ...................165
RECOMMENDATIONS AND FURTHER RESEARCH ....................................................173
XIX
APPENDIX I ETHICAL PLAN CONSENTMENT AND INFORMATION FORM ..........175
APPENDIX II CREATIVE TEAMS OF 24H INNOVATION, MAY 2012 ........................191
APPENDIX III QUALITATIVE DATA ABOUT INNOKIZ EVALUATION ...................195
APPENDIX IV UML 2 GLOSSARY ....................................................................................205
BIBLIOGRAPHY ..................................................................................................................207


LIST OF TABLES
Page Table 1.1 Knowledge Notions in quotations ..............................................................................8
Table 1.2 Knowledge Objects in a Design process ..................................................................12
Table 1.3 Description of the systemic approach to innovation ................................................17
Table 1.4 Summary of Innovation Models Revision ...............................................................22
Table 1.5 New Product resources comparison .........................................................................25
Table 2.1 Decomposition of innovation activities ..................................................................34
Table 3.1 Comparison among teams of R&D teams and 24H teams .....................................49
Table 4.1 Phases of knowledge acquisition and research statements .....................................62
Table 4.2 Teams composition by participants and schools .....................................................65
Table 4.3 Knowledge provided by external sources by period of time ...................................66
Table 4.4 Critical tools to be used during a new product development ...................................71
Table 6.1 Current technologies of collaboration and new functionalities to implement ........99
Table 6.2 Explicit Pictograms for naming contributions .......................................................111
Table 6.3 Ideas Information ...................................................................................................112
Table 6.4 Ideas Evaluation Matrix .........................................................................................113
Table 6.5 Idea Selection Pictograms ......................................................................................113
Table 6.6 Examples of Ideas Evaluation by Emoticons ........................................................114
Table 6.7 Priority Information Needs ....................................................................................115
Table 6.8 Comparison of use cases proposed in UML 2 and Innokiz Prototype ...................118
Table 7.1 Distribution of participants by educational level ...................................................122
Table 7.2 Statistics of use of Innokiz (reported by Webmaster Clément Jacquot) ................123
Table 7.3 Use of Ideabox for co-localized and remote teams ................................................126

XXII
Table 7.4 Public messages to the teams .................................................................................130
Table 7.5 Messages sent during the collaboration period ......................................................132
Table 7.6 Descriptive statistics of platform use by remote and co-localized teams ..............133
Table 7.7 Task realized and definition of activities ...............................................................136
Table 8.1 Data obtained in Likert scaleform .........................................................................146
Table 8.2 Form used to measure the perception of performance by participants ..................148
Table 8.3 Condensed data of users’ evaluation of Platform ..................................................149
Table 8.4 Correlation Analysis of Perceived Performance, Creativity assessment, and Groupware Use ......................................................................................................153
Table 8.5 Test participants grouped by level of Groupware utilization ................................154
Table 8.6 Student’s t-test for Independent samples ...............................................................155
Table 8.7 ANOVA-test for two-factors without replication ..................................................156
Table 8.8 Qualitative Evaluation of InnoKiz: problems and limitations ...............................158

LIST OF FIGURES
Page
Figure 1.1 Knowledge production according to SECI Model .................................................15
Figure 2.1 Sources of information for innovation in R&D enterprises in Canada ..................29
Figure 2.2 Importance of information sources for innovation activities of R&D SMEs. .......30
Figure 2.3 Average of reasons for collaboration (%) by SMEs in R&D .................................32
Figure 2.4 Model of collaboration networking between creative R&D teams ........................33
Figure 2.5 Analysis based on type of knowledge and complexity of the information exchanged .....................................................................................35
Figure 3.1 Thesis Research Framework ...................................................................................47
Figure 3.2 Proposed S-shaped curve evolution of Collaborative Technologies ......................53
Figure 3.3 Step-by-step process to represent the collaborative platform .................................54
Figure 4.1 24H participants’ biographical information ...........................................................64
Figure 4.2 Exchange of information among teammates, client and organization ...................67
Figure 4.3 Number of individual ideas produced over time. ...................................................68
Figure 4.4 Tools and ICT technologies used by the 40 teams during a 24-hour period ..........70
Figure 4.5 Critical tools to exchange knowledge.....................................................................70
Figure 5.1 Knowledge sharing by an R&D team .....................................................................76
Figure 5.2 Description of general context for creative collaboration support .........................77
Figure 5.3 Including ICT in the team integration process .......................................................79
Figure 5.4 Including ICT in the collective idea generation process ........................................80
Figure 5.5 Use case overview identifying two actors: User and System Administration ........81
Figure 5.6 Use cases for Platform subsystem definition..........................................................82
Figure 5.7 Sequence Diagrams for Platform System and users ...............................................84

XXIV
Figure 5.8 Sequence Diagram for contribution elaborated in a personal software or tool .......................................................................................................85
Figure 5.9 Platform Class Diagram .........................................................................................86
Figure 5.10 Participant Management System ..........................................................................87
Figure 5.11 Contribution Management System .......................................................................88
Figure 5.12 Project Management System ................................................................................88
Figure 5.13 Permissions sharing tool – enhancing external tools ............................................88
Figure 5.14 Tagging System ....................................................................................................89
Figure 5.15 Folksonomy Management System .......................................................................89
Figure 5.16 Platform Administration .......................................................................................89
Figure 5.17 Architecture of Collaborative System ..................................................................90
Figure 6.1 Project Pathways represented on Platform ...........................................................105
Figure 6.2 Deployment by contribution and inside elements ................................................106
Figure 6.3 Personal Space Interface .......................................................................................107
Figure 6.4 Cloud-tagging Folksonomy ..................................................................................108
Figure 6.5 Clusters grouping knowledge by density .............................................................108
Figure 6.6 Status box for Awareness participants’ moods ...................................................111
Figure 6.7 Global Project advance interface ..........................................................................116
Figure 6.8 Glimpse of Mock-up of Collaborative Platform prototype .................................117
Figure 7.1 Screen shot Participant Registration .....................................................................124
Figure 7.2 Screen shot of Team Space ...................................................................................125
Figure 7.3 Screen shot of Idea Space .....................................................................................126
Figure 7.4 General Use description of Collaborative Tagging of Ideas in IdeaBox ..............127
Figure 7.5 Screenshot of statistics in IdeaBox .......................................................................128
Figure 7.6 Use case following Team Space ...........................................................................129

XXV
Figure 7.7 Messages by public to teams ................................................................................130
Figure 7.8 Messages exchanged and interaction among users of Platform ...........................131
Figure 7.9 Stages Evolution by time (each 3 hours) ..............................................................135
Figure 7.10 Summary in % of the main task realized during stages ......................................138
Figure 7.11 InnoKiz functionalities used at 6H, 15H and 21H .............................................139
Figure 7.12 Number of times reported for using media during 21 hours (%) .......................140
Figure 7.13 ICT Tools used for 3-hour period (answers in %) ..............................................141
Figure 8.1 Form used to assess the perception of the performance by participants ..............145
Figure 8.2 Perceived creativity performance using the Platform ..........................................150
Figure 8.3 Perceived performance using the Platform ...........................................................151
Figure 8.4 Perceived Usefulness using the Platform .............................................................151
Figure 8.5 Perceived Accessibility to the Platform ...............................................................152
Figure 8.6 Distribution of Perceived performance, Groupware Experience and Usefulness .....................................................................................................153
Figure 8.7 Limitations observed in the Platform by users .....................................................160

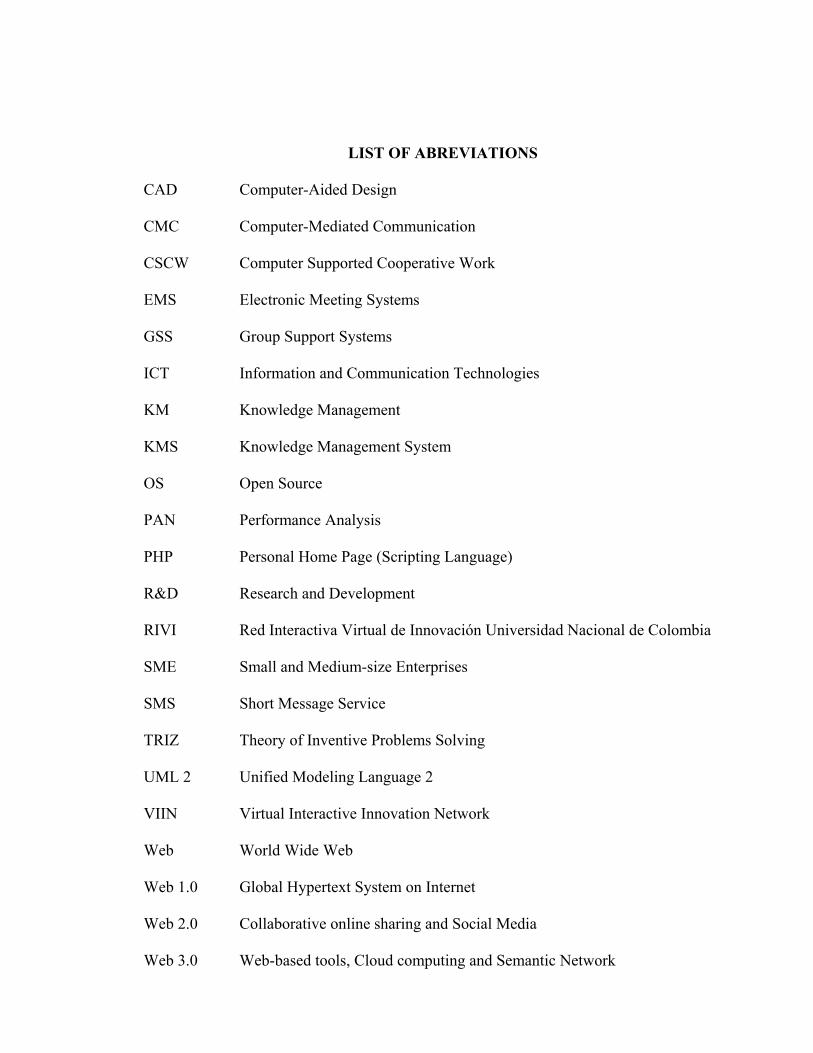
LIST OF ABREVIATIONS CAD Computer-Aided Design CMC Computer-Mediated Communication CSCW Computer Supported Cooperative Work EMS Electronic Meeting Systems GSS Group Support Systems ICT Information and Communication Technologies KM Knowledge Management KMS Knowledge Management System OS Open Source PAN Performance Analysis PHP Personal Home Page (Scripting Language) R&D Research and Development RIVI Red Interactiva Virtual de Innovación Universidad Nacional de Colombia SME Small and Medium-size Enterprises SMS Short Message Service TRIZ Theory of Inventive Problems Solving UML 2 Unified Modeling Language 2 VIIN Virtual Interactive Innovation Network Web World Wide Web Web 1.0 Global Hypertext System on Internet Web 2.0 Collaborative online sharing and Social Media Web 3.0 Web-based tools, Cloud computing and Semantic Network


INTRODUCTION
From 1993 to 2006, I was Professor of Creativity at the Universidad Nacional de Colombia
in Manizales and an active member of the Creative Management team. In 2003, the team was
invited by the university board to participate in the activities of the “Parque de Innovación
Empresarial”1, which promotes innovative entrepreneurship among students. The Park was
led by Professor Johnny Tamayo, an expert in Information and Communication Technologies
(ICT), who implemented new collaborative tools in the Park’s activities. At the time, I was
also co-lead for the third year workshop at the Department of Industrial Engineering. During
the workshop, students worked together with academics and project managers from local
industries. By common consent, we proposed introducing the available ICT platform of the
Park in the workshop and training more than 75 students. For the project, we chose the Open
Source groupware (OS) DotProject, a project management tool. After using DotProject for
one academic semester, I submitted a research project to the administration: Red Interactiva
Virtual de Innovacion (RIVI) (Virtual Interactive Innovation Network VIIN). This project was
mainly supported by the National University, which provided computer and physical infra-
structure worth $CAD500,000 (Jiménez and Vargas, 2004; Jiménez, Vargas and Tamayo,
2004, p. 154). The RIVI project consisted of a platform for interactive work which allowed
teachers, students and entrepreneurs working in partnership to outreach university projects.
After a year of hard work, and despite active student participation, enthusiasm for ICTs was
waning. The use of ICTs for collaboration, which initially had many advantages for Universi-
ty services and companies, presented some drawbacks mainly due to:
- A significant drop in participation among a large portion of project managers;
- A lack of use of computer networks or difficulty accessing them;
1 For more information, visit the Web site: http://parque.manizales.unal.edu.co/index.php or the Facebook Page https://www.facebook.com/ParqueInnova.

2
- The heavy workload that was added to our usual fare (ICT involves the consolidation of
tacit information to render it explicit and accessible). Using the keyboard to enter all infor-
mation took time, as compared to verbal and interpersonal communication during business
visits;
- The fact that groupware imposes a different kind of organization (Jiménez and Vargas,
2004).
Research motivation and goal
In 2006, I presented the project, “Espaces virtuels pour l’innovation” (Virtual Spaces for In-
novation), sponsored by Fonds Québécois de la Recherche sur la Nature et les Technologies,
FQRNT (2007-2010), because I found the same drawbacks in the use of ICT in Quebec en-
terprises as what I had observed in Colombia. This thesis was born out of my desire to know
what had happened in the RIVI project (described above), and to establish a means for sup-
porting collaboration. These elements are at the root of our interest in identifying the issues
involved in sharing creative ideas in a distributed context as well as in contributing to the
development of new methodologies for innovation in R&D projects, particularly in the early
design stage, when knowledge production and ideas sharing remain informal and non-
structured.
In this research, our main question is: How can we support the distributed creative collabo-
ration, using a knowledge management system and a collaborative ICT platform for ideas
sharing? The problem statement is broken down into two dimensions:
Theoretical dimension: Improving a knowledge management system for the exchange of
tacit knowledge to support distributed creative collaboration.
Practical and technological dimension: Developing an ICT platform for creative teams
based on a knowledge management system that supports creative collaboration.
As indicated above, this thesis is broken down into eight chapters, presented as follows:

3
In Chapter 1, we present a review of the literature, which introduces the most common con-
cepts that will be used in our thesis and the study of the theoretical models proposed to un-
derstand innovation and creative collaboration. Also, we review eight theoretical models to
explain the innovation process. All these models converge to concepts as: knowledge produc-
tion, interactive learning, and the use of ICT in the new knowledge economy.
In Chapter 2, we analyze a case study of R&D in SMEs in Canada. Creative R&D teams in-
clude strategies based on expert thinking and informal association, such as seeking critical
expertise, using their “embedded knowledge”. Knowledge capture for innovation is acquired
from associations, trade fairs and the Internet, summarizing a dynamic based on an informal
and non-permanent network.
In Chapter 3, the theoretical models and case study results are compiled to structure our prob-
lem statement. Also, we present the methodology used to achieve the research objectives.
The theoretical results are validated through a study of needs and ideals required for creative
collaboration. Data was collected from the creative teams of two editions of “Les 24 heures
de l’innovation”, an international competition organized by ÉTS: May 2011 (150 partici-
pants) – description of ICT needs and Tools, November 2011 (250 participants) – ideals and
knowledge needs, and May 2012 (850 participants) – prototype testing.
In Chapter 4, we describe the knowledge sharing needs of creative teams working on a new
R&D product. We found that they prefer to seek expertise in defining the project concept, but
that they do not maintain constant communication with experts or organization staff. Creative
teams prefer capture knowledge from Internet as a kind of Technology Watch method.
Teams reported wide variations in the use of ICT to share knowledge and ideas. This infor-
mation allowed us to model the collaboration process using an ICT Platform.
In Chapter 5, we model the main functions and characteristics of an ICT platform that sup-
ports creative collaboration dynamics using the UML 2 language. UML 2 allows us to antici-
pate possible use cases and the form of interaction among participants, through: 1) Commu-

4
nication, time management, task assignment components; 2) The definition of components
and architecture of the system using expected results and communication tools; 3) The use of
applications to share files and collaborative tagging systems during the ideas generation and
sharing process.
In Chapter 6, we follow the trend of technology evolution proposed applying the Ideality
Law (TRIZ approach) to define the current state-of-the-art of collaborative tools. We select
the main functionalities in the Web 2.0 and Web 3.0 technologies that could be integrated
into a cross-platform. This analysis allows us to define the prototype of the collaborative
platform, InnoKiz (Keys of Innovation) that incorporate some new functionalities that are not
yet available as ideas generation or evaluation tools.
In Chapter 7, we compare the functionalities modeled with functionalities implemented on a
PHP Platform (developed by Clément Jacquot), and a test of UML validation use- cases and
task analysis used to define the collaboration and the communication patterns produced
among 24H teams.
In Chapter 8, we present a performance and usability test carried out to define functionalities
that are perceived as useful by users. We assess collaborative performance as an index com-
posed of four metrics: perceived creative performance, perceived team performance, per-
ceived usefulness, and perceived accessibility.
Finally, in the Conclusion and Recommendation Sections, we underline the main findings of
this thesis, and propose some possible avenues of future research work.
CHAPTER 1
CONCEPTUAL FRAMEWORK AND THEORETICAL INNOVATION MODELS REVIEW
This chapter presents the conceptual framework for creative collaboration (main terms used
in this thesis) and a review of the literature on the knowledge production process in eight in-
novation models. These models break down into three concepts related with: knowledge pro-
duction, social interaction, and needs of media support in the process of innovation. This first
chapter is complemented by Chapter 2, which presents an analysis of the context of R&D
enterprises in Canada. This study was developed using data from Statistics Canada to exam-
ine collaborative activities for innovation. This knowledge-based approach enables modeling
triggers interactions among R&D enterprises and their context to build networking and or-
ganization. Our aim is to define what creative collaboration takes place in an innovative con-
text.
1.1 Theoretical framework for the study: Idea, information and knowledge
A conceptual framework is “the system of concepts, assumptions, expectations, beliefs, and
theories that supports and informs [a] research” (Maxwell, 2004, p. 33). This framework is a
“tentative theory” (idem) that delimits this study. Initially, the basic concepts to be defined
are: idea, data and information, knowledge production, and creative collaboration. Later in
this chapter, the main models of knowledge production in an innovation context will be dis-
cussed.
1.1.1 Idea
The word Idea comes from the Greek eidos, which means visible form or pattern. This con-
cept denotes “a subjective, internal presence in the mind, somehow thought of as represent-
ing something about the world” (Oxford Dictionary of Philosophy, 2008, p. 177); it also
“represents an eternal, timeless unchanging form or concept: the concept of the number series

6
or of justice, for example, thought of as independent objects of enquiry and perhaps of
knowledge” (idem). These two definitions make the concept of idea “a notion stretching”
from A to B (idem) because it has many meanings and interpretation problems. In a design
context, the first definition is more commonly used, because idea refers to insights or an-
swers to problems, especially technological dilemmas. These problems are characterized by
their complexity because they affect social development, in addition to posing economical
and technical challenges. The production of a new idea is at the core of a creative process. A
creative idea is recognized if at the time it provides a new meaning, an original answer and
no statistical correspondences exist with another known answer. An idea could be expressed
“in a word, a phrase, a sentence, or indeed any verbal proposition, but it may be something
expressed in a gesture, a figure, a drawing, or a particular action” (Carroll, 1993, p. 394). An
idea could be considered creative when it gives another meaning, another answer or another
expression to the problem (ibid). A creative idea expresses something different from the usu-
al information obtained by simple analysis. In that sense, an idea constitutes tacit knowledge
in the mind, which is transformed as a seed of explicit knowledge when it is socialized.
1.1.2 Data and information
Data is a notion or a fact that could be represented by conventional symbols or by an inter-
pretation system. These symbols are easily processed or stored, and allow an automated us-
age process. Information is basically data, with which it shares characteristics: transmissibil-
ity, storability, and reusability. Information refers to the action of modeling or giving a form
to data (CNRTL, 2009); essentially, information gathers a new organization into data, mak-
ing the data meaningful.
Despite the similarities between data and information, Sage (2003) argues about “the distinc-
tion between data, information […]. Data represent points in space and time that relate to
particular aspects. Information is data that are potentially relevant to decision making; it re-
lates to description, definition, or outlook. Generally, information is responsive to questions
that relate to “what,”, “when”, “where”, or “who” (ibid).

7
In an engineering context, information relates to the process of recognizing and having a
“better understanding of knowledge. It can lead to better decision making and problem solv-
ing in design” (Xu et al., 2011). The information must be presented in a comprehensive man-
ner.
1.1.3 Knowledge
Underlying the definition of knowledge is an ongoing discussion concerning the history of
philosophy. The meaning of knowledge corresponds to the paradigms and beliefs of human
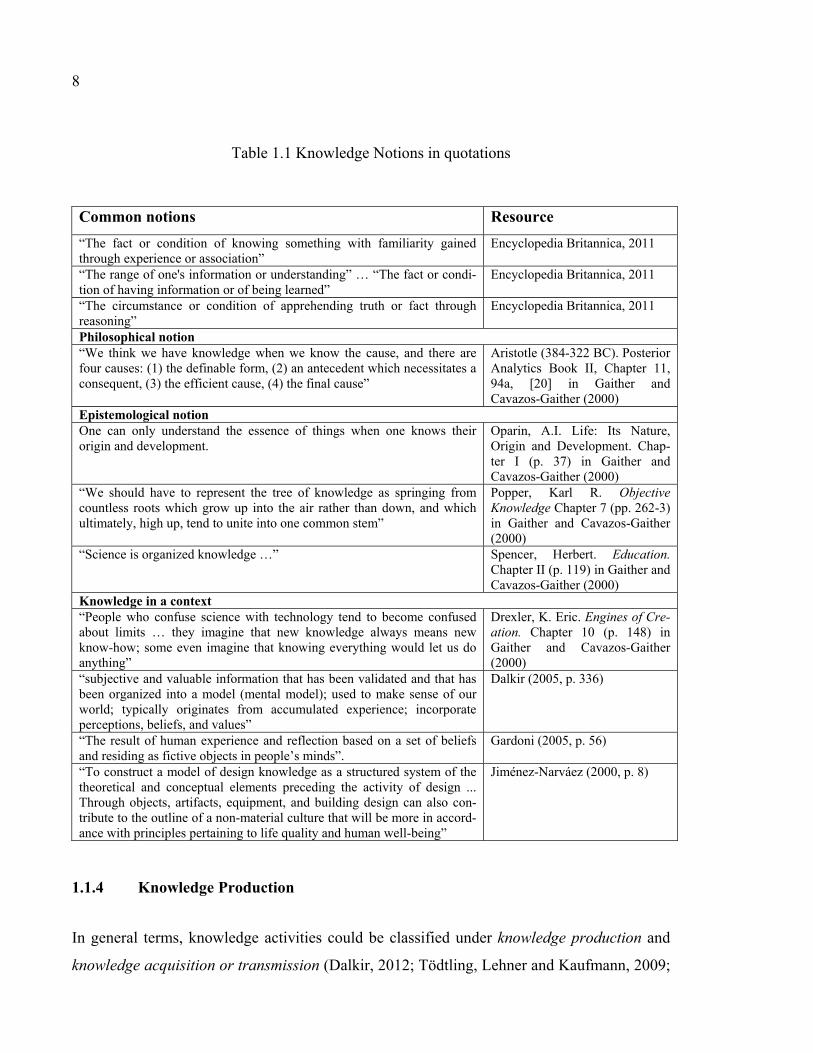
thought. The multifaceted definition of knowledge can be observed for the different common
definitions, as seen in Table 1.1. The definitions seem to identify knowledge with the mental
model or the paradigm of the community where the knowledge was created or conceptual-
ized. Table 1.1 shows an overview of different notions of knowledge. These notions are con-
nected to social approaches or brands of philosophy. In some cases, many definitions are re-
lated to epistemology, the branch of philosophy which studies the nature and the production
of scientific knowledge. There is a tripartite vision of knowledge, which consists in a basic
analysis of a proposition to identify its consistence as knowledge. For a proposition to be
considered as knowledge, it must have “three individually necessary and jointly sufficient
conditions: justification, truth and belief. In short, propositional knowledge is justified
through belief” (Moser, 1993, p. 2).
Pursuing the same comparison of data and information, we can define knowledge as the
structure used to organize information in a comprehensible manner for a community valida-
tion, in a given social or historical context. Knowledge also describes the structure of the in-
tellect, in a cognitive approach and in other cases; it is related to the structure of the science.
Any of these notions can fully explain the description of knowledge, although none of them
may accurately define knowledge production.
8
Table 1.1 Knowledge Notions in quotations
Common notions Resource
“The fact or condition of knowing something with familiarity gained through experience or association”
Encyclopedia Britannica, 2011
“The range of one's information or understanding” … “The fact or condi-tion of having information or of being learned”
Encyclopedia Britannica, 2011
“The circumstance or condition of apprehending truth or fact through reasoning”
Encyclopedia Britannica, 2011
Philosophical notion “We think we have knowledge when we know the cause, and there are four causes: (1) the definable form, (2) an antecedent which necessitates a consequent, (3) the efficient cause, (4) the final cause”
Aristotle (384-322 BC). Posterior Analytics Book II, Chapter 11, 94a, [20] in Gaither and Cavazos-Gaither (2000)
Epistemological notion One can only understand the essence of things when one knows their origin and development.
Oparin, A.I. Life: Its Nature, Origin and Development. Chap-ter I (p. 37) in Gaither and Cavazos-Gaither (2000)
“We should have to represent the tree of knowledge as springing from countless roots which grow up into the air rather than down, and which ultimately, high up, tend to unite into one common stem”
Popper, Karl R. Objective Knowledge Chapter 7 (pp. 262-3) in Gaither and Cavazos-Gaither (2000)
“Science is organized knowledge …” Spencer, Herbert. Education. Chapter II (p. 119) in Gaither and Cavazos-Gaither (2000)
Knowledge in a context “People who confuse science with technology tend to become confused about limits … they imagine that new knowledge always means new know-how; some even imagine that knowing everything would let us do anything”
Drexler, K. Eric. Engines of Cre-ation. Chapter 10 (p. 148) in Gaither and Cavazos-Gaither (2000)
“subjective and valuable information that has been validated and that has been organized into a model (mental model); used to make sense of our world; typically originates from accumulated experience; incorporate perceptions, beliefs, and values”
Dalkir (2005, p. 336)
“The result of human experience and reflection based on a set of beliefs and residing as fictive objects in people’s minds”.
Gardoni (2005, p. 56)
“To construct a model of design knowledge as a structured system of the theoretical and conceptual elements preceding the activity of design ... Through objects, artifacts, equipment, and building design can also con-tribute to the outline of a non-material culture that will be more in accord-ance with principles pertaining to life quality and human well-being”
Jiménez-Narváez (2000, p. 8)
1.1.4 Knowledge Production
In general terms, knowledge activities could be classified under knowledge production and
knowledge acquisition or transmission (Dalkir, 2012; Tödtling, Lehner and Kaufmann, 2009;
9
Wallace, 2007). Knowledge production refers to the proposition of an idea that should be
evaluated to solve a specific problem. Philosophically, the methods for knowledge produc-
tion are models of scientific research, such as hypothetic-deductive, inductive, and abductive
reasoning models. Knowledge acquisition or transmission implies other cognitive activities,
such as perception, reasoning, learning, communication, experience, memory, and witness-
ing. Finally, knowledge is defined depending on its close relation with the context of the
people who work with or who create with it. Also, knowledge can comprise the terms “ap-
proach, method, practice, or strategy” (Sage, 2003). This practical aspect of knowledge ena-
bles us to proceed with an active approach to knowledge production, in the sense that
“knowledge responds to questions that relate to “how”.” It is sometimes desirable to isolate
wisdom as an even higher-level construct that represents insights, prototypes or models, or
principles which would be responsive to questions concerning “why”. If this distinction is not
made, knowledge is expected to respond to “why” questions as well as to those relating to
“how” (ibid). This particular aspect of knowledge is of special interest in our research, as
presented in the following section; we briefly explain this practical incidence on the creative
production of ideas.
1.2 Knowledge objects in design process
In design theory, there are models that explain a cognitive design space formed by
knowledge objects or “cognitive artifacts” related to internal and external representations
(Visser, 2006). For Rittel (1971), besides skills and judgment capabilities, there are two kinds
of knowledge objects: “Factual knowledge and Knowledge of problem” (p.16). In the ap-
proach by Simon (1979) to information systems, the knowledge stored could be transformed
by the expert, and the associated strategies into “perceptual clues”, “semantically rich do-
mains” and “production systems” (p. 367). In a more pragmatic approach, MacLean et al.
(1991) proposed three objects: Questions, Opinions and Criteria, as a result of design interac-
tion. This model, known as “QOC”, describes an argumentative activity which is specific to a
“Design Rationale”. This design rationale model was proposed by Kunz and Rittel (1970) to

10
establish the need for an “Issue-Based Information System” that supports the following four
categories of information exchange during the resolution of a design problem:
- “[... interactions] between the participants (opinions, expertise, reference to previous questions and decisions, similar questions, etc.)
- [... interactions] with experts about specific questions - Information from documentation systems (for literature support of a position,
for factual reference, etc.) - In the case of dependent cooperatives: with the client or decision maker (direc-
tives, quest for decisions, reports, etc.)” (Kunz and Rittel, 1970, p. 2)
In the context of creative problem solving, introducing new ideas always involves changes,
not only for the proposition of the solution, but even for the ways in which a design team
works. Usually, the resolution of conflicts involves problem solving strategies and teamwork.
Complex problems, also called Wicked Problems or Planning Problems (Rittel and Webber,
1973) or Ill-defined or Ill-structured problems (Simon, 1973), imply active interaction
among those involved in problem resolution (users, stakeholders, suppliers, distributors). The
complexity of the problem depends on the socio-technical dimension, the size, and the nature
of the community concerned, as well as the tools, devices or any technological infrastructure
available in the community. Also, creative-complex problems represent the cognitive context
in which the participants find creative inspiration (De Michelis, 1997; Sternberg, Kaufman
and Pretz, 2002).
For Rittel and Webber (1973) or Simon (1973), the design problem is resolved in an interac-
tive cycle until achievement of a “satisfactory response” to the problem, but is neither the
only solution nor the exact one. This knowledge cycle in a design process can be synthesized
in six units that have to be exchanged:
1) Problem definition: abstraction of information to define the new product/new service
2) Information input: sharing needs, expectations, dreams, insights around the problem
3) Idea proposal: possible ideas that could solve the problem
4) Defining requirements: defining the criteria based on initial inputs
5) Idea elaboration: representation of ideas with details to be realized in a real situation
6) Interactive evaluation: each new element added is assessed to satisfy each criterion
11
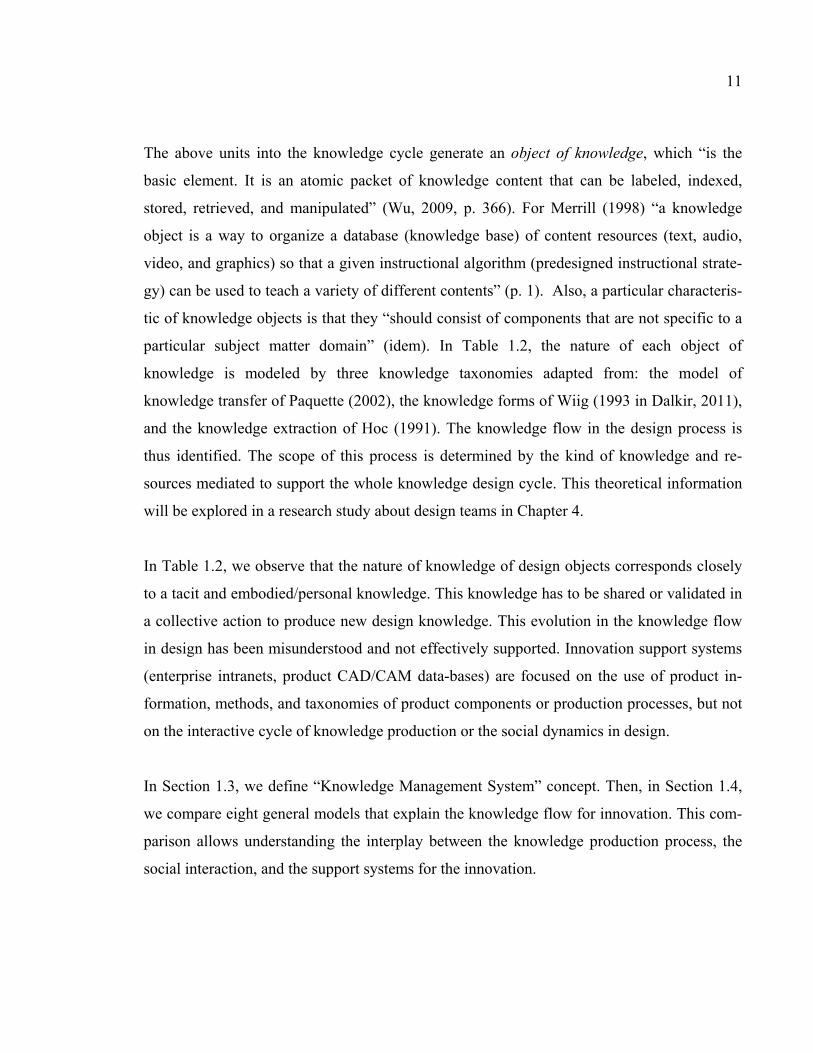
The above units into the knowledge cycle generate an object of knowledge, which “is the
basic element. It is an atomic packet of knowledge content that can be labeled, indexed,
stored, retrieved, and manipulated” (Wu, 2009, p. 366). For Merrill (1998) “a knowledge
object is a way to organize a database (knowledge base) of content resources (text, audio,
video, and graphics) so that a given instructional algorithm (predesigned instructional strate-
gy) can be used to teach a variety of different contents” (p. 1). Also, a particular characteris-
tic of knowledge objects is that they “should consist of components that are not specific to a
particular subject matter domain” (idem). In Table 1.2, the nature of each object of
knowledge is modeled by three knowledge taxonomies adapted from: the model of
knowledge transfer of Paquette (2002), the knowledge forms of Wiig (1993 in Dalkir, 2011),
and the knowledge extraction of Hoc (1991). The knowledge flow in the design process is
thus identified. The scope of this process is determined by the kind of knowledge and re-
sources mediated to support the whole knowledge design cycle. This theoretical information
will be explored in a research study about design teams in Chapter 4.
In Table 1.2, we observe that the nature of knowledge of design objects corresponds closely
to a tacit and embodied/personal knowledge. This knowledge has to be shared or validated in
a collective action to produce new design knowledge. This evolution in the knowledge flow
in design has been misunderstood and not effectively supported. Innovation support systems
(enterprise intranets, product CAD/CAM data-bases) are focused on the use of product in-
formation, methods, and taxonomies of product components or production processes, but not
on the interactive cycle of knowledge production or the social dynamics in design.
In Section 1.3, we define “Knowledge Management System” concept. Then, in Section 1.4,
we compare eight general models that explain the knowledge flow for innovation. This com-
parison allows understanding the interplay between the knowledge production process, the
social interaction, and the support systems for the innovation.
12
Table 1.2 Knowledge Objects in a Design process
Knowledge Object
Models of knowledge classification
Knowledge system (Paquette, 2002)
Form of knowledge (Wiig, 1993, cited by Dal-kir, 2011, p. 81)
Extraction of knowledge (Hoc, 1991)
Social in-teraction
Procedural activity
1. Information inputs: needs, expectations, dreams
Declarative Factual / Expec-tational
Declarative Public, Col-lective
Iterative (external and internal knowledge)
2. Problem definition: abstraction of infor-mation to define the new product
Procedural Relational principles
Conceptual Conception situation
Collective – Consensus and discus-sion
Parallel Internal reflection and abstrac-tion –
3. Ideas proposal: possible ideas that could solve the prob-lem
Conceptual knowledge
Conceptual Anticipation Personal Iterative
4. Defining require-ments: criteria defini-tion based on initial inputs
Prescriptive knowledge
Methodological Domain knowledge
Collective Sequential
5. Idea elaboration: representation of ide-as with details to be realized in a real situ-ation
Declarative knowledge
Factual Anticipation Personal Sequential
6. Interactive evalua-tion: each new ele-ment added is as-sessed to accomplish with all criteria
Prescriptive knowledge
Methodological Domain knowledge
Collective Iterative
1.3 Knowledge Management Design System
A Knowledge Management System (KMS) is defined as the set of technologies used to de-
velop an activity. A KMS often relies “on groupware technologies, which facilitate the ex-
change of organizational information, but emphasize identifying knowledge sources,
knowledge analysis, and managing the flow of knowledge within an organization - all the

13
while providing access to knowledge stores. A system or tool that manages the sum of all
knowledge within the organization as its “intellectual assets” (Dalkir, 2012, p. 469). Within
the framework of this thesis, the Knowledge Management System corresponds to the socio-
technological system that creative teams have to put in place to obtain knowledge resources
to generate ideas and sharing among teammates and with their partners. Modeling the KMS
of the design process is a main scope of this thesis; it will be described later on Chapter 5.
1.4 Knowledge production in an innovation context
The knowledge production model or method has received increased interest in recent years.
This is due not only to the description of the knowledge production process, but also to the
increased importance of innovation activities for academia and industry alike. In a context of
innovation, knowledge production and management requires an extended analysis to answer
the following question: In what sense does the production of knowledge generate innovation?
In the context of innovation, several models have been proposed to define the importance of
knowledge production in the innovation process. In the following sections, representative
models or frameworks of new collective knowledge production in a socio-technological sys-
tem are presented. We will emphasize the characteristics and interactions generated by inter-
active dynamics when knowledge is produced collectively.
1.4.1 Innovation as Knowledge production by Amin & Cohendet (2004)
Innovation “can be regarded as the main outcome of knowledge production” (Amin and
Cohendet, 2004, p. 15). Moreover, innovation is the process of introduction of a new product
or a new process on the market, and for that reason, the production of knowledge can occur
in a social, contextual, and interactive process, where the knowledge cannot be considered
separate from its owner or without temporal or spatial location (ibid, p. 23). The knowledge
consolidation process includes three stages: “design of models, languages and messages”
(idem). The first two aspects, models and languages, have high fixed costs. The final aspect,
messages, requires agents responsible for operating the movement of knowledge; in this case,

14
costs are marginal if messages are reproducible, if the message is new, the costs will be high-
er (ibid, p. 21).
1.4.2 Knowledge production by Nonaka & Takeuchi (1995)
“The organization cannot create knowledge on its own without the initiative of the individual and the interaction that takes place within the group. Knowledge can be amplified or crystallized at the group level through dia-logue, discussion, experience sharing, and observation” (Nonaka and Takeuchi, 1995, p. 13).
Nonaka et al. (1997) studied the process by which Japanese managers produce new
knowledge. They describe three characteristics in the production of knowledge: 1) the use of
metaphors and analogies: “people use with confidence the figurative and symbolic language
to express what is hardly expressible” (p. 30, free translation); 2) the dissemination and shar-
ing of knowledge in the organization: “the new knowledge is always initiated by an individu-
al and this individual knowledge is transformed into organizational knowledge, which can be
valued by the company as a whole” (p.31); 3) under certain conditions, depending on the or-
ganizational communication processes, new knowledge may be presented in a redundant or
ambiguous manner. Ambiguity “may sometimes be useful, not only as a source providing a
new sense of direction, but also as a source of meaning, alternative and new ways of think-
ing” (p.32). Redundancy helps create a “common cognitive framework” among employees,
and therefore facilitates the transfer of tacit knowledge. “When members of the organization
share overlapping information, someone can make sense when others try to articulate the
knowledge” (p.32).
For Nonaka and Takeuchi, the collective knowledge production process is a creative and a
cognitive process that continues as team members “think of the similarities among concepts
and feel an imbalance, inconsistency, or contradiction in their associations, thus often leading
to the discovery of new meaning or even to the formation of a new paradigm” (1995, p. 67).
The iterative and cyclical process of knowledge production occurs in four phases: “Socializa-
tion, Externalization, Combination and Internalization” (SECI Model) (p.83).
15
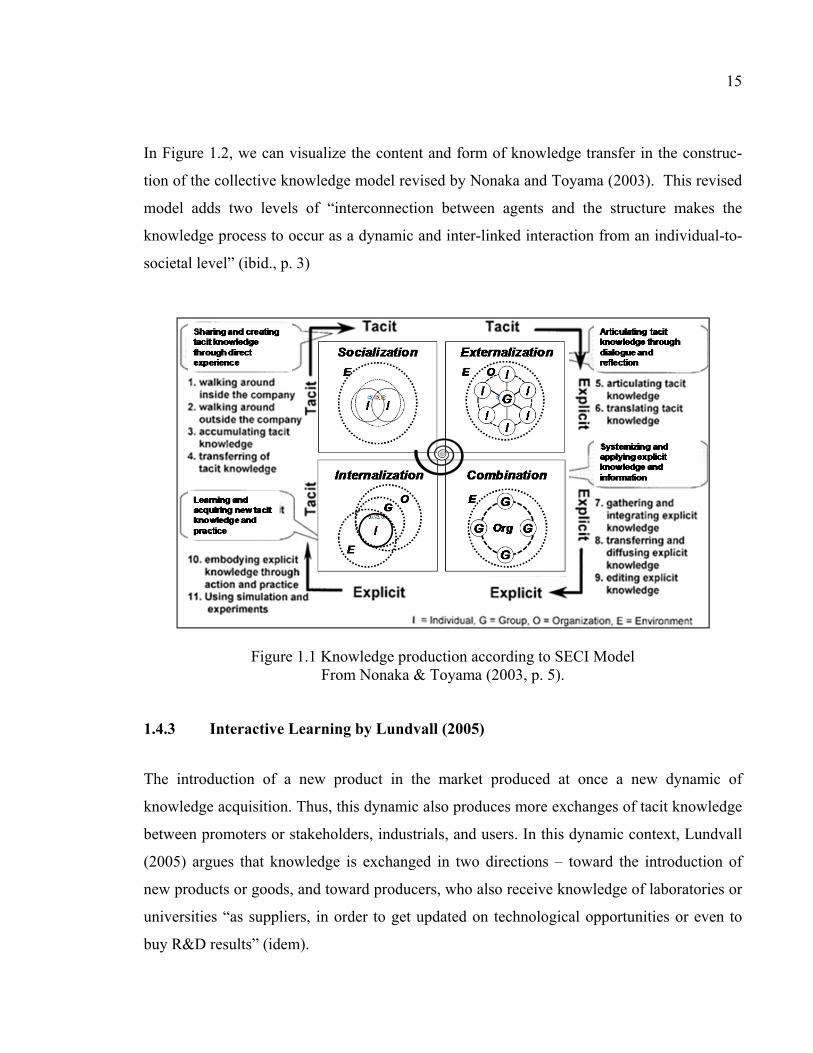
In Figure 1.2, we can visualize the content and form of knowledge transfer in the construc-
tion of the collective knowledge model revised by Nonaka and Toyama (2003). This revised
model adds two levels of “interconnection between agents and the structure makes the
knowledge process to occur as a dynamic and inter-linked interaction from an individual-to-
societal level” (ibid., p. 3)
Figure 1.1 Knowledge production according to SECI Model From Nonaka & Toyama (2003, p. 5).
1.4.3 Interactive Learning by Lundvall (2005)
The introduction of a new product in the market produced at once a new dynamic of
knowledge acquisition. Thus, this dynamic also produces more exchanges of tacit knowledge
between promoters or stakeholders, industrials, and users. In this dynamic context, Lundvall
(2005) argues that knowledge is exchanged in two directions – toward the introduction of
new products or goods, and toward producers, who also receive knowledge of laboratories or
universities “as suppliers, in order to get updated on technological opportunities or even to
buy R&D results” (idem).
16
This dynamic is defined by Lundvall as “interactive learning”. This kind of learning defines a
bidirectional interaction that demonstrates a creative collaboration. Collaboration must in-
volve all participants in an innovation dynamic. Lundvall (2005) argues that the transaction
costs of such kinds of collaboration are reduced for the transparency of exchanges between
actors as “economic agents”. Also, this collaboration is beneficial for the use of Information
and Communication Technologies, because ICT generate a new communication scenario
among designers, producers and users of technology. In this scenario, a closer, fairer and
more sustainable relationship will be set (ibid). We therefore ask the question: what is the
role of ICT in terms of enhancing collaboration for innovative enterprises? We will respond
to this question in Section 1.5, which introduces the role of ICT for collaborative processes.
1.4.4 Systematic approach of innovation by Esser et al. (1996)
Esser, Hillebrand, Messner & Meyer-Stamer (1996) proposed a model based on a systemic
competitiveness. In this approach, innovation is driven by knowledge flow and the collabora-
tion links between enterprise stakeholders and society at different levels. A product of design
is the result of the system dynamics as seen in Table 1.3. This dynamic can be observed in
two scenarios. In the first one, the creative process is led by R&D-intensive enterprises. In
the second, R&D enterprises provide new knowledge through the introduction of new prod-
uct ideas for manufacturing enterprises. For Esser et al. (1996), there are four levels related to
the innovation dynamics:
1) Micro-level, i.e., the types of communications used to produce knowledge and ideas
from these companies.
2) Meso level at which we review global enterprise needs, especially in relation to their
networking and the collaboration activities.
3) Meta structural, more based in the cognitive aspects and the professional skills and
competencies crucial to effective inter-firm collaboration.
4) Macro level based in how the macro policy affects the inner innovation. In our case,
Canada’s National System of Innovation. This level is outside of the conceptual lim-
its of this thesis, mainly because they are well documented and the proposed macro-

17
system is homogeneous for all developed countries that subscribe to the OECD inno-
vation implementation guidelines and policies.
Table 1.3 Description of the systemic approach to innovation Adapted from Esser et al. (1996), Láscaris-Comneno (2002), Jimenez-Narváez (2005), and
Meyer-Stamer (2005)
Level Participants or managers
Definition (Meyer-Stamer, 2005, pp. 29-30) Conditions Functions
Micro Enterprise
“The competitiveness of firms is strengthened by integrating them in technological networks (with other firms and research and tech-nology institutions).”
Horizontal relation-ships. Individual in process of perma-nent learning.
Knowledge gen-eration and as-similation
Meso Networking
“Technology policy aims above all in the direction of a broad diffusion of new technical processes and organizational concepts and in this way encourages a continuous indus-trial modernization process”.
Grouping for knowledge produc-tion in an industrial sector or cluster
Meta
Individual - cog-nition and behav-ior General idiosyn-crasy
“Socio-cultural factors and shared values. These are, for ex-ample, essential in determining whether in a society the develop-ment of entrepreneurial dynamics are stimulated or discouraged.”
Creative societal activities and social regulation
Creating social capital empower-ing the other lev-els
Macro The State and policy control
“Trade policy encourages an active integration into the world market.”
Definition of poli-cies and infrastruc-ture for innovation
Legislative struc-ture for the na-tional innovation system
1.4.5 Creative Zone by Amesse & Cohendet (2001)
Generally speaking, knowledge transfer can also be defined by a model of collaboration and
assistance to enterprise providers. In this case, Amesse & Cohendet (2001) explain that the
collaboration relationship helps improve the quality of products in different ways, and that
“the firm provides assistance to its suppliers not only in the areas of quality, cost reduction,
factory layout and inventory management, but also in terms of increasing technological com-
petencies and research facilities” (p. 1470).

18
Finally, this constant sharing dynamics produces a “creative zone”, in which “[…] creative
ideas are essentially transferred through multiple functional interfaces (manufacturing to
manufacturing, engineering to engineering, etc.)” (idem). Amesse & Cohendet (2001) define
this creative zone as the where the ideas that begin the process of shared knowledge and
technology transfer are born. This zone is the particular context in which engineering prob-
lems occur. This social dynamic is supported by three aspects: creative thinking, reasoning,
(ibid), and knowledge management (Xu et al., 2011).
Amesse & Cohendet (2001) propose some necessary factors that facilitate collaboration in
this creative area:
- Development of benchmarking team capabilities
- Investment in the sharing of knowledge between the firm’s routines
- Regular socialization
- Acquisitions and trade with competing firms.
Activities in the creative zone have a “strong collective dimension”, building “common
knowledge” (Cohendet and Meyer-Krahmer, 2001). Hayek (1975 cited by Cohendet &
Meyer-Krahmer, 2001) talks of “[…] socially the dispersed forms of individual knowledge”.
These authors highlight the notion that knowledge production needs a collective construction
process based on individual inputs. “Social processes contribute to shaping the way
knowledge is produced and circulates. In particular, the codification process takes place with-
in specific communities, where the models, languages and messages are built by agents shar-
ing a common understanding” (ibid, p. 1566).
Following in the next subsections, we present two business models related with the new vi-
sion of innovation. These models underline the fact that enterprises requiring the interaction
among their own creative resources and the external context to increase the probabilities of
achieving an innovation.

19
1.4.6 Collective Invention and Open Innovation
The concept of open innovation is not new. In the sixties, Allen (1979) discovered how the
market includes elements to push up the challenge at different levels. Allen (1979) calls that
phenomenon “Collective invention”, in the sense of all involved participants in an industrial
sector influencing the introduction of a challenge or the design of a new product develop-
ment. This model corresponds to a social comprehension of the introduction of a challenge.
Similarly, Chesbrough (2006) introduces “the Open Innovation” concept. His proposal is
more of a “business model” because the innovation phenomenon opens doors to direct the
market and the enterprise’s production conditions. Chesbrough (2006) mentions that a busi-
ness model has two functions: it “creates value and captures a portion of that value” (p. 3).
These functions are reflected in an open model, where we find different conditions of the
closed model (inside the R&D process) when the enterprise works alone in the innovation
process; between the conditions, “open models create value by leveraging many more ideas,
due to their inclusion of a variety of external concepts” (idem). Also, in an Open innovation
model, “where useful knowledge is widespread, there are many companies with many poten-
tial ways of using new technology, and many potential technologies that might be utilized in
a company’s business model” (ibid, p. 55).
In the Chesbrough approach, ideas are not well developed for external reasons to the enter-
prise or market. Sometimes, the intermediate markets2 do not have any potential economic
interest in the development of a new product, or the industrial sector is not efficient in the
introduction of new technologies. These external conditions can be surpassed, becoming
more “open” to new ideas coming from the market. In other cases, the companies “deploy
certain internal technologies and commercialize them, while leaving a larger set of internal
ideas and technologies unutilized” (ibid, p. 26). The unused ideas that are inside and outside
2 Ashish Arora and his colleagues (in Chesbrough, 2006) describe as ‘intermediate markets” or markets of in-novation, “a market that emerges after the creation of a new technology, before that technology has been sold. In this intermediate market, ideas and technologies are developed by sellers and sold by consumers” (p. 55)
20
the enterprise could be an important source of innovation. For the outside-inside direction,
the enterprise can directly observe market needs, and for the inside-outside direction, unused
ideas also “will generate new knowledge about the market and technical opportunities –
which would never emerge if these ideas were kept bottled up inside the firm” (idem).
1.4.7 Co-creation of Value through Global Networks by Prahalad & Krishnan (2008)
For Prahalad and Krishnan (2008), innovation today is possible, and can lead to a fundamen-
tal transformation in the way business is done. Presently, ICTs have changed the nature of
value creation in a new product or in a new service, especially by “digitalization, ubiquitous
connectivity and globalization” (Ibid, p. 12). In contrast with Ford’s “T Model”, where con-
sumers were “treated as an undifferentiated group”, the Prahalad and Krishnan proposal fol-
lows the N=1 and R=G model of value creation. In this model, new ICTs allow the creation
of a “unique, personalized consumer experience. [...] The focus is on the centrality of the in-
dividual,” where N=1 (one consumer experience at a time) “even if [an enterprise] serves 100
million consumers” (p. 11). This is possible because ICTs enable access to a wide variety of
resources, a “global ecosystem,” since “no firm is big enough in scope and size to satisfy the
experience of one consumer at a time” (idem). In this second statement, “the focus is on ac-
cess to resources, not ownership of resources”, where R=G (resources from multiple ven-
dors, and often from around the globe) (idem).
N=1 and R=G
Co-creation Value
(1.1)
This new relationship between consumer experience and resources overcomes the traditional
model of selling products, and shifts to an “ongoing relationship”, based on continuous feed-
back between the consumer and the enterprise. Innovation is produced by introducing new
products or new services using detailed data obtained from individual experience and intro-
ducing this data into the research and development process. In other cases, the new service

21
adapted for one consumer aggregates a new value for others, and so this process generates a
value co-creation cycle.
1.5 Innovation theoretical models revisited
In the preceding subsections, we considered eight innovation models to observe the critical
issues that can be summed up to define an innovative context. These issues are summarized
in Table 1.4, to establishing complementary activities related to collaboration, social interac-
tion among participants and the influence of ICT on the process. Indeed, the models are pre-
sented separately; they illustrate how those innovation activities “occur through the daily in-
teractions and practices distributed communities” (Amin and Cohendet, 2004, p. 73). While
for Nonaka & Takeuchi (1995), the knowledge production is obtained by the socialization
from tacit to explicit knowledge (SECI model), for Lundvall, Esser et al., and Amesse & Co-
hendet, it is the social interaction that produces the interactive dynamic of innovation. In the
case of Open Innovation, the social interaction increases the possibility of innovating
(Chesbrough, 2006). Prahalad and Krishnan (2008) aggregate another dimension based on
the use of global resources, especially ICTs that allow the exchange of knowledge among
consumers and firms. For today’s enterprises, it is not important to own resources, it is more
important to have access to the knowledge and the experience of users.
As shown in Table 1.4, the analysis of the models shows other factors supporting knowledge
production and the introduction of new ideas. First, all models reveal how the innovation
process is a social activity with a strong collaboration among several actors, as Cohendet and
Meyer-Krahmer (2001) mentioned as “strong collective dimension”, collaboration makes
possible building a cognitive space (Creative Zone of Amesse and Cohendet, 2001). Conse-
quently, in the second factor: social interaction, the ideas production process requires social
dynamics based on strategies and methods that intentionally drive the individual process to a
collective purpose, as the Open Innovation model proposed by Chesbourgh (2006), in which
the ideas flow in a new social dynamic building new relations between technological agents.
This interaction demonstrates an advantageous way to introduce ideas into technology and
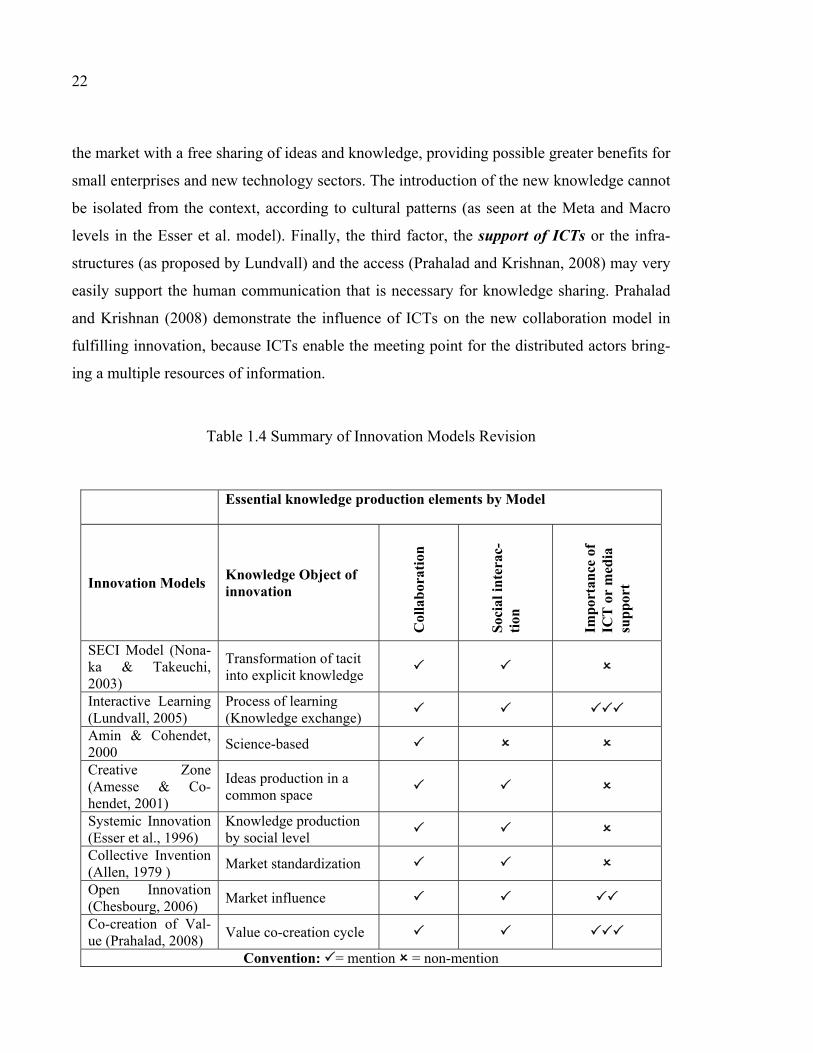
22
the market with a free sharing of ideas and knowledge, providing possible greater benefits for
small enterprises and new technology sectors. The introduction of the new knowledge cannot
be isolated from the context, according to cultural patterns (as seen at the Meta and Macro
levels in the Esser et al. model). Finally, the third factor, the support of ICTs or the infra-
structures (as proposed by Lundvall) and the access (Prahalad and Krishnan, 2008) may very
easily support the human communication that is necessary for knowledge sharing. Prahalad
and Krishnan (2008) demonstrate the influence of ICTs on the new collaboration model in
fulfilling innovation, because ICTs enable the meeting point for the distributed actors bring-
ing a multiple resources of information.
Table 1.4 Summary of Innovation Models Revision
Essential knowledge production elements by Model
Innovation Models Knowledge Object of innovation
Col
lab
orat
ion
Soc
ial i
nte
rac-
tion
Imp
orta
nce
of
ICT
or
med
ia
sup
por
t
SECI Model (Nona-ka & Takeuchi, 2003)
Transformation of tacit into explicit knowledge
Interactive Learning (Lundvall, 2005)
Process of learning (Knowledge exchange)
Amin & Cohendet, 2000
Science-based
Creative Zone (Amesse & Co-hendet, 2001)
Ideas production in a common space
Systemic Innovation (Esser et al., 1996)
Knowledge production by social level
Collective Invention (Allen, 1979 )
Market standardization
Open Innovation (Chesbourg, 2006)
Market influence
Co-creation of Val-ue (Prahalad, 2008)
Value co-creation cycle
Convention: = mention = non-mention

23
1.6 Creative Collaboration in early design stages: ideas and knowledge sharing
Now that we have completed our review of innovation models, we introduce the term crea-
tive collaboration. Collaboration is the core focus of the teamwork. A collaborative task is
the result of sharing all the available resources to end a collective task, and often, “the task is
only achievable when the collective resources are assembled. Contributions to the work are
negotiated and mediated through communications and sharing of knowledge” (Lang,
Dickinson and Buchal, 2002, p. 90). The concept of collaboration is very broad; its definition
depends on the context of work with semantic interpretations (Balmisse, 2002, p. 186).
Termium Plus (Bureau Translation Canada, 2011), presents the words cooperation, collabo-
ration, partnership and association as synonymous. Collaboration means: “the agreement
between two or more parties, which have agreed to work together in the pursuit of objectives
shared or compatible, agreement in which there are: sharing of powers and responsibilities
(for example, for the provision of programs and services, the realization of data actions or
policy); joint investment of resources (time, work, funding, equipment, expertise, infor-
mation); shared responsibilities and risks; and, ideally, the common benefits” (idem). Talk-
ing about collaboration, there is no significant difference between teamwork and workgroup
activities. Collaboration is “an activity where a broad task is achieved by a team” (Lang,
Dickinson and Buchal, 2002, p. 90). Thus, Lang and others point out that effective collabora-
tion requires harmony among several elements: “cognitive synchronization/reconciliation,
developing shared meaning, developing shared memories, negotiation, communication of
data, knowledge, information, planning of activities, tasks, methodologies, management of
tasks” (idem). The collaboration could be described by two aspects: the characteristics of
their activities, particularly the distribution among agents and the needed support that is ob-
ject, often referred as –eCollaboration, these two definitions are described as following:
1.6.1 Distributed creative collaboration
In the innovation process, the need for collective interaction to resolve complex problems is
evident. A design team works on finding a solution for a complex problem by sharing ideas,
discussions, experiences and reflections. However, what exactly is creative collaboration?

24
We argue that the answer can be defined in two directions: 1) the concept of ideas sharing
among teammates (when one produces an idea to communicate to another one) and 2) the
whole process of sharing with everyone, collectively, such as the concept outlined in innova-
tion models centered on the collective dynamic of contributions sharing. In the industry, a
R&D team must make forecasts extending to more than 5 to 6 years into the future life cycle
of a new product. They must also integrate new user needs and technological changes. It is a
genuine challenge for organizations to capitalize on these knowledge sources by trying to
predict how the new product will perform in an unknown context. From the social perspec-
tive, the challenge consists in sharing knowledge and interconnecting the people that are im-
agining these future conditions. Although forecasting may appear to be easy, generating the
dynamic to define a new product in a team requires the synchronization of different interests
and points of view among R&D teammates.
Table 1.5 shows the study conducted by Ulrich and Eppinger (2008) on the development of a
new product which demonstrated that product complexity (number of pieces), organization
team size (number of members involved in R&D) and the time of development are all corre-
lated. For a simple new product such as a screwdriver, at least three people are needed in the
in-house team and three on the external R&D team (Ulrich and Eppinger, 2008). In a more
complex product, such as a Boeing 777 aircraft, the internal design team is made up of 6,800
people and the external team and service suppliers consist of up to 10,000 people. We can
deduce that there also exists an interaction between different disciplinary knowledge fields,
and as a result, the contributions of each participant are interconnected. The data of Table 1.5
also shows the relationships between the size of design teams, and variables such as product
complexity, the number of parts and the life cycle of a product, development time, sales life-
time, production investment and the sales price.
1.6.2 eCollaboration: supporting collaboration by ICTs
The term collaboration was disseminated through the use of ICTs on all activities supported
by collaborative digital networks (Terveen and Hill, 1998). Digital collaboration or e-
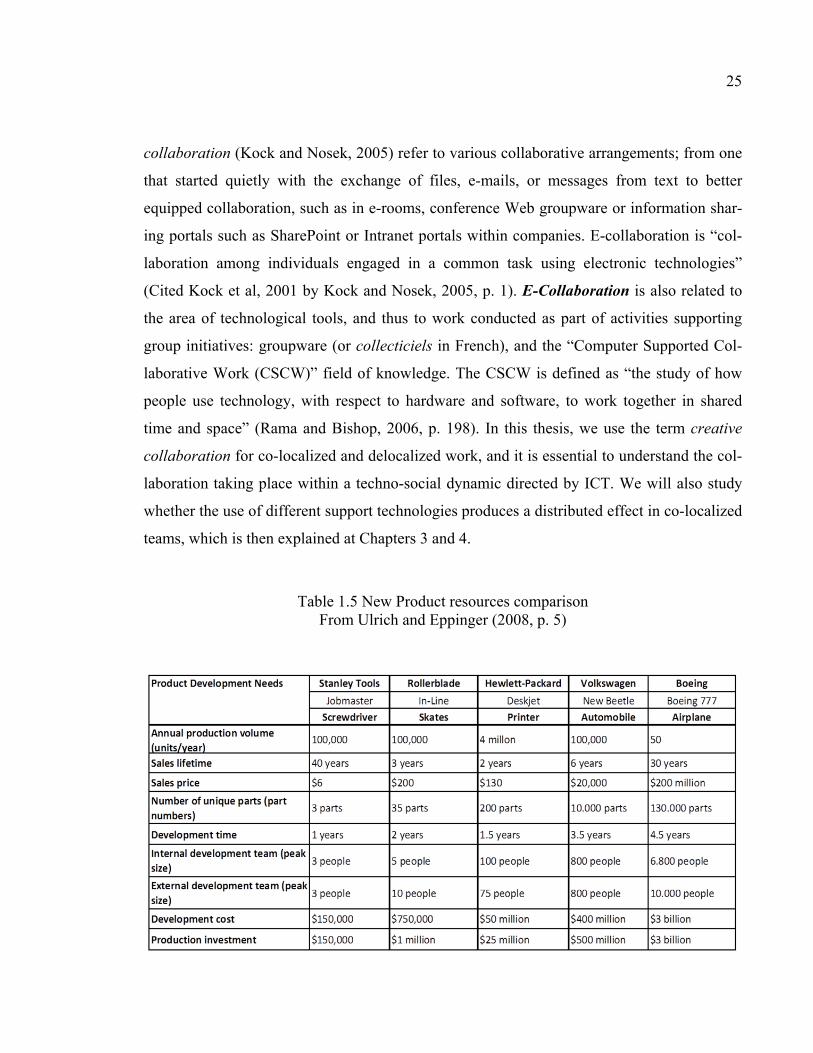
25
collaboration (Kock and Nosek, 2005) refer to various collaborative arrangements; from one
that started quietly with the exchange of files, e-mails, or messages from text to better
equipped collaboration, such as in e-rooms, conference Web groupware or information shar-
ing portals such as SharePoint or Intranet portals within companies. E-collaboration is “col-
laboration among individuals engaged in a common task using electronic technologies”
(Cited Kock et al, 2001 by Kock and Nosek, 2005, p. 1). E-Collaboration is also related to
the area of technological tools, and thus to work conducted as part of activities supporting
group initiatives: groupware (or collecticiels in French), and the “Computer Supported Col-
laborative Work (CSCW)” field of knowledge. The CSCW is defined as “the study of how
people use technology, with respect to hardware and software, to work together in shared
time and space” (Rama and Bishop, 2006, p. 198). In this thesis, we use the term creative
collaboration for co-localized and delocalized work, and it is essential to understand the col-
laboration taking place within a techno-social dynamic directed by ICT. We will also study
whether the use of different support technologies produces a distributed effect in co-localized
teams, which is then explained at Chapters 3 and 4.
Table 1.5 New Product resources comparison From Ulrich and Eppinger (2008, p. 5)

26
1.7 Summary
To summarize, we can view creative collaboration as a distributed process of sharing, and not
just the exchange of an idea or information or knowledge in itself. For the design of the plat-
form, we have to offer a common cognitive space (cognitive field) that allows the team a
confluence in time to share the knowledge objects. In this Chapter was identifying the main
knowledge objects:
1) Information input: needs, expectations, dreams, insights
2) Problem definition: abstraction of information to define the new product/new service
3) Defining requirements: defining the criteria based on initial inputs
4) Idea proposal: possible ideas that could solve the problem
5) Idea elaboration: representation of ideas with details to be realized in a real situation
6) Interactive evaluation: each new element added is assessed to satisfy each criterion
Reviewing the innovation models, we observe the mention of four fundamental activities to
innovation: knowledge production among individual and its environment (Nonaka &
Takeuchi, 1995), limiting a social creative zone (Amesse and Cohendet, 2001) as a common
space to exchange ideas and knowledge, possibility to exchange the new knowledge (ideas)
in an interactive manner (interactive learning of Lundvall, 2005), and the co-creation model
harnessed by the use of ICTs, which makes possible the interaction in real-time of N users in
a large R=resources (Prahalad, 2008). These models enable understand the role of ICT as
support for innovation activities: 1) the expansion of the creative space for R&D teams be-
cause it is easier adding new users and provide more resources of knowledge, and 2) The
time reduction of product conceptualization when the community: experts, market, interact
and provide information during the new product development. Due to its natural characteris-
tics, the creative collaboration is distributed among several actors, in the design of platform;
a prime factor to be considered is how ICT tools could support the creative tasks executed by
the teams, as we will see in Chapter 4. And also, how ICT provide the support for capturing
knowledge needed by the creative teams in a Knowledge Management System (techno-social
system), as we will see in Chapters 5 and 6.

CHAPTER 2
CONTEXT OF COLLABORATIVE NETWORKING FOR INNOVATION AMONG R&D FIRMS: ANALYSIS OF CANADIAN STATISTICS
This chapter presents a descriptive and analytical study of knowledge flow in innovation and
collaboration among innovative R&D enterprises. This analysis focuses on a model of col-
laboration, based in the data mining of the Innovation and Businesses Survey (Statistics
Canada, 2005; 2008; 2010). The firms analyzed were innovator enterprises specialized in
engineering and design in Canada presented in the paper Jiménez-Narvaez and Gardoni
(2012). This data analysis allows the determination of:
- Some characteristics and the context of R&D enterprises
- Flow of knowledge and sources of innovation
- Activities to collaborate (tasks)
This theoretical data was contrasted with the needs of creative teams in 24 hours of innova-
tion (Chapter 4), to propose a model of collaboration, as presented in Chapter 5.
2.1 Nature of R&D teams and enterprises
In Canada, design service enterprises are mostly small- to medium-size businesses. Zeman’s
study (2001) on this sector shows that although they are highly dynamic, these enterprises
have these characteristics:
- Small-medium size (5 employees in average – 87% of total and earn 40% of sector
income)
- Active and flexible – high staff turnover
- High sensitive to the demand of service of economic cycles (depended of project’s
demand)
- One or two autonomous workers – freelancers, consultants.

28
According with “Business, consumer and property services” survey from Statistics Canada
(2010b) they were increased by more of 50% in average, in a growth rate of:
- Engineering services 73% (from 16,330 units in 1999 to 22,249)
- Architectural services 57% (from 7,327 units to 12,722)
- Design services 45% (from 6,774 units to 14,959)
In the dynamic of innovation, R&D enterprises present a behavior “more inventive than in-
novative” (Lonmo, 2007), because R&D teams collaborate with manufacturers or producers
in developing new projects, but R&D teams does not introduce the product into the market.
For this reason, all high technological skills involved depend directly on hiring experts and in
their relationship with the manufacturing sector. Without the expert skills of R&D employ-
ees, the success factors for achieving innovation efforts will not be possible (Work
Foundation, 2007). This expert knowledge and professional integration may also be achieved
involving in a continuous learning process and co-design practices among experts and enter-
prises within their partners (Lundvall, 2005).
2.2 Sources of collaboration for R&D enterprises (Collaborative exchanges)
As Figure 2.1 shows, the innovation based-knowledge network of these enterprises is com-
prised of hired skilled workers, and brings together experts in teams with different skills.
R&D teams are independent and obtain free association, which facilitates knowledge ex-
change for their innovative activities. Further, R&D teams report that the implementation of
ICTs is also a source of innovation (as we will see in this thesis, ICTs do not constitute a
strategy in themselves, but rather, accompany the free sharing of knowledge).
Networking details are shown in Figure 2.2, which presents the percentage summary of the
professional interactions of engineering, industrial design and scientific services, and classify
the importance of information provided by each stakeholder, ranging from high to low signif-
icance. In the figure, we observe mainly collaborators and the actions involved at the internal
and external networking levels; at the internal level, we observe R&D internal staff, sales and
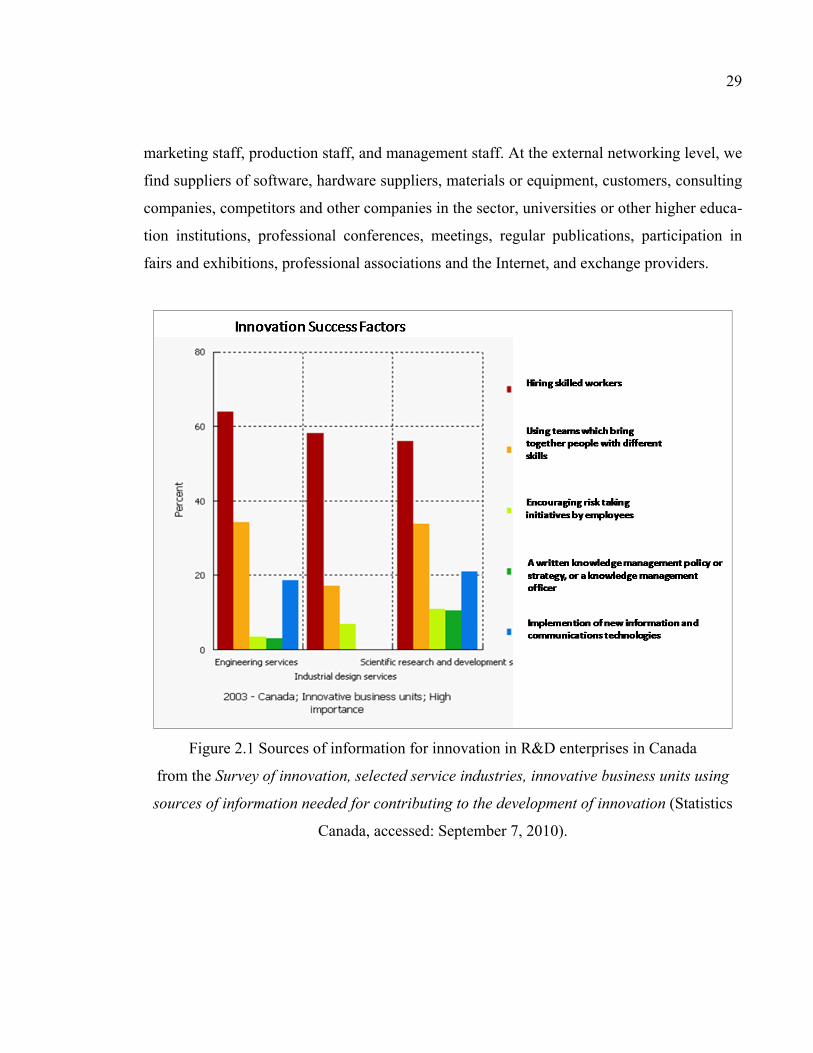
29
marketing staff, production staff, and management staff. At the external networking level, we
find suppliers of software, hardware suppliers, materials or equipment, customers, consulting
companies, competitors and other companies in the sector, universities or other higher educa-
tion institutions, professional conferences, meetings, regular publications, participation in
fairs and exhibitions, professional associations and the Internet, and exchange providers.
Figure 2.1 Sources of information for innovation in R&D enterprises in Canada
from the Survey of innovation, selected service industries, innovative business units using
sources of information needed for contributing to the development of innovation (Statistics
Canada, accessed: September 7, 2010).

30
Figure 2.2 Importance of information sources for innovation activities of R&D SMEs.
Survey of innovation, selected service industries, innovative business units using sources of information needed for suggesting or contributing to the development of innovation (Statis-
tics Canada, accessed: September 7, 2010).
0 10 20 30 40 50 60 70
R&D Staff
Sales and marketing personnel
Production staff
Management staff
Other business units of your business
Suppliers of computer components, software orequipment
Customers and consumers
Consulting firms
Competitors and other enterprises from your industry
Universities or other higher education institutions
Federal governments research Laboratories
Provincial governments Research laboratories
Private research institutions, non-profit
Congress and meetings of professionals orpublications
Fairs and exhibitions
Business Associations
Internet
Other sources
Insid
e Fi
rm, i
nter
nal
com
mun
icat
ion
and
sour
ces o
fR&
DEx
tern
al F
irmUn
iver
sitie
sLa
bora
torie
sIn
form
al N
etw
orki
ng
Degree of importance of information for innovation activities (%)
Very high High Moderated Rather low Low

31
2.2.1 Embedded Knowledge: experts, expert thinking and informal collaborative network
Expert knowledge is the main creative output of R&D enterprises, according to Canadian
statistics and to a report by the Department for Culture, Media and Sport of Great Britain
(Work Foundation, 2007). The expert in a given subject matter or in the R&D domain is a
key player in R&D activities. The English report cited above (ibid) mentions that the main
reason for collaborating with these enterprises is to obtain access to expert thinking. In this
regard, we observe a type of approach to knowledge whose point of departure is based on the
“translation of expert thinking” into a creative output when the expert integrates a change
directly into the products (idem).
Figure 2.3 shows the exchanges needed to achieve innovation. Access to expert thinking is
one of the main reasons for collaborating with these R&D enterprises: on average, 66% of
respondents state that having access to critical expertise as a main reason to collaborate. We
also highlight other reasons behind collaboration, including the sharing of the high costs of
R&D activities (58%), improved access to R&D (54%), development of prototypes (51%),
access to new markets (extension to other localities) (49%), risk sharing (especially in the
case of engineering companies) (37%), access to new distribution channels (26%), and in-
creased scale of operations (20%). In addition, these enterprises generate an “informal net-
working” with their Associations, Internet and business community of knowledge identified
in Figure 2.2, we notice that collaboration activities among experts are indispensable for in-
novation; this illustrates the importance of activities related to the strategic development of
business operations – a model of “shared expertise”, that is, “proprietary knowledge assets
that are exclusively held by knowledge workers and shared in their work or embedded in
technology (Wiig, 2004 cited by Dalkir, 2012, p. 79). Collaboration is the center of
knowledge transfer because it enhances the “collective nature of knowledge production, dis-
tribution and use” (Cohendet and Meyer-Krahmer, 2001, p. 1566). This evidence allows us to
describe that the core process that occurs in knowledge flow design is related to the support
of the sharing of the embedded knowledge of “experts”.

32
Figure 2.3 Average of reasons for collaboration (%) by SMEs in R&D
On the other hand, the type of integration of technical knowledge – operational, tactical, and
strategic activities – involves a complex cycle of negotiation activities (ibid, p. 17). Figure
2.4 shows a description of this knowledge flow process in the immediate environment of
Canadian R&D enterprises. In collaboration networking, information sharing flows informal-
ly between all the system’s actors, and the link between consumers, communities and suppli-
ers is not that obvious. The model of collaboration shows that each project or each idea to
develop had a specific time frame. We would also like to note that perhaps the most im-
portant aspect consists of the skills involved in capturing the knowledge of in-house and out-
side experts. This integration of new knowledge may possibly nourish the evolution of R&D
projects.
0 10 20 30 40 50 60 70 80 90 100 110 120 130 140 150 160 170 180 190 200
Sharing costs
Spreading risk
Accessing research and development
Prototyp developemnt
Scaling-up production process
Accessing critical expertise
Accessing new markets
Accessing new distribution channels
Other reasons
Sharingcosts
Spreadingrisk
Accessingresearch
anddevelopme
nt
Prototypdevelopem
nt
Scaling-upproduction
process
Accessingcritical
expertise
Accessingnew
markets
Accessingnew
distributionchannels
Otherreasons
Engineering 63593443156058113Industrial Design 54255957306257400Scientific 57286952147632277Average 58375451206649263

33
Figure 2.4 Model of collaboration networking between creative R&D teams
2.3 Task flow of Knowledge Sharing: Strategic, Tactical and Operative knowledge
Analyzing collaborative exchanges among R&D teams and their context by the task flow
analysis method (Dalkir, 2012, p. 200) enables us to observe that they are guided by a de-
composition of activities aimed at promoting the innovative collaboration seen in Section 2.1
(Figure 2.2). This exchange is related with three competencies: strategic, tactical and opera-
tional competencies (Anthony, 1965). Recently, Genin, Lamouri and Thomas (2005), in the
French standard AG5115 (Association française de normalisation)., analyzed these compten-
cies, which also are related to the task classification, the client and product relationship, and
the execution time. These task taxonomies are summarized in Table 2.1, in which is present-
ed a proposal of the taxonomy of collaborative activities based on tactical, operational and
strategic collaboration. At the strategic and tactical levels, we find “the skills necessary to
integrate and apply competencies” (Dalkir, 2012, p. 200). We distinguish these activities as
central to trade between R&D teams.
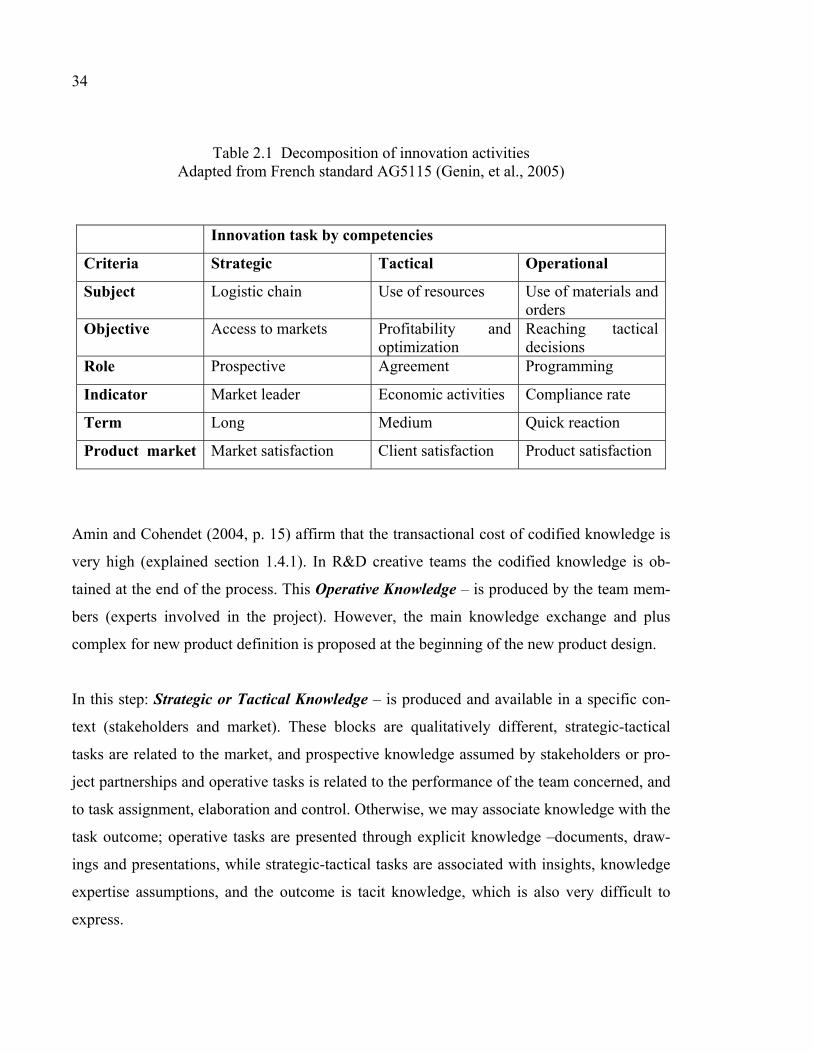
34
Table 2.1 Decomposition of innovation activities Adapted from French standard AG5115 (Genin, et al., 2005)
Innovation task by competencies
Criteria Strategic Tactical Operational
Subject Logistic chain Use of resources Use of materials and orders
Objective Access to markets Profitability and optimization
Reaching tactical decisions
Role Prospective Agreement Programming
Indicator Market leader Economic activities Compliance rate
Term Long Medium Quick reaction
Product market Market satisfaction Client satisfaction Product satisfaction
Amin and Cohendet (2004, p. 15) affirm that the transactional cost of codified knowledge is
very high (explained section 1.4.1). In R&D creative teams the codified knowledge is ob-
tained at the end of the process. This Operative Knowledge – is produced by the team mem-
bers (experts involved in the project). However, the main knowledge exchange and plus
complex for new product definition is proposed at the beginning of the new product design.
In this step: Strategic or Tactical Knowledge – is produced and available in a specific con-
text (stakeholders and market). These blocks are qualitatively different, strategic-tactical
tasks are related to the market, and prospective knowledge assumed by stakeholders or pro-
ject partnerships and operative tasks is related to the performance of the team concerned, and
to task assignment, elaboration and control. Otherwise, we may associate knowledge with the
task outcome; operative tasks are presented through explicit knowledge –documents, draw-
ings and presentations, while strategic-tactical tasks are associated with insights, knowledge
expertise assumptions, and the outcome is tacit knowledge, which is also very difficult to
express.
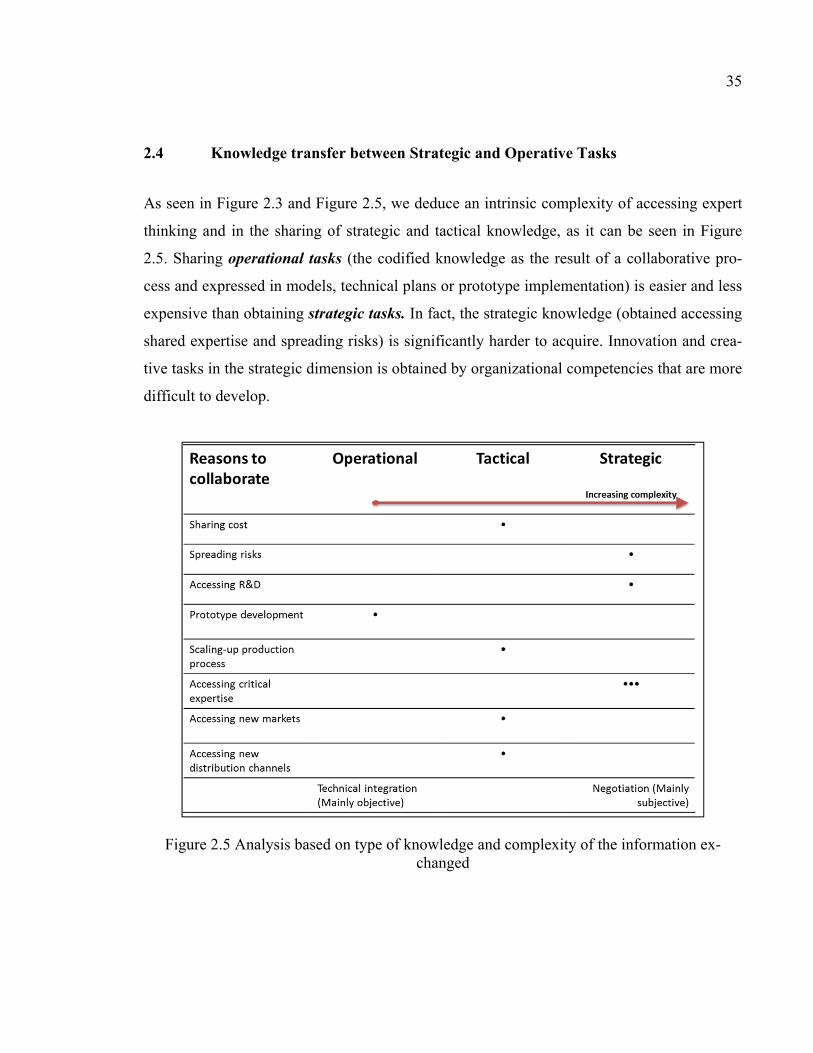
35
2.4 Knowledge transfer between Strategic and Operative Tasks
As seen in Figure 2.3 and Figure 2.5, we deduce an intrinsic complexity of accessing expert
thinking and in the sharing of strategic and tactical knowledge, as it can be seen in Figure
2.5. Sharing operational tasks (the codified knowledge as the result of a collaborative pro-
cess and expressed in models, technical plans or prototype implementation) is easier and less
expensive than obtaining strategic tasks. In fact, the strategic knowledge (obtained accessing
shared expertise and spreading risks) is significantly harder to acquire. Innovation and crea-
tive tasks in the strategic dimension is obtained by organizational competencies that are more
difficult to develop.
Figure 2.5 Analysis based on type of knowledge and complexity of the information ex-changed
36
2.5 Summary
In this Chapter, we analyzed the context of R&D enterprises, particularly their need to obtain
strategic knowledge from the external expertise and from an informal network. This network
is supported by the Internet, association meetings, congresses and fair exhibitions. In innova-
tion activities, we propose the use of an embedded knowledge because knowledge of innova-
tion does not reside solely in books or business databases or research centers. More than any-
thing, the knowledge required by innovation is a part and parcel of the critical expertise that
surrounds the team.
In order to advance in collaborative projects, R&D teams must exchange the strategic
knowledge that is obtained within shared expertise or accessing external expertise, sharing
R&D knowledge of informal networking, and spreading risks among sponsors.
For the design of a collaborative Platform, we have to take into account the free-association
dynamic among R&D team with their external partners. Thus, the platform has to provide a
free-networking structure that enables informal and casual meetings. Also, it is necessary to
support in the earlier process of design, in which R&D teams need strategic knowledge to
conceptualize the new product. This conceptualization has to incorporate the tacit knowledge
among the network (stakeholders, internal staff and external partners) and inside the creative
team, as we will see in the rest of this thesis.

CHAPTER 3
PROBLEM STATEMENT, RESEARCH OBJECTIVES AND METHODOLOGY
This chapter presents the problem statement, the research proposal, and the methodology de-
veloped to design and test the collaborative platform that supports creative teams in R&D
activities. We propose to analyze and test the performance of creative teams during “24
hours of Innovation”, an international competition developed by ESTIA, and that has been
organized each year since 2010 by our research group at École de technologie supérieure.
3.1 Problem-finding background
3.1.1 From tacit knowledge production to codified knowledge
In the Nonaka and Takeuchi (1995) model, new knowledge is obtained by the transformation
of tacit knowledge into explicit/codified knowledge. These authors argue that the
“knowledge encoding” process is important for the transfer of ideas, information and
knowledge within organizations. However, codification is not a natural process for a creative
team because the members exchange strategic knowledge tacitly. Forcing the transformation
of knowledge objects from tacit knowledge into codified knowledge generates problems for
the following reasons:
1) Tacit knowledge is created by cognitive and social dynamics, rather than by an imposed
organizational methodology. Indeed, we cannot impose the sharing of new knowledge in a
codified manner.
2) R&D teams follow a natural exchange of ideas informally; this interaction is rather tacit,
fuzzy, and casual, particularly at early design stages.
3) The encoding process is less efficient when using ICTs that require the capture of data
through forced encoding (typed text, written information or scanned images).
In early design stages, creative teams exchange tacit knowledge for strategic decisions. This
dynamic is continual until the project definition, when ideas are finally explained in the form
38
of codified knowledge. Quick codification is not possible during conceptualization, because
the project becomes more complex when several solutions are proposed at the same time, or
when several members are brought together, and when the research focuses on the most crea-
tive solutions or strategic levels (see Sections 3.3 and 3.4) in the ideas generation process.
Tacit knowledge is more difficult to transfer among team members due to the fact that ideas
have a new content, and have to be explained with analogies or metaphors (Nonaka and
Takeuchi, 1995). On the other hand, tacit knowledge is also difficult to manage because it is
distributed in a “multiplicity of activities that have to be developed in parallel, with various
time delays, which need to be coordinated to lead to valid results; the difficulty in establish-
ing goals and the precise characteristics from the beginning of a project, the goals and the
precise characteristics of the research product, which are sometimes hardly measurable (for
instance, unexpected wrong results could become good research products, which could be
physical or conceptual).” (Gardoni, 2005, p. 137). In the next section, we present the problem
associated with tacit knowledge sharing in detail.
3.1.2 Complexity of dissemination of the content of an idea through tacit knowledge
The content of the needed tacit knowledge to produce a new product is provided by:
1) The value chain of producers and the market: consumer expectations or complaints, dis-
tributors, sales information, and consumer’s services.
2) Trends, forecasts and insights provided by the market or technological specialists. There
should be an advance of more than two years for small products (e.g., electronic consumer
products) and more than five years for larger products such as aircrafts (Ulrich and Eppinger,
2008), which presents difficulties forecasting the knowledge needed (see Table 1.5), and
3) The expert thinking (embedded knowledge) that identifies scientific and technological
sources involved in the new product conceptualization.
For the development of new products, creative teams and partners must integrate the above
aspects to conceptualize the new product. This conceptualization is a social process, also dis-
tributed over a long development period (as seen in Sections 1.6.1 and 2.4). If this variable

39
time anticipation is not supported, the team could lose important information during that
time. Further, there is no available “audit” of the knowledge needed by a team in order to
define knowledge sources. Frappaolo (2006) proposes a “measure” based on the knowledge
needs and knowledge sources effectively used by the team (in our study, a “needs” audit was
realized, and will be presented in the next chapter).
3.1.3 Lack of a knowledge management system for a creative collaboration
In Section 1.2, we mentioned the existence of a Design Rationale Model. However, this
model is not popularly used in design, because it can create tension between two complemen-
tary processes: the creative and structured thinking driving by Rationale Model (Carroll,
2010). The study of Wang, Farooq and Carroll (2010) explains that in some cases, designers
feel that there is no place for creativity activities in a rational cognitive space, and in other
cases, creative methodologies are ignored if the designer has not been introduced to creative
methods previously, during his/her training process. According to Schuster et al. (2007) crea-
tive structured methodologies such as TRIZ and C-K will only be used if they are “embed-
ded” in a professional practice during the designer’s training program. As well, Trépanier
and Gosselin (2007) argue that these methodologies are maintained if they are socially ac-
cepted and practiced within the organizational culture (Trépanier and Gosselin (2007). This
analysis of the knowledge sharing and retrieval cycle in the design process leads us to con-
clude that creative outcomes such as ideas, opinions, and insights constitute tacit knowledge
that has to be captured in a natural manner and induced by organizational culture. In Chapter
5, we will explore the paths that should be used to promote knowledge management activities
among creative teams and their partners.
3.1.4 ICT impact on collaborative ideation process
Regarding the distribution of actors in the ideation process, ICTs become an invaluable re-
source for merging distributed tacit knowledge in an interactive dynamic (Crescent, 2007;
Nielsen, 2012). ICTs allow stakeholders to be brought closer in knowledge sharing. Howev-
er, the optimism accompanying ICT use can add other worries:

40
- The need for a continual learning process owing to the constant innovation of ICT tools,
making it hard to introduce the same groupware or standard software in all enterprises, or-
ganizations and teams (Jiménez and Vargas, 2004)
- The time needed to implement ICTs, especially learning, availability of equipment and in-
frastructure, etc.
- The isolated or lonely behavior of Internet users
- Techno-economic factors (obsolescence due to frequent changes of operating systems, li-
cense expiration, hardware uselessness, etc).
However, countering the above-mentioned drawbacks, DiPietro (2012) argues that ICTs have
a positive impact, especially Cloud-Computing Technologies or Social Media, for collabora-
tion dynamics. Some basic theories of collaboration are based on new user behaviors follow-
ing the implementation of Web 2.03 or Web 3.04. By Web 2.0 collaborative technologies, we
refer to applications that use the Internet more as a social network than as an informative in-
frastructure (Web 1.0 is based on plain text information). The new term Web 3.0 is already in
definition, the new applications or platforms based on Web 3.0 technologies redefining the
use of Internet. For Jiménez-Narváez, Segrera and Gardoni (2013), ICTs aggregate some op-
portunities for the collaborative process: “interconnection, an enhanced knowledge environ-
ment, interactivity, flexibility, storage of information, instantaneity, graphicability and social
3 “Web 2.0 applications have spread rapidly and increased opportunities for working remotely at a dizzying pace. We can link this to the fact that some of them are available free of charge and that they are generally easy to use. In addition, these technologies have features that allow remote collaboration and users in different geo-graphical areas can easily use (data available online, no software to install on the computer, etc.). It is enough to have access to the Internet” (O'Reilly, 2005) 4 The term Web 3.0 is not yet defined with precision. It refers to all technologies that integrate the Semantic Web. Hendler (2009, pp. 111-113) defines Web 3.0 as “Semantic Web technologies integrated into, or power-ing, large-scale Web applications”. Web 3.0 technologies have three common elements: “- Creating tools that allow groups of users to create, share and evolve a new generation of open and interacting social machines, - Creating the underlying architectural principles to guide the design and efficient engineering of new Web in-frastructure components for a new generation of social software, and - Extending the current Web infrastructure to provide mechanisms that make the social properties of infor-mation sharing explicit and that guarantee that the uses of this information conform to the relevant social policy expectations of the users” (Hendler et Berners-Lee, 2010, pp. 156-161).

41
interaction among the individual and collective work” (ibid). However, ICTs also present
some limitations, such as: “redundancy, isolation, loss of connectivity, data obsolesce”
(idem). We would like to highlight other obstacles to collaboration mediated by ICTs:
The constant changes in ICTs exceed the required learning time. The constant evolution of
tools and applications has transformed the Internet into a fruitful place for collaboration.
However, there is a huge difference between the easy utilization of ICT technologies for col-
lective work and a participation in networks, practicing communities, or groupware.
A low participation in large networks. Despite the availability of platforms, most companies
show little use of them for project development, and their effective participation and collabo-
ration is very low (Hill et al., 1992; Terveen and Hill, 1998) and isolated (Nielsen, 2006).
Nielsen (2006) proposes a 100-90-9 “Law of participation inequality” applicable to commu-
nities in networks. This law proposes that for 100 users, 90 observe, 9 contribute from time
to time, and 1 contributes assiduously, the latter generally being the content owner. The con-
sultant Levan (2009) argues that this law of inequality in participation decreases to a 92-7-1
proportion for business networks. Why is the participation rate so low? Nielsen (2006) ex-
plains that the dilution of collaboration depends on “the size of the group, the familiarity be-
tween the members and the interactive or conversational strategies” (ibid), and the organiza-
tion and the methodology used to knit the community tightly. These conditions show that if
the number of participants is high, it will be more difficult to coordinate their interests. We
must therefore create a knowledge management structure to promote the use of the platform
with social strategies for collective sharing, and for the training of future designers to work in
collaborative mode (Benghozi et al., 2002).
Spread utilization of ICT tools without an appropriated personalization. Balmisse (2004b)
mentioned a phenomenon produced with the introduction of a new ICT. On the one hand, a
new ICT is spread quickly, independently of its actual intended use. For example, an organi-
zation may limit knowledge sharing to just Wikis. A Wiki is not appropriate for all project
development stages, because merely implementing one does not resolve project management

42
needs. An ICT should not be transferred while only considering success on the Internet
(Balmisse, 2004a); rather, they must be customized to meet the collaboration needs of each
team, organization, or community. On the other hand, Balmisse (2004b) argues that there is
a lag between the design of groupware and its use. This discrepancy is due mainly to the fact
that ICT design is developed for professional or functional purposes, and not for a natural
collaboration within teams, including temporal collaboration, collaboration by project, or
collaboration by community of practitioners (Balmisse, 2004b, p. 25).
Underutilization of most popular tools like “e-mail, wiki, groupware, co-design, instant
messaging” (idem), or communication tools like Skype, GoogleChat, Talkatone, etc., which
have free versions available for all users. This underutilization generates “a partial use of the
collaborative possibilities” (idem), and generally, these simple tools are replaced by high cost
systems that do not contribute a collaborative value to the team or the community. Conse-
quently, groupware and networks obtained after paying elevated costs respond only partially
to the multitude needs of R&D teams. On the other hand, R&D enterprises implement so-
phisticated groupware or CAD systems to develop products, but this technology does not
resolve their collaborative project communication needs either in the strategic definition.
3.1.5 Impact of ICT on creative collaboration
One specific positive impact of ICTs on creative activities is its ability to facilitate the cap-
ture and the codification of the knowledge produced by team members. However,
“knowledge capture cannot, therefore, be a purely mechanistic “add-on”, because it has to do
with the discovery, organization, and integration of knowledge into the fabric of the organi-
zation” (Dalkir, 2012, p. 99). Consequently, one important problem for creative teams is how
to use ICT effectively to produce ideas. Studies on the use of ICT for the generation of ideas
provide somewhat positive results. Cooper (2000) affirms that “computer-aided and non-
computer tools and techniques can enhance the creativity of groups” (p. 253) because the
team is encouraged to share in a free and transparent flow of information.
43
In this regard, Ocker et al. (1995) , comparing teams that use ICTs with those that do not,
found that the quality of creative solutions is not lower in team supported by ICTs. They
state: “the findings suggest that there is a positive relationship between distributed asynchro-
nous communication and the quality of the solution, as groups in both CC [computer confer-
encing mode] conditions were rated higher than their face-to-face counterparts” (p. 11). This
result is similar to the findings of Paulus (Kohn, Paulus and Choi, 2011; Paulus and Yang,
2000; Paulus et al., 2005; Paulus, Dzindolet and Kohn, 2012). The results indicate how the
use of ICTs for team communication does not change creative behavior (Ocker et al., 1995).
Furthermore, Ocker et al. (1995) demonstrate that teams that use ICTs can attain efficiency
improvements when they “share the knowledge and skills, interact and reformulate appropri-
ate scheduling strategies and interaction that integrates the coordination and effort of each
member” (p. 6). Ocker and Fjermestad (2008) also noted the importance of generating col-
laborative work strategies, because teams that have had significant creative work, are those
which are involved in: “more critical commentary and active debate, hallmarks of a climate
for excellence”. In conclusion, the creative collaboration performance of a team depends
more on how it interacts with others and the teamwork strategies used.
Ocker (2007) and Nemiro (1998) hold that the levels of creative performance and creative
inhibitors are the same for teams with or without ICT support. Major inhibitors to creativity
include remarkable factors such as “member dominance, technical and functional domain
knowledge, focus on external reward, time pressure, downward norm setting, structured
problem solving approach, technical difficulties, lack of a shared understanding, and non-
stimulating team members” (p. 40). For Nemiro (1998), the factors that determine the levels
of creative performance are “freedom in the initiative or proposal of new ideas, the percep-
tion that innovation is a desirable state for the organization, trust and tranquility in participa-
tion, diversity and the encouragement of creative tension, clarity in the definition of goals,
challenges and vision” (pp. 39-41).
However, Nemiro (1998) considers that there are three conditions with a positive impact
when a team uses ICT tools:

44
“a) connection, the elements that need to be in place for a team to develop and maintain identity and a sense of community […Connection involves both task (dedication-commitment), (goal-clarity) and interpersonal (information sharing; personal bond; trust) connections…]; b) raw materials, the basics on which virtual team members can draw in produc-ing creative work; and, c) management and team member skills conducive to creativity [...] Once a con-nection between team members is established, team members need to be sup-plied with sufficient raw materials, both in terms of information, human and technological resources, and time, to accomplish the creative work” (p. 222).
Finally, if there is a good creative dynamic and enough motivation within the team, it will be
reflected positively in an ICT environment. Some of these idea production aspects will be
studied in more detail in Chapters 4 and 8.
3.2 Problem statement
In the early stage of product definition, when creative teams define the initial concept, the
main strategic activities are mostly shared by tacit knowledge. At this stage, the tacit
knowledge is very difficult to capture, because it is distributed among different actors and
information resources. Particularly, knowledge production is “embedded” in expert thinking
and in an informal networking. In addition, the formulation of the initial concept requires the
formulation of a knowledge management system, which is not usually implemented by de-
signers. This strategic process is not well supported by a knowledge management system,
and not even by ICTs. ICTs are also distributed among participants and current ICT tools are
not well-suited to process the tacit knowledge produced.
We propose this research to better understand and support idea and knowledge (creative col-
laboration) exchanges within creative teams in their respective direct context. The aim of this
research is to support the creative teams through the design of a collaborative platform that
allows users to share the tacit knowledge needed for innovative activities. We propose to test
this ICT platform among the creative teams of “Les 24 heures de l’innovation”, where shar-
ing tacit knowledge in the context of creative collaboration is an established need.

45
Summarizing our problem statement, we observe that it is broken down into two dimensions:
Theoretical dimension: Improving a knowledge management system for the exchange of
tacit knowledge to support distributed creative collaboration.
Practical and technological dimension: Developing and testing an ICT platform for creative
teams based on a knowledge management system that supports creative collaboration.
These two dimensions synthesize our problem in a multi-disciplinary research work covering
theoretical and technological issues. In the theoretical dimension, we focus on the improve-
ment of the ICT environment for the exchange of knowledge to support informal exchanges
in the early stages of product development. This dimension raises the importance of cross-
sectional analysis of collaboration conditions through 1) the communication of ideas, 2) the
analysis of the knowledge flow within and outside creative teams, and 3) the strategies re-
quired for acquiring knowledge from the context. The technological dimension will be fo-
cused on the design of specifications for a collaborative platform, to enhance the informal
ideas exchanged among members and its surrounding context. In section 3.4, we define the
objectives of this doctoral research.
3.3 Research question
For our research work, we define the following research question:
How is it possible to support the distributed creative collaboration through a knowledge
management system and a collaborative ICT platform for ideas and knowledge sharing?
3.4 Research objectives
The aim of this thesis is to support the creative teams in the process of conceptualization of a
new innovation-oriented product. Through this thesis, we will seek to:

46
- Determine the needs of creative teams during the conceptualization stage of a new
product;
- Propose a Knowledge Management System (knowledge and tools) that enables the
support of tacit knowledge produced in distributed condition of team members;
- Model a Platform that supports internal creative team’s needs and the external context
for innovation;
- Propose the assessment of the creative collaboration meaning the user experience
testing and the realized task by creative teams on the ICT prototype.
3.5 Methodology
This research follows a “Research-oriented Design” methodology (Dalsgaard, 2010, p. 200),
in which a “design situation”, in our case the design of a collaborative platform, “is em-
ployed as a means of generating insights that will feed into the design of a product” (Idem).
This methodology is also defined as “Research through Design”(Gliner and Morgan, 2000;
Koskinen et al., 2011), in which the “design artifact became design exemplars, providing an
appropriate conduit for research finding” (Zimmerman, Forlizzi and Evenson, 2007, p. 493).
This methodology is particularly useful in the design of Human Computing Interfaces (HCI)
that needs interactive research between technical opportunities and theory model gaps (ibid).
Figure 3.1 presents a general overview of this research that follows the steps:
1. The validation of data collected comparing the theoretical results (Chapter 2) with the
needs and ideals mentioned by 24H teams (Chapter 4).
2. The design of a collaborative platform, combining main collaborative specifications and
ideals reported by creative 24H teams: formalizing the information meaning UML Language
(Chapter 5) and defining the specifications (cahier des charges) in Chapter 6. The modeling
of Platform (ideality aspects) is realized proposing an analysis of state-of-art of existing ICTs
and proposing new functionalities to foster creative collaboration.
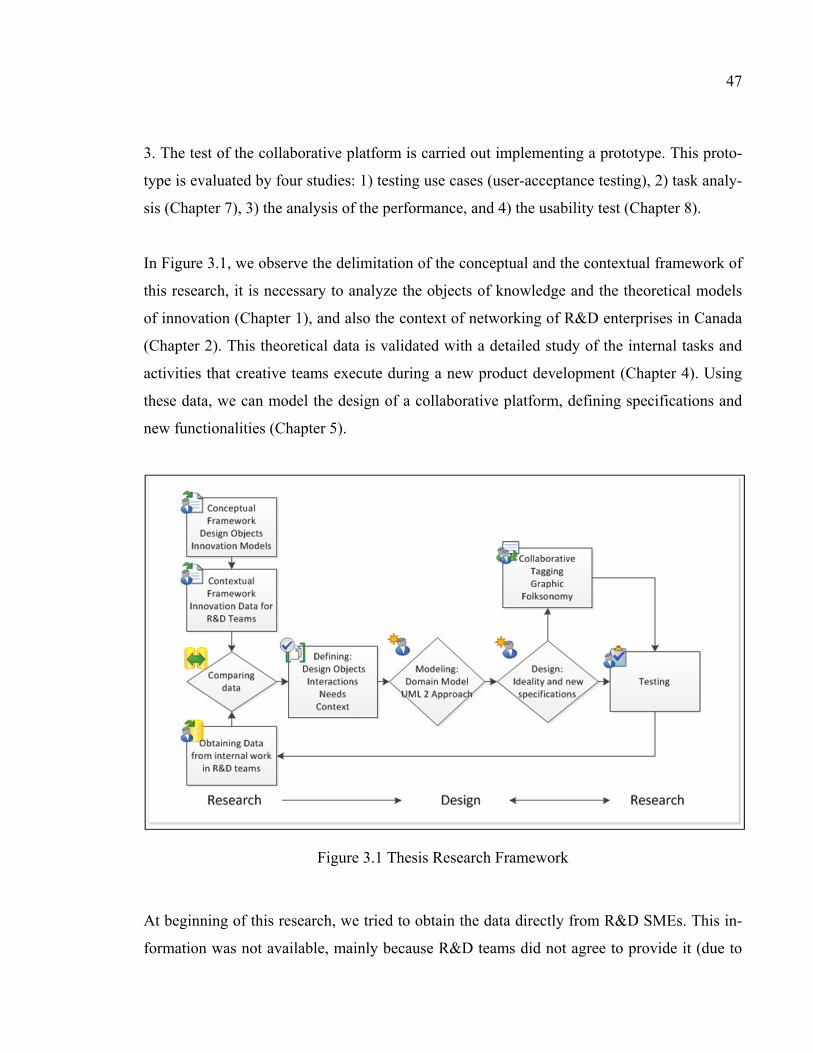
47
3. The test of the collaborative platform is carried out implementing a prototype. This proto-
type is evaluated by four studies: 1) testing use cases (user-acceptance testing), 2) task analy-
sis (Chapter 7), 3) the analysis of the performance, and 4) the usability test (Chapter 8).
In Figure 3.1, we observe the delimitation of the conceptual and the contextual framework of
this research, it is necessary to analyze the objects of knowledge and the theoretical models
of innovation (Chapter 1), and also the context of networking of R&D enterprises in Canada
(Chapter 2). This theoretical data is validated with a detailed study of the internal tasks and
activities that creative teams execute during a new product development (Chapter 4). Using
these data, we can model the design of a collaborative platform, defining specifications and
new functionalities (Chapter 5).
Figure 3.1 Thesis Research Framework
At beginning of this research, we tried to obtain the data directly from R&D SMEs. This in-
formation was not available, mainly because R&D teams did not agree to provide it (due to

48
the fact that this information is its “core business” and they were uncomfortable sharing this
sensible information, they were also concerned for intellectual property risk, a waste of time,
or an intrusive action). As analyzed in Chapter 2, R&D enterprises are small size (5 to 10
employees), work in distributed and in an opportunistic manner (which means that they work
when a new product is demanded by a client or a stakeholder). These enterprises show high
similarities with the creative teams of “Les 24 heures de l’innovation”® (24H). 24H is an
innovation competition created by the École Supérieure des Technologies Industrielles
Avancées (ESTIA, France), in which participants are required to develop innovative solu-
tions to real R&D problems over a 24-hour period. The international edition is organized by
our research team at École de technologie supérieure. We decide to observe the 24H creative
teams, because it provides a conceptual and practical basis for our research.
During this research, we observed a total of 242 creative teams, working in different editions
of 24H; in this thesis are compiled the results obtained in November, 2011 and May, 2012.
All the studies are summarized as follows:
1. May, 2010 – 5 teams (organized by ÉTS), observed each hour
2. October, 2010 - 27 teams (organized by ESTIA), observed each hour
3. May, 2011 – 35 teams (organized by ÉTS and using Teambox with the enterprise
IODS), observed each hour
4. November, 2011 – 40 teams (organized by ÉTS and using InnoTiz with Mc Gill –
ÉTS - Ethical Plan Certificate), observed each two hours
5. May, 2012 – 135 teams (organized by ÉTS and using InnoKiz with Mc Gill – ÉTS
Ethical Plan Certificate), observed each three hours
Some of the reasons to have chosen the creative teams of 24H are:
- Drawing the context information for creative activities: contrasting the theoretical in-
formation of Chapter 1 and Chapter 2 with the knowledge objects exchanged by crea-
tive teams with their sponsors.

49
- Obtaining the data simultaneously, observing the needs and the performance of R&D
(quantitative and qualitative analysis) of the creative team performance and the needs
of R&D teams; in 24H, this information is accessible.
- Analyzing the particular interactions presented when teams utilize a collaborative
knowledge/ideas sharing platform. 24H teams are available to test such platforms and
tools, while R&D SMEs are not.
- 24H also establishes industrial context because big and medium size enterprises pro-
vide challenges in real-time conditions.
As seen at Table 3.1, the main differences between R&D business services teams and 24H
teams are the duration of the Project, a presence of Prototyping, Manufacturing, Commercial-
ization stages, and the high expertise in a design domain of R&D teams; these three last fac-
tors not were observed in this research.
Table 3.1 Comparison among teams of R&D teams and 24H teams
Characteristics
Research Participants
R&D Teams 24H Teams Similarity Size 5 to 10 employees 1 to 12 teammates Yes Project participa-tion By stage and by domain
By domain No
Organization By Project By project Yes
Call for project Director By leader Yes
Expertise High Low No
Access to infor-mation
High informal networking (Chapter 2)
Medium, some experts and Internet No
Motivation
Work salary or business prof-it, growing business, recogni-tion
Prizes, recognition Yes
Networking High developed Low (to be built) No
Project duration 3 to 6 months 1 day No
Stages of product development
All (design and prototyping, manufacturing, commercialization)
Conceptualization (planning) No

50
3.6 Validation of the data collected
As illustrated in Figure 3.1, there are three methodological steps to collect the data about: 1)
context surrounding teams for innovation, 2) needs, tasks and activities of creative teams, and
3) testing the performance of teams with a platform as support. The first step consists in ob-
taining data from collaborative interactions to achieve innovation. This qualitative data is
obtained from different studies, described in Chapter 1 and 2. The data collection in the sec-
ond step will be done using a complementary questionnaire covering the technological and
methodological needs of creative teams. The needs and the analysis of the state-of-art of ICT
technologies are presented in Chapters 4 and 6. For collecting the data in the third step, it is
developed a prototype (modeling at Chapters 5 and 6) and a research instrument to assess the
creative collaboration performance (which had been presented to the ÉTS Ethical Review
Board; see Appendix I), which enables the data validation through prototype testing (Chap-
ters 7 and 8). We shall describe first and third steps in more detail in the next four subsec-
tions.
3.6.1 Identification of knowledge, strategies and methods used in creative collabo-ration
A central point in our research lies in describing the knowledge production at the teamwork
level. Creative teams can be influenced by conditions imposed by their context; however,
they develop particular strategies allowing them to improve their performance. Interaction
among members of creative teams is not only a consequence of geographical proximity; crea-
tive teams have to be involved in a conceptual/cognitive shared “collaborative espace”. Un-
derstanding this sense of integration is the main goal that generates creative collaboration.
Consequently, we propose the analysis of three main points regarding team collaborative per-
formance:
• Communications needs and resources used to identify interactions related to knowledge and
ideas production and exchange
• Creative team performance (mainly considerations to achieve creative collaboration)
• Effective methods and strategies for distributed conditions (See Chapter 6)

51
3.6.2 Ideality (TRIZ) and ICT Collaborative Platform design
In this methodological step, we leap to a technological dimension that transforms the
knowledge acquired about collaboration (first steps of research) into an ICT platform that
enhances the ideas of its users for creative collaboration. A collaborative platform is a tech-
nological development that responds to the KMS (Section 1.3) which supports the socio-
cognitive and technology tools that creative teams need to collaborate. A platform for collab-
oration could be considered as a Portal of Knowledge Management (Lee, Kim and Koh,
2009) or a Cloud that supports knowledge produced, meaning collaboration (Marlowe et al.,
2011). As mentioned by Rollett (2003), the development of ICT tools could be seen as a
knowledge management strategy, which could initially stimulate knowledge sharing or
knowledge retrieval, and in a second step, could obtain a creative purpose:
“The range of tools supporting content creation is not restricted to applications al-lowing people to explain their existing knowledge. It also includes tools meant to stimulate creativity. One popular method is random words, short text, and pictures from a suitable pre-selected collection at the right time” (Rollett, 2003, p. 138).
How can ICTs be used as a medium that enhances knowledge inspiration or conceptualiza-
tion resources in developing a new product? Also, how can the different produced knowledge
outcomes during the discussion and reflection process revolving around a new product de-
velopment be included? The ICT collaborative platform must efficiently enhance the way in
which knowledge is exchanged in addition to delineating a new interaction model.
In TRIZ method5 (Semyon and Savransky, 2000), the technology evolution process obeys the
S-shaped Curve directed from the pass systems to the ideality. As it occurs in all technolo-
gies, there is a constant tendency towards ideality. “Ideality is defined as a ratio of the sum of
5 TRIZ, from the Russian acronym ARIZ (Altgoritm Reshenia Izobretatelskih Zadach) is the Theory of In-ventive Problems Solving proposed by Genrikh Altshuller in 1946. Altshuller studied more than 1000 patents to identify the ARIZ algorithm and 40 principles of contradiction used by inventors (Semyon et Savransky, 2000). TRIZ is a modular method, some of the most common parts are continually used for technical problems and mechanical design, however the use of their modular sections could be extended to all domains, as in our case, that it is applied to a ICT problem.

52
all useful functions and other benefits versus the sum of all harmful functions and undesira-
ble factors (“costs and pains”) associated with useful operations and benefits” (Zlotin,
Zusman and Hallfell, 2011, p. 128). Based on this approach, we might establish the useful
and harmful operations. We obtained this data by questioning users during a project devel-
opment (Chapter 4). The questionnaire allowed us to gather needs, specifications and team-
work conditions in a creative project development context.
The ideality formula proposed by Cavallucci (2012) reads as follows:
I=
∑F useful operations and benefits∑F harmful + ∑F cost, pains
Ideality Formula
(3.1)
According with the Ideality Law of technological systems, the technology evolves in S-
shaped curve from the pass towards an ideal design (Kucharavy and De Guio, 2011) and it
drives to foresee the technology in a systemic evolution. Figure 3.2 also allows the under-
standing of some undesirable effects that we have to considerate in the design of the plat-
form: First, the rapid obsolescence of ICT systems makes them quickly unusable. Secondly,
ICT disaggregates multiple functionalities in different software, operating systems, media
and networks. Third, if we aggregate software or isolated functionalities, we cannot satisfy
all user needs for ideation and creative exchanges.
3.6.3 UML 2 and specifications
The definition of a creative collaboration platform using ICT is represented by a language
that integrates the results obtained in the previously proposed studies (social dynamic, meth-
od and strategy) and the digital space functions6. For this, we chose the UML 2 modeling
language (“Unified Modeling Language”) or UML™.
6 Otherwise the existence of other methods, such as the Rational Unified Process (RUP), Extreme Programming (XP), Agile modeling methods or prototyping methods and Joint Applications Development (JAD) or Rapid

53
Figure 3.2 Proposed S-shaped curve evolution of Collaborative Technologies
This language is “a graphical notation designed to represent, specify, build, and document
software systems. [UML has] ... two objectives: modeling of systems using object-oriented
technology, from design till maintenance, and the creation of an abstract language under-
standable by humans and interpretable by machines” (Charroux, Osmani and Thierry-Mieg,
2008, p. v). In Figure 3.3, we show the procedure for representing the platform by UML 2.
UML 2 has a fundamental advantage, which is the simplicity of use cases. The use cases en-
able the definition of the main functions that contribute to the delimitation of the KMS and
reduce the cost and the induced errors from system fragmentation or multiple functions. In
addition, the simplicity is important because it removes the need for processes and tasks that
do not add value to the system.
Application Development (RAD). We consider that the utilization of UML 2 enables the use and analysis of interactions and user activities, which are widely analyzed for us in the first part of our research.

54
Figure 3.3 Step-by-step process to represent the collaborative platform Adapted from Charroux, Osmani and Thierry-Mieg (2008)
The advantage of designing the system based on the use case model is that it enables the def-
inition of the needs in the use of the system “effectively stated from the perspective of the
user [...]. A complete and unambiguous use case describes one aspect of usage of the system
without presuming any specific design or implementation” (Rosenberg and Scott, 1999, p.
39). The design process resulting from the use case modeling involves a description of the
whole system functionality (ibid). This process differs from other modular design-based
models (thinking in fragmented pieces that will be assembled in the system), or the waterfall
design, or incremental approach (from main or more complex functions to peripheral func-
tions) (idem).
3.6.4 Prototype and users test
We assessed the individual and the collective satisfaction in the use of the platform based on
responses of potential users (24H teams), after a period of use. The first designed KMS
(mock-up or prototype) will be tested by performance and usability measures. Data is col-
lected through forms (questionnaires) or structured or semi-structured interviews.
55
Generally, user experience tests are designed for the assessment of individual interfaces; this
is our major methodological challenge in the evaluation of a collaborative ICT tool. Coutaz
and Balbo (1994) show the difficulty in evaluating multi-user interfaces and propose obser-
vation as a method for analyzing groupware or platforms. Herskovic et al. (2007, p. 2) ex-
plain that the evaluation of groupware depends on its state of development and the general
conditions of research, such as the location, costs or “stakeholders (developers, users and the
organization) and the state of the product (under development or finished)” (idem). For
groupware evaluation, they propose the following methods:
“Groupware Heuristic Evaluation (GHE), Groupware Walkthrough (GWA), Collaboration Usability Analysis (CUA), Groupware Observation, User Testing (GOT), Human-Performance Models (HPM), Quick-and-Dirty Ethnography (QDE), Performance Analysis (PAN), Perceived Value (PVA), Scenario Based Evaluation (SBE), Cooperation Scenarios (COS), E-MAGINE (EMA), Knowledge Management Approach (KMA)” (idem).
To overcome the cited limits to the study of performance in a collaborative platform, we se-
lected four evaluation methods: 1) “uses case acceptance” to validate the new functionalities
proposed, 2) Task analysis, 3) Performance Analysis (PAN) and 4) Usability test – qualita-
tive analysis. These methods are defined as follows:
3.6.4.1 Use-cases acceptance by users
This test consists in verifying the use of a prototype of a Collaborative Platform to validate
the use cases chosen to design the prototype (Chapter 7). Eriksson et al. (2004) indicated that
the UML 2 is a modeling language that provides an incremental approach to improving the
system. This improvement process is interactive based on testing use cases with two related
goals: “verification” and “validation”. Verification confirms that the system is implemented
correctly according to the requirements, specifications and the design; while validation en-
sures that the system under development actually addresses the customer’s needs. Use cases
“help validation by providing a method to test the system for observable benefits to actors”
(Eriksson et al., 2004, p. 77).

56
- The data collection in this study is obtained by the descriptive statistics of the direct
use on the prototype.
3.6.4.2 Task Analysis of Knowledge Management System
As we mentioned in Section 1.3, a Knowledge Management System is a set of tools and
knowledge used to complete a task. Task analysis is a process to define the specific steps
involved in achieving a task. This description is detailed and includes cognitive and psy-
chomotor actions performed by a person to carry out the task. Some of the details include:
sequence of steps, duration, frequency, task allocation, complexity, environmental condi-
tions, necessary prerequisites (e.g. tools). (Crandall, Klein and Hoffman, 2006). This study
is focused in “what user is required to do in terms of actions and/or cognitive process to
achieve the task” (Dalkir, 2012, p. 475). Crandall, Klein and Hoffman (2006) affirm that this
process is particularly useful to analyse ICT because “these technologies and deliver on their
promises only if they are designed and engineered to support cognitive functions” (p. 173).
This method allows the recognition of how the ICT platform is used during the product de-
velopment.
- The data collection in this study is obtained by a form of closed questions every three
hours
3.6.4.3 Performance Analysis: creative activities
The third test is the Performance Analysis (PAN) proposed by Baeza-Yates and Pino (2006).
In this method, “the application to be studied is modeled as a task to be performed by a num-
ber of people in a number of stages, and the concepts of result quality, time, and total amount
of work done are defined. The evaluators must define a way to compute the quality (e.g.,
group recall in a collaborative retrieval task), and maximize the quality vs. work done, either
analytically or experimentally”. This method implies the observation of the amount of work
realized by the team during different stages of the project and the changes in tasks (Antunes
et al., 2008), presented in Chapter 8, after the 24H team tested the platform. The task of crea-
57
tive collaboration was assessed for the effective use of functionalities of the platform. These
data obtained will allow us to improve the collaborative performance in the early ideation
stages.
- For the performance analysis, it is necessarily develop an assessment test, which is
applied after the use of the prototype.
Measuring performance inside an environment or using a new product implies a contrast
among a previous use and the use in a new situation. In our study, we are not able to measure
the improvement of the creative collaboration meaning the platform, because it is a beta
product. This kind of research about performance should require a longitudinal study. How-
ever, we consider that applying a performance test is useful to define the users’ perception
about how the platform facilitates the idea production and the process of collaboration.
3.6.4.4 Usability: qualitative analysis
Usability is defined by Bevan (2009) as:
“a set of attributes that bear on the effort needed for use, and on the individual as-sessment of such use, by a stated or implied set of users. This definition of user in-terface usability contrasts with the system perspective of usability defined from an ergonomic point of view in ISO 9241-11 (1998): Usability: The extent to which a product can be used by specified users to achieve specified goals with effective-ness, efficiency and satisfaction in a specified context of use” (p.14).
Bevan (2009) identifies seven criteria for measuring usability: Effectiveness, Efficiency, Sat-
isfaction, Likability, Pleasure, Safety, and Comfort. In this research, the satisfaction is meas-
ured by a qualitative analysis of the “problems” and low rated score of performance men-
tioned by users during their experience using the prototype of the platform.
- The usability is measured by the means of an open-questions form, detecting the
problems or non-satisfaction comments expressed by users.
58
3.7 Limits of the study
Several limits to this study should be noted. A first limitation is due to the complex nature of
creativity assessment. In this study, we could not affirm that an artifact as the platform could
improve individual or team creativity, because the creative performance depends on psycho-
logical and social conditions. However, we uphold the fact that the creativity could be effec-
tively supported by increasing the probabilities of contact with external experts, collaboration
among team members, and convenient use of media. For this reason, this study is focused on
the support of the creative collaboration.
A second limitation is the timing and cost difficulties to analyze when a creative team
achieves an innovation, because it implies a long-term research. In the field of innovation
research, the researcher has to take a big sample of all teams that worked in a new develop-
ment and wait over 2 years to observe if one of the designed products was accepted by the
market. In our study, this justifies the choice of the analysis of the Canadian statistics. This
study took a sample of R&D enterprises that effectively reported an innovation. In addition
to this second limitation, it could be better to follow-up the winner’s teams of 24H. However,
following only the winning teams is extremely difficult because not all of them agreed to
participate and the sample would be extremely small.
A third limitation for assessing the performance of teams using the platform is the absence of
a control group. This limitation is common among the beta version of a software or prototype
being tested. However, as Roger (2013) mentions, a first testing enables the designer to ob-
serve the “possible ways of improving the product” (p. 209). Further research inquiry is
needed to compare the performance of creative teams into the platform in contrast with oth-
ers groupware or tools.
3.8 Summary
In this chapter, we have presented our problem statement related to the distribution of tacit
and informal knowledge and the distribution of creative team members. Also, we have pre-

59
sented all the implications of ICT tools in the sharing of informal knowledge. Methodologi-
cally, we respond to the problem statement defining four objectives. For the design of the
collaborative platform, we employ the evolutionary trend based on the TRIZ “ideality law”.
ICT functionalities will be presented using UML 2, and the collaborative user experience test
is realized using the Performance Analysis Method (PAN).
In the next chapters, we present three studies realized to answer the research question: How is
it possible to support the distributed creative collaboration through a knowledge manage-
ment system and a collaborative ICT platform for ideas and knowledge sharing?
In this thesis we presented three steps of the research development, the first, presented in
Chapter 4, describes the study of the needs and ideals exposed by creative teams that allow
us to complete the study on the use of collaborative functionalities. Secondly, Chapters 5 and
Chapter 6 describe the technological dimension of the platform design (modeling the
Knowledge Management System) and the development of a prototype of a collaborative plat-
form for testing the main functionalities, and thirdly, in Chapter 7 and Chapter 8, we present-
ed the test of user experience during a first beta test of a prototype. Our study focuses only on
the analysis of creative R&D activities, and on the interaction that drives teams to design in-
novative products.


CHAPTER 4
UNDERSTANDING NEEDS OF CREATIVE TEAMS
This chapter summarizes the needs of knowledge acquisition (task, tools and sources of
knowledge) expressed by the almost 142 out of 250 participants (who agreed to participate in
this research) attending the Fourth edition of 24H de l’Innovation (24 Hours of Innovation)
(November 2011), with the responses about the ideal conditions for sharing ideas and
knowledge within and outside the team. This chapter is based on work by Jiménez-Narvaez,
Dalkir and Gardoni (2012). These data provide the methodological issues to define the
Knowledge Management System (KMS) (information needed to design a collaborative plat-
form) that enables interactive collaboration among participants in a new product develop-
ment.
4.1 Knowledge acquisition process in a new product definition
One of the most useful approaches of knowledge acquisition analysis is purported by Dalkir
(2012) consists of analyzing three knowledge acquisition phases: “identification, conceptual-
ization and codification” (p. 117). Table 4.1 provides an explanation of each knowledge ac-
quisition phase. The first phase, identification, refers to the process of characterizing key
problem aspects such as participants, resources, goals, and existing reference materials
(idem). In a design team, this phase allows teammates to analyze the project context and to
also recognize constraints and limitations identified by participants such as industrial stake-
holders, market or consumer expectations and team members. The second phase, the concep-
tualization of the project or the product is realized comparing concepts among teammates. In
this phase, the production of content is necessary to exchange information. In the last phase,
the codification, teams represented their project solution by detailed images produced with
CAD software, photos of a mock-up or videos.
62
Table 4.1 Phases of knowledge acquisition and research statements
Phases of knowledge acquisition Process of knowledge acquisition
Identification
What knowledge was needed to “capture” the context during the project?
Conceptualization
How were the key design concepts defined by the team?
Codification
How was the new design represented by the team? (to be understand the new product in-formation inside and outside the team)
4.2 Defining the use of ICT to acquiring knowledge
Despite the existence of an array of ICT services or knowledge toolboxes such as groupware
options, extranet and intranet networks and databases that allow the knowledge exchange
among design teammates, the satisfactory conditions to collaborate are not yet established.
The fact of adding communication tools did not alleviate the problem of effective exchange
and communication in creative teams. According with Gruber and Duxbury cited by Dalkir
(2012, p. 234) some possible causes are related to the difficulty of foreseeing new situations
especially because the forecast information “is hard to find, there were different systems and
no standards, the information was not where it should be, the tools were difficult to use and
the database was difficult to access” is not enough to have modeling tools to support
knowledge sharing, because satisfactory team performance also depends on team dynamics:
“training of knowledge retrieval, to define a knowledge strategy that would categorize in a
standard way, to standardize the information technologies, and to create project web sites”
(idem). In the analysis of product forecasting, design teams used knowledge that is provided
by different sources. There are approaches based in social demands as client requirements
(Forgues, 2006), consumers participation (Helander and Jiao, 2002) or the product modeling
with CAD technologies (Demoly et al., 2010; Quintana et al., 2010). We observed that these
approaches are complemented in a whole framework.

63
As the result of this reflection, we became interested in understanding and harnessing the
complexity of managing knowledge needs of design teams: What is the knowledge acquired
by a team when forecasting new product/ process? What types of tools are needed to create
and share this knowledge? We explore this knowledge acquisition process and tools by the
way of task analysis method that was presented in the Section 3.5 on the Methodology.
4.3 Description of the study: Participants and Procedure
Almost 250 students attended the fourth edition of the 24H competition and 142 agreed to
participate in the research study (November, 2011). During the competition, we sent out
online forms to all registered students who had agreed to participate in the research. This
was an introductory questionnaire about some biographical information and teamwork expe-
rience, open-ended questions every two hours about which design process stage they were at,
and what knowledge and tools they had needed and used. There were a total of ten forms;
participants had to submit if they worked in that two-hour period. They then completed and
submitted a final user satisfaction questionnaire at the end of the competition. The questions
about the phases of knowledge acquisition were asked at 6H, 14H and 22H, respectively.
We studied three variables linked to this process:
1) Visualization of the representation of ideas during the three stages of acquisition
knowledge: identification, conceptualization and codification, proposed by Dalkir (2012);
2) Information sources (cognitive and knowledge exchanged) used effectively by the teams
for idea exchange demand (project proposals) or teamwork among team members and exter-
nal experts, partners or sponsors;
3) Communication tools used during knowledge sharing stage.
Figure 4.1 shows some characteristics of participants. On average, 50% completed and sub-
mitted the questionnaires, and of these, 57% were undergraduate students and 37% were
Master’s students. Approximately 73% said they frequently used from 1 to 5 groupware sys-
tems and 19% used more than 5 groupware systems. Most respondents were project devel-
opment team members (69%) and 44% reported that they had team leadership experience.

64
Figure 4.1 24H participants’ biographical information
Students who had previously worked together tended to be on the same 24H team. 32% had
not worked together for more than a year, and only 19% responded that they had worked to-
gether for two years. 94% of participants reported that they were comfortable working in
teams. Table 4.2 presents the teams composition, including the number of members, the host
universities or institutions and countries of origin.
4.4 Results
4.4.1 Knowledge acquired from internal and external sources
In Table 4.3, we observe how teams and partners acquire knowledge in three stages: problem
definition, product conceptualization, and codification. Table 4.3 shows how participants
acquire knowledge to define a product from external sources of information, in the first stage
of problem definition: 44% of participants used the Internet and search engines as a main
information source, 27% of participants requested people or consumer information sources,

65
12% of participants requested to external and internal experts, and 5% of participants con-
tacted industrial representatives.
Table 4.2 Teams composition by participants and schools
Country N. Team Participants Institution DomainBelgium T1 Les Zips 5 ESA - Saint Luc Industrial Design, Mechanical Eng.
T2 HEC-Ulg 6 HEC-Ulg Bussiness
T3 ICW 5 HEC-UlgT4 Limitless conception 7 HEC-Ulg Economics, MBA
T5 SAFEA's Troglodytes 8 HEC-Ulg Economics, Bussiness Administration
T6 La fourmilière 4 HEC-Ulg Finance
T7 ID-Brakers 5 HEC-Ulg Economics
T8 Groupe1 5 HEC-Ulg Finance
Canada T9 Les zombilistes 3 ETS Industrial and Electrical Engineering
T10 D-2913 6 ETS Automatized Production Engineering
T11 15HP 7 ETS Informatics IT, Mechanical Engineering
T12 INGénieuses 6 ETS,UTC TUBS Mechanical Eng, Communications and Networks, Human Factors, Industrial Design, Aerospace
T13 Innov'UTC 9 ETS, UTC Automatized Production Engineering
T14 Moonlight 3 ETS, UTC Automatized Production Engineering
T15 MidgETS 7 ETS, UTC Logistics and Operation Engineering
France T16 Kandasamy 3 UNIV-MLV Mechanical Engineering
T17 ESIPE -MLV 3 UNIV-MLV Mechanical Engineering
T18 ESIPE 1 3 UNIV-MLV Mechanical Engineering
T19 Purple 1 UNIV-MLV Mechanical Engineering
T20 ESTIA-Zip 3 ESTIA Mechanical Engineering
T21 Duck'y duck 2 UTBM Design and mechanical Engineering
T22 Les 6 fantastiques 6 UTBM Design and mechanical Engineering
T23 mécaZip 4 UTBM Design and mechanical Engineering
T24 Les tuques 3 UTBM Design and mechanical Engineering
T25 Les Woodchucks 6 UTBM Design and mechanical Engineering
T26 Innov in the soul 4 UTBM Design and mechanical Engineering
T27 The team of the time 5 UTBM Design and mechanical Engineering
T28 Duck'y duck 4 ISA Agro-research
T29 Duck'y deck 7 ISEN High Technology and Innovation Design, Agro-research
T30 Flo et les garcons 2 ISEN High Technology and Innovation Design, Agro-research
T31 Barnique-veritas 6 ISEN High Technology and Innovation Design, Electonics and Informatics, R&D
T32 Bazinga 4 ETS, Poly, UTBM Design and mechanical Engineering
T33 Seven-Team 4 ISEN High Technology and Innovation Design, Electonics and Informatics
Reunion Island
T34 Team 1 5 Lycée Lislet Geoffroy Electricotechnical
T35 Team 2 5 Lycée Lislet Geoffroy Electricotechnical
T36 Team 3 5 Lycée Lislet Geoffroy Electricotechnical
T37 Team 4 5 Lycée Lislet Geoffroy Electricotechnical
T38 Team 5 5 Lycée Lislet Geoffroy Electricotechnical
T39 Choc 5 Lycée Lislet Geoffroy Electricotechnical
Senegal T40 Teamudz1 1 Université de Ziguinchor
Informatics
Total 40 Team 187 ParticipantsESTIA-École Supérieure des Technologies Industrielles AvancéesETS- École de technologie supérieure, ISA - École de l'agriculture, l'agroalimentaire, l'environnement et du paysage à LilleISEN- École d'ingénieur généraliste en haute technologie ingénieursPoly-École polytechnique MontrealUNIV-MLV Université Paris-Est Marne-la-Vallée - Ecole d'ingénieurs par apprentissage des sciences et technologiesUTBM-Université de Technologie de Belfort-Montbéliard-UTC-Université technologique du Compiègne
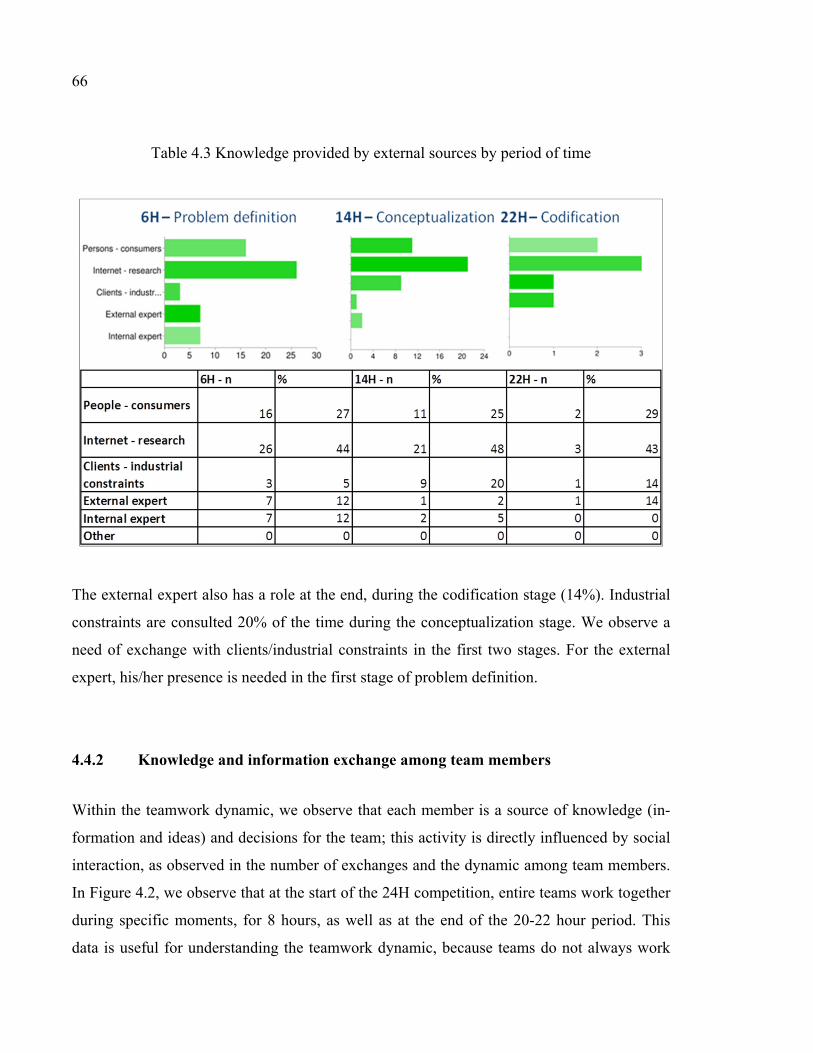
66
Table 4.3 Knowledge provided by external sources by period of time
The external expert also has a role at the end, during the codification stage (14%). Industrial
constraints are consulted 20% of the time during the conceptualization stage. We observe a
need of exchange with clients/industrial constraints in the first two stages. For the external
expert, his/her presence is needed in the first stage of problem definition.
4.4.2 Knowledge and information exchange among team members
Within the teamwork dynamic, we observe that each member is a source of knowledge (in-
formation and ideas) and decisions for the team; this activity is directly influenced by social
interaction, as observed in the number of exchanges and the dynamic among team members.
In Figure 4.2, we observe that at the start of the 24H competition, entire teams work together
during specific moments, for 8 hours, as well as at the end of the 20-22 hour period. This
data is useful for understanding the teamwork dynamic, because teams do not always work

67
simultaneously, and because the dynamic is supported by the work that takes place between
subgroups of 1 to 3 members. Further, information obtained from sponsors, clients and the
organization boards was not continuous during the innovation process, but it has to be pro-
vided as soon is needed to maintain the flow of the teamwork dynamic. This specific need of
external exchanges could be a justification of the use of ICT technologies (Gottschalk, 2005;
Rao, 2005).
Figure 4.2 Exchange of information among teammates, client and organization
in a social teamwork dynamic (number of meetings and number of participants)
4.4.3 Production of ideas by participants during internal teamwork
In the early stages of the design process, teams developed different ideas in different quanti-
ties at the individual level; these ideas contributed to the completion of the project definition.
Nijstad and Stroebe (2006) affirmed that the creative teamwork dynamic is composed of two
kinds of interaction loops among teammates: the image retrieval loop and the idea production
loop (Nijstad and Stroebe, 2006, p. 193). This iterative process between knowledge acquisi-

68
tion (first loop – image retrieval) and knowledge exchange (second loop – idea production)
allowed participants to share information, knowledge and insights about project develop-
ment. We must recall that 24H teams are in an international competition, which results in
highly competitive behavior and encourages creative discovery within a short time period. In
Figure 4.3, we can observe active creative production, as evidenced by the number of ideas
produced, and reported by each participant.
Figure 4.3 Number of individual ideas produced over time.
We also observe that participants produced large numbers of ideas during each part of the
project. External experts had low participation in teamwork. And also, there is a low produc-
tion of ideas during the last part of product definition. Nijstad and Stroebe (2006) also pro-
posed that this inter-loop dynamic increases the diversity of ideas production in the wide
range of semantic categories making up the design stage. This fluidity is reflected in the
number of ideas produced during the entire project. Participants indicated a fluid activity
69
(more than 7 ideas per two-hour period) of idea production (Nijstad and Stroebe, 2006, p.
204), especially during the first 8 hours of the problem definition.
4.5 Identification of ICT Tools used in product definition
We found that there was a wide variety of ICTs used to support the R&D team, and that they
supported four activities: information acquisition, knowledge representation, changes man-
agement and knowledge sharing. However, in accordance with participants’ answers imple-
menting ICT tools was not sufficient to support knowledge sharing. Figure 4.4 shows the
wide range of tools observed in use for sharing knowledge and a generally broad range of
variations in the use of ICT technologies during the 24H competition. Participants used the
Internet as the main tool for searching and acquiring knowledge.
In other words, the Internet was a source of information for innovation activities, in addition
to being a knowledge sharing tool. Participants used the search engine and information from
patent databases as references to determine the “state-of-the-art” of the technology of the
product that they were currently developing. Responding to an open question about critical
tools used in product development, respondents agreed that the Internet was a critical tool for
arriving at an innovative solution, as shown in Table 4.4. We present a detailed explanation
in the next section.
In the close question about the critical tools (see Figure 4.5) teams responded that they re-
quired tools, particularly the “critical” tools to realize the project definition” (see Table 4.4).
To assess these critical tools, we used the definition of “critical”, in the sense of must-have
tool or the needed tool as expressed by Collins (2007), cited by Rao (2005a), who defines
five levels of critical need “critical, must have, important, nice to have and non-critical” to
sustain team performance.
70
Figure 4.4 Tools and ICT technologies used by the 40 teams during a 24-hour period
As see in Figure 4.5, the use of paper and boards is also essential in the teamwork dynamic;
this aspect entails a challenge in combining ICT with hand tools.
Figure 4.5 Critical tools to exchange knowledge

71
Table 4.4 Critical tools to be used during a new product development
Project Stage
Tasks ICT –based Tool Non ICT-based Tool
Pro
ble
m d
efin
itio
n
Inspiration Watch technology Art state
Internet Engine Patents Database Youtube
Simulations and body language
Sharing links and files (Shar-ing content)
Google docs Google groups Dropbox
Problem Definition Brainstorming – collective idea production
Brain, Freemind (Mind mapping tools)
Discussion Communication tools
e-mail Skype (audioconferencing) Webex (videoconferencing)
Paper-Pencil Board – markets Post-its Verbal notations
Con
cep
tual
izat
ion
Definition Internet Engine Google docs MS-Word
Drawings Images in a screen Paper-Pencil Excel
Idea definition Catia, Rhinoceros MS-Power Point Blackboard
Drawings, plans, mod-els
Discussion Communication tools
e-mail Skype (audioconferencing) Webex (videoconferencing)
Paper-Pencil Board – markets Post-it Verbal notations
Cod
ific
atio
n
Project definition Catia, Rhinoceros, Solidworks MS-Power Point MS Movie-maker
Drawings, plans, mod-els
Storage or Web Content Man-agement Tools
Google Docs Dropbox
Remote file exchange
Communication Tools Dropbox Skype (audioconferencing) Webex (videoconferencing)
Co-presence or remote: verbal notations
4.5.1 Cloud–computing and Internet as a critical source of knowledge acquisition for innovation
The Internet was the main tool used for a kind of trimmed “technology watch” and to obtain
critical information about creative or innovative methods, as explained by participants. Tech-
nology watch is a “systematic procedure of capturing, analyzing and exploiting useful infor-

72
mation for strategic decision making in a company or organization” (Legardeur, Boujut and
Tiger, 2010). The goal is to conduct a complex technological research “based on the search
and analysis of all technological information (especially patents) with the aim of catching
development opportunities and detecting competitive threats while providing strategic choic-
es for business decision makers”. Patents Luxembourg Office - (Online – accessed April
2011). The Internet and ICT technologies were important vehicles of knowledge acquisition
and knowledge sharing because they mediated the interaction (groupware); contributed to
knowledge externalization (coauthoring or document production) sharing and retrieving of
documents and easy visualization (Portals); to knowledge internalization by connecting train-
ing and resources between novices and experts (Learning Modeling Systems LMS); and fi-
nally, ICT technology supported workflows, decisions and visualization of knowledge, as
mentioned by Koulopoulos and Frappaolo (2000).
As shown in Figure 4.4, 24H teams also used other platforms, such as Skype, a Web confer-
encing service that includes a chat or SMS function, allowing the rapid sharing of links and
files. Cloud computing services (Zika-Viktorsson and Ingelgård, 2006) and search engines,
were used during the entire competition, with the use being most intensive during the first 8
hours. In answering the open-ended questions about the use of these technologies, respond-
ents expressed their wish for synchronous tools to be aware of project progress and to be able
to share digital information. Co-located participants showed other members their computer
screens whenever they found interesting information or data. When team members were not
at the same location, they sent an e-mail or instant message with the information obtained.
However, this kind of information sharing had its limits as the information contained may be
difficult to read and priority information could be lost. For that reason, teams preferred to
coauthor documents in two ways: using Google Docs and sharing and working on a common
document using DropBox.
Despite the flexibility of the coauthoring option of Dropbox, there were some difficulties
encountered in making changes to the project. Google Docs was found to offer more ad-
vantages, with its special coauthoring features, such as a modification panel per user, change

73
history trace and the ability to add comments. The Google Docs coauthoring feature offered
another advantage for large teams: all team members could participate simultaneously and
observe or work on a different part of the same document. This contrasted sharply with the
difficulty in using the MS Office Change History feature, as it became quite confusing when
more than 3 people were participating, and after 2 revision cycles.
4.6 Discussion
As observed in this Chapter, the knowledge acquired by creative teams, during the early de-
sign phase: problem definition and conceptualization, was distributed by three conditions of
interaction: 1) a large number of information exchanges among participants during the initial
problem definition stage; 2) a social dynamic among team members and external experts, and
3) a large quantity of media/tools used to acquire knowledge, defining a problem, conceptu-
alizing and codifying an idea.
This distribution of knowledge is a natural condition in a new product design dynamic and
this distribution is not enough mitigate by the use of ICTs or the introduction of specific
software of design, such as Adobe® Creative Suite® 5.5 or CAD software. We observed that
the CAD tools are used in the latest stage of codification (Figure 4.4). All these ICT tools do
not meet all the knowledge capture needs in the first stages of problem definition or concep-
tualization; as well, the simultaneous use of these tools cannot relieve or facilitate
knowledge/ideas capture or sharing. In addition, 24H teams frequently use non-technological
tools such as paper-pen, board-markers, and post-its to draw or write their ideas (as shown in
Figure 4.5). All these media require a co-presence/face-to-face model that is not easy to
maintain in an inter-institutional project.
In Table 4.4, we propose a classification of ICT technologies, especially of groupware sys-
tems in: 1) Communication tools, 2) Web-search Engines (Google), and 3) Content Produc-
tion (for sharing changes and co-authoring outcomes). Project Management tools for plan-
ning or task assignation were not mentioned for the early design process. These tools must be

74
part of a collaborative platform. According with the answers of 24h teams, ICT tools are
used indistinctly by co-localized and in a delocalized teams, particularly to capture tacit
knowledge from Internet (as a data-base) and from industrial partners or stakeholders.
4.7 Summary
In this Chapter, we model the needs of creative teams during three specific tasks: problem
identification, conceptualization and codification of knowledge. Also, we identify ICT tools
that support a collaborative ideation (ideas production) stage. The analysis of these condi-
tions can lead to more effective knowledge acquisition and sharing during a collaborative
project development. We conclude that the interactive process of co-ideation requires ICT
tools that allow designers to manage knowledge acquisition processes involving actors,
communication platforms, and the Internet.
Social interaction varied during different time periods – when the team worked together at
the beginning of the event (conceptualization) and at the end (codification). During other
time periods, the team worked in subgroups of one to three participants. This social interac-
tion determined the use of ICT technologies. New applications such as Google Docs or
Dropbox (cloud computing technologies) were used to co-author documents and to support
the knowledge acquisition process.
In this study, we also discover during the early design phase, the collaboration is also distrib-
uted in three conditions due to peer-to-peer interaction: 1) a large number of ideas are ex-
changed among participants during the initial problem definition stage; 2) a social dynamic
among peers, team and external experts, and 3) a large quantity of media/tools used to ac-
quire, produce, represent and share the experiential design learning knowledge.
In the next chapter, we will define the main functionalities that an ICT platform must have in
order to support the needs of creative teams.

CHAPTER 5
MODELING THE COLLABORATIVE PLATFORM AND SPECIFICATIONS
This chapter provides a detailed explanation of the conceptual model and the specifications
needed to support creative collaboration among design teams. The design of the platform is
presented by Domain Model, Ideality Formula and UML 2 (a detailed UML glossary is in
Appendix IV). UML 2 describes the information, actors, use cases, and is also extensively
used for “documenting software systems [...] UML has evolved dialects beyond the reach of
official standards for such needs as data modeling, business modeling, and real-time devel-
opment” (Eriksson et al., 2004, p. 1).
5.1 Supporting creative collaboration: domain model
For modeling the collaborative platform as a Knowledge Management System, it is necessary
integrating: the knowledge objects (Chapter 1), the networking with expert sources for inno-
vation obtained from Innovation and Businesses Survey (Statistics Canada, 2005; 2008;
2010) (Chapter 2) and the needs for capturing knowledge of 24H creative teams (Chapter 4).
In a first level of interaction of the collaboration platform, the knowledge exchanged is di-
vided into known and unknown components proposed by Frappaolo and Koulopoulos (2000)
in its matrix of the Known-Unknown, in which the design team depends of internal and ex-
ternal sources acquire and exchanging ideas and knowledge, as presented in Figure 5.1.
Unknown knowledge is assumed to be new ideas generated by insights, feelings and emo-
tions, while known knowledge is more closely related to memory and shared expertise. In
fact, idea production is a process related to recalling memory and loops of association on
thought (Nijstad and Stroebe, 2006), while knowledge production is related to our intellectual
ability to process knowledge (Wenke and Frensch, 2003). In a creative team, each teammate
contributes ideas and knowledge; these are two basic processes, so the success strategy for a
creative team consists in precisely synchronizing (tuning in), integrating or selecting these
contributions.
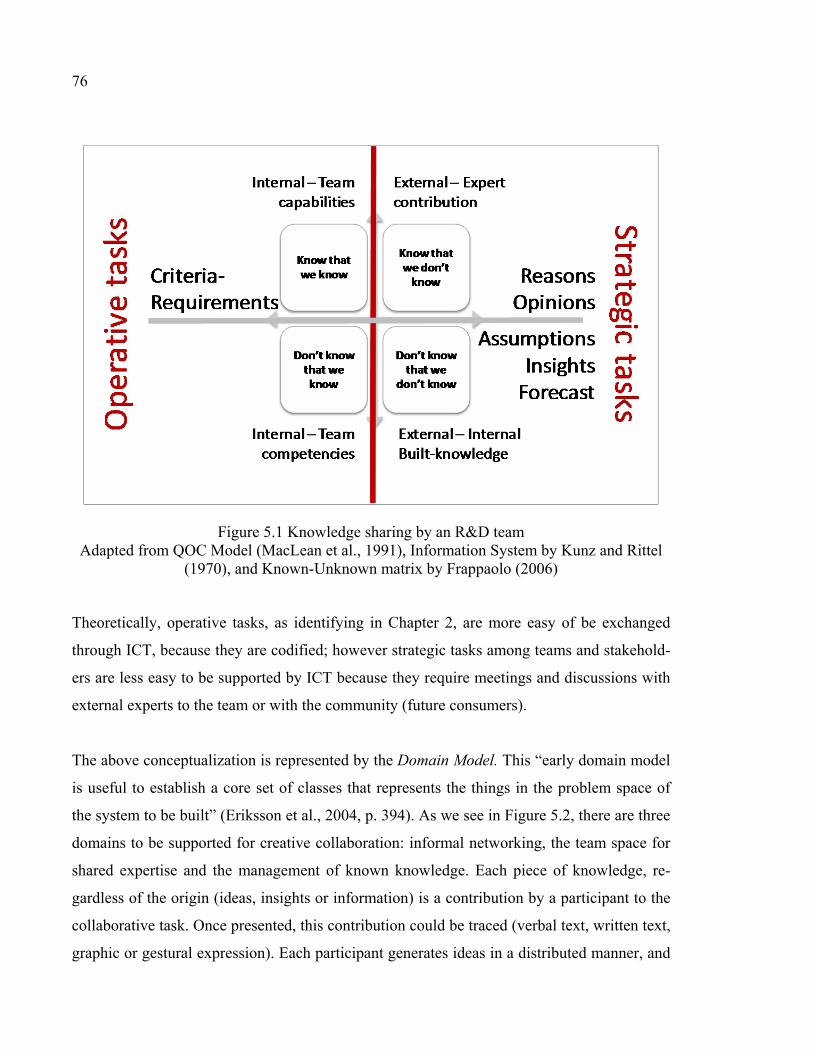
76
Figure 5.1 Knowledge sharing by an R&D team Adapted from QOC Model (MacLean et al., 1991), Information System by Kunz and Rittel
(1970), and Known-Unknown matrix by Frappaolo (2006)
Theoretically, operative tasks, as identifying in Chapter 2, are more easy of be exchanged
through ICT, because they are codified; however strategic tasks among teams and stakehold-
ers are less easy to be supported by ICT because they require meetings and discussions with
external experts to the team or with the community (future consumers).
The above conceptualization is represented by the Domain Model. This “early domain model
is useful to establish a core set of classes that represents the things in the problem space of
the system to be built” (Eriksson et al., 2004, p. 394). As we see in Figure 5.2, there are three
domains to be supported for creative collaboration: informal networking, the team space for
shared expertise and the management of known knowledge. Each piece of knowledge, re-
gardless of the origin (ideas, insights or information) is a contribution by a participant to the
collaborative task. Once presented, this contribution could be traced (verbal text, written text,
graphic or gestural expression). Each participant generates ideas in a distributed manner, and

77
a system is needed to support this distribution geographically or temporarily. In addition, the
system allows the free-association to produce a knowledge-based networking, in which the
community is involved and participates adding, commenting or selecting ideas.
Figure 5.2 Description of general context for creative collaboration support
5.2 Modeling the Platform according to TRIZ
As mentioned in Chapter 3, Section 3.6.2, regarding the ideality law, the ideal KMS is estab-
lished by identifying useful operations, harmful operations, cost and pains. We propose the
use of ICT the useful operations, according with the usefulness and value added to collabora-
tive activities, as Formula 5.1 shows:

78
Platformdesign=
∑ FUsefuloperationsandbenefitsofICT:Networking(GeneratingandBuildingNetworks)ℎ ℎ ( ) , , Subjectpropositionandideas'visualization
Meetingswithexperts(whenitisneeded),Collectivevalidation∑ FHarmful:lossoftacitinformation,isolation+∑ Fcost,pains: : / , , ,
Ideality Formula Application for ICT Platform of creative collaboration
(5.1)
In this formula, the useful operation and benefits of ICT:
- Making explicit the tacit knowledge based on insights and feelings; and strategic de-
cisions.
- Visualizing the personal contribution (attributing ownership)
- Integrating the portion of information or a specific interpretation of a new idea; each
idea is not produced in parallel or in a synchronous fashion, and each participant pro-
duces ideas at their own pace and with their own skills;
- Creating the space for casual meetings and expert contributions are needed to develop
or to detail ideas;
- Creating a sense of project, in the first steps of design the project idea is fragmented,
and members failed to meet deadlines or accomplish tasks or they did not assign task
to the members.
- Matching expertise and knowledge among members.
Among the undesirable factors (that have to be avoided or reduced), there are:
- The possible loss of tacit information and the isolation of the teammates
- High cost of Platform development and implementation: organizational changes, dif-
ficulties of initial learning process (Steep learning curve), and training.

79
5.3 Model of collective idea production supported by ICT
Comparing the SECI knowledge production model (Section 1.4.2) of Nonaka and Toyama
(2003) with the needs of the creative teams (Chapter 4), we propose that ICTs may be useful
as a complement of collaborative interaction, particularly in the cases where the team lost
information or awareness of the tacit knowledge of ideas’ production (oranges arrows in Fig-
ures 5.3 and 5.4).
Our thesis support the fact that ICT makes evident the tacit knowledge obtained by the inter-
action among users and enable the information exchanges in two ways:
- Team space: creating a free-association among participants (Figure 5.3)
- Idea space: creating an automated space of ideas and knowledge sharing (Figure 5.4)
Figure 5.3 Including ICT in the team integration process
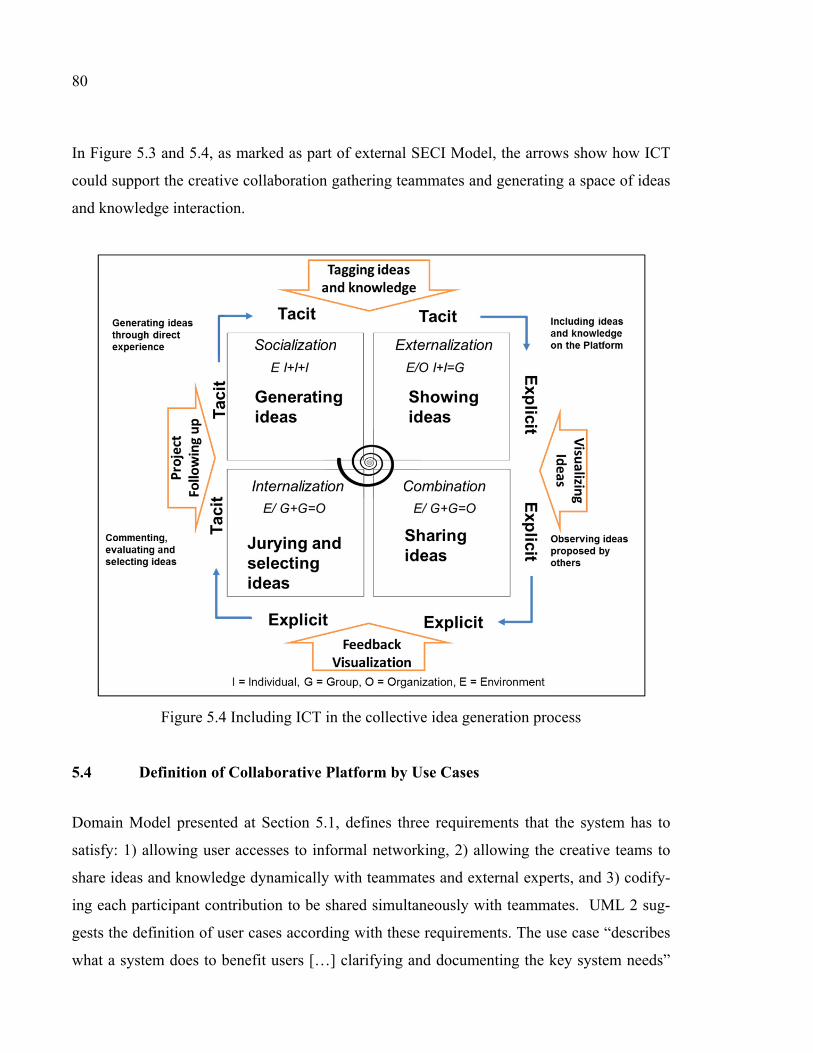
80
In Figure 5.3 and 5.4, as marked as part of external SECI Model, the arrows show how ICT
could support the creative collaboration gathering teammates and generating a space of ideas
and knowledge interaction.
Figure 5.4 Including ICT in the collective idea generation process
5.4 Definition of Collaborative Platform by Use Cases
Domain Model presented at Section 5.1, defines three requirements that the system has to
satisfy: 1) allowing user accesses to informal networking, 2) allowing the creative teams to
share ideas and knowledge dynamically with teammates and external experts, and 3) codify-
ing each participant contribution to be shared simultaneously with teammates. UML 2 sug-
gests the definition of user cases according with these requirements. The use case “describes
what a system does to benefit users […] clarifying and documenting the key system needs”
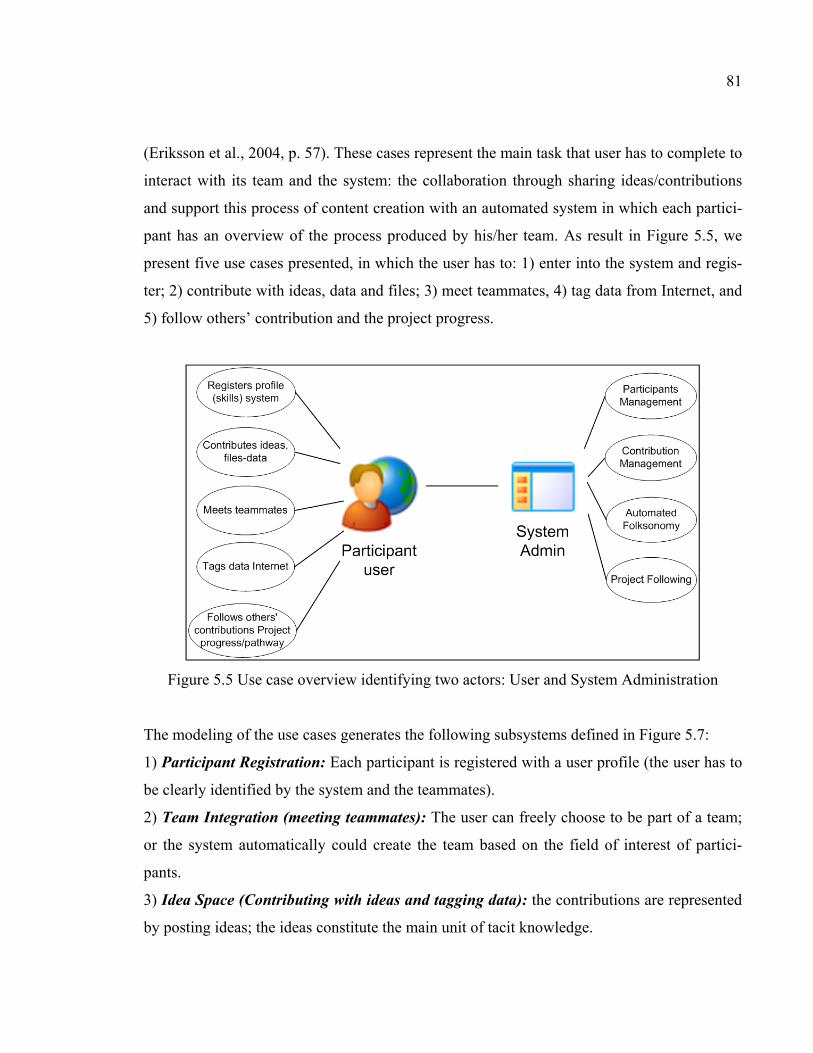
81
(Eriksson et al., 2004, p. 57). These cases represent the main task that user has to complete to
interact with its team and the system: the collaboration through sharing ideas/contributions
and support this process of content creation with an automated system in which each partici-
pant has an overview of the process produced by his/her team. As result in Figure 5.5, we
present five use cases presented, in which the user has to: 1) enter into the system and regis-
ter; 2) contribute with ideas, data and files; 3) meet teammates, 4) tag data from Internet, and
5) follow others’ contribution and the project progress.
Figure 5.5 Use case overview identifying two actors: User and System Administration
The modeling of the use cases generates the following subsystems defined in Figure 5.7:
1) Participant Registration: Each participant is registered with a user profile (the user has to
be clearly identified by the system and the teammates).
2) Team Integration (meeting teammates): The user can freely choose to be part of a team;
or the system automatically could create the team based on the field of interest of partici-
pants.
3) Idea Space (Contributing with ideas and tagging data): the contributions are represented
by posting ideas; the ideas constitute the main unit of tacit knowledge.
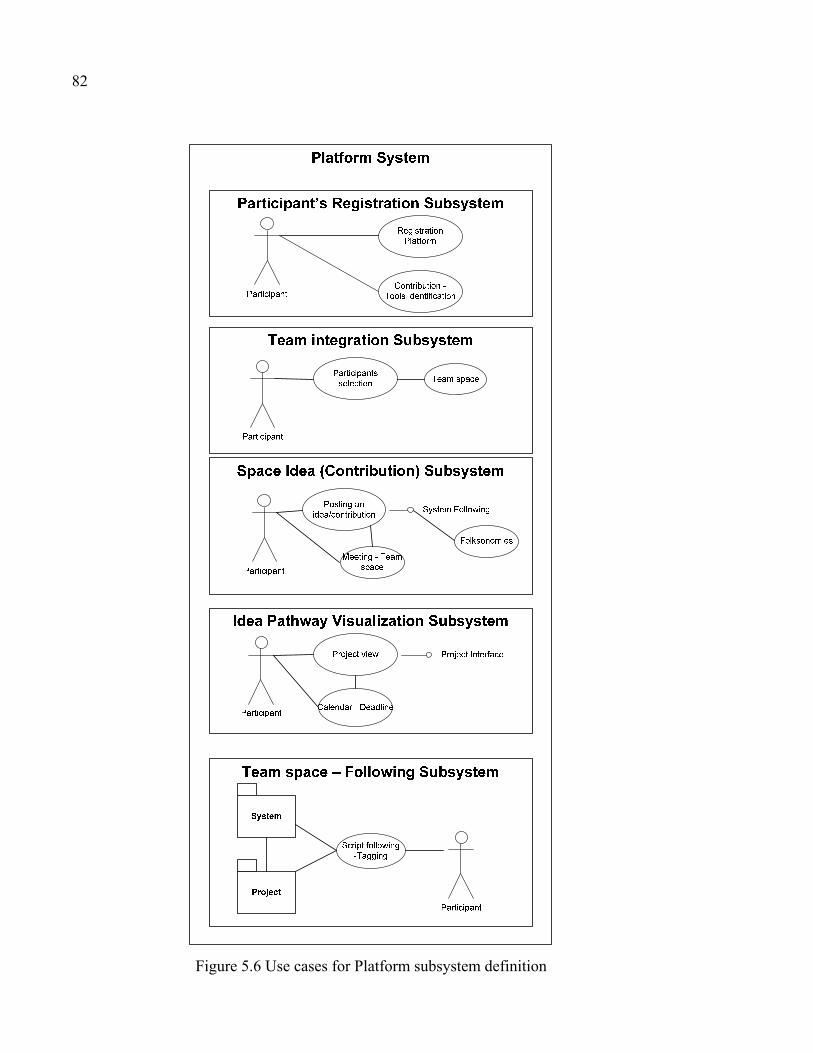
82
Figure 5.6 Use cases for Platform subsystem definition

83
The user expresses or shares his/her ideas using a meeting room, messages or images (the
system has to classify this contribution by an Automated Folksonomy).
4) Idea and Project Pathway (follows ideas and projets): Ideas are integrated into a project
pathway, the user identifies modifications and enters comments about their own ideas or the
ideas proposed by their teammates (The system has to create the pathway for changes, modi-
fications and a timeline that illustrate the project pathway progress)
5) Following the team space: The system records and stores the ideas produced – files, im-
ages, videos, and team meetings, for sharing with others.
5.5 Interaction between Participant, System Administration and Familiar Tools
Figure 5.7 shows how three actors interact: the Participant (user) and the System Administra-
tion (like a database and expert system), a third object, the Familiar tools used to create con-
tent or to post, or to codify the contribution of each participant (MS Word, Paint, AutoCad,
Google Docs, etc.).
Interaction between objects is realized using messages. As shown in Figure 5.7, the open ar-
row represents an asynchronous message and a closed arrow means a synchronous message.
We observe in ICT use dynamics (Chapter 4) that there is a limit in the sharing of contribu-
tions using personal or individual licensed software. When a piece of software or groupware
is easily accessible to the entire team, changes are made by each participant. However, that is
not commonly the case, because sometimes, specialized 3D modeling software or video crea-
tion or editing requires expert skills from someone in the team. In that case, the team general-
ly prefers to use a cloud application or a visualization strategy (screen view), allowing all
teammates to see the result and “dictate” required changes to the teammate in charge.
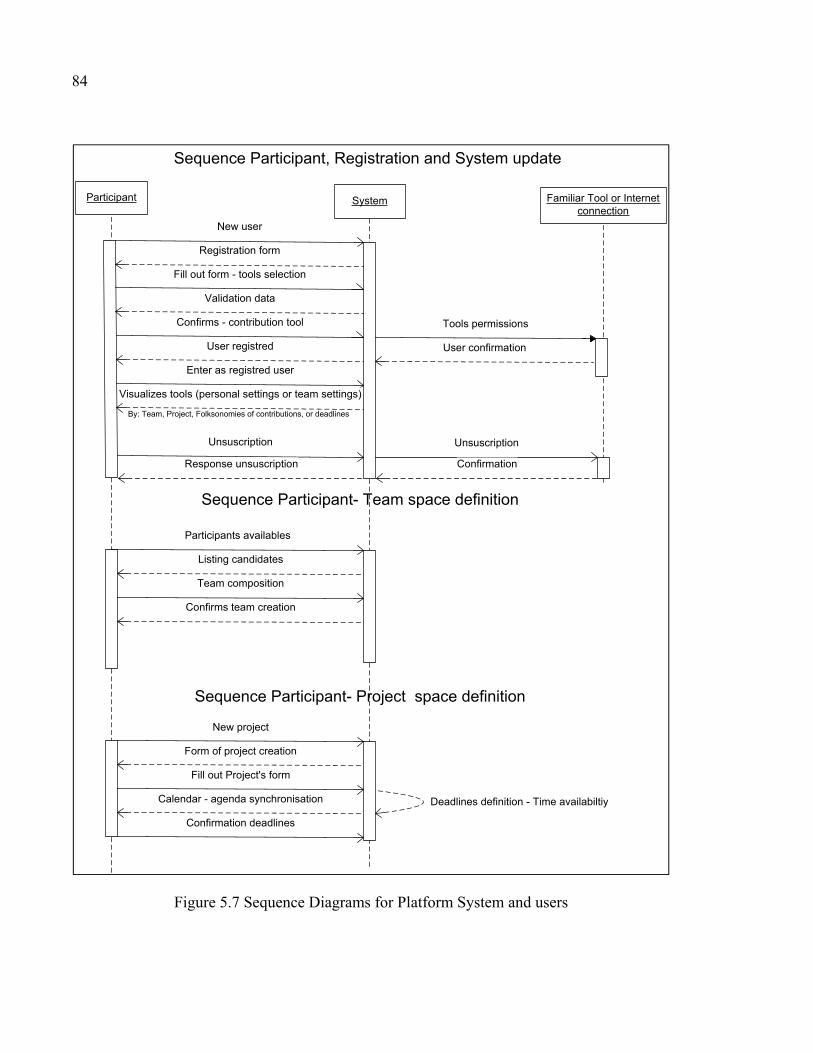
84
Figure 5.7 Sequence Diagrams for Platform System and users
Participant System
Registration form
Tools permissions
Sequence Participant, Registration and System update
New user
Fill out form - tools selection
Validation data
Familiar Tool or Internetconnection
User confirmationUser registred
Enter as registred user
Visualizes tools (personal settings or team settings)
Confirms - contribution tool
By: Team, Project, Folksonomies of contributions, or deadlines
Sequence Participant- Team space definition
Participants availables
Listing candidates
Team composition
Confirms team creation
Sequence Participant- Project space definition
New project
Form of project creation
Fill out Project's form
Deadlines definition - Time availabiltiyCalendar - agenda synchronisation
Confirmation deadlines
Unsuscription Unsuscription
ConfirmationResponse unsuscription

85
In Figure 5.8, we observe the function to record and to store the contribution if it is produced
as described above.
Figure 5.8 Sequence Diagram for contribution elaborated in a personal software or tool
5.6 Collaborative Platform Architecture
This section presents the logical architecture structure and the class diagram of the platform.
5.6.1 Classes and static structure of Platform
The static structure of the platform is divided into “packages, components, and their depend-
encies and interfaces” (Eriksson et al., 2004, p. 254). A class is distinguished as it defines a
series of activities that must be structured and organized in order to establish all system inter-
actions. In Figure 5.9, we observe the main classes describing the entire Platform and all
needed interfaces. The relationship is marked with a diamond: a white diamond at the end of
the line means a relationship of association between objects, and a black diamond means an
aggregation relationship. These elements are symbolic messages that do not influence the
systems, but rather, only add information.
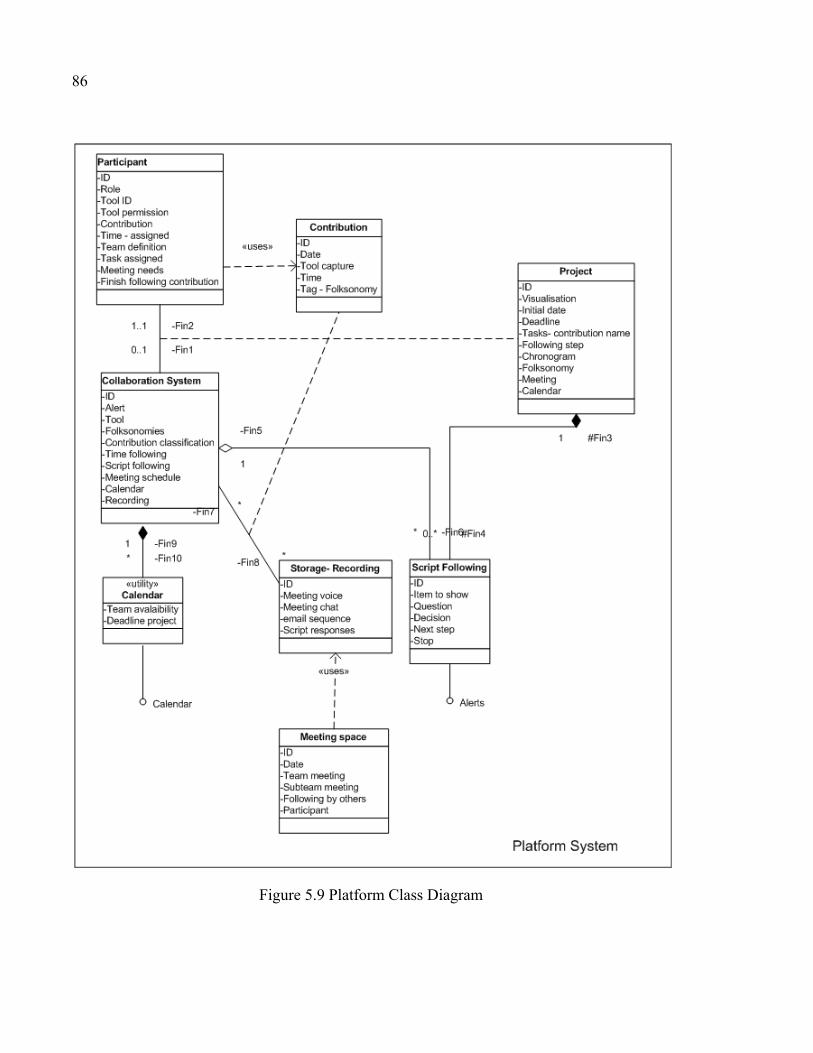
86
Figure 5.9 Platform Class Diagram
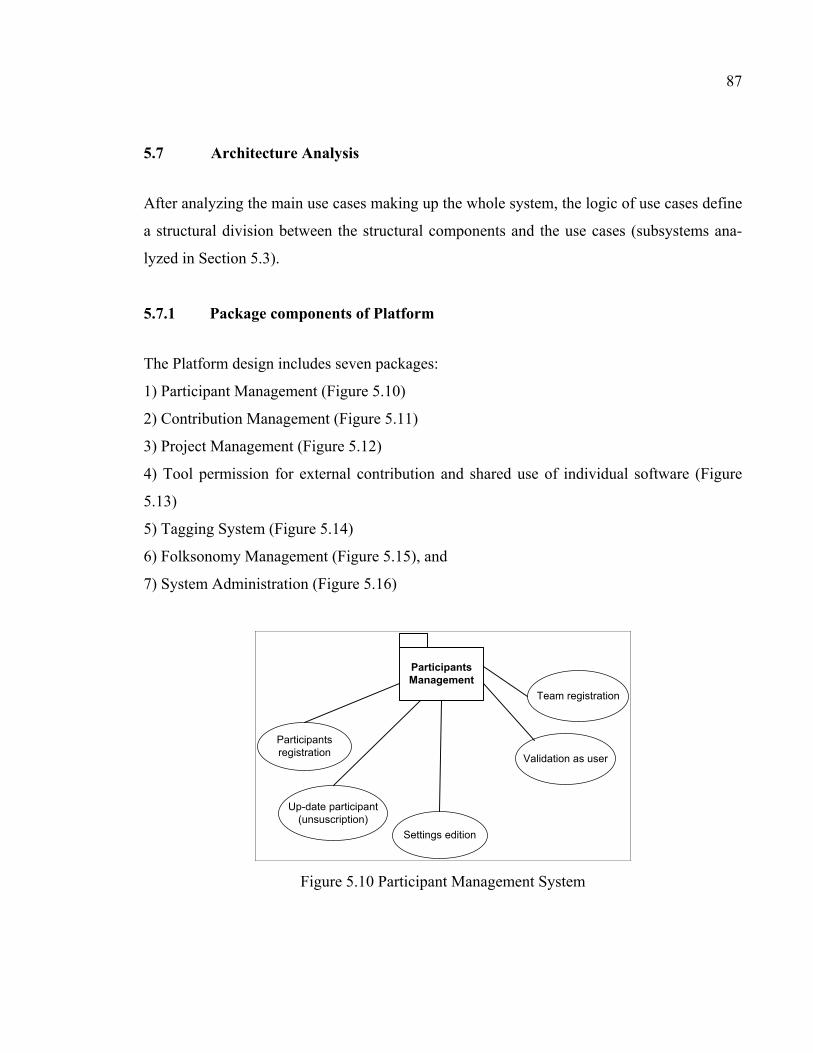
87
5.7 Architecture Analysis
After analyzing the main use cases making up the whole system, the logic of use cases define
a structural division between the structural components and the use cases (subsystems ana-
lyzed in Section 5.3).
5.7.1 Package components of Platform
The Platform design includes seven packages:
1) Participant Management (Figure 5.10)
2) Contribution Management (Figure 5.11)
3) Project Management (Figure 5.12)
4) Tool permission for external contribution and shared use of individual software (Figure
5.13)
5) Tagging System (Figure 5.14)
6) Folksonomy Management (Figure 5.15), and
7) System Administration (Figure 5.16)
Figure 5.10 Participant Management System
Participants Management
Participantsregistration
Up-date participant(unsuscription)
Settings edition
Validation as user
Team registration

88
Figure 5.11 Contribution Management System
Figure 5.12 Project Management System
Figure 5.13 Permissions sharing tool – enhancing external tools

89
Figure 5.14 Tagging System
Figure 5.15 Folksonomy Management System
Figure 5.16 Platform Administration
These packages are articulated by two main actors: user-participants of creative teams and
the Administration System, who can register, record, automatically follow, and store data that
generates an automated project follows-up.

90
5.7.2 Architecture
In the design of the creative collaboration Platform, we propose an architecture based on a
cloud computing system, as shown in Figure 5.17. The platform acts as a cross-platform (de-
scription in Section 6.3) because it integrates web-based applications with desktop software
to enable the accessibility and the flexibility to share personal contributions.
Figure 5.17 Architecture of Collaborative System
91
5.8 Addressing the Requirements of the Platform
The requirements of UML 2 are derived from the analysis of use cases; a requirement “is a
user-specified criterion that a system must satisfy. Taken together, the requirements associat-
ed with a proposed system define the behavior and functionality required by the users of that
system” (Rosenberg and Scott, 1999, p. 122). Different types of requirements exist, including
functional, data, performance, capacity and test (ibid). Requirements must be differentiated
from functions, which are operations of the system or the use cases. For the design of the
Platform, the requirements are given below.
5.8.1 Functional requirements
The functional requirements “drive” the design of the Platform (Eriksson et al., 2004). The
system must be able to perform the following collaborative actions:
• Identification of users and contributions
- Identify users and describe its contributions
• Meeting space and communication tools
- Meet other users and know about their contributions
- Let users produce new information: messages, documents and alerts
- Exchange information between users in synchronous and asynchronous ways
• Capturing contributions (ideas, changes, contributions) in the team space
- Visualize ideas as objects of knowledge
- Capture the contribution (ideas space, ideas evaluation, ideas comments)
- Display the information captured in digital media (post-it or signal)
- Express the evaluation of the contribution

92
• Producing feedback or awareness of collaboration
- Produce teams and space for teamwork (collective contributions)
- Highlight the contribution (ideas, comments, evaluation) of each one to another user
- Visualize the participation of members and the alerts of system
• Following changes and time periods
- Time the process (timeline or deadline)
- Provide an user performance record (quantity of contributions, teams’ participation,
project participation, time spent, use statistics)
• Categorizing information, ideas, contributions
- Create a dynamic of sharing
- Integrate idea content in a Folksonomy
5.8.2 Data and capacity requirements
For data exchange, the system must:
- Be multilingual, and be adapted to personalized language, and all operating systems
- Use plug-ins to work in desktop or cloud mode
- Be compatible with mobile computing
Among capacity requirements, the system must be able to:
- Host small teams (1-5 users) and large teams (more than 5) with synchronous spaces (e-
rooms or Web conference systems) and with asynchronous spaces (chat or sms)
- Store files by user and display information by team
5.8.3 Interface requirements
- Display time and timeline of idea evolution
- Display modifications or changes by each contributor
93
- Display meeting time and deadline of presentation
5.8.4 Security and privacy
- Each user must be identified, as well as their contribution
- Each team space must be private for the team
- Participants must decide with whom to work
- Participants must know that the ideas will be seen or edited by other participants
- Participants must agree to share their contributions
- The system must provide security for all users
5.9 Summary
The Ideality Law is a part of TRIZ methodology that foresights the ideal conditions that a
system has to obtain to respond satisfactory to all users’ request (an ideal state). The Ideality
Law summarizes useful functions of the system (analyzed of the team’s needs) in contrast
with the wasteful or harmful operations; this comparison produces a new approach focus in
the functions that have to be developed for the collaborative platform. This Chapter also pre-
sents the Domain Model of the research problem. The Domain Model delimits the scope of
the platform in three levels: 1) the definition of the interaction among the Informal Network-
ing to acquire unknown knowledge from the community, 2) the need of meetings spaces to
interact with experts, and 3) the exchange of codified knowledge.
The platform is modelled by UML 2, which allows a description of the Knowledge Manage-
ment System that provides support for the idea sharing process, the meetings with external
experts and the interaction with an informal network. UML 2 leads to a simplification of
specifications, and the process prevents errors due to excess information or from exceeding
the scope of the Platform. In the next chapter, we give a detailed presentation of the function-
alities observed in Web 2.0 and Web 3.0, as well as the new functionalities to be developed
to enrich collaboration inside a collaborative platform.


CHAPTER 6
ICT SPECIFICATIONS AND PROTOTYPE DEVELOPMENT
In this chapter, we define the main ICT specifications (obtained from the functional require-
ments in Section 5.7 of UML2 Modeling) that the collaborative platform must provide to
enhance creative collaboration among users in their distributed activities. We compare the
current ICT tools with the new functionalities that should be developed to enable the collabo-
ration and the project follow-up. The new functionalities proposed are: 1) Generating a team
space by free integration, 2) Generating an Idea space (contribution management, evaluation
and follow up, 3) Generating automated functions for project pathway visualization: tagging
system and graphical folksonomy. At the end of this Chapter, we also describe the develop-
ment of the prototype.
6.1 Current collaborative tools in Web 2.0 and Web 3.0
In an early stage of design, some ICT tools are proposed during “electronic brainstorming”
based on computer or software interfaces. In the early nineties, brainstorming sessions took
place in meeting rooms, chats or messaging systems. Currently, some cross-platforms based
on diagramming are used to express ideas in the form of interactive mind-mappings, such as
LucidChart and FreeMind (the content is produced online and is easily shared among team-
mates). Other tools, such as online conceptual maps, for example, including CMaps Tools,
and desktop software like XMind, Brain 7.0 also exist. While such ICT tools allow the com-
munication of ideas, there are however no appropriate following mechanisms to define ad-
vances, changes or why an idea was refused.
In the following paragraphs, we are going to describe other collaborative applications based
in Web 2.0 and web 3.0

96
6.1.1 Collaborative platforms based in Social Media
Social media and the functionalities of Web 2.0 constitute an important tool for information
sharing and collaboration. McLoughlin and Lee (2007) describe the appropriate use of Web
2.0 for collaborative projects or academic purposes. They define the following Web 2.0 func-
tionalities as indispensable for achieving a collaborative project: “searching with search en-
gine, collecting and sharing in social repositories (Flicker, YouTube), exchanging with mail
and chat, using publishing tools (wiki, zoho and Google documents, Vyew and forums), pre-
senting, reflecting and monitoring with co-drawing tools (Vyew, Gliffy), giving tasks, as-
sembling information with blogs”. Based on this interaction, which resembles what happens
on Facebook, some platforms, such as Lumiflow, TeamBox, RedLine and BaseCamp, have
emerged. These enable users to share comments and files through social media, and practices
which are generally embedded in the routines of students and employers. Hendler (2009) af-
firms that it is rather risky to define a radical difference between Web 2.0 and Web 3.0.
However, currently, Web 3.0 incorporates two main functionalities: the first, the integration
of data resources in a Semantic Web, as “key enablers are a maturing infrastructure for inte-
grating Web data resources and the increased use of and support for the languages developed
in the World Wide Web Consortium” (p. 111). The second one is the integration of Semantic
Web language, which “allows for the assertion of relationships between data elements, which
developers can use, via custom code or an emerging toolset, to enhance the [Uniform Re-
source Identifiers] URI-based direct merging of data into a single [Resource Description
Framework] RDF store” (idem).
This capability of integrating data enables the new Web technologies to generate new appli-
cations, such as the Cloud Computing Technology (CCT), “a model for enabling ubiquitous,
convenient, on-demand network access to a shared pool of configurable computing resources
(e.g., networks, servers, storage, applications, and services) that can be rapidly provisioned
and released with minimal management effort or service provider interaction” (Mell and
Tim, 2011, p. 2). The essential characteristics of this technology are “on-demand service,
broad network access, resource pooling, rapid elasticity, customized service” (idem). CCT
97
includes the use of Web applications such as “Software-as-a-service SaaS [e-mail, virtual
desktop, communication, games], Platform-as-a-Service PaaS [Execution runtime, database,
Web server, development tools] or Infrastructure-as-a-service IaaS [virtual machines, servers,
storage, load balancers, network]” (idem, and examples between brackets taken from Wik-
ipedia.org). These cited characteristics of CCT allow this technology to serve as a common
information space available to all teammates.
6.1.2 Current open-collaborative crowdsourcing platforms
Open Innovation models include crowdsourcing-based platforms. New such platforms simul-
taneously support all actors of the innovation process, including designers, stakeholders and
investors distributed around the world. The platforms allow new scientific development and
new sources of interaction for R&D and scientific enterprises (DiPietro, 2012).
“Crowdsourcing may be defined as the act of outsourcing tasks that are traditionally per-
formed by an employee or contractor to an undefined, generally large group of people or
community (a crowd) in the form of an open call. The open call may be issued by the organi-
zation wishing to find a solution to a particular problem or complete a task, or by an open
innovation service provider on behalf of that organization” (Davis, 2011, p. 1). Some exam-
ples of crowdsourcing platforms are InnoCentive.com, OpenIdeo, Challengepost, y2.com,
Topcoder, idea.me, and 10000Ideas. While all these platforms have promising advantages in
external communication and community training, they are however mainly designed for
competition, and as such, do not lay emphasis on collaborative functionalities for sharing or
exchanging ideas between teams. Enterprises use these platforms to search for expertise, post
challenges or present projects to sponsors.
6.2 ICT Specifications in collaborative platforms
For designing collaborative platforms, Germani, Mengoni et Peruzzini (2012a) propose dif-
ferent tools to support collaborative interactions in more advanced project development
(Bititci et al., 2012; Keevil, 1998; Mengoni et al., 2011; Nof, 2007; Wallin et al., 2011). The
following summary presents the main collaborative interaction:

98
“– To provide basic inspection and modeling functions to analyse the product thoroughly (i.e., rotate and manipulate CAD models, zoom, measure specific model items, add or delete some parts) according to CAD-based tools. – To realise real-time collaboration to create a common workspace by exploiting a client–server approach (i.e., shared visualisation, event synchronisation) – To organise, collect, retrieve and share information and data properly (i.e., ac-tivity planning and workflows), managing team structure and roles according to a [Product Life-cycle Management] PLM approach. – To support product evaluation by adopting multiple product representations (i.e., functional product views and interactive Digital Mock-ups (DMUs) and in-tegrating specific software simulation toolkits. – To promote and support decision-making and creative design (i.e., brainstorm-ing and proposing) by adopting Web 2.0 tools. – To allow efficient interaction with different product/process representations and involve team participants in product models with interaction styles like physical prototyping by exploiting recent VR-based technologies and devices to enhance interaction and involvement” (Germani, Mengoni and Peruzzini, 2012a, p. 3)
Nielsen (2012) summarizes the current state of Web 3.0 interactions, analyzes open source
collaborations, and identifies “four powerful patterns that open source collaborations have
used to scale: (1) a relentless commitment to working on a modular basis, finding clever
ways of splitting up the overall task into smaller subtasks; (2) encouraging small contribu-
tions, to reduce entry barriers; (3) allowing easy reuse of earlier work by other people; and
(4) using signaling mechanisms such as scores to help people decide where to direct their
attention” (p. 48). All these Web 3.0 functionalities integrate the information and knowledge
that creative teams need for sharing. As mentioned by above authors, communication tools
are essential to achieve the collaboration; however, we propose to complete the collaboration
process wiht two new ICT spaces:
- The Project pathway: generated when the system tracks and classifies the contribution
of each participant while the team interacts.
- The Personal idea space: generated by adding personal contributions (ideas and
knowledge about the project) that are tagging by the contribution of each participant
around a subject
In this chapter, we summarize the considerations to design new functionalities in Table 6.1.
We will describe the functionalities to be developed in the following sections.

99
Table 6.1 Current technologies of collaboration and new functionalities to implement
Knowledge Ob-jects
Use Cases Classes Packages Current technolo-gies
ICT Specification
1. Problem defi-nition: abstrac-tion of infor-mation to define the new product
Participant Registration
Participant Participant Man-agement
Identification Sys-tem and Log in
Team Regis-tration (Inte-gration)
Collaboration system
Participant Man-agement
Team space (each team give a name)
Meeting space Permission shar-ing tools
eRoom Video conference
2. Information inputs: needs, expectations, dreams 3. Ideas pro-posal: possible ideas that could solve the prob-lem
Idea Space Contribution: ideas and knowledge
Contribution management
Ideas - Contribution
Tagging system
Idea/contribution description Name of idea
Folksonomy Automated script tracking ideas by content or data
4. Defining re-quirements: criteria defini-tion based on initial inputs
Idea and Pro-ject Pathway
Project: contri-bution storage and organisa-tion by a folk-sonomy
Contribution Management
Ideas Contribution Presentation of ideas
Project Man-agement
Task assignation, project planning
External contri-bution
External comments provides by spon-sors and public
Folksonomy Automated script of following ideas
5. Idea elabora-tion: representa-tion of ideas with details to be realized in a real situation
Following the team space
Collaboration system
Project Man-agement
Team space Adding team mem-bers
6. Interactive evaluation: each new element added is as-sessed to ac-complish with all criteria
Calendar Administration System
Calendar Apps
Convention: = Existing technology = Non-existing technology

100
6.2.1 Communication Specifications
One of the most important factors to reach collaboration is communication. Stempfle et Bad-
ke-Schaub (2002) argue that “communication provides a prime access to the thinking and
problem-solving process of design teams”. Human communication has two modalities: ver-
bal and non-verbal. Verbal communication is related to the oral and written language, and
non-verbal communication is related to gestural and graphical language. R&D uses both of
these communication modalities (Jiménez-Narvaez, 2010). Real-time communication is es-
sential for regular meetings and for “tuning up” moments, in which the team has to define
critical aspects of the new product (first ideation stage and pre-definition of a project devel-
opment). Further, there is a need for awareness of the online co-presence feeling, which re-
quires Messaging or Instant Chat and some icons that allow users to be aware of teammate
presence. ICT-mediated communication is also enriched with “emoticons”; an emoticon is
basically non-verbal information presented graphically. They were designed to express the
states of mind or mood of participants. Generally, emoticons are pictograms which give cues
to complete textual information and to put the receptor of the message in context (Walther,
2001). Emoticons are also used to show the role of a participant and the kind of presence in a
virtual space.
ICTs allow two types of communication: synchronous and asynchronous. Synchronous
communication is real-time communication obtained by VoIP (Voice over Internet Protocol)
voice and video streaming (Web Conference) technologies. Asynchronous communication is
related to text messages that are sent with a time gap. Email, chat, discussion forum, com-
ments and blogs are an example of this communication, which that is time-shifted. As men-
tioned in Chapter 3, regarding the research problem, one of the first drawbacks is the lack of
technology to integrate several already available good applications to communicate ideas. In
the following sections, we will analyze the main functionalities needed in designing a collab-
orative ICT platform.

101
6.2.2 Real-time Communication (synchronous)
6.2.2.1 Verbal Communication
- Enable voice emission/reception (Desired need: video screen )
- Enable verbal peer-to-peer interactions
- Enable verbal interactions with the whole team
- Share comments (texts)
6.2.2.2 Graphics
- Sharing whiteboard
- Sharing drawings
6.2.3 Offline communication (asynchronous)
Offline communication is essential for adding personal information and advancing tasks
among members
6.2.3.1 Asynchronous Verbal Communication
- e-Mail (comments)
- Message service
- Chat
- Forum
- Notes (Post-it)
6.2.3.2 Graphics:
- Board or Whiteboard

102
- White pages, graphic files, images, photos or sketches
6.2.4 Sharing knowledge objects (codified knowledge in files and/or contributions)
The members announce when they have an idea: “My idea is”, “I have an idea”, “I think”.
The contributions need to be evident or shown; it is generally an invitation to see-show what
I see or I think.
- Share Web links
- Share files created in standard/specialized software
- Share comments (verbal – dictation or texts)
- Share notes
- Share other elements as photos, videos, renderings, sketches, etc.
6.2.5 Explaining Ideas – contributions visualization
Finally, the ideas appear by work time periods, and are attached to a context (semantic
knowledge or project stage-task).
- Markets, tags or alerts
- Idea description
6.2.6 Idea Evaluation, Questions, Criteria/Restrictions or Decisions
An important part of the collective idea production process is the addition of structured in-
formation or elements to validate the information
- Marking elements for decision (scale matrix for decision evidence)
- Notes or comments
- Agreement tags (emoticons, scale)
- Justification (text, contribution or speech)

103
6.2.7 Ideas space and interface (conceptual space)
Participants miss deadlines or timing, because they are not easily informed of the project
evolution. They need:
- Visualization of ideas (by date or time posted, by author, by project subject or tag)
- Visualization questions in advance
6.2.7.1 Visualization of Idea Evolution pathway
- Visualization changes (changes elaborated)
6.2.7.2 Visualization of Decisions
- Visualization of elaborated/final version
6.2.8 Personalization (personal space, authoring)
The idea-attribution or property seems to be an important factor in contribution. Although
collaboration implies an implicit collective work, the authoring process – idea identification
– is an incentive to participate:
- Idea identification (by author, paternity or ownership)
- Change pathway (by decision-author)
- Questions or misunderstanding (directional from the author to the teammates)
6.2.9 Team space
Absent participants need references and clues to be aware of their team’s responses and task
progress; some important elements that may be used:
- Where we are? Visualization/Deadline alerts
- What’s up? (News/ changes)

104
- What do I have to do? (Assignation tasks)
- When can we talk? (Calendar meetings)
6.3 Dynamic of creative collaboration in a cross-platform
We have completed a review of current communication tools, and now we would describe
the proposed cross-platform and its new funtions. A cross-platform is an embedded system
that has the capacity to support software in a large variety of hardware configurations
(Huifeng and Lijuan, 2010). Popular cross-platforms include Skype® and ooVoo®. They
can be installed on mobile devices (iPod®, smart phones or Android®) and on a desktop
computer. Usually, these applications require the installation of a plug-in, and the user could
find an associated tab for them on their desktop. Cross-platforms also support updates, com-
bining desktop information with cloud information, as is the case with DropBox®. Drop-
Box® has an automated connection between a folder on each user’s desktop and a cloud
folder, which is updated with each new shared file.
The use of a cross-platform can facilitate peer-to-peer or team collaboration, in showing in-
formation captured from the Internet and ideas produced in a familiar application (for each
participant) or obtained through a Web-conference. Each one of these information inputs is a
contribution that must be observed by all teammates. If a contribution is shared, the plug-in
installed enables the “next system” script to codify all the contributions. Automatically, in a
“cloud interface”, each user can observe the track of contributions generated around a sub-
ject. The contributions are classified by ideas, questions, notes, comments and decisions. The
system enhances all these data in a cloud-tagging system that allows the visualization of the
process for each team participant. The participant could then select with whom they want to
share and for how long, thus delimiting the project pathway. All this information can be vis-
ualized on a desktop model, such as a Drive or Google desktop interface or as a cloud page,
similar to DropBox – Web page for managing folders. The basic user interface is similar to
touch screen interfaces – offering a home screen navigation and some buttons to tag contribu-
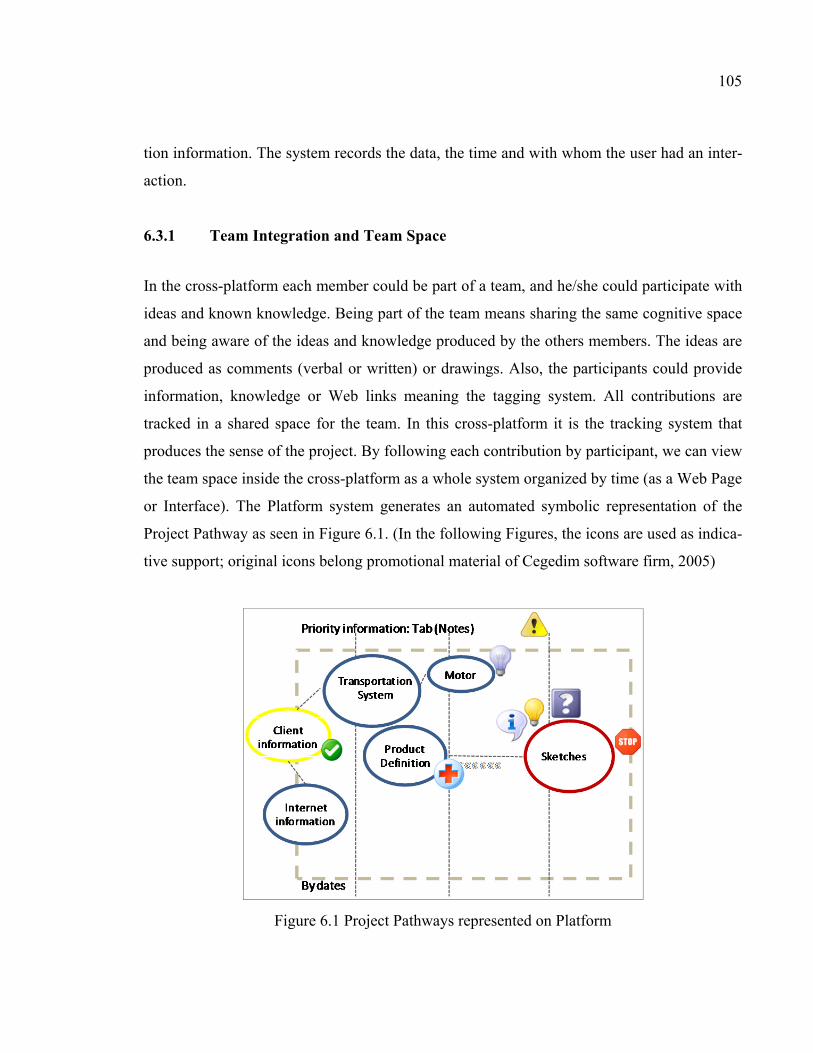
105
tion information. The system records the data, the time and with whom the user had an inter-
action.
6.3.1 Team Integration and Team Space
In the cross-platform each member could be part of a team, and he/she could participate with
ideas and known knowledge. Being part of the team means sharing the same cognitive space
and being aware of the ideas and knowledge produced by the others members. The ideas are
produced as comments (verbal or written) or drawings. Also, the participants could provide
information, knowledge or Web links meaning the tagging system. All contributions are
tracked in a shared space for the team. In this cross-platform it is the tracking system that
produces the sense of the project. By following each contribution by participant, we can view
the team space inside the cross-platform as a whole system organized by time (as a Web Page
or Interface). The Platform system generates an automated symbolic representation of the
Project Pathway as seen in Figure 6.1. (In the following Figures, the icons are used as indica-
tive support; original icons belong promotional material of Cegedim software firm, 2005)
Figure 6.1 Project Pathways represented on Platform

106
Participants should be able to easily identify the part of the project the team is in. Moreover,
in this space, the participants find some clues or alerts to know what the state of the project is
and contribute in specific subject (as well as the priority by deadlines). The size of each cir-
cle corresponds to the number of contributions and the color is shown by priority (yellow -
past, blue - in transit, and red - to do). If a participant/teammate needs more information
about the knowledge and the ideas proposed by their teammates, they can click under an icon
or bullet, which contains information, and they can answer with a comment, as presented in
Figure 6.2. Figure 6.2 also shows a visual example of what is inside the balloons.
Figure 6.2 Deployment by contribution and inside elements
6.3.2 Personal idea space
In this space, the system summarized the priority information that each participant has to
know and their personal contributions. The personal space is formed by each personal contri-
bution (I have an idea or something to show) and the history of contributions (Internet links,
post or files presented to the team). The participant can see the last information or pathway of
the project, as well as the task to do, as a list of “things to do” (see example in Figure 6.3).

107
Figure 6.3 Personal Space Interface
6.3.3 Project Pathway
As example, we could observe in Figure 6.2, the effect of clicking the yellow balloon, the
participant can view the notes, images, sketches or links tagged by the other participants.
Each of these posts could be shared in anonymous mode (no owner identified), or authoring
mode (author identified), according to organizational decisions. The tag also includes the part
of the project and the “key word” assigned to the contribution. Figure 6.2 contains the terms
client information, transport system, and motor. The word that identifies the assignation of
the task or the contribution of a participant and each teammate is considered a “spark” which
was used as the basis for the task or contribution references.
6.4 Enriching collaboration: Graphic Folksonomy and Collaborative Tagging
The use of ICT tools fosters a new enhanced treatment of generated content by a social inter-
action. That is the case of Folksonomy, considered as metadata created gradually by a com-
munity. The metadata is generated by each participant’s information needs, and brings links
or interactions that facilitates collaboration among participants. Sinclair and Cardew-Hall
(2008) affirm that “a key characteristic of the Folksonomy is that it is user created metadata,
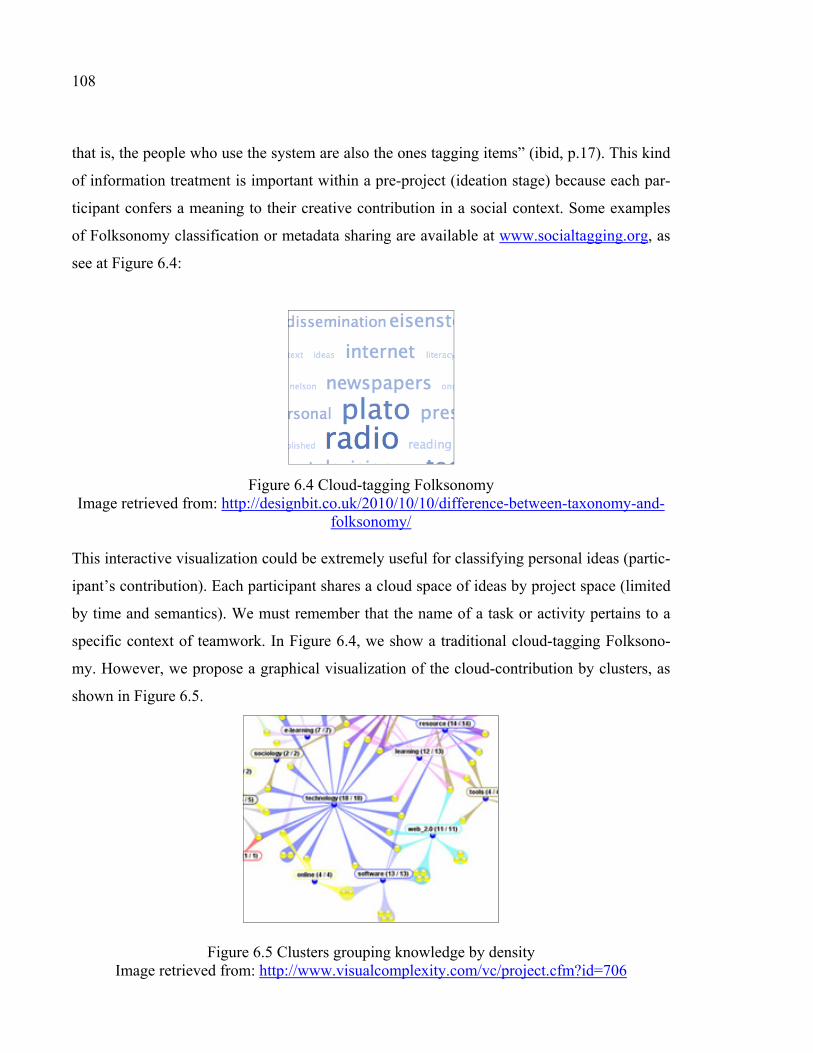
108
that is, the people who use the system are also the ones tagging items” (ibid, p.17). This kind
of information treatment is important within a pre-project (ideation stage) because each par-
ticipant confers a meaning to their creative contribution in a social context. Some examples
of Folksonomy classification or metadata sharing are available at www.socialtagging.org, as
see at Figure 6.4:
Figure 6.4 Cloud-tagging Folksonomy Image retrieved from: http://designbit.co.uk/2010/10/10/difference-between-taxonomy-and-
folksonomy/
This interactive visualization could be extremely useful for classifying personal ideas (partic-
ipant’s contribution). Each participant shares a cloud space of ideas by project space (limited
by time and semantics). We must remember that the name of a task or activity pertains to a
specific context of teamwork. In Figure 6.4, we show a traditional cloud-tagging Folksono-
my. However, we propose a graphical visualization of the cloud-contribution by clusters, as
shown in Figure 6.5.
Figure 6.5 Clusters grouping knowledge by density Image retrieved from: http://www.visualcomplexity.com/vc/project.cfm?id=706

109
6.4.1 Collaborative Tagging for supporting fuzzy production of ideas
In a virtual space, the idea might be created spontaneously by the information provided by
each participant to the team. In a physical space, participants generally use post-it, notes or
sheets of paper to write or draw its ideas. In a virtual space, ideas can be writing, drawing or
tagging. The tag about a new idea generates metadata that has a mean for the team (collabo-
rative executed task). This metadata produces new information that is “recording or posting”
in the system depending on the “name” of the task or the activity provided by each team.
Sometimes, the team gives the same name to the same task or contribution, but sometimes,
each participant aggregates a new name or new variation of the same activity. This element
generates a “fuzzy logic” – when the response is not true or is not false, has a multivariable
response that generates at the same time a fuzzy dynamic in the tagging process.
Collaborative tagging “is the practice of allowing anyone – especially consumers – to freely
attach keywords or tags to content. Collaborative tagging is most useful when there is no-
body in the ‘librarian’ role or there is simply too much content for a single authority to classi-
fy; both of these traits are true of the Web, where collaborative tagging has grown popular”
(Golder and Huberman, 2006, p. 198).
We propose five levels of tagging inside the Platform:
1) Subject worked (client or sponsor posting) – challenge selected by team
2) All concepts produced by subject/challenge/domain
3) All contributions produced by participants in a timeline
4) Participants by project
5) Client that responds by subject to all the teams with the same information
6.4.2 Graphical Folksonomy of ideas production
Previous research about interaction during teamwork (presented in Chapter 4), enables the
understanding that each participant collaborates in a stage and in a different task within a
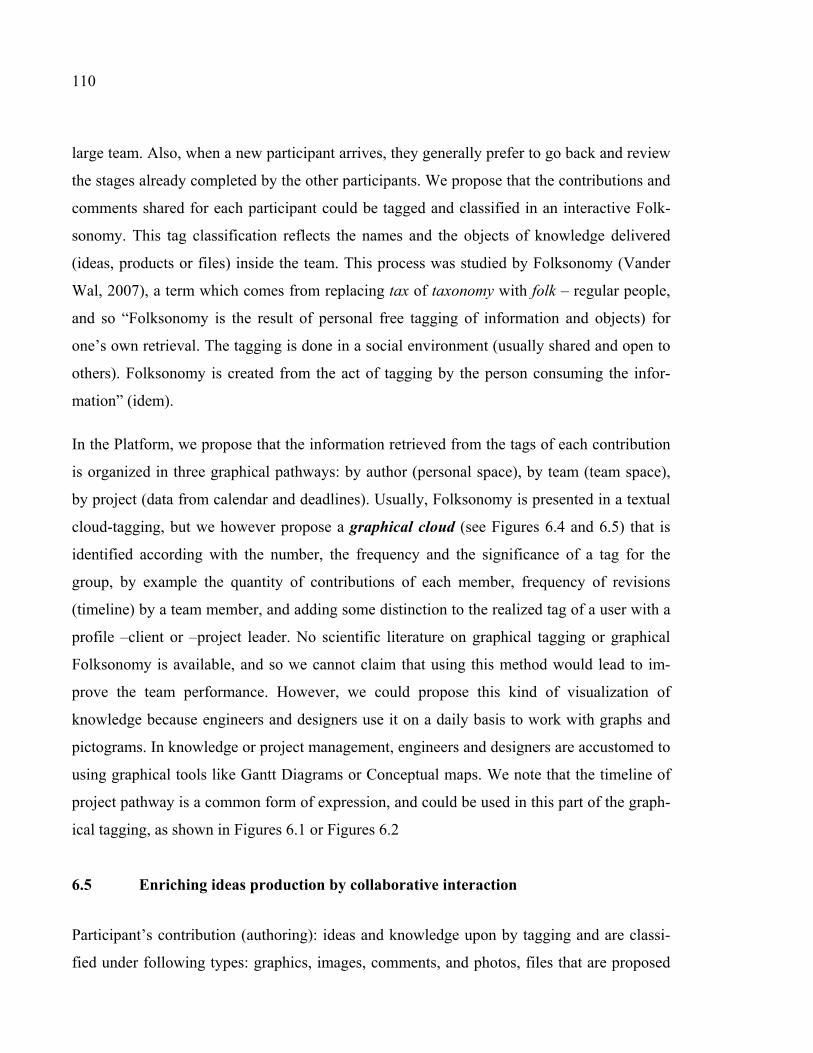
110
large team. Also, when a new participant arrives, they generally prefer to go back and review
the stages already completed by the other participants. We propose that the contributions and
comments shared for each participant could be tagged and classified in an interactive Folk-
sonomy. This tag classification reflects the names and the objects of knowledge delivered
(ideas, products or files) inside the team. This process was studied by Folksonomy (Vander
Wal, 2007), a term which comes from replacing tax of taxonomy with folk – regular people,
and so “Folksonomy is the result of personal free tagging of information and objects) for
one’s own retrieval. The tagging is done in a social environment (usually shared and open to
others). Folksonomy is created from the act of tagging by the person consuming the infor-
mation” (idem).
In the Platform, we propose that the information retrieved from the tags of each contribution
is organized in three graphical pathways: by author (personal space), by team (team space),
by project (data from calendar and deadlines). Usually, Folksonomy is presented in a textual
cloud-tagging, but we however propose a graphical cloud (see Figures 6.4 and 6.5) that is
identified according with the number, the frequency and the significance of a tag for the
group, by example the quantity of contributions of each member, frequency of revisions
(timeline) by a team member, and adding some distinction to the realized tag of a user with a
profile –client or –project leader. No scientific literature on graphical tagging or graphical
Folksonomy is available, and so we cannot claim that using this method would lead to im-
prove the team performance. However, we could propose this kind of visualization of
knowledge because engineers and designers use it on a daily basis to work with graphs and
pictograms. In knowledge or project management, engineers and designers are accustomed to
using graphical tools like Gantt Diagrams or Conceptual maps. We note that the timeline of
project pathway is a common form of expression, and could be used in this part of the graph-
ical tagging, as shown in Figures 6.1 or Figures 6.2
6.5 Enriching ideas production by collaborative interaction
Participant’s contribution (authoring): ideas and knowledge upon by tagging and are classi-
fied under following types: graphics, images, comments, and photos, files that are proposed
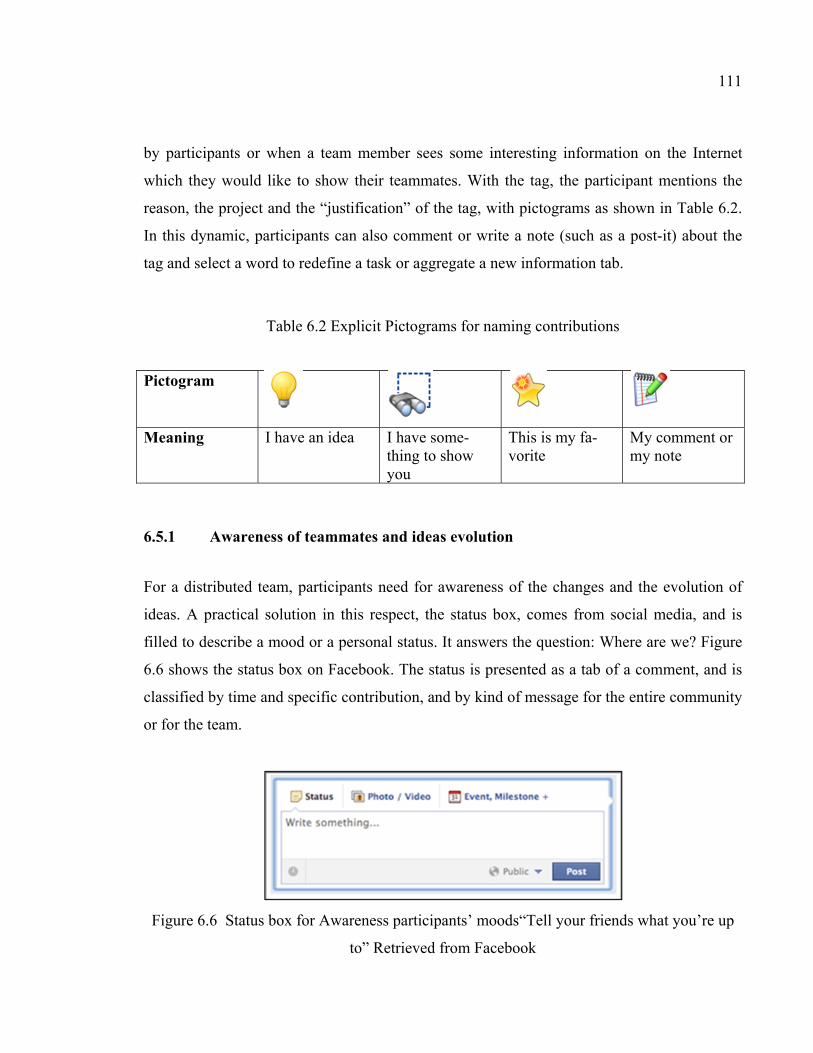
111
by participants or when a team member sees some interesting information on the Internet
which they would like to show their teammates. With the tag, the participant mentions the
reason, the project and the “justification” of the tag, with pictograms as shown in Table 6.2.
In this dynamic, participants can also comment or write a note (such as a post-it) about the
tag and select a word to redefine a task or aggregate a new information tab.
Table 6.2 Explicit Pictograms for naming contributions
Pictogram
Meaning I have an idea I have some-thing to show you
This is my fa-vorite
My comment or my note
6.5.1 Awareness of teammates and ideas evolution
For a distributed team, participants need for awareness of the changes and the evolution of
ideas. A practical solution in this respect, the status box, comes from social media, and is
filled to describe a mood or a personal status. It answers the question: Where are we? Figure
6.6 shows the status box on Facebook. The status is presented as a tab of a comment, and is
classified by time and specific contribution, and by kind of message for the entire community
or for the team.
Figure 6.6 Status box for Awareness participants’ moods“Tell your friends what you’re up
to” Retrieved from Facebook
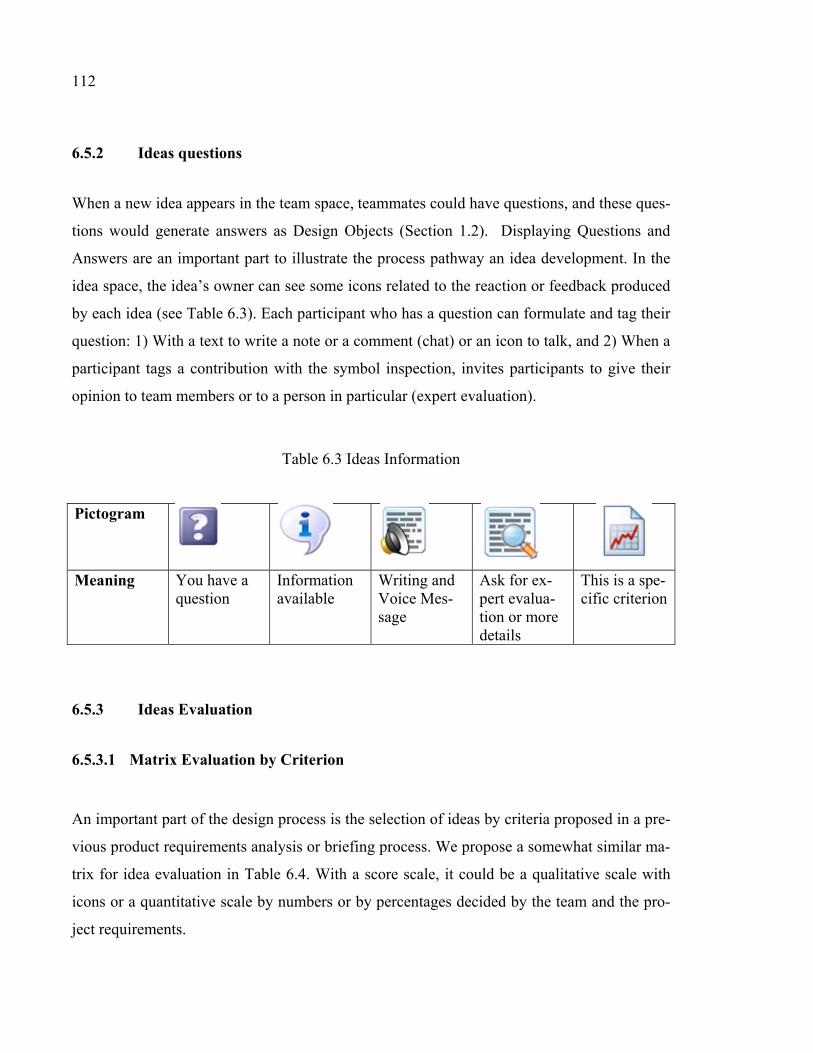
112
6.5.2 Ideas questions
When a new idea appears in the team space, teammates could have questions, and these ques-
tions would generate answers as Design Objects (Section 1.2). Displaying Questions and
Answers are an important part to illustrate the process pathway an idea development. In the
idea space, the idea’s owner can see some icons related to the reaction or feedback produced
by each idea (see Table 6.3). Each participant who has a question can formulate and tag their
question: 1) With a text to write a note or a comment (chat) or an icon to talk, and 2) When a
participant tags a contribution with the symbol inspection, invites participants to give their
opinion to team members or to a person in particular (expert evaluation).
Table 6.3 Ideas Information
Pictogram
Meaning You have a question
Information available
Writing and Voice Mes-sage
Ask for ex-pert evalua-tion or more details
This is a spe-cific criterion
6.5.3 Ideas Evaluation
6.5.3.1 Matrix Evaluation by Criterion
An important part of the design process is the selection of ideas by criteria proposed in a pre-
vious product requirements analysis or briefing process. We propose a somewhat similar ma-
trix for idea evaluation in Table 6.4. With a score scale, it could be a qualitative scale with
icons or a quantitative scale by numbers or by percentages decided by the team and the pro-
ject requirements.

113
Table 6.4 Ideas Evaluation Matrix
Ideas Description metrics
Idea 1
Idea 2
Idea 3
Criterion 1 Innovation index (no similar object in
market)
Num-
ber/Icons
Criterion 2 Technology Advantages
Criterion 3 Cost and Benefits
Criterion 4 Ecological Aspects
Criterion 5 Audience Impact and Presentation
6.5.3.2 Ideas Selection Display
One special thing participants need after posting or expressing a contribution is to know the
opinion of their teammates and obtain feedback. This feedback process can serve as an incen-
tive for new ideas and collaborative changes. Table 6.5 shows a proposal for main comments,
such as congratulations, notes, addition of new ideas, constraints or requirements, to be in-
cluded in the feedback.
Table 6.5 Idea Selection Pictograms
Pictogram
Meaning Selected idea Some comments or notes about my perception
Addition of ide-as
Constraints or requirements
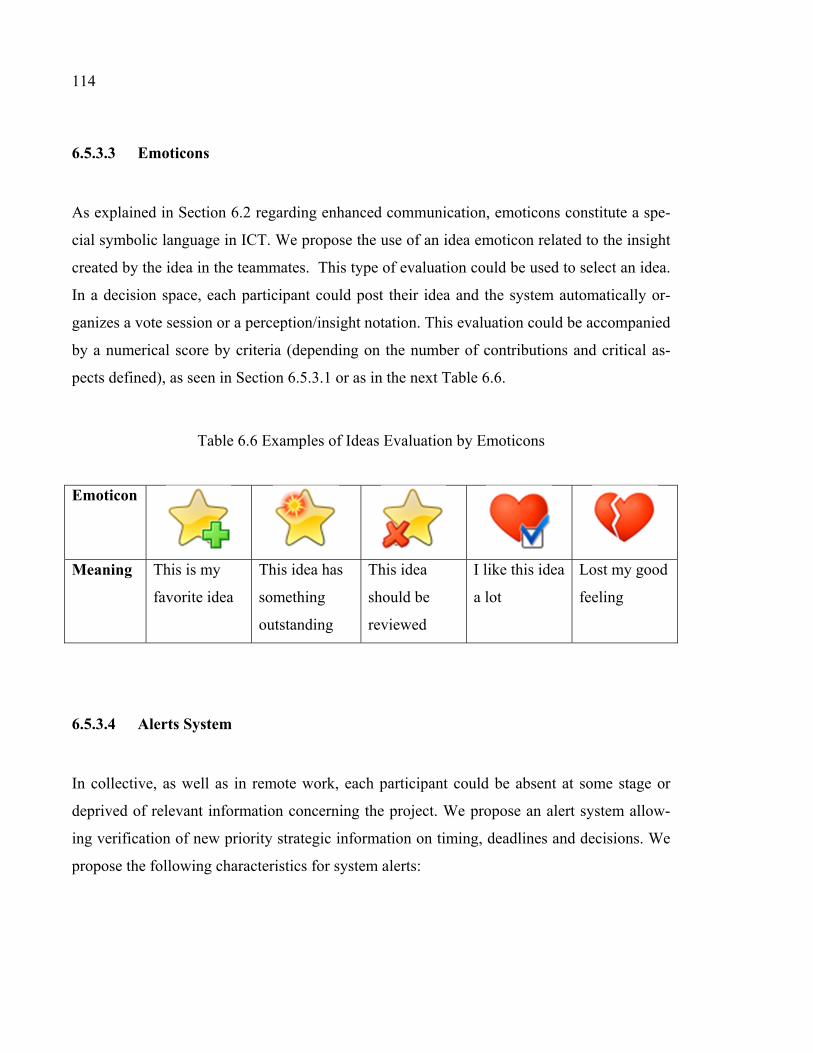
114
6.5.3.3 Emoticons
As explained in Section 6.2 regarding enhanced communication, emoticons constitute a spe-
cial symbolic language in ICT. We propose the use of an idea emoticon related to the insight
created by the idea in the teammates. This type of evaluation could be used to select an idea.
In a decision space, each participant could post their idea and the system automatically or-
ganizes a vote session or a perception/insight notation. This evaluation could be accompanied
by a numerical score by criteria (depending on the number of contributions and critical as-
pects defined), as seen in Section 6.5.3.1 or as in the next Table 6.6.
Table 6.6 Examples of Ideas Evaluation by Emoticons
Emoticon
Meaning This is my
favorite idea
This idea has
something
outstanding
This idea
should be
reviewed
I like this idea
a lot
Lost my good
feeling
6.5.3.4 Alerts System
In collective, as well as in remote work, each participant could be absent at some stage or
deprived of relevant information concerning the project. We propose an alert system allow-
ing verification of new priority strategic information on timing, deadlines and decisions. We
propose the following characteristics for system alerts:

115
6.5.3.5 Priority Information Needed
Table 6.7 shows some examples of pictograms used to express possible information needs
among participants. Specifically, we have notes, restrictions, constraints or very helpful or
priority information for advancing the project. The participant could mark an alert to be dis-
played when something requiring priority sharing is present.
Table 6.7 Priority Information Needs
Pictogram
Meaning Constraints to review
New priority information
Priority need Risk of stopping the project
Moreover, other alerts could be available, related to the project advancement, including:
1) Changes in the project subject selection
2) The assessment (evaluation) of concepts
3) Decision to take or to ask to others
4) Questions to be asked or answered to clients
6.6 Summarizing of objects of knowledge in a Global Team Space
Figure 6.7 presents a mock-up of the platform interface. The mock-up represents a team
space interface. It integrates a few functionalities into a project pathway (in a timeline) and
ideas evolution (semantic context). Moreover, in the center, we have an overview of all
teammate contributions. In the personal space, each member could see their personal contri-
bution ideas, personal alerts and personal comments (sent and received).

116
Figure 6.7 Global Project advance interface
6.7 Deployment in the Platform Prototype
The prototype was developed by Clément Jacquot (2012) during his internship at École de
technologie supérieure (Winter-Summer, 2012). In the prototype, the packages of the cross-
platform proposed as ideal solution described in Chapter 5, Section 5.7, were adapted by
technical constraints and high cost of development to a PHP (Personal Home Page, better
known as Hypertext Preprocessor) System.
The Prototype was implemented as a Web Content Management System (WCMS), a “soft-
ware system that provides website authoring, collaboration, and administration tools de-
signed to allow users with little knowledge of Web programming languages or markup lan-
guages to create and manage website content with relative ease” (Wikipedia, 2012). More
than 75% of Web applications are developed in PHP language including recognized applica-
tions such as Facebook, Moodle or Wordpress (ibid). The Platform Prototype was developed
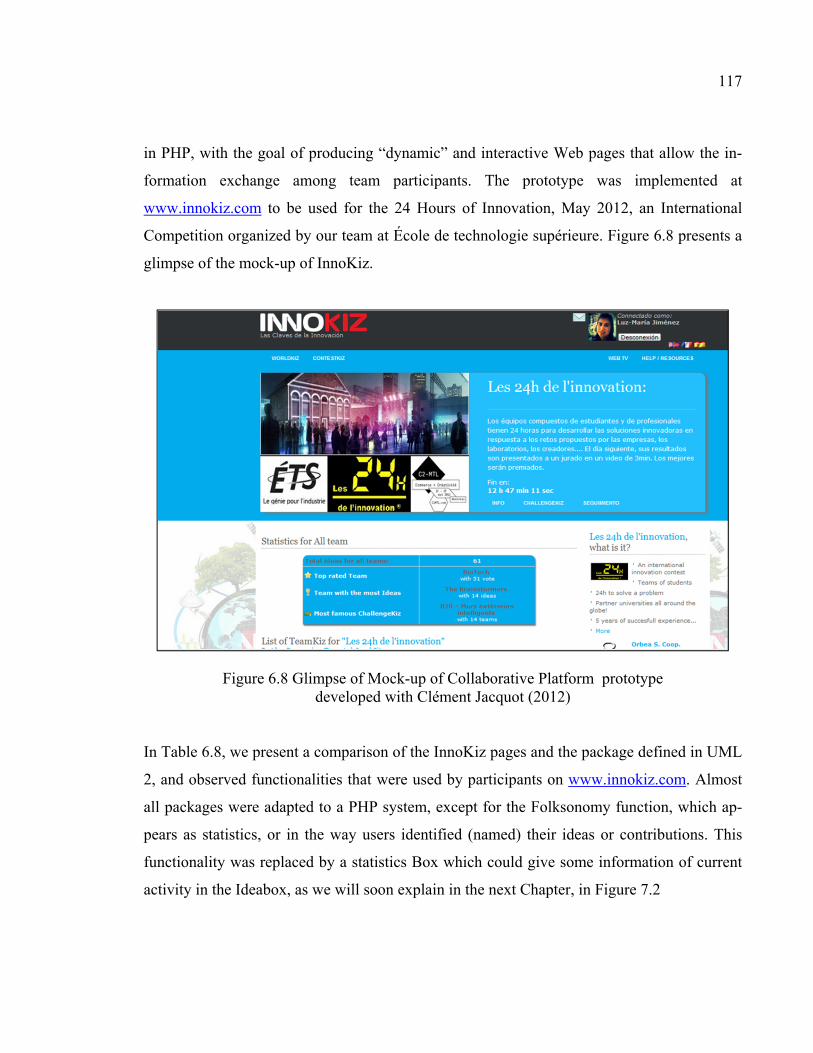
117
in PHP, with the goal of producing “dynamic” and interactive Web pages that allow the in-
formation exchange among team participants. The prototype was implemented at
www.innokiz.com to be used for the 24 Hours of Innovation, May 2012, an International
Competition organized by our team at École de technologie supérieure. Figure 6.8 presents a
glimpse of the mock-up of InnoKiz.
Figure 6.8 Glimpse of Mock-up of Collaborative Platform prototype developed with Clément Jacquot (2012)
In Table 6.8, we present a comparison of the InnoKiz pages and the package defined in UML
2, and observed functionalities that were used by participants on www.innokiz.com. Almost
all packages were adapted to a PHP system, except for the Folksonomy function, which ap-
pears as statistics, or in the way users identified (named) their ideas or contributions. This
functionality was replaced by a statistics Box which could give some information of current
activity in the Ideabox, as we will soon explain in the next Chapter, in Figure 7.2

118
Table 6.8 Comparison of use cases proposed in UML 2 and Innokiz Prototype
Modeling in UML 2 Task realized in Prototype Platform Innokiz
Packages n Task report-ed
Task Frequency Used Profile
1. Participant Management
2403 Registration; Data provided CV
Completing a form Editing the Worldkiz page
Once at beginning
Yes User
882 Team creation Teamkiz crea-tion
Once for team
Yes User
40 Industrial challenges
Description of challenge
Once for industrial
Yes User - industrial
2. Contribution Management
135 Team created Team integra-tion space
Once for team
Yes User
110 Proposed Idea Ideabox Fuzzy Yes User
47 Team’s con-tribution
Private com-ments in team space
Fuzzy Yes User
3. Project Management
-0- Timing – Pro-ject delay
Alerts (com-ments)
(N/A) N/A System
110 Idea evalua-tion
Quantitative evaluation
Fuzzy No User - industrial
4. Tool permission
Using resume or social me-dia
Linked accounts (Sharplinker)
Once Yes System
5. Tagging system
135 Naming ideas Ideabox (name ideas)
Each time a new idea is proposed
Yes User
110 Criteria and emoticons
Ideabox (judg-ing ideas)
Each time a new idea is proposed
Yes User
6. Folksonomy management
0 N/A N/A
7. Administra-tion of system
114 Users ques-tions
Ques-tions/Responses
Fuzzy Yes System
47993
Dynamics Comments Compe-tence delay
Yes Admin
N/A Maintenance De-lete/aggregate information
Compe-tence tim-ing
Yes Admin
119
6.8 Summary
Some of the main functionalities described in this chapter are related to the transformation of
tacit knowledge of an idea (contribution) into an explicit knowledge obtained by interaction
among teammates. Each idea or comment is an object of knowledge, which constitutes a part
of a whole system.
A cross-platform is proposed to produce a comprehensible KMS. This representation is pos-
sible when participants communicate their ideas and when they share information, comments
and decision to nourish the idea in a complete creative process. In a collaborative creative
process, the two ideas generation and evaluation directions are complementary.
During the study of 24H teams, it was observed that a very important part of interaction
among teammates was related to Internet browsing and information search. We propose that
this interaction could be facilitated by a cross-platform allowing the easy capture of Internet
links or of the information pathway.
We further propose that this cross-platform should track ideas by participants (authoring),
time and semantic content. Also, the platform proposal enhances the collaboration with the
tagging and the automated Folksonomy that is generated by the interaction among teammates
in a cloud space. The system records the ideas, and tracks the ownership and the time in the
project execution.
In this Chapter, it was described the deployment of the PHP prototype –that adopts some new
functionalities proposed in the modeling step (Chapter 5), such as: Team integration by sub-
ject, ideas’ production and evaluation, the use of emoticons to judge an idea, and the space to
adding comments or messages from external partner or community. These functionalities will
be tested in the next chapter.

CHAPTER 7
PLATFORM PROTOTYPE TESTING
In this chapter, we describe how we tested the Platform Prototype, by means of a UML 2
testing: validation of use cases by user’s acceptance and the task analysis method. We test the
main functionalities and creative collaboration use cases described in Chapter 5. These ele-
ments were partially implemented in a Web Platform prototype, www.innokiz.com.
7.1 Study Description
We focus the study on descriptive statistics obtained in the use of the prototype and the func-
tionalities proposed in Chapter 5 and the specifications of Chapter 6. This study was realized
during the 5th 24H competition which took place at ÉTS in May 22 and 23, 2012 in partner-
ship with C2MTL (Commerce+Creativity) event organized by SidLee – one of the most im-
portant advertising enterprises in Canada). It involved 17 sites distributed across all conti-
nents, and sponsored by more than 10 enterprises (sponsors of creative challenges). The
teams were challenged to come up with an innovative solution to a problem presented in a
three-minute video, and were then assessed by academics and manufacturers.
7.1.1 Subjects
InnoKiz supported almost 2403 registered users from 46 countries. 882 participants worked
online within the platform (teams and site location are in Appendix II). Following an Ethical
Plan approved by the ÉTS Ethical Review Board, we invited all the 24H participants to sign
an Acceptance form and respond to nine online questionnaires about creative activities and
the use of the Platform (see Appendix I). 267 participants agreed to participate in the re-
search, and their professional training was distributed as follows in Table 7.1.
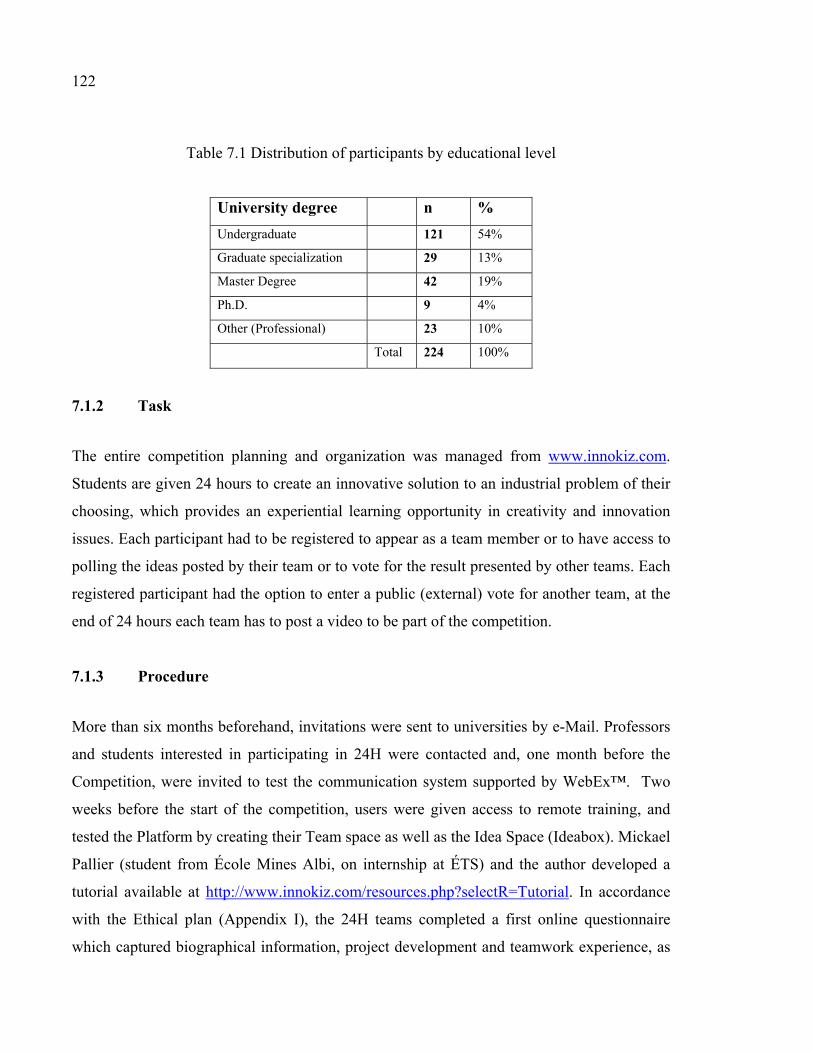
122
Table 7.1 Distribution of participants by educational level
University degree n %
Undergraduate 121 54%
Graduate specialization 29 13%
Master Degree 42 19%
Ph.D. 9 4%
Other (Professional) 23 10%
Total 224 100%
7.1.2 Task
The entire competition planning and organization was managed from www.innokiz.com.
Students are given 24 hours to create an innovative solution to an industrial problem of their
choosing, which provides an experiential learning opportunity in creativity and innovation
issues. Each participant had to be registered to appear as a team member or to have access to
polling the ideas posted by their team or to vote for the result presented by other teams. Each
registered participant had the option to enter a public (external) vote for another team, at the
end of 24 hours each team has to post a video to be part of the competition.
7.1.3 Procedure
More than six months beforehand, invitations were sent to universities by e-Mail. Professors
and students interested in participating in 24H were contacted and, one month before the
Competition, were invited to test the communication system supported by WebEx™. Two
weeks before the start of the competition, users were given access to remote training, and
tested the Platform by creating their Team space as well as the Idea Space (Ideabox). Mickael
Pallier (student from École Mines Albi, on internship at ÉTS) and the author developed a
tutorial available at http://www.innokiz.com/resources.php?selectR=Tutorial. In accordance
with the Ethical plan (Appendix I), the 24H teams completed a first online questionnaire
which captured biographical information, project development and teamwork experience, as
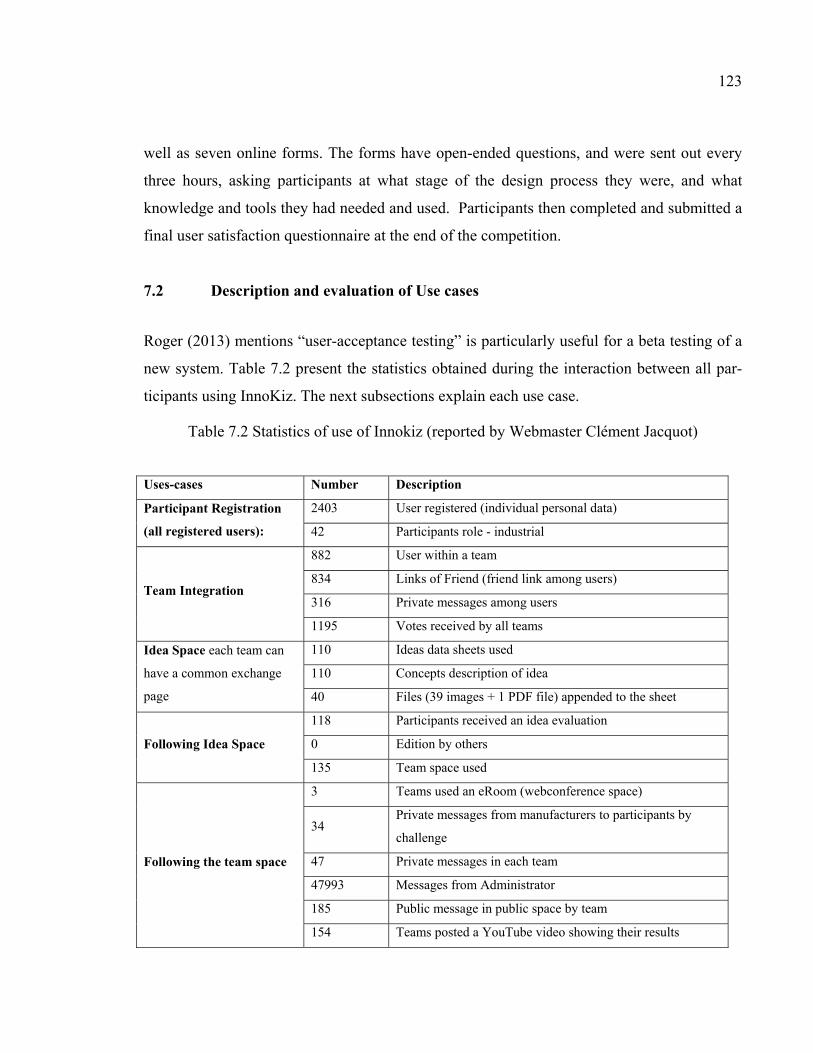
123
well as seven online forms. The forms have open-ended questions, and were sent out every
three hours, asking participants at what stage of the design process they were, and what
knowledge and tools they had needed and used. Participants then completed and submitted a
final user satisfaction questionnaire at the end of the competition.
7.2 Description and evaluation of Use cases
Roger (2013) mentions “user-acceptance testing” is particularly useful for a beta testing of a
new system. Table 7.2 present the statistics obtained during the interaction between all par-
ticipants using InnoKiz. The next subsections explain each use case.
Table 7.2 Statistics of use of Innokiz (reported by Webmaster Clément Jacquot)
Uses-cases Number Description
Participant Registration
(all registered users):
2403 User registered (individual personal data)
42 Participants role - industrial
Team Integration
882 User within a team
834 Links of Friend (friend link among users)
316 Private messages among users
1195 Votes received by all teams
Idea Space each team can
have a common exchange
page
110 Ideas data sheets used
110 Concepts description of idea
40 Files (39 images + 1 PDF file) appended to the sheet
Following Idea Space
118 Participants received an idea evaluation
0 Edition by others
135 Team space used
Following the team space
3 Teams used an eRoom (webconference space)
34 Private messages from manufacturers to participants by
challenge
47 Private messages in each team
47993 Messages from Administrator
185 Public message in public space by team
154 Teams posted a YouTube video showing their results
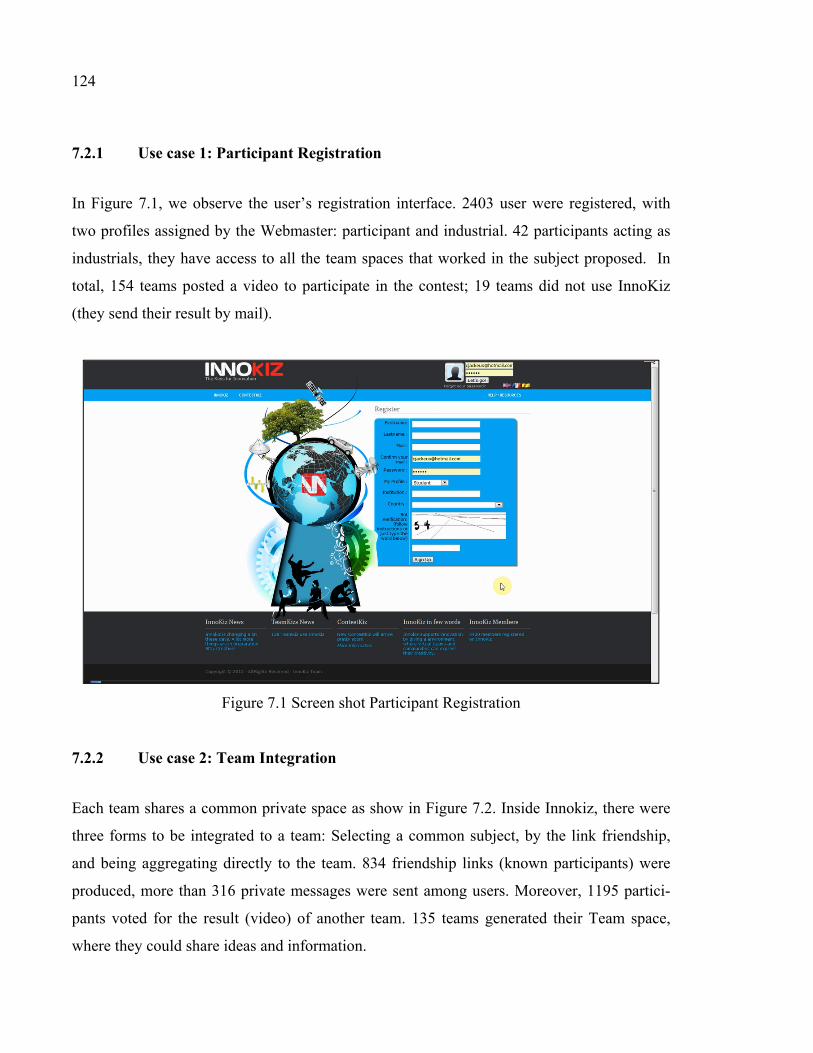
124
7.2.1 Use case 1: Participant Registration
In Figure 7.1, we observe the user’s registration interface. 2403 user were registered, with
two profiles assigned by the Webmaster: participant and industrial. 42 participants acting as
industrials, they have access to all the team spaces that worked in the subject proposed. In
total, 154 teams posted a video to participate in the contest; 19 teams did not use InnoKiz
(they send their result by mail).
Figure 7.1 Screen shot Participant Registration
7.2.2 Use case 2: Team Integration
Each team shares a common private space as show in Figure 7.2. Inside Innokiz, there were
three forms to be integrated to a team: Selecting a common subject, by the link friendship,
and being aggregating directly to the team. 834 friendship links (known participants) were
produced, more than 316 private messages were sent among users. Moreover, 1195 partici-
pants voted for the result (video) of another team. 135 teams generated their Team space,
where they could share ideas and information.

125
Figure 7.2 Screen shot of Team Space
7.2.3 Use case 3: Idea space
One particular original feature of InnoKiz is the Idea space; it corresponds to the “IdeaBox”.
We use this page as an indicator of acceptance of this use case by the teams. We see that 154
teams posted their results, 135 registered users used the functionality and some of these
teams use the IdeaBox. In the IdeaBox section, teams could post and share their ideas in the
form of an information sheet (as shown in Figure 7.3).
In the IdeaBox teams published their ideas, 110 idea sheets were presented as shown in Table
7.3. This functionality was used by 29 (21%) out of the 135 participating teams. Six virtual
teams (17%) and 23 localized (83%). Teams were free to name or describe their ideas. There
was more fluidity in the number of ideas by localized teams (mean of 3.96) and less for vir-
tual teams (mean of 3.17).
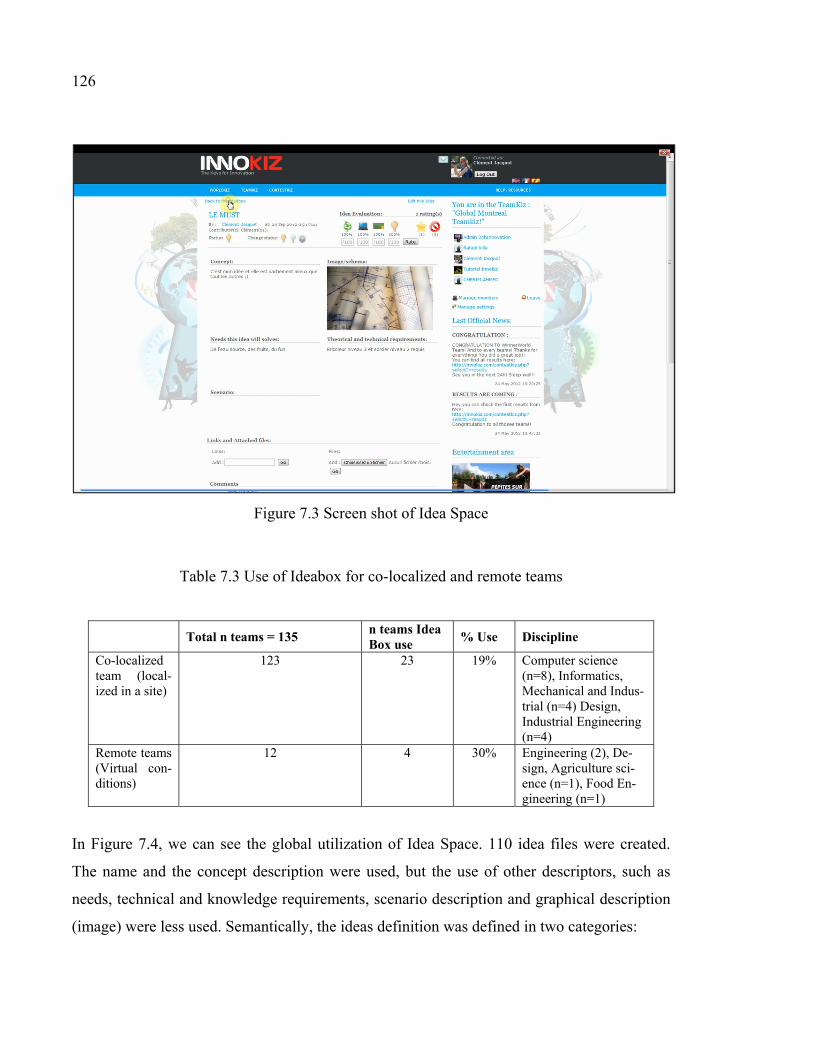
126
Figure 7.3 Screen shot of Idea Space
Table 7.3 Use of Ideabox for co-localized and remote teams
Total n teams = 135
n teams Idea Box use
% Use Discipline
Co-localized team (local-ized in a site)
123 23 19% Computer science (n=8), Informatics, Mechanical and Indus-trial (n=4) Design, Industrial Engineering (n=4)
Remote teams (Virtual con-ditions)
12 4 30% Engineering (2), De-sign, Agriculture sci-ence (n=1), Food En-gineering (n=1)
In Figure 7.4, we can see the global utilization of Idea Space. 110 idea files were created.
The name and the concept description were used, but the use of other descriptors, such as
needs, technical and knowledge requirements, scenario description and graphical description
(image) were less used. Semantically, the ideas definition was defined in two categories:

127
1) Description of parts of product to design, for example, screen, gloves, monitor, etc., or 2)
Knowledge fields of product to design, for example, energy, eco-efficiency, transport system,
etc.
Figure 7.4 General Use description of Collaborative Tagging of Ideas in IdeaBox
The use of Platform among co-localized teams would seem to be influenced by the discipline
of their participants: 50% (n=9) were computer science students, while the others were me-
chanical and industrial designers. In the case of remote teams, the sample was not big enough
to demonstrate that it was a reason for using Innokiz; however, in the qualitative evaluation,
these teams found InnoKiz useful for sharing ideas in the early design stage (see Section 8.3).
7.2.4 Use case 4: Following ideas
This use case was evaluated by the possibility to evaluate or to edit an idea of a teammate.
During the project time, 118 participants evaluated an idea posted by a teammate, and the
system automatically summarized and presented an average of the results of all notations
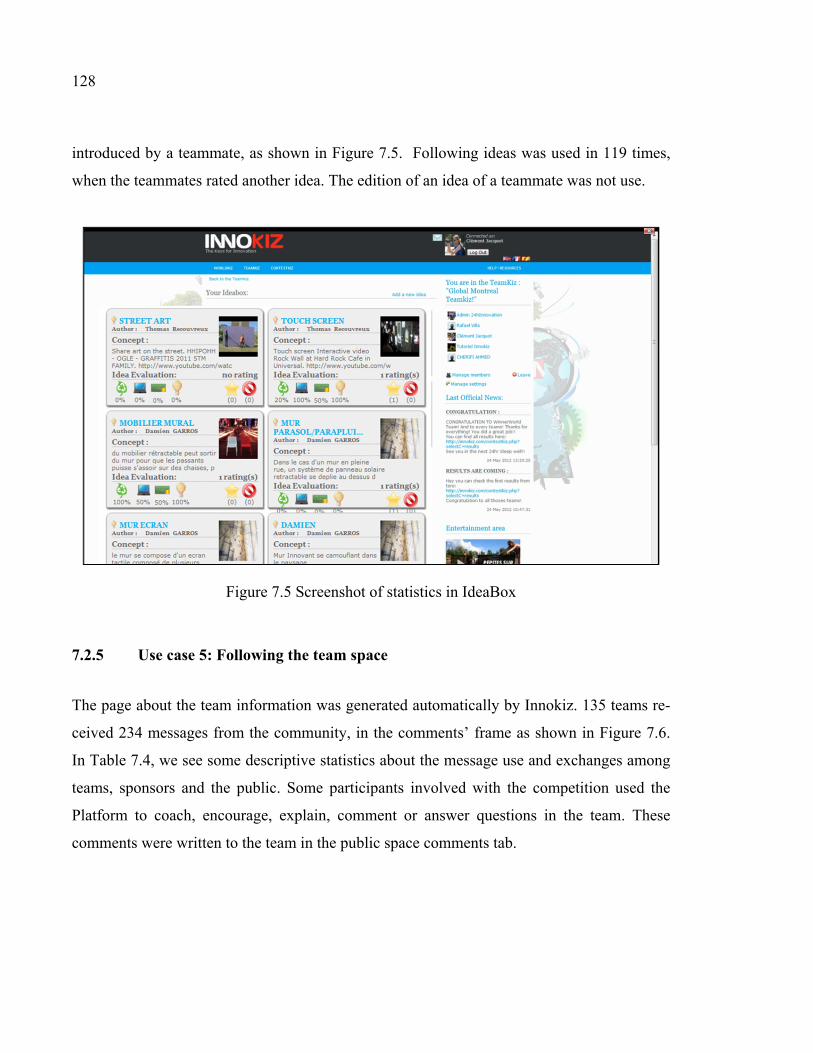
128
introduced by a teammate, as shown in Figure 7.5. Following ideas was used in 119 times,
when the teammates rated another idea. The edition of an idea of a teammate was not use.
Figure 7.5 Screenshot of statistics in IdeaBox
7.2.5 Use case 5: Following the team space
The page about the team information was generated automatically by Innokiz. 135 teams re-
ceived 234 messages from the community, in the comments’ frame as shown in Figure 7.6.
In Table 7.4, we see some descriptive statistics about the message use and exchanges among
teams, sponsors and the public. Some participants involved with the competition used the
Platform to coach, encourage, explain, comment or answer questions in the team. These
comments were written to the team in the public space comments tab.

129
Figure 7.6 Use case following Team Space
In Table 7.4 and Figure 7.7, we see the distribution of public comments to the 24H teams; the
main topics are subject explanation (25%), when sponsors or coaches gave more information
about their problem. Also, 24% of the comments were about creativity cues, some partici-
pants from the organization board messages or from sponsors interested in providing some
clues to the teams.
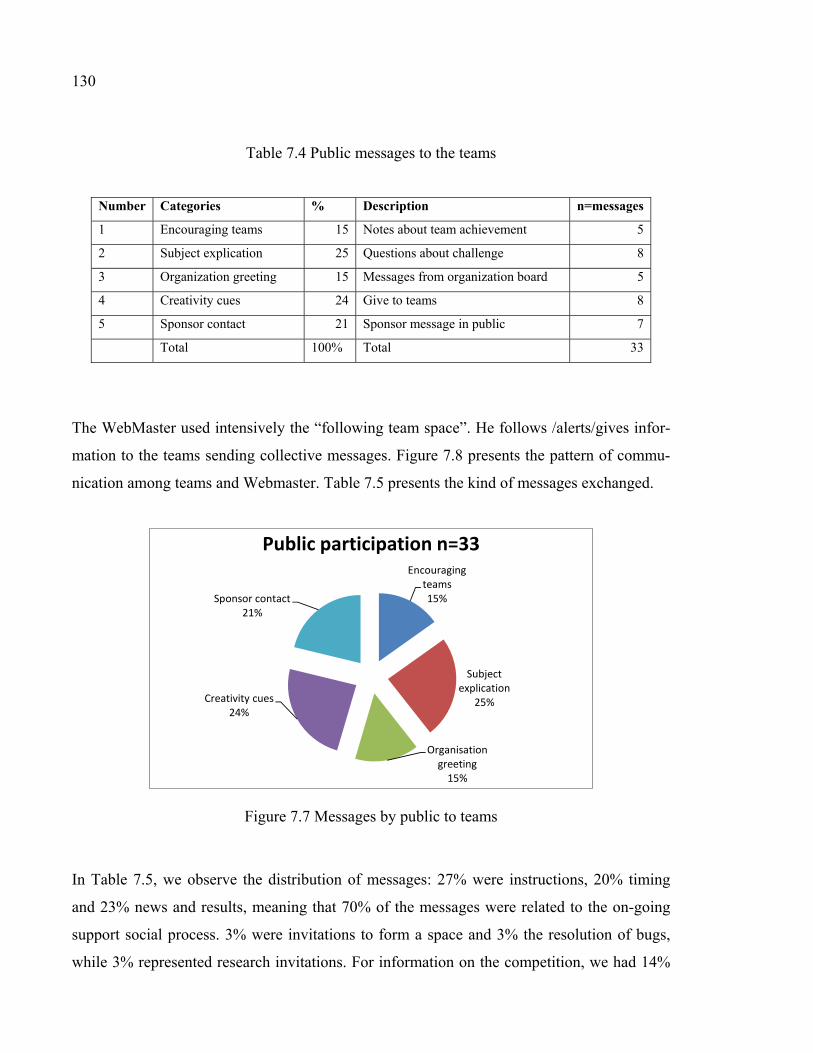
130
Table 7.4 Public messages to the teams
Number Categories % Description n=messages
1 Encouraging teams 15 Notes about team achievement 5
2 Subject explication 25 Questions about challenge 8
3 Organization greeting 15 Messages from organization board 5
4 Creativity cues 24 Give to teams 8
5 Sponsor contact 21 Sponsor message in public 7
Total 100% Total 33
The WebMaster used intensively the “following team space”. He follows /alerts/gives infor-
mation to the teams sending collective messages. Figure 7.8 presents the pattern of commu-
nication among teams and Webmaster. Table 7.5 presents the kind of messages exchanged.
Figure 7.7 Messages by public to teams
In Table 7.5, we observe the distribution of messages: 27% were instructions, 20% timing
and 23% news and results, meaning that 70% of the messages were related to the on-going
support social process. 3% were invitations to form a space and 3% the resolution of bugs,
while 3% represented research invitations. For information on the competition, we had 14%
Encouraging teams15%
Subject explication
25%
Organisation greeting
15%
Creativity cues24%
Sponsor contact21%
Public participation n=33

131
covering votes and jury aspects and 5%, congratulations, and thus almost 19% relating to
information about the competition.
Figure 7.8 Messages exchanged and interaction among users of Platform

132
Table 7.5 Messages sent during the collaboration period
Number Categories % Description n=messages
1 Training 3 Training and tutorial space 1347
2 Instructions 27 Welcome Innokiz 4163
3 WebTV invitation 3650
4 Challengekiz available 1486
5 Instructions of use 1998
6 Invitation twitter @24hinno 1601
7 Research invitation 3 Research invitation 1504
8 Support 3 Bugs/support 1353
9 Timing 20 Timing 3h 1487
10 Timing 9h 1886
11 Timing 15h 4145
12 Timing 21 h (3h left) 2129
13 Results and news 23 First video published 2055
14 Results UTT 2226
15 Results UNS 2354
16 First results ÉTS 2224
17 Result public vote 2355
18 Votes system 14 Votes system (top rated) 2006
19 Ranking Jury 2221
20 Winner votes 2355
21 Congratulation 5 Congratulation winner 2254
22 Others 2 Others personal responses 991
Total 100% Total 47790
7.2.6 Results of use cases evaluation
The results use cases are presented in Table 7.6; we identified two behaviors by remote and
co-localized teams.
We obtained the following results:
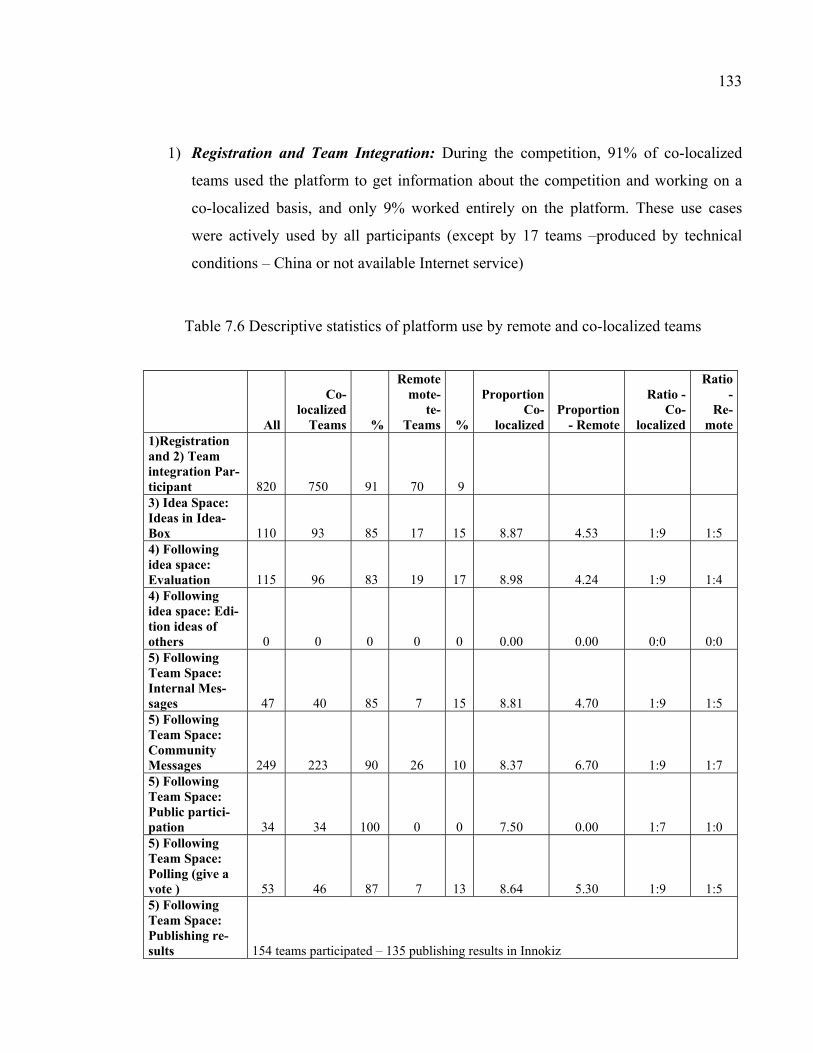
133
1) Registration and Team Integration: During the competition, 91% of co-localized
teams used the platform to get information about the competition and working on a
co-localized basis, and only 9% worked entirely on the platform. These use cases
were actively used by all participants (except by 17 teams –produced by technical
conditions – China or not available Internet service)
Table 7.6 Descriptive statistics of platform use by remote and co-localized teams
All
Co-localized
Teams %
Remotemote-
te-Teams %
Proportion Co-
localizedProportion
- Remote
Ratio - Co-
localized
Ratio -
Re-mote
1)Registration and 2) Team integration Par-ticipant 820 750 91 70 9 3) Idea Space: Ideas in Idea-Box 110 93 85 17 15 8.87 4.53 1:9 1:5 4) Following idea space: Evaluation 115 96 83 19 17 8.98 4.24 1:9 1:4 4) Following idea space: Edi-tion ideas of others 0 0 0 0 0 0.00 0.00 0:0 0:0 5) Following Team Space: Internal Mes-sages 47 40 85 7 15 8.81 4.70 1:9 1:5 5) Following Team Space: Community Messages 249 223 90 26 10 8.37 6.70 1:9 1:7 5) Following Team Space: Public partici-pation 34 34 100 0 0 7.50 0.00 1:7 1:0 5) Following Team Space: Polling (give a vote ) 53 46 87 7 13 8.64 5.30 1:9 1:5 5) Following Team Space: Publishing re-sults 154 teams participated – 135 publishing results in Innokiz
134
2) Use of Idea space: We see that the remote teams were twice as likely as co-localized
teams to publish ideas in the IdeaBox.
3) Following idea space: the use the evaluation tool was scarce and the edition tool was
not used. However, the other tools as writing messages among teammates and giving
an evaluation, was used in ratio of 1:9 by co-localized teams and in a ratio of 1:4 by
remote teams.
4) Following Team space: Remote teams do not have public votes, and so their social
external interaction was limited and low. We observed that this interaction could be
easier for the co-localized team. These teams have enough social support, while re-
mote teams do not. The social contact and the ongoing support produce an effect that
is visualized in the platform.
About the user – acceptance testing, we have three assumptions related with:
1) The use cases: registration, team integration, and following team space are use cases
validated because facilitating the task of being part of competition and also, improv-
ing the awareness of the competition.
2) The use of idea space and following idea was low used because it was not useful
(teams had not time to codify their ideas) or the use of idea space was not fostered by
the competition. Particularly, for the time constraints of 24H of innovation.
3) The most new use case: generating an idea in the idea space and evaluating an idea of
following Idea space, were low used. However, for the purpose of this first test, it can
be enough that users take into account this functionality. This indicates that ideas cod-
ification could be useful for enhancing creative collaboration.
7.3 Task Analysis: Variability of tasks and functionalities used in the Platform
The first step to analyze creative performance consists in identify the task realized on the
platform. Every 3 hours, we ask 267 participants to complete a brief online form covering the
stage, the task and the tools used to realize it. In the following sections, we describe the stag-
es and the tasks performed by creative teams of 24H. To standardize our study with a previ-

135
ous 24H research work, we used the stages classification proposed by Legardeur et al. (2010)
and the ESTIA team. The results are summarized in the following subsections.
7.3.1 Stages and tasks accomplished by participants
Legardeur et al. (2010) define nine stages to develop a new concept in 24H: “1) Project plan-
ning, 2) Task planning, 3) Needs analysis, 4) Concepts searching, 5) Solutions proposal, 6)
Dimensions and Measures, 7) Prototype, 8) Cost and economic analysis, 9) Presentation
preparation”. Each stage is differentiated by the kind of information and knowledge objects
to be exchanged (Legardeur, Boujut and Tiger, 2010). In Figure 7.9 we traced the evolution
of these stages using the prototype according to the participants responses.
Figure 7.9 Stages Evolution by time (each 3 hours)
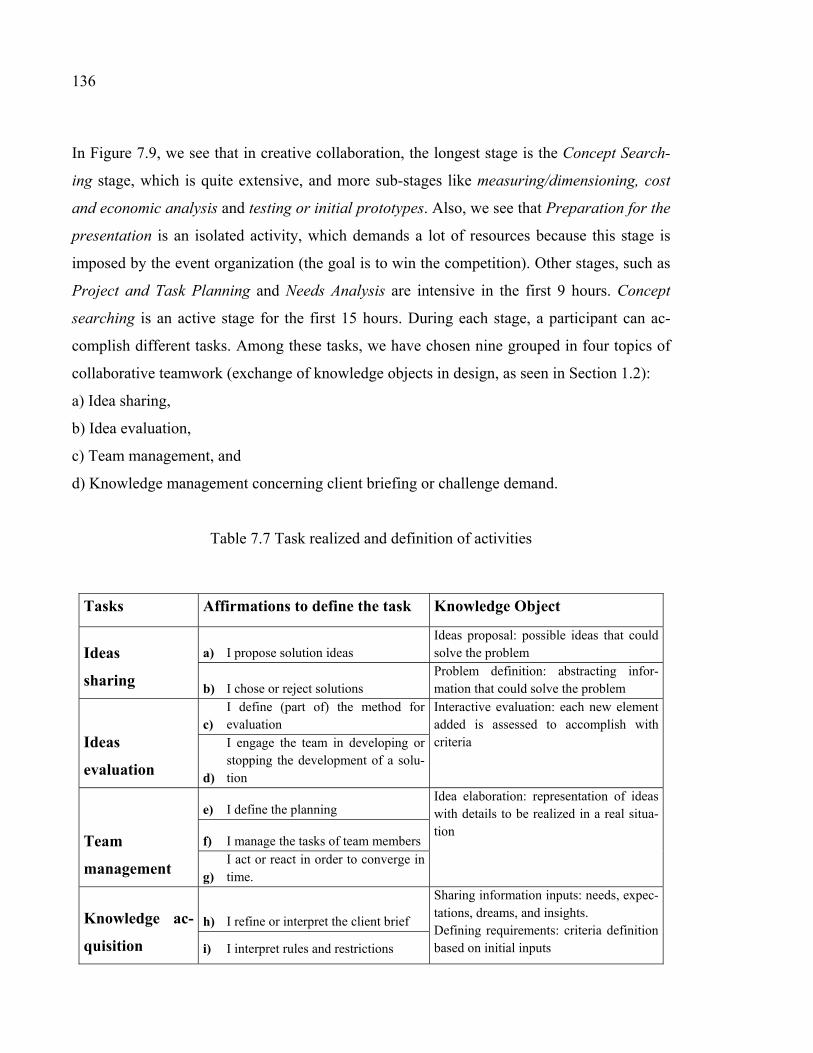
136
In Figure 7.9, we see that in creative collaboration, the longest stage is the Concept Search-
ing stage, which is quite extensive, and more sub-stages like measuring/dimensioning, cost
and economic analysis and testing or initial prototypes. Also, we see that Preparation for the
presentation is an isolated activity, which demands a lot of resources because this stage is
imposed by the event organization (the goal is to win the competition). Other stages, such as
Project and Task Planning and Needs Analysis are intensive in the first 9 hours. Concept
searching is an active stage for the first 15 hours. During each stage, a participant can ac-
complish different tasks. Among these tasks, we have chosen nine grouped in four topics of
collaborative teamwork (exchange of knowledge objects in design, as seen in Section 1.2):
a) Idea sharing,
b) Idea evaluation,
c) Team management, and
d) Knowledge management concerning client briefing or challenge demand.
Table 7.7 Task realized and definition of activities
Tasks Affirmations to define the task Knowledge Object
Ideas
sharing
a) I propose solution ideas Ideas proposal: possible ideas that could solve the problem
b) I chose or reject solutions Problem definition: abstracting infor-mation that could solve the problem
Ideas
evaluation
c) I define (part of) the method for evaluation
Interactive evaluation: each new element added is assessed to accomplish with criteria
d)
I engage the team in developing or stopping the development of a solu-tion
Team
management
e) I define the planning Idea elaboration: representation of ideas with details to be realized in a real situa-tion
f) I manage the tasks of team members
g) I act or react in order to converge in time.
Knowledge ac-
quisition
h) I refine or interpret the client brief
Sharing information inputs: needs, expec-tations, dreams, and insights. Defining requirements: criteria definition based on initial inputs i) I interpret rules and restrictions

137
Table 7.7 presents the affirmation that describe the action realized, which means the task def-
inition expressed in an active manner, for example, a) I propose solution ideas. In this affir-
mation, the participants identify their actions with the task realized during the last three
hours.
In Figure 7.10, we see the summary of responses (in percentages %) for all participants. We
use percentages to present the data information, because the number of participants willing to
respond to the questions decreased, which could be because of demand, as we asked re-
spondents to complete the form only if they actually worked during the period, and also, be-
cause of time constraints during the competition. We therefore obtained the percentage by
distributing the responses for the number of participants in each time period.
Figure 7.10 summarized the results of how participant executed each task by stage; we ob-
serve some variations between the tasks performed at each stage. In the Project Planning
stage, tasks such as Idea sharing, Team management and Client briefing analysis are more
important than the Idea Evaluation task. These results also showed that each participant has a
preference for one or other tasks. Each stage has the same kind of tasks. We found that the
Idea Sharing, Idea Evaluation, Team Management, and Knowledge Management are as cycle
of tasks presented at each stage. However, the distribution and the importance of one task
depend on the goal of each stage. Thus, in Stage three, which deals with Needs Analysis or
Stage eight, which covers Cost and Economical Analysis, we can see how the preferred task
is the Knowledge Management of client’s briefing. For Stage 5, Solution Proposal, the main
task is Idea sharing, with Knowledge Management of client’s briefing. The task Idea Evalua-
tion is more frequent applied for Stage 3 or the Needs Analyzing and for Stage 5. However,
Idea Evaluation is the least common task.

138
Figure 7.10 Summary in % of the main task realized during stages
7.3.1.1 ICT Tools and media used in InnoKiz
In the online forms sent to participants, we interviewed them about the InnoKiz functionali-
ties actually used during the first 6-hour period, and thereafter, for the between of 6 to 15
hours and from 15 to 21 hours. In Figure 7.11, we observed a variation in the use of each
functionally within the platform. In the first 6 hours, the collaborative process was centered
on comments exchanges (30%) and on information sharing in the eRoom (11%). Also, Idea-
Box and Idea Evaluation usage came up to 26% and 23%, respectively, by participants dur-
ing the first 6 hours, while the use of IdeaBox was stable at 25% from 15 hours, and dropped
to 15% at 21 hours. The team space and alerts were used between 6 and 15 hours. At the end
of the competition, teams focused on posting their results, and this functionality had a 76%
usage. We see how the use of these functionalities is in direct proportion to the kind of task
and stage of design of the team, as seen in the preceding section.
0
10
20
30
40
50
60
1. Project Planning
2. Task Planning
3. Needs Analysing
4. Concepts searching
5. Solution Proposal
6. Dimension and measures
7. Models 8. Cost and economical
analysis
9. Presentation Preparation
Idea Sharing Idea Evaluation Team Management KM Client Briefing

139
Figure 7.11 InnoKiz functionalities used at 6H, 15H and 21H
7.3.1.2 Media and tools used during 21 hours of Project Development
Figure 7.12 illustrates the number of times each participant worked using a media and tools.
During the period from 0 hours to 6 hours, it was more intensively used as follows: Internet,
24%; Paper, 21%; Computers and Software, 19%, and Boards, 15%. In the second period
(from 7 to 15 hours), usage continued as follows: Paper, 20%; Computers, 18%; Internet,
18%, and Boards, 17%. For the last period (between 16 and 21 hours), the use of the Internet,
18%; Video, 17%, and Paper, 16% are constant during all periods of project development.
We observed that InnoKiz is used relatively constantly during the entire competition: 10%,
14%, and 16%. The use of InnoKiz is a little more intensive at the end of the competition in
terms of the requirement to publish results. Regarding the use of mobile technology, partici-
pants used cell phones at 9%, 10% and 6%, while tablets and Ipads are scarcely used, coming
in at only 2%.

140
Figure 7.12 Number of times reported for using media during 21 hours (%)
Figure 7.13 presents the most detailed description of the activities realized using ICT Tools.
For a period of 3 hours, we tracked the use of Internet Search as a main activity realized by
teams, and for the first hour, it was 24% and then it dropped to 18%. This data has been con-
firmed in the analysis of the use of ICT Tools in other studies (see Section 4.2.3). Secondly,
in media use, we find the Paper (21%) and Computer and Software (19%). The browsing
activity “Internet searching” is present in all the 21 hours, as well as the use of graphical
software for image processing and video processing. Consulting InnoKiz as a source of in-
formation/guideline is more intensive in the first 6 hours, and decreases during the competi-
tion, both with respect to the use of videoconferencing and eRooms. Graphical software, such
as AutoCAD, Catia, or SolidWorks are more frequently used, at 18 hours. Mind-mapping is a
support activity that remains constant during the entire 21 hours.
Paper % Board %Computer & software
%Internet % Innokiz % Cellphone
%Ipad/PC Tablet % Video %
0H - 6H 21 15 19 24 10 9 2 17H - 15H 20 17 18 18 14 10 2 116H -21H 16 14 11 18 16 6 2 17
0
5
10
15
20
25%
Rep
orte
d tim
e of
use

141
Figure 7.13 ICT Tools used for 3-hour period (answers in %)
7.3.2 Results of Task Analysis and the use of Prototype
In task analysis, we observed that:
• The creative task defined by the exchange of knowledge object is repeated as a cycle
in each stage (Figure 7.10). This cycle of tasks, idea production, idea evaluation, team
management and client briefing (knowledge management acquisition), is repeated by
stage of design. As proposed theoretically in Section 5.3.
• Teams used the platform according with the organization demands: the most used
functionality was the creation and the publishing of the results in the team space. This
utilization varies in the period of time and stage accomplished (Figure 7.11)
• The platform has to cohabit with others Media as Internet and tools as paper, board or
software (Figure 7.12 and 7.13).
3H n=267 6H n=210 9H n=195 12H n=148 15H n=115 18 H
n=114 21H n=107 Mean
Search Internet 23 26 21 22 21 21 18 22Photos, images or videos 20 21 20 17 16 17 18 18Drawing - Paint 13 17 19 20 21 20 21 19InnoKiz - methods/guiding 17 11 8 6 7 9 3 9Skype - Conference Web 11 8 7 7 7 8 3 7Mind mapping 9 14 13 12 15 11 12 12CAO - CAD 4 8 9 11 11 11 24 11Other 4 2 2 5 2 4 0 3
0
5
10
15
20
25
30
% u
tiliz
atio
n du
ring
each
per
iod
of 3
hou
rs

142
7.4 Summary
In this chapter, we compared use cases modelled for the collaborative platform (presented in
UML 2, in Chapter 5) and the current tasks realized by users in the prototype. These main
tasks were: Ideas sharing performed in all stages, Team Management realized at the begin-
ning of the work, Knowledge Acquisition realized in continuum, and with the Idea Evalua-
tion task being the least used.
Regarding the use of InnoKiz functionalities, during the first six hours, the Comments bar, e-
Room (videoconferencing such as Vyew™), IdeaBox (Ideas presented in a Board), Idea
Evaluation and Alerts were used. From seven hours to 15 hours, the IdeaBox, the idea Evalu-
ation, the Alerts and the team space were most used, and at the end of 24H, the result posting
functionality (in the team space) took the lead in terms of usage. This utilization validates the
use cases proposed theoretically in Chapter 5.
We observed the use in parallel of the platform with other ICT tools, especially the Internet
Search activity as a main interaction reported. Remote teams (19%) and co-localized teams
(30%) used the prototype differently. The remote teams used the new functionality “Collabo-
rative tagging” to display and evaluate ideas. While co-localized teams receive comments
and contribution of external partners (free association) and public comments, votes and con-
tributions. This result supports the fact that previous personal interaction is very important
for stimulating creative contributions and also, the collaborative platform is also useful for
co-localized teams. We conclude that there was an interaction inside the platform for remote
and co-localized teams, particularly when the information, ideas and knowledge are needed
to accomplished the overall task of 24H, which is –posting the results into the platform and
voting for a project of other team.
In the next chapter, we will analyze the performance and perceived usability by the plat-
form’s users.
CHAPTER 8
ANALYSIS OF THE CREATIVE COLLABORATION PERFORMANCE ON AN ICT PLATFORM
In this chapter, we present the results obtained by applying the Performance Analysis (PAN)
and the usability test on the collaborative platform (prototype). The results indicate that the
perceived “creative collaboration performance” of participants is satisfactory; 24H teams
found Innokiz useful for collaborating during the ideation stage. As seen in Chapter 7, the
use of a collaborative platform is related to the task executed during the development of the
project. We observed the satisfaction in the use of the platform is interrelated with previous
ICT experience (number of groupware) and previous experience in project development.
In this chapter, we also propose a creative collaboration performance index composed of cre-
ative individual assessment (according to VanGundy (1984)), creative team performance dur-
ing the use of the platform, and previous experience using ICT Tools (groupware) in project
development. At the end of this chapter, we present new functionalities that should be aggre-
gated to improve creative collaboration in an ICT platform.
8.1 Testing Collaborative Platform through Performance Analysis (PAN)
As mentioned in the Methodology (Section 3.6.4), to validate the data collected on the user
performance in the prototype, we will apply Performance Analysis (PAN). PAN determines
how users complete their tasks on the platform in terms of “result quality, time, and total
amount of work done” (Antunes et al., 2008, p. 8:3). As seen in Chapter 7, creative teams
must accomplish tasks of different natures and having different goals; moreover, most parts
of the knowledge exchanged is tacit. For these reasons, measuring performance in a collabo-
rative task is quite complex. In a PAN assessment, the researcher has to “define a way to
compute the quality (e.g., group recall in a collaborative retrieval task), and maximize the
quality vs. work done, either analytically or experimentally” (idem). In our study, creative
performance involves the individual idea production and their possibility to express or share
144
conveniently a creative contribution (creative performance is explained in the Section 8.2). In
contrast to performance, usability “is closely related to ease of learning or learnability with-
out necessarily implying a high performance in task execution” Seffah et al. (2006, p. 168).
For collaborative interfaces, Germani, Mengoni and Peruzzini (2012b) propose an integrated
usability and performance index for the analysis of co-creative activities (co-design). In this
index, there are three factors to be analyzed: the task, the team, and the cognitive perfor-
mances of each member.
In our research, we propose an approach that combines the perceived creative performance
by users and the results obtained by interaction during the use of their Platform. This ap-
proach consists of creative individual assessment according to VanGundy’s, creative perfor-
mance perceived during the use of the platform, and previous experience using ICT Tools
(groupware) during project development (this variable is measured asking for the quantity of
used groupware). In the next section, we present the data collected to analyze the creative
collaboration performance.
8.2 Creative Collaboration Performance on the Platform
At the beginning of the 24H research (Appendix I), we handed a first biographic form asking
about previous experience in working on collaborative projects and the use of groupware,
and a Van Gundy’s test about individual creative assessment (VanGundy, 1984). At the end
of the 24H, after the continuous use of InnoKiz, we applied VanGundy’s creative team as-
sessment. This assessment measures the following variables related to teams’ internal charac-
teristics: 1) homogeneity in genre, 2) diversity of personality, 3) homogeneity in creative
skills, 4) compatibility, when mutual needs are fulfilled, 5) ability to work together, 6) time
for team building (should be at least two years; less than two years of work experience would
have a lower score), and 7) group size (should be comprised of 3 to 4 members) (ibid). It was
also developed a Likert-type test to assess the individual perception on the use of the proto-
type, according to a scale of 1 to 5 (strongly disagree to strongly agree rating scale). This
Likert-type test was adapted from VanGundy (1984), as shown in Figure 8.1. The Likert

145
scale test is a psychometric scale, with which a researcher can capture the variation in the
intensity of the user’s perception towards a phenomenon. In our study, we measure the user’s
perception towards their performance using the platform to share their ideas with their team.
For the performance analysis, we use the Likert-scale test as descriptive statistics summariz-
ing the results on an ordinal basis, and we do not use it for a non-parametric test used in sta-
tistical inferences.
Figure 8.1 Form used to assess the perception of the performance by participants
The following questions collect data about how the InnoKiz platform enables you to do your work and share your ideas.
Rating scale:5 - Strongly agree4 - Agree3 - Neither agree nor disagree2 - Disagree1 - Strongly disagree
QuestionsUsing InnoKiz …
5 4 3 2 1Q1 I easily express my ideas 5 4 3 2 1Q2 All my ideas were well expressed 5 4 3 2 1Q3 I know the advances in my project 5 4 3 2 1Q4 I understand and judge the ideas of my teammates 5 4 3 2 1Q5 I observe the changes made by my teammates 5 4 3 2 1Q6 I would like to use this groupware in my next project 5 4 3 2 1Q7 It is easy to use this groupware 5 4 3 2 1Q8 All the functions, windows and menus are useful 5 4 3 2 1Q9 I visualize the recent activities of my teammates 5 4 3 2 1Q10 Groupware is not useful in the briefing of the project
(preliminary stage) (* inverse score)5 4 3 2 1
Q11 Groupware is friendly 5 4 3 2 1Q12 Groupware lets me be more creative 5 4 3 2 1Q13 I could view responses and criticisms of my teammates 5 4 3 2 1
Q14 I know the direction that the project is taking 5 4 3 2 1Q15 I could be connected with my social networking and
other media (mobile telephone or skype)5 4 3 2 1
Q16 My team creativity was boosted (give advantage) withthe use of this groupware
5 4 3 2 1
Score

146
In Table 8.1, we present the data obtained by applying the questionnaire during the 5th (Test
1) and the 6th editions (Test 2) of 24H. With this data, we realized a reliability test
Cronbach’s-Alpha; which allows us to establish the internal consistency between the 16
questions proposed and variable performance.
Cronbach’sAlpha ∝ isdefined by the following formula: ∝= K− 1 1 − ∑
(8.1)
K = Number of components (items or questions) = Variance of components i for current sample = Variance of observed total scores
The questionnaire was applied two separate times; for Test 1 (May, 2011), we obtained
0.9461,with n=28 and for the second Test 2 (May, 2012), 0.9608, with n=40. As can be seen
at the corner right-bottom Table 8.1, results over 0.9 indicate excellent consistency between
the questions formulated and their measure of the variable perceived performance using the
collaborative platform.
Table 8.1 Data obtained in Likert scaleform
TEST 1 RELIABILITYP1 P2 P3 P4 P5 P6 P7 P8 P9 P10 P11 P12 P13 P14 P15 P16 P17 P18 P19 P20 P21 P22 P23 P24 P25 P26 P27 P28 Variance Q
Q1 1 3 3 2 3 5 3 5 5 3 3 4 2 3 4 4 3 5 3 1 3 3 2 3 4 5 3 2 1.2857Q2 1 3 3 2 3 5 4 4 5 4 3 3 2 4 5 4 3 4 4 1 3 3 1 3 3 5 3 2 1.3598Q3 1 3 2 4 3 5 4 4 5 4 3 4 5 3 4 4 3 5 5 1 4 3 4 2 4 5 3 2 1.3690Q4 1 3 3 3 3 5 3 4 5 2 3 3 3 4 4 3 5 3 2 3 3 4 3 5 5 3 2 1.0769Q5 1 3 3 3 3 5 3 5 4 5 3 4 5 5 4 4 3 3 5 2 4 3 4 3 4 5 3 2 1.1362Q6 1 3 3 3 3 5 4 3 5 4 3 5 5 3 3 4 3 4 4 2 4 3 4 2 5 5 3 2 1.1481Q7 1 3 3 3 3 5 4 4 5 5 3 4 4 5 3 5 3 5 4 1 3 3 4 2 4 5 3 2 1.3690Q8 1 3 3 3 3 5 3 3 5 4 3 4 4 2 3 5 3 5 3 1 3 3 3 2 5 5 3 2 1.3228Q9 1 3 3 4 3 5 4 5 5 3 3 3 5 3 4 5 3 4 5 3 5 3 4 3 5 5 3 2 1.1746Q10 5 3 3 2 3 1 3 2 1 3 3 3 3 3 3 1 3 3 3 3 3 3 3 4 4 1 3 4 0.8929Q11 1 3 3 4 3 5 4 3 4 1 3 4 3 4 3 5 3 4 4 2 4 3 3 4 3 5 3 2 1.0410Q12 1 3 3 2 3 5 4 4 4 3 3 3 1 3 3 5 3 3 3 1 4 3 3 3 5 5 3 2 1.2381Q13 1 3 3 4 3 5 4 4 4 4 3 3 5 3 4 4 3 3 4 2 4 3 4 3 5 5 3 2 0.9259Q14 1 3 3 3 3 5 5 3 5 3 3 4 5 3 3 4 3 4 2 2 4 3 4 3 5 5 3 2 1.1429Q15 1 3 3 4 3 5 5 3 5 3 3 3 1 5 4 4 3 3 2 1 4 3 4 2 5 5 3 2 1.5450Q16 1 3 3 3 3 5 5 3 5 4 3 2 1 3 3 4 3 3 4 1 3 3 3 2 3 5 3 2 1.2540
Score 20 48 47 49 48 76 62 59 72 55 48 56 51 55 57 66 48 63 58 26 58 48 54 44 69 76 48 34 170.6177% 0.3 0.6 0.6 0.6 0.6 1.0 0.8 0.7 0.9 0.7 0.6 0.7 0.6 0.7 0.7 0.8 0.6 0.8 0.7 0.3 0.7 0.6 0.7 0.6 0.9 1.0 0.6 0.4 0.0267
Cronbach's Alpha 0.9461

147
Table 8.1 Continuation
Table 8.2 describes how Likert-type test questions were formulated to determine the inter-
connection between four evaluation categories related to creative collaboration: creative per-
formance (Q1, Q4, Q12), team performance (Q3, Q5, Q9, Q14, Q16), usefulness (Q2, Q7,
Q8, Q10, Q11), and accessibility (Q15). These categories are distributed in three dimensions
TEST 2 P1 P2 P3 P4 P5 P6 P7 P8 P9 P10 P11 P12 P13 P14 P15 P16 P17 P18 P19 P20 P21 P22 P23 P24 P25 P26 P27 P28
Q1 2 1 4 3 3 5 4 4 4 5 4 3 3 3 1 3 3 5 1 3 3 3 1 1 5 5 2 1Q2 4 1 4 3 4 5 4 5 4 4 4 3 4 4 1 3 4 5 1 3 3 2 1 1 5 5 2 1Q3 3 3 5 3 5 5 5 5 4 5 3 3 4 4 1 3 5 5 1 3 3 4 1 1 4 5 2 2Q4 3 1 5 3 5 5 5 4 4 5 4 3 4 4 1 4 4 5 1 3 3 3 1 1 5 5 2 2Q5 3 1 5 3 5 5 5 5 4 5 4 3 1 4 1 4 4 5 1 3 3 3 1 1 5 5 2 2Q6 4 4 5 3 3 5 3 5 4 4 4 3 1 3 1 1 5 5 1 3 2 3 1 1 5 5 2 2Q7 3 4 3 3 5 5 4 4 3 3 4 3 2 3 1 1 3 5 1 3 3 4 1 1 5 5 2 1Q8 3 4 2 3 3 5 3 4 2 3 3 3 1 3 1 1 3 5 1 3 3 2 1 1 4 5 2 1Q9 3 4 3 3 5 5 5 4 4 3 4 3 3 2 1 1 4 5 1 3 4 3 1 1 4 3 2 1Q10 3 5 4 3 3 5 3 2 3 2 3 3 2 4 5 4 3 5 5 3 3 2 5 5 3 1 4 5Q11 3 4 3 3 3 5 3 5 2 3 3 3 3 3 1 1 4 5 1 3 4 2 1 1 4 5 2 1Q12 4 1 5 3 3 5 3 5 3 2 3 3 4 4 1 1 4 5 1 3 2 2 1 1 3 3 2 1Q13 5 2 4 3 5 5 5 5 4 3 4 3 4 2 1 3 4 5 1 3 3 4 1 1 4 4 2 1
Q14 5 5 5 3 3 5 4 4 4 2 4 3 4 3 1 2 4 5 1 3 3 2 1 1 4 5 2 1Q15 4 3 4 3 3 5 5 4 4 3 4 3 4 2 1 2 3 5 1 3 3 2 1 1 4 5 2 1Q16 2 1 5 3 1 5 4 4 3 2 4 3 4 2 1 1 3 5 1 3 2 3 1 1 4 5 2 1Score 54 44 66 48 59 80 65 69 56 54 59 48 48 50 20 35 60 80 20 48 47 44 20 20 68 71 34 24% 0.7 0.6 0.8 0.6 0.7 1.0 0.8 0.9 0.7 0.7 0.7 0.6 0.6 0.6 0.3 0.4 0.8 1.0 0.3 0.6 0.6 0.6 0.3 0.3 0.9 0.9 0.4 0.3
TEST 2 P29 P30 P31 P32 P33 P34 P35 P36 P37 P38 P39 P40 Variance(continuation) 5 2 4 1 3 3 2 1 5 5 4 2 1.9462
5 1 3 2 3 3 2 1 5 4 3 1 2.01995 4 5 3 3 3 3 2 5 5 5 4 1.73335 3 5 3 3 3 3 2 5 5 4 2 1.84364 2 5 3 3 3 3 4 5 4 4 2 1.93275 1 4 2 3 3 2 1 4 4 3 2 1.99744 3 4 2 3 3 3 1 3 5 4 1 1.71734 3 3 1 3 3 2 1 3 5 3 2 1.49744 3 3 2 3 3 3 1 3 4 3 2 1.46092 4 5 2 3 3 3 5 3 1 3 3 1.36865 3 4 2 3 3 3 1 2 5 5 3 1.69234 2 3 1 3 3 3 1 2 5 3 3 1.66603 2 4 2 3 3 3 1 5 4 3 2 1.7205
4 3 4 2 3 3 2 1 5 4 3 3 1.7205Cronbach's alpha
Internal consistency
5 2 4 2 3 3 3 1 5 4 4 3 1.6308 α ≥ 0.9 Excellent
5 2 4 1 3 3 3 1 1 4 3 2 1.9077 0.8 ≤ α < 0.9 Good
69 40 64 31 48 48 43 25 61 68 57 37 280.6641 0.7 ≤ α < 0.8 Acceptable
0.9 0.5 0.8 0.4 0.6 0.6 0.5 0.3 0.8 0.9 0.7 0.5 0.6 ≤ α < 0.7 Questionable
0.5 ≤ α < 0.6 Poor
Cronbach's Alpha 0.9608 α < 0.5 Unacceptable

148
of analysis: if the Knowledge is tacit or explicit, if the Social Level is individual or collec-
tive, and finally, the Direction of inputs from Individual to Collective (In. to Co.) or vice ver-
sa (Co. to In.). Ideas, as tacit knowledge, are presented to the team and are then transformed
into an explicit form.
Table 8.2 Form used to measure the perception of performance by participants
#
Metrics Questions Knowledge exchange
Social level Direction
Using InnoKiz … TacitExplicit
Individual
Collective
In. to Co.
Co. to In.
Q1Creativityperformance I easily express my ideas X X X
Q2 Usefulness All my ideas were well expressed
X X X
Q3 Team performance I know the advances in my project
X X X
Q4Individual Creativity Performance
I understand and judge the ideas of my teammates
X X X
Q5 Team performance I observe the changes made by my teammates
X X X
Q6 Satisfaction I would like to use this groupware in my next project
X X X
Q7 Usefulness It is easy to use this groupware X X N/A
Q8 Usefulness All the functions, windows and menus are useful
N/A N/A
Q9 Performance I visualize the recent activities ofmy teammates
X X X
Q10 Usefulness
Groupware is not useful in the briefing of the project (preliminary stage) (* inverse score)
N/A N/A N/A
Q11 Usefulness Groupware is friendly N/A N/A N/A
Q12Creativity performance
Groupware lets me be more creative
X X X
Q13 Team performance I could view responses and criticisms of my teammates
X X X
Q14 Team performance I know the direction that the project takes
X X X
Q15 Accessibility
I could be connected with my social networking and other media (mobile telephone -Skype)
X X X
Q16 Team performanceMy team creativity was boosted (give advantage) with the use of this groupware
X X X

149
Questions were grouped into separate categories. Table 8.3 shows a synthesis of the results
obtained and summarizes the other results obtained regarding experience in the use of
groupware, and the results of individual and teamwork assessment (Obtained in the biograph-
ical form –filling up in the first part of study by all participants).
Table 8.3 Condensed data of users’ evaluation of Platform
InnoKiz Test - Perceived Performance Creat - Assessment Groupware Experience Likes
n=40Creat-Perf (Q1,Q4, Q12)
Team-Perf (Q3,Q5,Q9,Q14,Q16)
Usefulness (Q2,Q7,Q8,Q10,Q11)
AccessIbility (Q15)
Total Performance
Individual Test
Teamwork Test
Use Groupware
ExperienceTotal Experience
Teamwork
P1 3,00 3,2 3,2 4 3,35 3,5 3,56 3 11 14 5P2 1,00 2,8 3,6 3 2,60 4,2 4,33 1 1 2 5P3 4,67 4,6 3,2 4 4,12 2 3,78 3 5 8 5P4 3,00 3 3 3 3,00 3 3,00 4 0 4 5
P5 3,67 3,8 3,6 3 3,52 3,8 3,67 5 11 16 5P6 5,00 5 5 5 5,00 4 3,67 3 5 8 5
P7 4,00 4,6 3,4 5 4,25 4,45 3,89 5 5 10 5P8 4,33 4,4 4 4 4,18 4 4,22 4 5 9 5
P9 3,67 3,8 2,8 4 3,57 3,4 3,00 3 5 8 5P10 4,00 3,4 3 3 3,35 4 3,00 5 11 16 5P11 3,67 3,8 3,4 4 3,72 3,5 3,67 2 5 7 5P12 3,00 3 3 3 3,00 3,1 3,33 2 5 7 5P13 3,67 3,2 2,4 4 3,32 3,4 3,11 4 5 9 5P14 3,67 3 3,4 2 3,02 3,95 3,89 2 5 7 5P15 1,00 1 1,8 1 1,20 3,5 3,89 2 5 7 5P16 2,67 2,2 2 2 2,22 3,15 3,67 4 5 9 5P17 3,67 4 3,4 3 3,52 3,75 3,89 4 5 9 5P18 5,00 5 5 5 5,00 3,35 5,00 3 1 4 5P19 1,00 1 1,8 1 1,20 3,15 4,00 2 5 7 5P20 3,00 3 3 3 3,00 4,6 3,67 2 8 10 5P21 2,67 3 3,2 3 2,97 3,05 2,67 3 5 8 5P22 2,67 3 2,4 2 2,52 3,75 3,33 2 8 10 5P23 1,00 1 1,8 1 1,20 3,45 4,00 1 8 9 5P24 1,00 1 1,8 1 1,20 3,55 4,00 1 1 2 5P25 4,33 4,2 4,2 4 4,18 4,1 4,11 5 5 10 5P26 4,33 4,6 4,2 5 4,53 3,35 4,67 5 1 6 5P27 2,00 2 2,4 2 2,10 3,85 3,33 2 5 7 5P28 1,33 1,4 1,8 1 1,38 4,15 2,56 4 5 9 5P29 4,67 4,4 4 5 4,52 3,3 4,33 4 5 9 5P30 2,33 2,8 2,8 2 2,48 3,05 3,11 2 5 7 5P31 4,00 4,2 3,8 4 4,00 4,25 4,00 4 11 15 5P32 1,67 2,2 1,8 2 1,92 3,55 2,89 2 5 7 5
P33 3,00 3 3 3 3,00 3,5 2,78 1 5 6 5P34 3,00 3 3 3 3,00 3 3,11 1 5 6 5P35 2,67 2,8 2,6 3 2,77 3,2 2,67 4 1 5 5P36 1,33 1,8 1,8 1 1,48 3,95 2,89 4 5 9 5P37 4,00 3,8 3,2 5 4,00 3,5 3,33 4 0 4 0P38 5,00 4,2 4 4 4,30 3,5 4,56 3 5 8 5P39 3,67 3,6 3,6 4 3,72 3,6 4,11 3 5 8 5P40 2,33 2,6 2 3 2,48 3,05 3,44 2 5 7 5Mean 3,09 3,16 3,035 3,1 3,10 3,5625 3,60 3 5,075 9,295 4,875SD 1,233 1,128 0,873 1,277 1,077 0,487 0,592 1,261 2,777 3,147 0,791
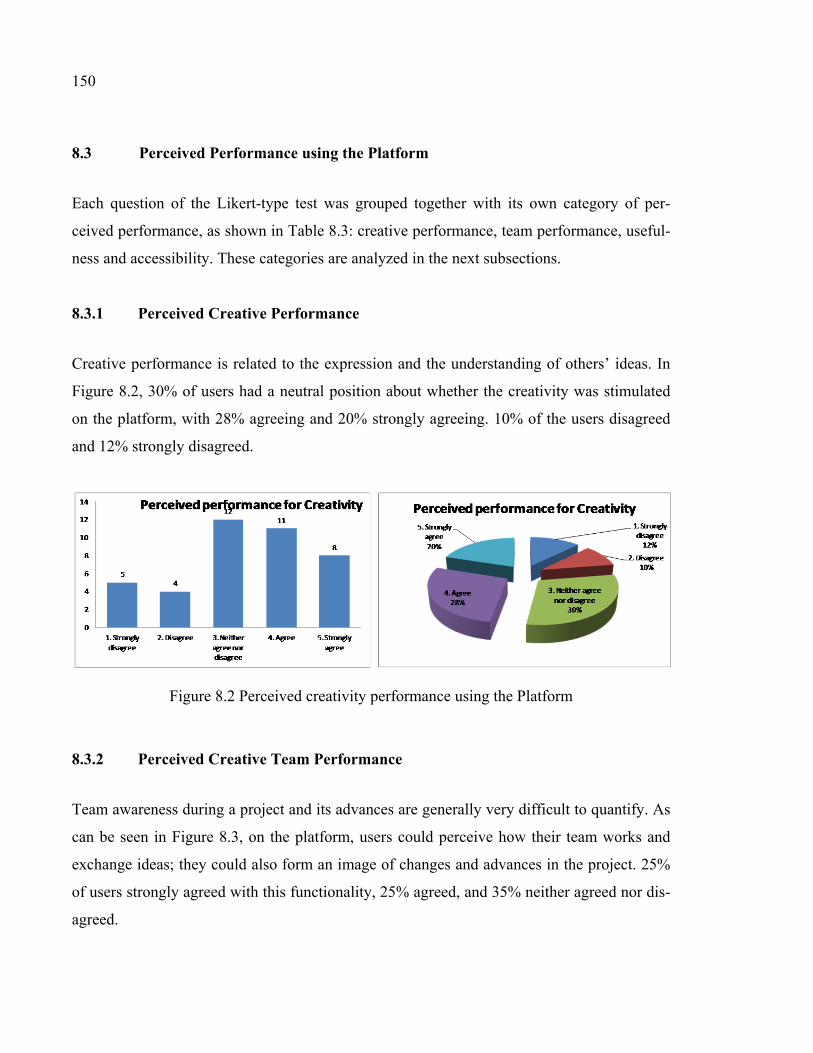
150
8.3 Perceived Performance using the Platform
Each question of the Likert-type test was grouped together with its own category of per-
ceived performance, as shown in Table 8.3: creative performance, team performance, useful-
ness and accessibility. These categories are analyzed in the next subsections.
8.3.1 Perceived Creative Performance
Creative performance is related to the expression and the understanding of others’ ideas. In
Figure 8.2, 30% of users had a neutral position about whether the creativity was stimulated
on the platform, with 28% agreeing and 20% strongly agreeing. 10% of the users disagreed
and 12% strongly disagreed.
Figure 8.2 Perceived creativity performance using the Platform
8.3.2 Perceived Creative Team Performance
Team awareness during a project and its advances are generally very difficult to quantify. As
can be seen in Figure 8.3, on the platform, users could perceive how their team works and
exchange ideas; they could also form an image of changes and advances in the project. 25%
of users strongly agreed with this functionality, 25% agreed, and 35% neither agreed nor dis-
agreed.

151
Figure 8.3 Perceived performance using the Platform
8.3.3 Perceived Usefulness
Figure 8.4 shows the perceived usefulness of the platform for creative sessions. In this cate-
gory, 10% of users strongly agreed, while 38% agreed about the usefulness of the platform in
their creative work. 30% had a neutral position, and 22% disagreed in this category.
Figure 8.4 Perceived Usefulness using the Platform
8.3.4 Perceived Accessibility
Accessibility enables users to connect with different kinds of devices and to have a relative
interaction with their custom ICT tools. In Figure 8.5, we see that 15% of users strongly
agreed with this feature and 25% agreed, while 30% had a neutral position, and 15% disa-
greed and 15% strongly disagreed. In terms of accessibility, a collaborative platform must be

152
more compatible with mobile devices like smart phones, tablet computers and portable media
players.
Figure 8.5 Perceived Accessibility to the Platform
8.4 Perceived Performance and Groupware Experience
Studies on human performance explain the difficulty of tracing the behavior of users to de-
fine their self-perception of performance. This complexity is aggravated and more obvious in
groupware or collaborative applications; because there are social variables involved, includ-
ing teamwork dynamics, communication and user experience in groupware systems. At the
end of 24H, we sent an online form about the perceived experience using the prototype. Only
40 users agreed to participate, this increases the margin of error to 15.1%, which at beginning
was of 5.0% (267 participants of 882) with a statistical confidence level of 95%.
The data was mined by a correlation analysis, as shown in Table 8.4 and Figure 8.6, to estab-
lish some interrelationships among all categories. The first four categories, perceived creativ-
ity performance, perceived team performance, usefulness and accessibility, show a high cor-
relation, due to their high interrelationship, as validated by the reliability test (Alpha’s
Cronbach test, Table 8.1). Moreover, there is an acceptable correlation between the use of
groupware and perceived creativity and perceived team performance. Team creative assess-
ment is very weak when correlated with the perceived usefulness of the platform. There is a
weak correlation between the use of groupware and the perceived performance and the as-
sessment of a creative team.
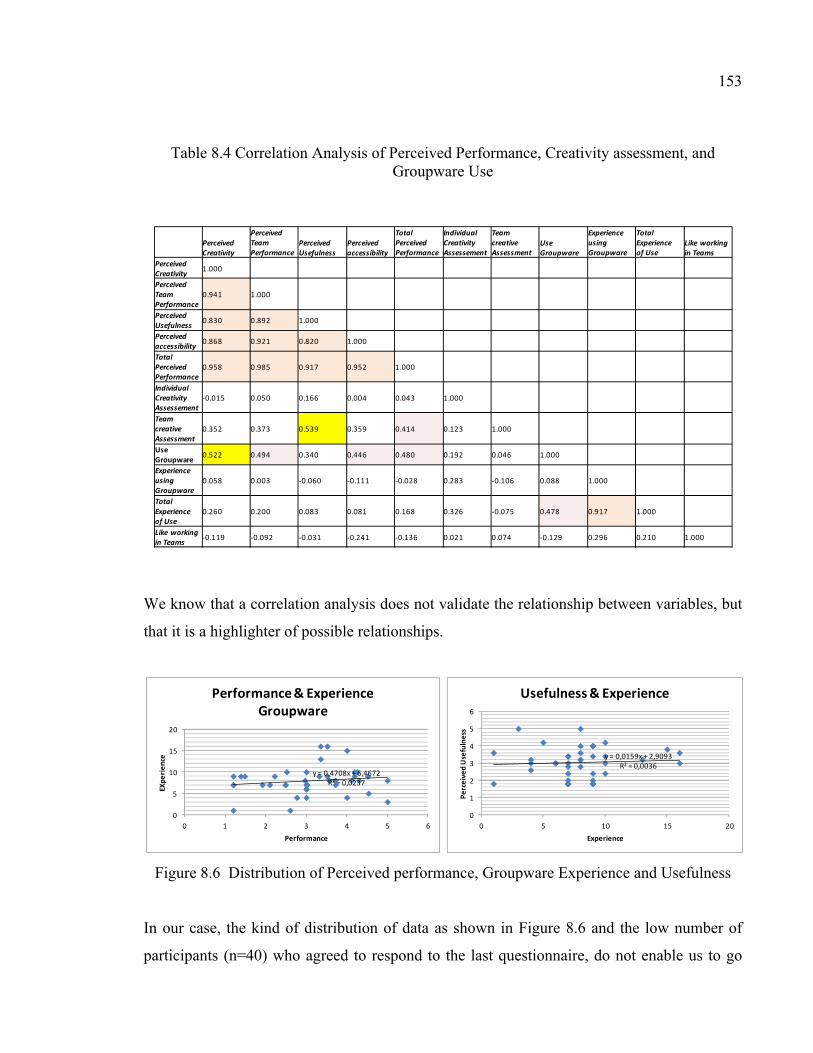
153
Table 8.4 Correlation Analysis of Perceived Performance, Creativity assessment, and Groupware Use
We know that a correlation analysis does not validate the relationship between variables, but
that it is a highlighter of possible relationships.
Figure 8.6 Distribution of Perceived performance, Groupware Experience and Usefulness
In our case, the kind of distribution of data as shown in Figure 8.6 and the low number of
participants (n=40) who agreed to respond to the last questionnaire, do not enable us to go
Perceived Creativity
Perceived Team Performance
Perceived Usefulness
Perceived accessibility
Total Perceived Performance
Individual Creativity Assessement
Team creative Assessment
Use Groupware
Experience using Groupware
Total Experience of Use
Like working in Teams
Perceived Creativity 1.000
Perceived Team Performance
0.941 1.000
Perceived Usefulness 0.830 0.892 1.000
Perceived accessibility 0.868 0.921 0.820 1.000
Total Perceived Performance
0.958 0.985 0.917 0.952 1.000
Individual Creativity Assessement
-0.015 0.050 0.166 0.004 0.043 1.000
Team creative Assessment
0.352 0.373 0.539 0.359 0.414 0.123 1.000
Use Groupware 0.522 0.494 0.340 0.446 0.480 0.192 0.046 1.000
Experience using Groupware
0.058 0.003 -0.060 -0.111 -0.028 0.283 -0.106 0.088 1.000
Total Experience of Use
0.260 0.200 0.083 0.081 0.168 0.326 -0.075 0.478 0.917 1.000
Like working in Teams -0.119 -0.092 -0.031 -0.241 -0.136 0.021 0.074 -0.129 0.296 0.210 1.000
y = 0,4708x + 6,4672R² = 0,0237
0
5
10
15
20
0 1 2 3 4 5 6
EXpe
rienc
e
Performance
Performance & Experience Groupware
y = 0,0159x + 2,9093R² = 0,0036
0
1
2
3
4
5
6
0 5 10 15 20
Perc
eive
d U
sefu
lnes
s
Experience
Usefulness & Experience
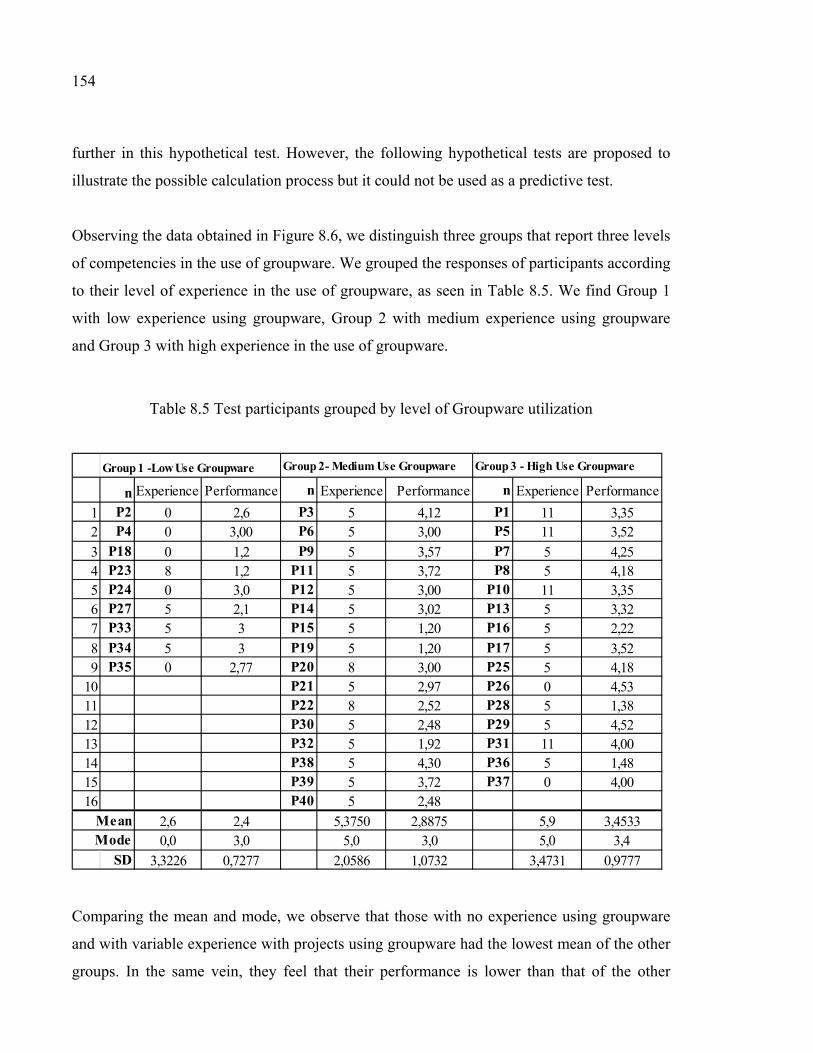
154
further in this hypothetical test. However, the following hypothetical tests are proposed to
illustrate the possible calculation process but it could not be used as a predictive test.
Observing the data obtained in Figure 8.6, we distinguish three groups that report three levels
of competencies in the use of groupware. We grouped the responses of participants according
to their level of experience in the use of groupware, as seen in Table 8.5. We find Group 1
with low experience using groupware, Group 2 with medium experience using groupware
and Group 3 with high experience in the use of groupware.
Table 8.5 Test participants grouped by level of Groupware utilization
Comparing the mean and mode, we observe that those with no experience using groupware
and with variable experience with projects using groupware had the lowest mean of the other
groups. In the same vein, they feel that their performance is lower than that of the other
Group 1 -Low Use Groupware Group 2- Medium Use Groupware Group 3 - High Use Groupware
n Experience Performance n Experience Performance n Experience Performance
1 P2 0 2,6 P3 5 4,12 P1 11 3,352 P4 0 3,00 P6 5 3,00 P5 11 3,52
3 P18 0 1,2 P9 5 3,57 P7 5 4,254 P23 8 1,2 P11 5 3,72 P8 5 4,185 P24 0 3,0 P12 5 3,00 P10 11 3,356 P27 5 2,1 P14 5 3,02 P13 5 3,327 P33 5 3 P15 5 1,20 P16 5 2,22
8 P34 5 3 P19 5 1,20 P17 5 3,529 P35 0 2,77 P20 8 3,00 P25 5 4,18
10 P21 5 2,97 P26 0 4,5311 P22 8 2,52 P28 5 1,3812 P30 5 2,48 P29 5 4,5213 P32 5 1,92 P31 11 4,0014 P38 5 4,30 P36 5 1,4815 P39 5 3,72 P37 0 4,0016 P40 5 2,48
Mean 2,6 2,4 5,3750 2,8875 5,9 3,4533Mode 0,0 3,0 5,0 3,0 5,0 3,4
SD 3,3226 0,7277 2,0586 1,0732 3,4731 0,9777

155
groups. For the analysis of the relationship between the total perceived Creative Performance
and the previous experience mentioned in the use of groupware for project development
(r2=0.4748), we formulate a hypothesis, where:
H0: = (Null hypothesis)
H1: Users with experience in the use of groupware are going to perceive a high perception of
their creative performance of the platform.
In a first step to validate H1, we propose the Student’s t-test among two paired difference
tests, as seen in Table 8.6. The result was t= 5.2446 > t Critical (two tail) 2.0027. H0 is re-
jected, because there is a low probability that the two variables have a different behavior (less
than 5% p-value < 0.05). In line with this result, we confirm that users with previous experi-
ence in the use of groupware perceive that the platform conveniently supports their creative
performance.
Table 8.6 Student’s t-test for Independent samples
In addition, we realized an Analysis of Variance (ANOVA) (see Table 8.7) for comparing
three groups classified according to their previous experience in the use of software, as
shown in Table 8.5. For ANOVA, we obtained a p-value 0.04569 < 1.553 critical f-values,
where the formulated hypotheses are:
Paired difference test: t-test
Experience PerformanceMean 5.2 2.951666667Variance 6.830769231 1.045638177Observations 40 40Pearson Corelation 0.124117283Hypothesized mean difference 0df 39t Stat 5.294598984P(T<=t) one-tail 2.4624E-06t Critical (one-tail) 1.684875122P(T<=t) two-tail 4.9248E-06t Critical (two-tail) 2.022690901
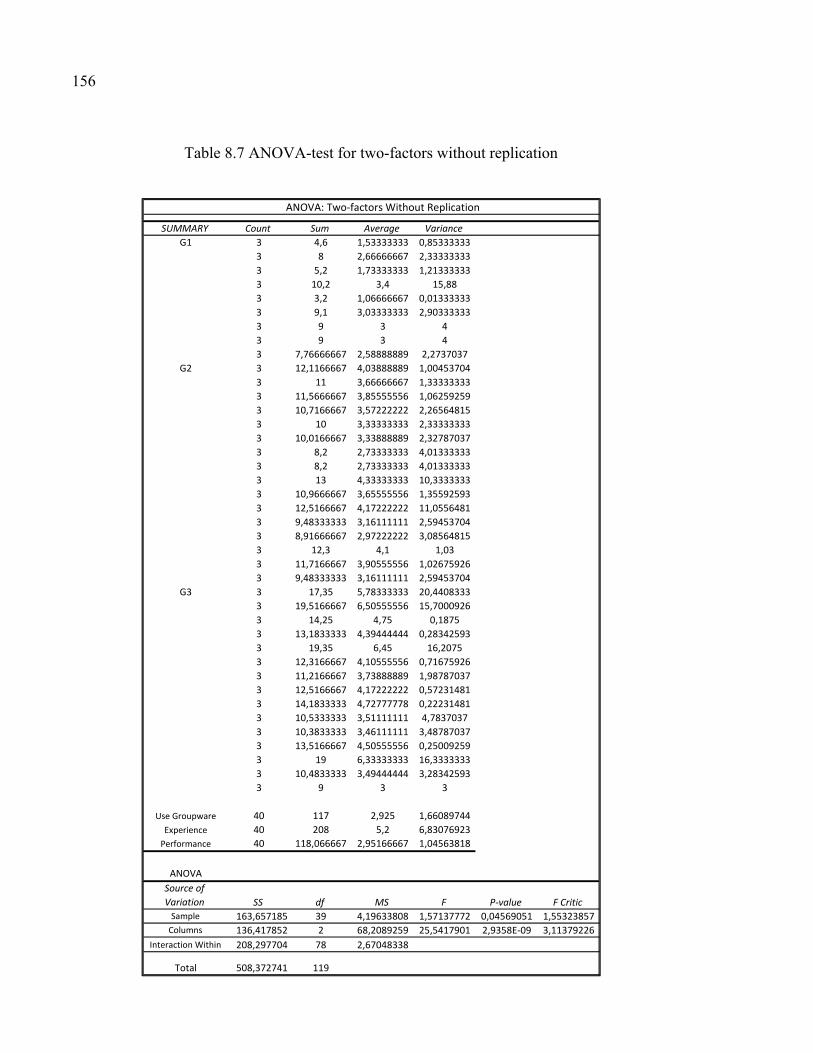
156
Table 8.7 ANOVA-test for two-factors without replication
ANOVA: Two-factors Without Replication
SUMMARY Count Sum Average VarianceG1 3 4,6 1,53333333 0,85333333
3 8 2,66666667 2,333333333 5,2 1,73333333 1,213333333 10,2 3,4 15,883 3,2 1,06666667 0,013333333 9,1 3,03333333 2,903333333 9 3 43 9 3 43 7,76666667 2,58888889 2,2737037
G2 3 12,1166667 4,03888889 1,004537043 11 3,66666667 1,333333333 11,5666667 3,85555556 1,062592593 10,7166667 3,57222222 2,265648153 10 3,33333333 2,333333333 10,0166667 3,33888889 2,327870373 8,2 2,73333333 4,013333333 8,2 2,73333333 4,013333333 13 4,33333333 10,33333333 10,9666667 3,65555556 1,355925933 12,5166667 4,17222222 11,05564813 9,48333333 3,16111111 2,594537043 8,91666667 2,97222222 3,085648153 12,3 4,1 1,033 11,7166667 3,90555556 1,026759263 9,48333333 3,16111111 2,59453704
G3 3 17,35 5,78333333 20,44083333 19,5166667 6,50555556 15,70009263 14,25 4,75 0,18753 13,1833333 4,39444444 0,283425933 19,35 6,45 16,20753 12,3166667 4,10555556 0,716759263 11,2166667 3,73888889 1,987870373 12,5166667 4,17222222 0,572314813 14,1833333 4,72777778 0,222314813 10,5333333 3,51111111 4,78370373 10,3833333 3,46111111 3,487870373 13,5166667 4,50555556 0,250092593 19 6,33333333 16,33333333 10,4833333 3,49444444 3,283425933 9 3 3
Use Groupware 40 117 2,925 1,66089744Experience 40 208 5,2 6,83076923
Performance 40 118,066667 2,95166667 1,04563818
ANOVASource of Variation SS df MS F P-value F Critic
Sample 163,657185 39 4,19633808 1,57137772 0,04569051 1,55323857Columns 136,417852 2 68,2089259 25,5417901 2,9358E-09 3,11379226
Interaction Within 208,297704 78 2,67048338
Total 508,372741 119

157
H0: = = (Null hypothesis)
H1: Users with experience in the use of groupware are going to perceive a high perception of
their creative performance on the platform, and also they have a high experience in the use of
groupware. With these results, H0 is rejected. Therefore, users having more experience in the
use of groupware perceive that they are more efficient (creative performance) on the plat-
form. These results indicate that users with previous experience in the use of groupware are
able to perceive an improved performance related to developing creative projects.
Additionally, a user who has more experience using groupware or ICT tools could tend to
evaluate his/her performance on the platform as being higher. The results of ANOVA also
indicate that satisfaction with the creative teamwork performance has an incidence on the
satisfaction with the use of the platform. In this variable, we assume that the activities real-
ized and the kind of ambience obtained for creativity inside the team has an influence on the
perception of that wellness in the use of the collaborative platform.
8.5 Usability: qualitative Evaluation of the collaborative experience on InnoKiz
The Likert-type test was accompanied by an open-question form for enquiring about the low-
rated questions. The questions were:
1) Can you describe the main reason for giving a low score? Please, feel free to explain your
response.
2) Why do you use InnoKiz? Which functionalities were used?
3) Do you need another resource to complete your creative work?
4) Do you use creative methods? Are they useful for your project? Which one do you use?
Please give the name.
5) Did you find obstacles to obtaining a “perfect” collaboration with your team?
The open-questions were answered by 17 of 40 participants (42%). The sample might seem
small, however Nielsen and Landauer (1993) affirm that more of 15 users provide the neces-
sary information about the occurrence of problems in the design of a new interface, product

158
or system, because the data are set out according with Poisson distribution. The qualitative
analysis was conducted summarizing and grouping the users’ answer by categories, as shown
in Table 8.8. The answers obtained explained the problems or limitations with InnoKiz. We
classify them in eight categories: 1) No perceived need to use it, 2) Human Factors (ergo-
nomics), 3) Training needs, 4) No perceived efficiency or a feeling of a waste of time, 5)
Knowledge Management information needs, 6) Not a habitual tool, 7) Difficult to use and 8)
Need for other communication tool.
Table 8.8 Qualitative Evaluation of InnoKiz: problems and limitations
Analyzing user’s responses, we found essentially that participants who worked in co-
localized spaces with their teams do not see the importance of use the platform (participant
Problem/LimitationNo perceived need to use
Human Factors - Browsing
Training needs
Not efficient or Waste of time
Knowledge Management -Information
Not habitual tool
Difficult to use - Complicated Tool
Need communication tools
- Non-use of InnoKiz for colocalized team 1 1 - Low design quality (Human Factors) 1- Unfamiliarity 1 1- Teams non see necessary the utilisation 1- Team feel a waste of time using a platform 1 Limitations to understand the information exchanged 1 1- Not necessary complete information 1- Not interesting to see the guide 1 1- It is not easy incorporate information 1 1- Other platform more easy and on basic diary use (Dropbox) 1 1- Not efficient 1- Not intuitive and complicate 1 1 - It lacks of a system of file sharing (Dropbox) or T-chat for brainstorming 1 1- Local environment peaceful 1- The system is rigid 1 1- Low response reaction 1 1- It lacks a chat service to facilitate brainstorming 1 1- The idea presentation tool is very complete (even a little too much) 1- Difficult to use 1 1- Complicated interface 1 1- Difficult to browse inside the Platform 1 1- Difficult to distinguish functionalities 1- Difficult to update information 1Categories Total 4 9 1 3 7 4 5 4Number of commentaires 6 2 1 2 3 3 5 2Main limitations = Categories*Comments/2 12 9 1 3 11 6 13 4
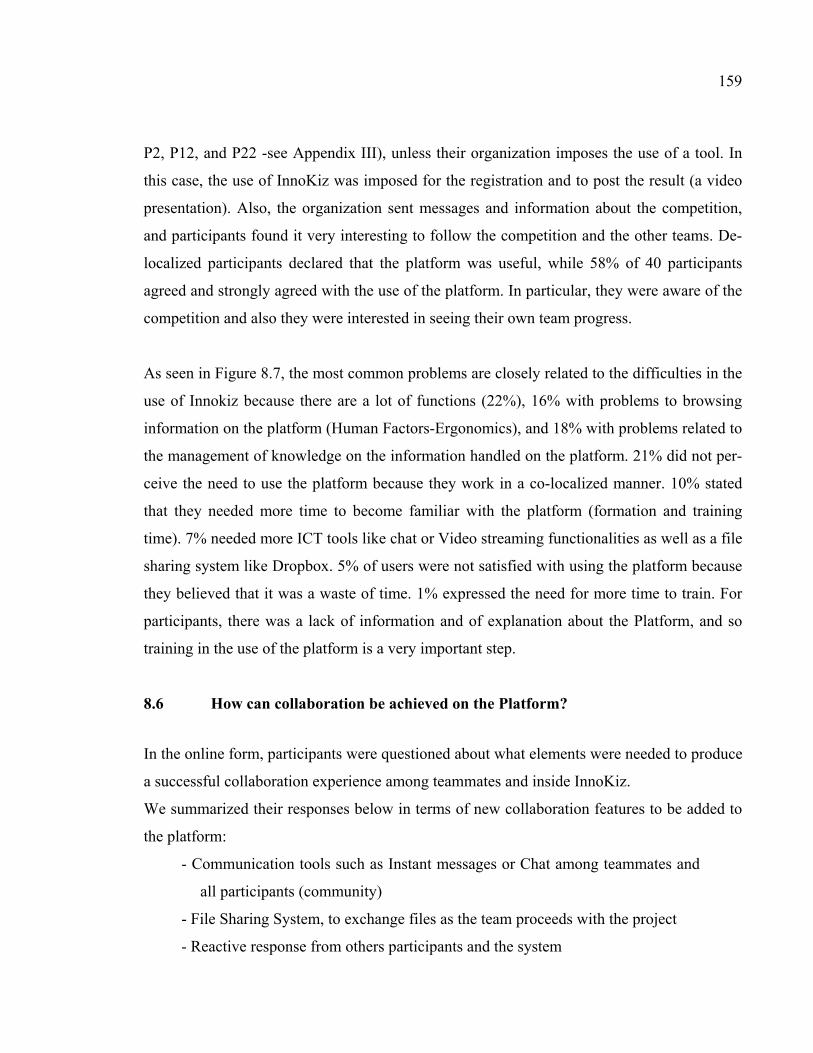
159
P2, P12, and P22 -see Appendix III), unless their organization imposes the use of a tool. In
this case, the use of InnoKiz was imposed for the registration and to post the result (a video
presentation). Also, the organization sent messages and information about the competition,
and participants found it very interesting to follow the competition and the other teams. De-
localized participants declared that the platform was useful, while 58% of 40 participants
agreed and strongly agreed with the use of the platform. In particular, they were aware of the
competition and also they were interested in seeing their own team progress.
As seen in Figure 8.7, the most common problems are closely related to the difficulties in the
use of Innokiz because there are a lot of functions (22%), 16% with problems to browsing
information on the platform (Human Factors-Ergonomics), and 18% with problems related to
the management of knowledge on the information handled on the platform. 21% did not per-
ceive the need to use the platform because they work in a co-localized manner. 10% stated
that they needed more time to become familiar with the platform (formation and training
time). 7% needed more ICT tools like chat or Video streaming functionalities as well as a file
sharing system like Dropbox. 5% of users were not satisfied with using the platform because
they believed that it was a waste of time. 1% expressed the need for more time to train. For
participants, there was a lack of information and of explanation about the Platform, and so
training in the use of the platform is a very important step.
8.6 How can collaboration be achieved on the Platform?
In the online form, participants were questioned about what elements were needed to produce
a successful collaboration experience among teammates and inside InnoKiz.
We summarized their responses below in terms of new collaboration features to be added to
the platform:
- Communication tools such as Instant messages or Chat among teammates and
all participants (community)
- File Sharing System, to exchange files as the team proceeds with the project
- Reactive response from others participants and the system
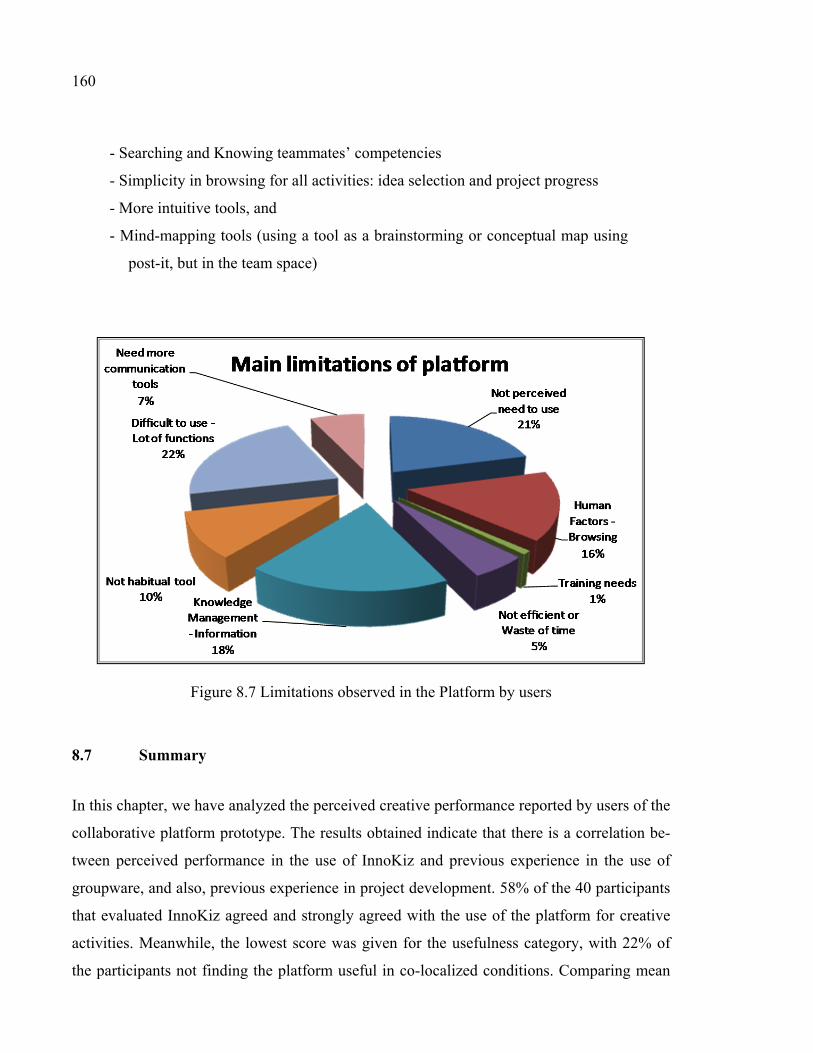
160
- Searching and Knowing teammates’ competencies
- Simplicity in browsing for all activities: idea selection and project progress
- More intuitive tools, and
- Mind-mapping tools (using a tool as a brainstorming or conceptual map using
post-it, but in the team space)
Figure 8.7 Limitations observed in the Platform by users
8.7 Summary
In this chapter, we have analyzed the perceived creative performance reported by users of the
collaborative platform prototype. The results obtained indicate that there is a correlation be-
tween perceived performance in the use of InnoKiz and previous experience in the use of
groupware, and also, previous experience in project development. 58% of the 40 participants
that evaluated InnoKiz agreed and strongly agreed with the use of the platform for creative
activities. Meanwhile, the lowest score was given for the usefulness category, with 22% of
the participants not finding the platform useful in co-localized conditions. Comparing mean

161
differences by two statistical tests, we analyzed three variables: previous experience in pro-
ject development, the use of groupware, and creative performance. The collaborative perfor-
mance was assessed by four measures: perceived creative performance, perceived team per-
formance, perceived usefulness, and perceived accessibility (Chapter 8). On average, all fac-
tors obtained 3.1 out of a maximum score of 5.0, and 9% of participants disagreed with at
least one factor. We compare these results with other measurements of creative assessment
and groupware experience. Factors such as individual creative assessment and creative team
performance were measured using the creative assessment of VanGundy (1984). Results
showed a very weak correlation (r2 = 0.54) between creative team performance (VanGundy,
1984) and perceived usefulness of InnoKiz. However, applying other statistics tests such as
ANOVA, and classifying three groups by previous experience in the use of groupware. The
results showed that:
- The previous experience in creative projects increases the perception of usefulness of
the platform.
- The previous experience using groupware increases the perception of the creative per-
formance.
We conclude that the importance of developing previous training and practice in ICT tools,
should improve the experience in collaborative platforms. Communication is a basic need for
all participants, and they expressed the need for more communication tools, particularly in-
stant messages or chats between teams and the community, as well as more intuitive func-
tionalities and a friendly file sharing system to complete the collaboration experience in the
Platform.

CONCLUSION
This thesis considered the research question: How is it possible to support distributed crea-
tive collaboration through a knowledge management system and a collaborative ICT plat-
form for ideas and knowledge sharing? In the current state of art of ICT, a new functionality
may appear and be capable of adding a new improvement, a new practice regarding how
people communicate and work, although it is still difficult to exactly forecast the future of
Web Tools and their application to creative activities. For that reason, this thesis has pro-
posed the design of a Platform that supports the creative collaboration of more sensible in-
formal and tacit knowledge exchanges, based on an expert Knowledge Management System
(KMS) that interacts with creative teams. This is one of the main findings of our research, the
proposition of a new KMS to support a free association of ideas, their codification and their
valorization (as presented in Chapter 5) among team members and external partners. Due to
the need to achieve an innovation, the creative teams has to: 1) acquire a shared expertise in
strategic collaboration activities (Chapter 2) and 2) capture ideas and knowledge that is dis-
tributed among team members (Chapter 4).
This thesis has presented an analysis of current collaborative ICT technologies which still
need the development of new functionalities to boost the exchange of strategic knowledge
(most of the time tacit knowledge). We also developed new functionalities such as the “Col-
laborative tagging” and the “Graphic folksonomy” to codify the process of idea sharing that
consist in: associating, commenting, criticizing, selecting, and sponsoring by subject matter
or by knowledge field of the idea sharing process (Chapter 6). In the design of the Platform,
we considered capturing the knowledge provided by the external partners and community by
comments or by votes. Capturing external knowledge is an advantage for creative teams.
This dynamic produces a new form of product development oriented to innovation, in which
the knowledge localized outside the team is brought closer. This cross-functional collabora-
tion harnesses a new use of ICTs in product development, according to the new economic
trends in which “information technology has opened a whole new opportunity for manufac-
turers to offer customized products faster, cheaper, and more cost effectively using “build-to-

164
order” also, a “variety of options enabled by mass customization” (Prahalad and
Ramaswamy, 2004, p. 43).
Remote teams (19%) and co-localized teams (30%) used the prototype differently. The re-
mote teams used the new functionality “Collaborative tagging” to display and evaluate ideas.
While co-localized teams receive comments and contribution of external partners (free asso-
ciation) and public comments, votes and contributions. This result supports the fact that pre-
vious personal interaction is very important for stimulating creative contributions and also,
the collaborative platform is also useful for co-localized teams (Chapter 7).
The collaborative performance was assessed by four measures: perceived creative perfor-
mance, perceived team performance, perceived usefulness, and perceived accessibility
(Chapter 8). On average, all factors obtained 3.1 out of a maximum score of 5.0, and 9% of
participants disagreed with at least one factor. We compare these results with other meas-
urements of creative assessment and groupware experience. Factors such as individual crea-
tive assessment and creative team performance were measured using the creative assessment
of VanGundy (1984). Results showed a very weak correlation (r2 = 0.54) between creative
team performance (VanGundy, 1984) and perceived usefulness of InnoKiz. However, apply-
ing other statistics tests such as ANOVA, and classifying three groups by previous experi-
ence in the use of groupware. The results showed that:
- The previous experience in creative projects increases the perception of usefulness of
the platform.
- The previous experience using groupware increases the perception of the creative per-
formance.
The results allow us to conclude that creative teams need to have previous training in the use
of collaborative platform (skills to use groupware system). This training could be integrated
into creative technique sessions in order to harness idea sharing or idea evaluation. These
findings will be addressed in future research, in which we will focus on creative collabora-
tion in more complex systems to support the whole development of the cross-platform.
CONTRIBUTION, FINDINGS AND ORIGINALITY OF THE RESEARCH
Contribution
This thesis proposes an integrated model of Knowledge Management System (KMS), based
in the knowledge production and the incorporation of technology tools. This KMS harnesses
the advantages of ICT to support the tacit knowledge of creative activities.
The prototype of the platform has supported the new functionalities proposed:
- Generating a free-association among participants (by domain or subject and by team)
to produce a team and an extended network;
- Generating a free-association for new team creation;
- Aggregating tools of knowledge acquisition using Internet and Communication tools,
creative teams prefer Internet support, in the form of technology watch. This method
permits a constant comparison between the state-of-the-art of current technology and
the process of product conceptualization;
- Visualizing tacit knowledge by collaborative tagging and ideas evaluation;
- Tracking ideas and its evaluation (Graphic Folksonomy).
The findings are presented by subject and respective chapter:
Chapter 1: Innovation Models
- Knowledge Objects in creative collaboration for a new product design
- Reviewing innovation models and the ICT role in support creative collaboration
Chapter 2: Context for R&D teams
- For R&D teams the transformation of tacit knowledge into codified knowledge does
not produce new knowledge. It is the continuous discussion and “shared expertise”
with a strategic purpose that generates new ideas that are codified once the team ar-
rives to start an operative activity.
166
- The network surrounding R&D is as important as internal team work.
- Free-informal association is the main external source of knowledge
- The knowledge is embedded in expert thinking and is tacit in the first stage.
- A KMS for innovation is composed of experts and the technology support of ICT.
ICTs have a high impact on the innovation process, because they ease the informal
network needed for innovation.
Chapter 4: Needs of creative teams
- Creative teams need a wide range of ICT tools; the use of the Internet and communi-
cation tools, in particular, other tools such as CAD or specialized design software
- Internet and mind-mapping (ICT) are media used to represent this process during de-
sign. Only at the end of the project the creative teams use more specialized software
to codify their ideas.
Chapter 5 and 6: Modeling an ideal ICT Platform
- The platform supports the useful functions of ICT: networking conformation for un-
known knowledge capture, team integration, visualization of personal contributions
and ideas and known knowledge tracking.
- The ideal platform produces this interaction through four new functionalities: emoti-
cons, collaborative tagging, free team creation, and idea space.
Chapter 7: Uses and interaction with the InnoKiz Prototype (Chapter 7)
- The uses case proposed were accepted by the users as much for colocalized and delo-
calized teams (registration, team conformation, use of idea space, tagging and evalua-
tion system)
- The tagging of ideas system was used to codify ideas information: concepts, needs
and description.
- The functionalities used corresponding directly to the instructions presented by the
organization.

167
Chapter 8: Creative Collaboration Performance and Usability
- In the design and use of a collaborative platform, user’s satisfaction is enhanced by
creating a complementary interaction between the Platform KMS and the partici-
pants’ needs, and not solely in the aggregation of tools.
- The participants that have experience in project development and ICT experience
(groupware use) were satisfied in the use of the Platform.
Thesis originality
The originality of this thesis lies in the proposition of an integrated model of Knowledge
Management System (KMS). This KMS harnesses new functionalities that are useful for cre-
ative activities of R&D teams. Also, this thesis overcomes the lack of methodology and test-
ing instruments in creative collaboration. The prototype and the results of this research are
subject of a process of intellectual protection (by the Research and Innovation Support Ser-
vices Office of ÉTS) and the publication of the following works:
Papers
- Jiménez-Narváez, L.-M., & Gardoni, M. (2014). Developing design concepts in a cloud
computing environment: creative interactions and brainstorming modalities. Ac-
cepted to Journal of Digital Creativity.
- Jiménez-Narváez, L.-M., Segrera, A., & Gardoni, M. (2012). Opportunities and Limitations
of the Cloud Computing Environment: In the Early Stage of Design Process. In-
ternational Journal of Design Principles and Practices, pp 1-18.
- Jiménez-Narvaez, L. M., & Gardoni, M. (2011). Reflections on creative and collaborative
teamwork. Journal of research in interactive design, 3 (Springer).
Submitted Papers (waiting answer)
- Jiménez-Narváez, L.-M., Labelle, I., Choulier, D., Legardeur, J., & Gardoni, M. (2012).
Harnessing Creative Teamwork and Leadership in Quick-Term Project Devel-

168
opment (QPD), 24 Hours of Innovation® (24H). Submitted to Research in Engi-
neering Design.
- Jiménez-Narvaez, L.-M., & Gardoni, M. (2013). Collaborative knowledge-based network-
ing for innovation among R&D firms: Analysis of Canadian Case". École de
technologie supérieure. Submitted Innovar
Conferences
- Jiménez-Narvaez, L.-M., Segrera, A., Dalkir, K., & Gardoni, M. (2013). Harnessing Expe-
riential Learning on remote co-design experiences: 24 hours of Innovation. Paper
presented at the Engineering Leadership in Innovation and Design Conceive De-
sign Implement Operate CDIO'2013 MIT/Harvard, Cambridge, MA.
- Jiménez-Narvaez, L.-M., Dalkir, K., & Gardoni, M. (2013). Harnessing IT on Innovation
Projects. Managing remote co-design experiences from 24 hours of innovation.
Paper presented at the PICMET, 2013, San Francisco.
- Jimenez-Narvaez, L. M., Dalkir, K., & Gardoni, M. (2013). Harnessing social media and
Cloud-computing Technologies for Co-design in an Open-Collaborative Innova-
tion: the case of 24 Hours of Innovation. Paper presented at the International
Conference on Engineering Design, ICED'13, Seoul.
-Jiménez-Narváez, L.-M., Dalkir, K., & Gardoni, M. (2012, July 29th - August 2nd). Har-
nessing computing technologies within innovative Quick-term Project Develop-
ment QPD - case study of 24 Hours of Innovation at ETS-Montreal, November
2011. Paper presented at the Portland International Conference on Management
of Engineering & Technology, Vancouver.
- Jiménez-Narváez, L.-M., Dalkir, K., & Gardoni, M. (2012, 9th-11th July). Managing
knowledge needs during new product lifecycle design on Quick-term Project De-
velopment QPD: case study of 24 hours of innovation –ÉTS Montreal. Paper pre-
sented at the 9th International Conference on Product Lifecycle Management,
Montreal.
- Jiménez, L. M., Choulier, D., Legardeur, J. & Gardoni, M. (2011) Creative Teamwork in
Quick Projects Development QPD, 24 Hours of Innovation. International Confer-
169
ence on Engineering Design, ICED’11 15 - 18 August 2011, Technical Universi-
ty of Denmark (First 5% Mention)
- Jiménez, L. M., Desrosiers, S. & Gardoni, M. Creative teamwork in quick and long term
project development, 24 hours of innovation (2011) Symposium on Models and
Modeling Methodologies in Science and Engineering (MMMse 2011) to be held
in Orlando, USA, on July 19th - 22nd, 2011
- Jiménez, L.M. Analyse par métaphores : une proposition de classification des technologies
de soutien au design collaborative. Journee MATI-Montreal.
- Jiménez, L. M., & Gardoni, M. (2010, Octobre 20-22 ). Reflections on creative and collabo-
rative teamwork in charrettes, 24 hours of innovation. Paper presented at the
IDMME - Virtual Concept 2010, Bordeaux - France.
Reports
- Jiménez-Narvaez, L. M., Gardoni, M., & Dubois, M. (2013). État de l'art des outils et des
plateformes utilisées par le secteur spatial pour faciliter l'échange de connaissances
M(IES)2C Mesure des impacts sur l’économie et la société des investissements
dans l’expertise spatiale au Canada. Montréal: Agence Spatiale Canadienne, HÉC,
École Polytechnique, École de Technologie Supérieure.
- Jiménez, L. M. (2012). Étude des parties prenantes : Les entrepreneurs. In É. d. t. s. Mosaic
- HÉC (Ed.), Conceptualisation d’un Hub de Créativité au Planétarium Dow à
partir de l’expérience de l’École d’été en management de la création 2012. Mon-
tréal: École de technologie supérieure, Mosaic - HÉC.
- Jiménez, L. M., & Faucher, M.-F. (2012). Étude des parties prenantes : Les experts de Bar-
celona. In M.-H. École de technologie supérieure (Ed.), Conceptualisation d’un
Hub de Créativité au Planétarium Dow à partir de l’expérience de l’École d’été en
management de la création 2012. Montréal: École de technologie supérieure,
MOSAIC - HÉC Montréal.
- Jiménez, L. M., Kitimbo, I., & Dubois, M. (2012). Écosystème du Hub de Créativité de
Montréal. In M.-H. École de technologie supérieure (Ed.), Conceptualisation d’un
Hub de Créativité au Planétarium Dow à partir de l’expérience de l’École d’été en

170
management de la création 2012. Montréal: École de technologie supérieure, Mo-
saic - HÉC Montréal.
- Jiménez-Narvaez, L.-M. (2010). Réflexion sur le modèle d’intégration des arts et de la
technologie dans la ville créative. G. Langlois & É. Pawlak (Eds.),
22@Barcelona: Une expérience à réinventer pour le Quartier de l'Innovation de
Montréal.
Mention of research work in public media
Messier, Charles 2012. « L’informatique dans les nuages change les habitudes ». Magazine
Jobboom (Montreal). May, 23th. < http://www.jobboom.com/carriere/l-
informatique-dans-les-nuages-change-les-habitudes/ >.
InnoKiz as spin-off of École de tecnologie supérieure
InnoKiz, the prototype of the collaborative platform developed during this research, has in-
teresting features that have surpassed our initial expectations, for the following reasons:
- InnoKiz supported more than 800 participants that interacted on the platform in
May, 2012 and more of 1000 participants in May, 2013. This intectactive charac-
teristic of InnoKiz had positive effects for “Les 24 heures de l’innovation” com-
petition by allowing an effective exchange for distributed teams around the world
(17 sites) and opening the collaboration among the École de technologie supéri-
eure to an international audience and industrial partners.
- InnoKiz is an open resource for the community and public in general, as well as a
closed space for teamwork. This feature promotes the initial theory of supporting
participants by creative contributions in a dynamic of free association, and pro-
vides the possibility of finding external expert’s contribution (promoting external

171
knowledge collaboration). It also creates an internal dynamic of creative team-
work.
InnoKiz is a cloud application which supports all creative processes. After a deep discussion
with Clément Jacquot, co-developer of the platform, and considering the main research find-
ings of this thesis, the following design decisions were established:
- InnoKiz supports the community in general, through the personal contribution of
each participant. For this reason, each participant in InnoKiz is identified in order
to create confidence among teammates. This can create a stronger long-term rela-
tionship for creative free-association networking.
- InnoKiz also supports all creative methods, as well as all creative processes. The
KMS for innovation is produced by each individual contribution (external and in-
ternal to the creative team) that is integrated or added to the team space, and for
this reason, InnoKiz must enable the free sharing of ideas.
- InnoKiz supports idea sharing starting, from representation or content creation to
idea evaluation. This entire dynamic should be available for a clear and transpar-
ent collaborative process.


RECOMMENDATIONS AND FURTHER RESEARCH
In this section, we summarize the main practical issues to take into account in promoting cre-
ative collaboration, using ICT technologies. Particularly, these recommendations describe
some mechanisms to enhance collaboration: 1) the performance of a creative team depends
of individual ideas’ contribution, but also as much important is applying strategies and a pro-
cess of synchronizing (tuning in), integrating or selecting these contributions. 2) ICT as so-
cial media tools could reduce the ambiguity in the product definition and new team integra-
tion by means of knowing the role of each participant in the team and at the same time, the
ideas that each participant has of the product to be developed; 3) Thus, we recommend the
visualization of this social system of ideas, skills and contribution ownership tracking to pro-
duce an environment more secure to collaborate.
Analyzing the sources of collaboration for innovation (Chapter 2), we found that R&D SME
and creative teams need exchanges with their competitors, associates, as well as the Internet,
in a clear open innovation model. This contrasts with the closed innovation model, common-
ly found in the industrial sector, where the new product definition is an industrial secret,
without an external connection. This interrelationship between teams and their context re-
quires specific knowledge management strategies centered on ideas and knowledge sharing.
We recommend a techno-social system with a flexible open-close function between the team
and their context. This social relationship should be defined before any ICT implementation.
Also, this social dynamic implies the utilization of social networks, social events and com-
munity exchanges, which will be applied in parallel with the knowledge management system.
In addition, creative teams need a wide range of ICT tools, especially the Internet, to carry
out research on the state-of-the-art of a new technology. This informational condition defines
the need for a controlled remote space for ideas and knowledge exchange, even for co-
localized teams. The collaborative platform must include the pathway of Web Page links to
be shared with the team. Also, we recommend adding application to management the timing
and to keep participants aware of changes, deadlines and some performance statistics: idea

174
production numbers, votes, evaluation results, feedback in comments, etc. Creative teams
need to perceive tacit knowledge changes efficiently in order to define their ideas.
Future Research Work
The results obtained in this thesis highlight certain functionalities of the collaborative Plat-
form that have to be explored, such as collaborative tagging and the impact of the evaluation
of ideas on the innovation process. It still remains to study the impact of codification process
in the use of ICT for ideas sharing. Particularly, we highlight this point, because the ideas’
codification, as we had observed is not a process realized frequently with non- ICT tools used
in co-localized conditions. The last results of the user experience test (Chapter 8) aim to im-
prove some functionalities of the Platform that need to be redefined. Moreover, the introduc-
tion of new KMS support is based on spontaneous contributions aggregated in open collabo-
rative projects, or includes guidance for users that need implementing structured creative
methods like TRIZ7, ASIT8 or C-K9.
Finally, InnoKiz proposes a new interaction among communities and industry that needs to
be explored, and represents a good challenge to be undertaken.
7 TRIZ, from the Russian acronym ARIZ (Altgoritm Reshenia Izobretatelskih Zadach) is the Theory of In-ventive Problems Solving proposed by Genrikh Altshuller in 1946. Altshuller studied more than 1000 patents to identify the ARIZ algorithm and 40 principles of contradiction used by inventors Semyon, D. Savransky, et Semyon D. Savransky. 2000. Engineering of creativity : introduction to TRIZ methodology of inventive problem solving. Boca Raton, Flor.: Boca Raton, Flor. : CRC Press.. 8Advanced Systematic Inventive Thinking, ASIT: “This method ‘manipulates’ concrete or abstract things with the same end: resolving rephrased problems in order to find innovative solutions. It tackles all kinds of sub-jects/issues (e.g. physical, organizational, procedural, etc.) and offers a set of tools for defining contradictions, solving problems and selecting solutions”. Available, April, 25, 2013 at : http://create2009.europa.eu/fileadmin/Content/Downloads/PDF/Projects/National_projects/FR_ASIT_method_of_creative_resolution.pdf 9 C-K, Concepts and Knowledge, is a method of reasoning on design to define the limits between the concepts and the knowledge of a new product. Method developed by Hatchuel and collaborators. Hatchuel, Armand, et Benoît Weil. 2002. « La théorie CK: Fondements et usages d’une théorie unifiée de la conception. ». In Colloque «Sciences de la conception». (Lyon, France, 15-16 mars).

APPENDIX I
ETHICAL PLAN CONSENTMENT AND INFORMATION FORM
FORMULAIRE D’INFORMATION ET DE CONSENTEMENT
Analyse des activités et le support pour les équipes qui réalisent projets innova-
teurs lors de la compétition internationale 24 heures de l’innovation
IDENTIFICATION
Responsable du projet : Mickaël Gardoni
Département : Génie de la Production Automatisée
Adresse postale : École de technologie supérieure. Local A-3588, 1100 rue Notre-Dame Ouest, Mon-
tréal (Québec) H3C 1K3
Adresse courriel : [email protected]
Membres de l’équipe : Luz Maria Jiménez, Shuaib Qureshi, Mario Dubois, Pierre Gignac,
BUT GÉNERAL DU PROJET
Cette recherche déterminera les besoins en information et en matériel informatique des équipes qui
font un projet innovateur à distance. Cette recherche se réalise en parallèle de la compétition interna-
tionale des « 24 heures de l’innovation ». Au cours de cette recherche, nous essayons de spécifier un
environnement informationnel et informatique qui pourrait notamment supporter les « 24h de
l’innovation » dans les prochaines éditions ou tout projet équivalent.
Pendant le déroulement de la compétition, notre équipe de recherche proposera des questionnaires en
ligne et un entretien. Vos réponses nous permettront mieux comprendre les outils de support aux pro-
jets à distance.
PROCÉDURE
Vous recevrez ce courriel d’invitation, à la suite de votre inscription en ligne à la compétition « 24h
de l’innovation » (qui a lieu entre le 23 et le 24 mai, 2012).
Lisez attentivement le présent document, si vous êtes d’accord pour participer à la recherche, nous
vous invitons à cocher la casse d’acceptation (ci-dessous) et à nous donner votre courriel pour que
nous puissions vous recontacter.

176
Pendant la compétition, notre équipe de recherche vous enverra un courriel avec les liens des formu-
laires à remplir en ligne. En moyenne vous prendrez 2 minutes pour remplir un questionnaire tous
trois heures. À la fin, de la compétition un des membres de l’équipe de recherche pourrait vous con-
tacter pour vous demander votre avis sur les outils et l’environnement informatique utilisés. Veuillez
noter que cet entretien pourrait être enregistré (audio -numérique), il aura une durée d’environ 10
minutes.
AVANTAGES
Comme participant vous pourrez avoir une meilleure compréhension des activités et des étapes qui
interviennent dans la réalisation d’un projet axée sur l’innovation. Aussi, vous utiliserez des outils
informationnels ou informatiques qui pourront améliorer les conditions ou les stratégies du travail
créatif en équipe dans la formulation de nouveaux produits ou services. Ces connaissances vous se-
ront utiles dans votre carrière professionnelle.
RISQUES ET INCONVÉNIENTS
La participation à cette recherche ne présente aucun risque pour votre sécurité. Pour la protection de
vos renseignements personnels, l’équipe de recherche s’engage conformément à la Loi sur l’accès aux
documents publics et la protection des renseignements personnels, à ne pas divulguer votre courriel
en aucun cas.
CONFIDENTIALITÉ
Après avoir reçu vos informations sur les formulaires en ligne, vos renseignements personnels : nom,
prénom et votre adresse courriel seront remplacés par un code qui vous identifiera. Le fichier numé-
rique contenant le code assigné et vos informations sera conservé dans un ordinateur sous un mot de
passe dans le bureau du professeur Mickaël Gardoni pendant 5 ans après ce temps, la liste d’encodage
sera détruite. Les données numériques produites et l’enregistrement audio numérique seront stockés
sous clé et mot de passe dans l’ordinateur du laboratoire de recherche en maintenant en tout le temps
votre anonymat par le responsable du projet et elles seront utilisées uniquement que pour la re-
cherche.
PARTICIPATION VOLONTAIRE ET DROIT DE RETRAIT
Votre participation à ce projet est volontaire. Cela signifie que vous acceptez de participer au projet
sans aucune contrainte ou pression extérieure, et que par ailleurs vous êtes libre de mettre fin à votre

177
participation en tout temps au cours de cette recherche. Dans ce cas, les renseignements recueilles
seront détruits.
Votre accord à participer implique également que vous acceptez que l’équipe de recherche puisse
utiliser aux fins de la présente recherche (articles, conférences et communications scientifiques) les
renseignements recueillis à la condition qu’aucune information permettant de vous identifier ne soit
divulguée publiquement.
COMPENSATION FINANCIÈRE
Aucune compensation ne sera offerte.
DES QUESTIONS SUR LE PROJET OU SUR VOS DROITS?
L’étude est réalisée par le professeur Mickaël Gardoni, vous pourrez le rejoindre en tout temps au
local A-3588 de l’École de technologie supérieure ou sur place de la compétition internationale, par
téléphone (514)396-8595 ou par courriel [email protected]
Aussi, vous pouvez contacter à Luz Maria Jiménez au local A-3754 de l’École de technologie supé-
rieure ou sur place de la compétition internationale, par téléphone (514) 396-8800 poste 7260 ou par
courriel [email protected]
Le Comité d’éthique de la recherche avec des êtres humains de l’ÉTS a approuvé ce projet de re-
cherche auquel vous allez participer. Pour toute autre question concernant vos droits en tant que sujet
de recherche, vous pouvez contacter le président du Comité d’éthique de l’École de technologie supé-
rieure au (514)396-8829.
REMERCIEMENTS
Votre collaboration est essentielle à la réalisation de notre projet et l’équipe de recherche tient à vous
en remercier. Si vous souhaitez obtenir un résume écrit des principaux résultats de cette recherche,
veuillez ajouter vos coordonnées ci-dessous.
SIGNATURES
Je, soussigné(e)_________________________________ reconnais avoir lu le présent formulaire de
consentement et consens volontairement à participer à ce projet de recherche. Je reconnais avoir dis-

178
posé de suffisamment de renseignements et du temps nécessaire pour réfléchir à ma décision. Je com-
prends que ma participation à cette recherche est totalement volontaire et que je peux y mettre fin en
tout temps, sans pénalité d’aucune forme, ni justification à donner. Le cas échéant, je m’engage à
prévenir le responsable du projet.
Je confirme que j’accepte les conditions de cette recherche en validant mon accord sur l’onglet je suis
d’accord. Je comprends que je ne renonce aucunement à mes droits ni ne libère le(s) chercheur(s) de
leurs responsabilités légales et professionnelles.
J’accepte participer au projet de recherche sur les 24 heures de l’innovation
Oui ____ Non ______
Nom et coordonnées du participant :
Adresse courriel :
Date :
Je, soussigné(e) _______________________________ certifie avoir expliqué au signataire intéressé
les termes du présent formulaire, avoir répondu à ses questions et lui avoir clairement indiqué son
droit de mettre fin à son engagement en tout temps. Je lui transmettrai une copie signée du présent
formulaire de consentement.
Signature du responsable du projet ou son délégué(e) :
Date :

179
QUESTIONNAIRES
Three hours-by-three hours - Multiple choice form: Activity and stage
Provide a more detailed description if you work in another activity that is not cited: (Open Question)
How many people work on this activity?
Possible screen visualization of Multiple Choice Form:
Stage 1 2 3 4 5 6 7 8 9 10
ActivitiesProject Planning
Task Planning
Needs Analysis
Concepts searching
Solution proposal
Dimension and measures Prototype
Cost or economical analysis
Presentation preparation
Other activity
a) I propose solution ideas
b) I define the planning
c)I manage the task of team members
d)I chose or reject solutions
e) I act or react in order to converge in time
f)
I define (part of) the method for evaluation
g)
I engage the team in developing or stopping the development of a solution
h)I refine or interpret the cl ient brief
i)I interpret rules and restrictions
j)
I add, delete or modify technical constraints

180
Online forms:
Knowledge capture of context
1. Form 6H
Item Description
Identification Code or e-mail:
Team name:
Activities real-
ized
Multiple choice (Frequent activities
identified in Table 1)
Knowledge cap-
tured from the
context
What knowledge was essential to identi-
fying the context of the project? (Open
Question)
Media used:
a) Voice (Face-to-face)
b) Image
c) Drawing
d) Conceptual Map
e) Internet Link
f) Text
g) Video
Who/Where do I find the information/
the knowledge to define the problem?
(Open Question)
Information resources:
a) People (consumers)
b) Internet search
c) Client (industrial constraints)
d) External expert
e) Internal team expert
What tools/media do I use to express the
context interpretation among team mem-
bers?
(Open question)
Open question
Needs Write the needs or expectations that you
have at this design stage
I would like to work during this
design stage with:
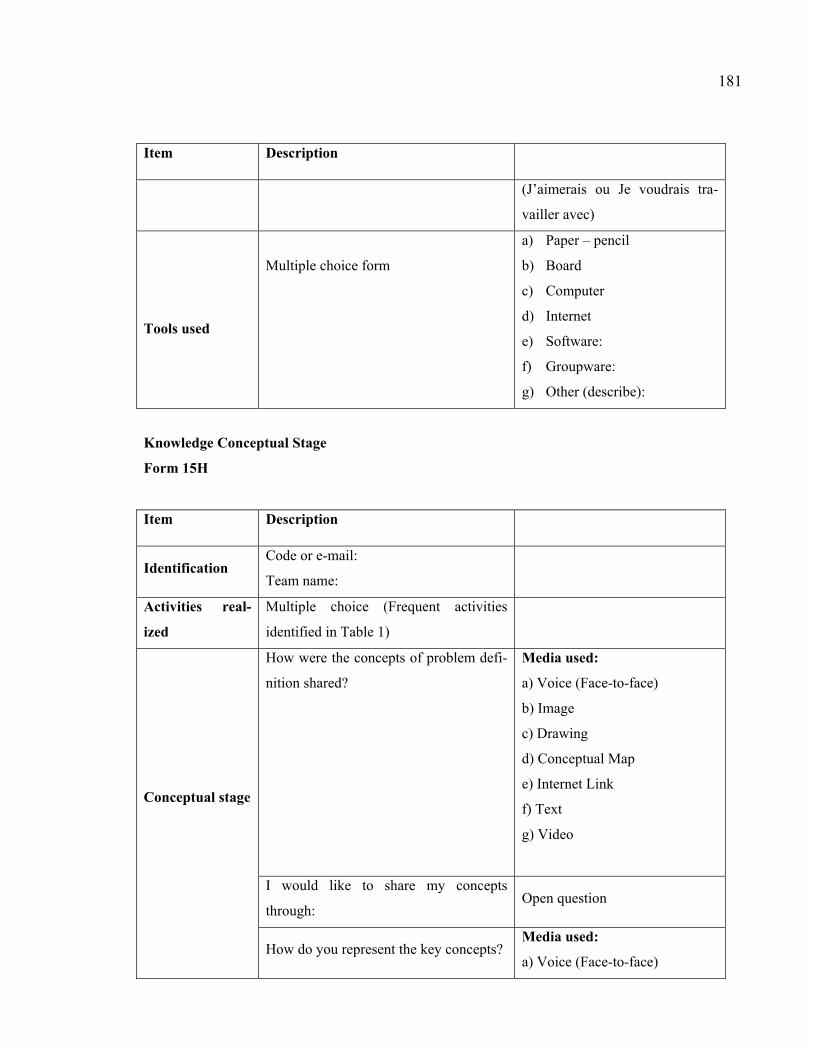
181
Item Description
(J’aimerais ou Je voudrais tra-
vailler avec)
Tools used
Multiple choice form
a) Paper – pencil
b) Board
c) Computer
d) Internet
e) Software:
f) Groupware:
g) Other (describe):
Knowledge Conceptual Stage
Form 15H
Item Description
Identification Code or e-mail:
Team name:
Activities real-
ized
Multiple choice (Frequent activities
identified in Table 1)
Conceptual stage
How were the concepts of problem defi-
nition shared?
Media used:
a) Voice (Face-to-face)
b) Image
c) Drawing
d) Conceptual Map
e) Internet Link
f) Text
g) Video
I would like to share my concepts
through: Open question
How do you represent the key concepts? Media used:
a) Voice (Face-to-face)
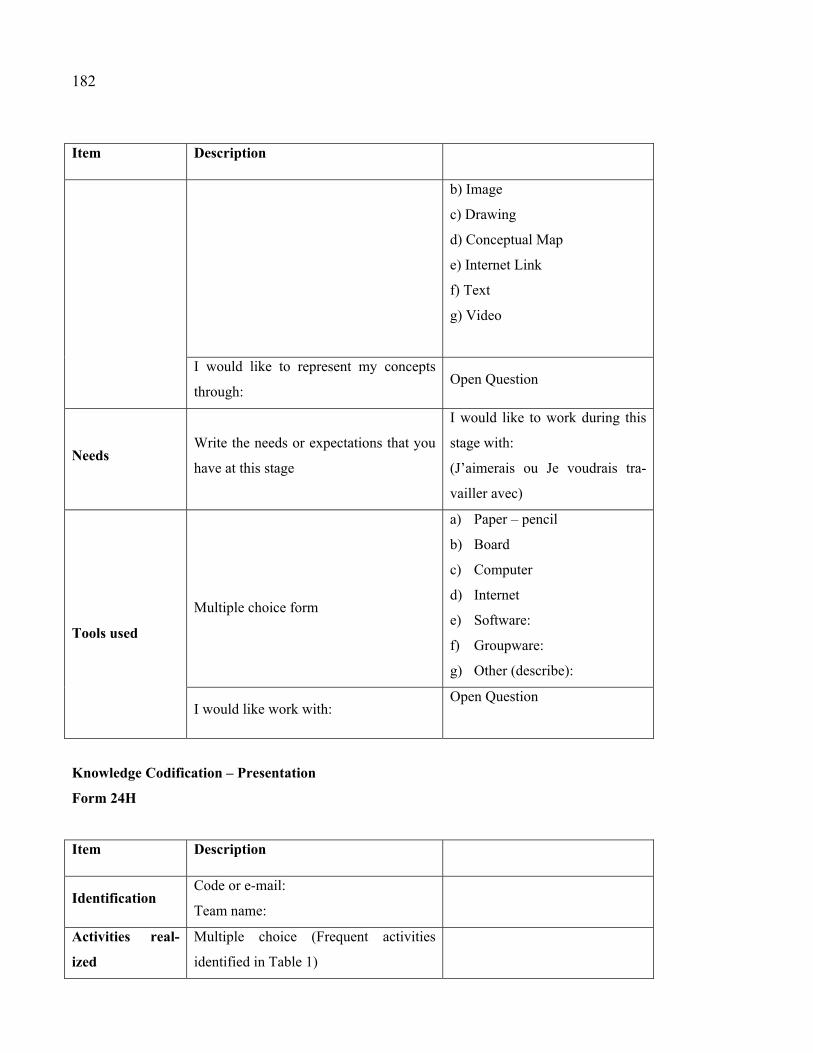
182
Item Description
b) Image
c) Drawing
d) Conceptual Map
e) Internet Link
f) Text
g) Video
I would like to represent my concepts
through: Open Question
Needs Write the needs or expectations that you
have at this stage
I would like to work during this
stage with:
(J’aimerais ou Je voudrais tra-
vailler avec)
Tools used
Multiple choice form
a) Paper – pencil
b) Board
c) Computer
d) Internet
e) Software:
f) Groupware:
g) Other (describe):
I would like work with: Open Question
Knowledge Codification – Presentation
Form 24H
Item Description
Identification Code or e-mail:
Team name:
Activities real-
ized
Multiple choice (Frequent activities
identified in Table 1)
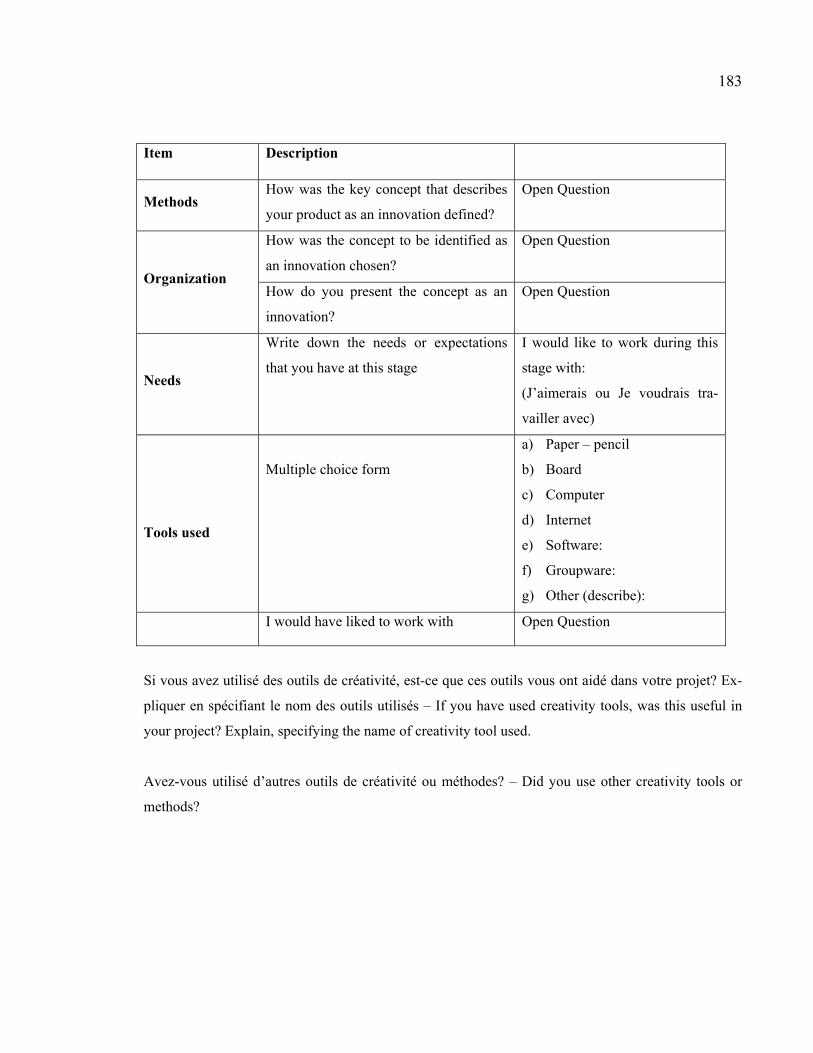
183
Item Description
Methods How was the key concept that describes
your product as an innovation defined?
Open Question
Organization
How was the concept to be identified as
an innovation chosen?
Open Question
How do you present the concept as an
innovation?
Open Question
Needs
Write down the needs or expectations
that you have at this stage
I would like to work during this
stage with:
(J’aimerais ou Je voudrais tra-
vailler avec)
Tools used
Multiple choice form
a) Paper – pencil
b) Board
c) Computer
d) Internet
e) Software:
f) Groupware:
g) Other (describe):
I would have liked to work with Open Question
Si vous avez utilisé des outils de créativité, est-ce que ces outils vous ont aidé dans votre projet? Ex-
pliquer en spécifiant le nom des outils utilisés – If you have used creativity tools, was this useful in
your project? Explain, specifying the name of creativity tool used.
Avez-vous utilisé d’autres outils de créativité ou méthodes? – Did you use other creativity tools or
methods?

184
Continuation. Questionnaire d’information 0h
Projet de recherche :
Analyse des activités et le support pour les équipes qui réalisent projets innovateurs lors de la compé-
tition internationale 24 heures de l’innovation
Questionnaire d’information
Ce questionnaire vise à recueillir des informations sur vous, notamment votre formation, votre activi-
té actuelle et vos expériences dans projets. Ces informations nous permettront identifier le profil des
équipes participantes par rapport aux compétences et à l’expérience personnelle de ses membres.
À propos de vous
Âge __________ Sexe : Homme _________ Femme ________
Votre formation
Niveau d’études complétés Bac _________. DESS_____ Maîtrise_____ Doctorat _____
Discipline ____________
Votre activité actuelle (Ne remplissez que les champs qui s’adressent à votre situation)
Statut : Étudiant__________ Professeur__________ Professionnel __________
Domaine d’activité actuel
Programme d’études actuel : Bac_________ DESS _______ Maîtrise ____ Doctorat __
Discipline : ________________
Vos expériences concernant le travail en équipe et en travail créatif
Nombre d’outils informatiques utilisés pour les travaux en équipe :
Aucun ____1 à 5 _____ 6 à 10 _____ + de 10 _____________
Nombre de projets réalisés avec ces outils :
Aucun ____1 à 5 _____ 6 à 10 _____ + de 10 _____________

185
Nombre de participants dans les projets __________ Votre rôle : _____________
Activités réalisées :
_______________________________________________________________________
________________________________________________________________________
Exemples de méthodes créatives ou d’outils utilisés :
_________________________________________________________________________________
Questionnaire sur la créativité
Ce questionnaire vise à recueillir vos impressions sur vos activités créatives au cours de ces « 24h de
l’innovation » ainsi que sur votre implication au sein de votre équipe de travail.
Évaluation de la composition du groupe
RienUn peu
Moy-enne Un plus
Beaucoup
Évaluation personnelle 1 2 3 4 5 1 Tolérance a l'ambiguïté 2 Le problème est très complexe
3 Possibilité de voir un problème selon diffé-rents points de vue
4 Capable de générer beaucoup d'idées 5 Extraverti plus qu'intraverti
6 Capable de pensée en convergence et en di-vergence
7 Capable de pensée en analytique et en intuitif 8 Capable de produire des idées originales 9 Contrôle du projet 10 persévérance pour résoudre le problème 11 confiance en soi 12 prise de risques calculés 13 Capable de produire une grande quantité idées
14 Capable d'ajouter d'améliorer une idée exis-tante
15 intérêts pour l’esthétisme 16 Capable d'une pensée indépendante

186
Évaluation de la composition du groupe
Rien Un peu Moyenne Un plus Beaucoup
Non Oui Caractéristiques de groupe 1 2 3 4 5
1 Même sexe 2 Membres avec diverses personnalités
3 Membres possèdent les mêmes habiletés créa-tives
4 Compatibilité : besoins mutuels satisfaits 5 Capables de travailler ensemble 6 Moins de deux années d'expériences de travail
7 J’ai pu convaincre aux autres de mes bonnes idées
8 L’équipe a pris des risques dans le projet
9 L’équipe a valorisé les idées ou les connais-sances des co-équipiers
10 J’ai pu suivre la démarche du projet
11 J’ai compris clairement les idées de mes col-lègues
12 J’étais impliqué dans l’obtention d’une inno-vation
Caractéristiques du sujet demandé Rien Un peu
Moy-enne Un plus Beaucoup
Le problème étudié a/est : 1 2 3 4 5 1 relatif seulement à une solution 2 très intéressant
3 requiert un effort modéré pour obtenir une solution
4 été travaillé par le groupe avant 5 Requiert très peu de modélisation et calcul 6 clairement compris pour tous 7 fourni suffisamment d'informations
8 a besoin de beaucoup de ressources pour ré-soudre
RienUn peu
Moy-enne Un plus
Beaucoup
1 2 3 4 5 La majorité du groupe 9 a clairement compris la demande 10 comprend les techniques créatives 11 connaît son rôle au sein de l'équipe 12 fait les effort pour présenter des idées créatives
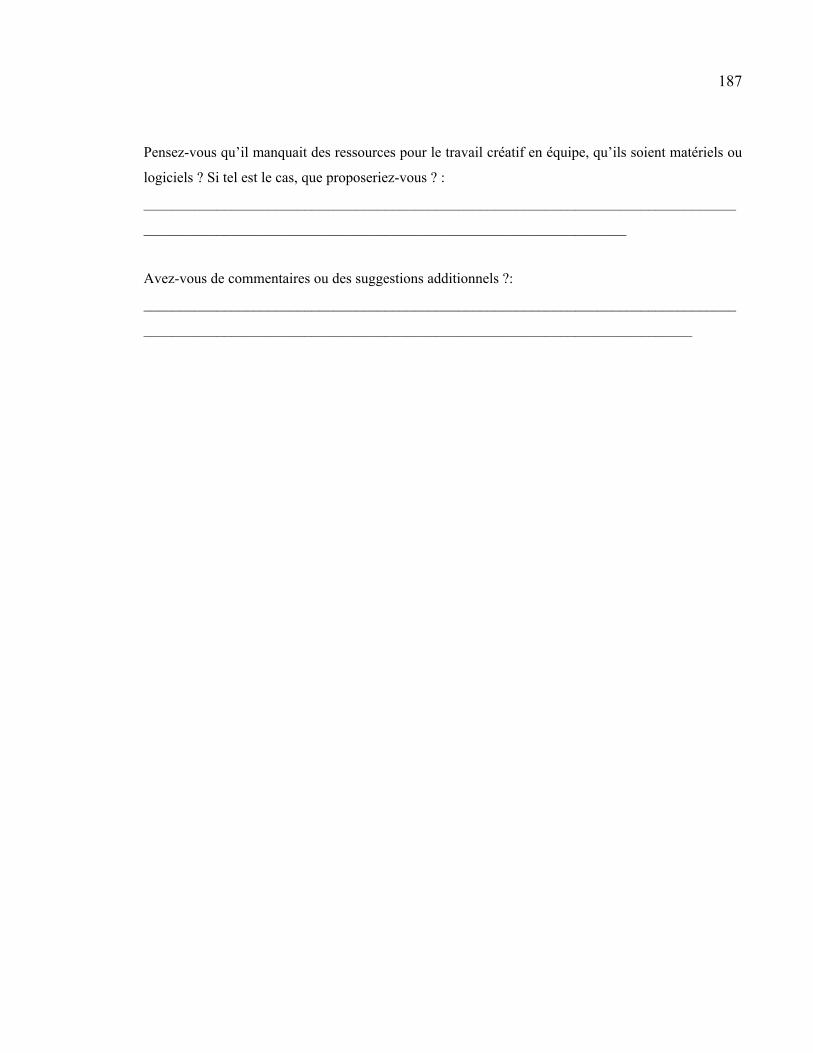
187
Pensez-vous qu’il manquait des ressources pour le travail créatif en équipe, qu’ils soient matériels ou
logiciels ? Si tel est le cas, que proposeriez-vous ? :
_________________________________________________________________________________
__________________________________________________________________
Avez-vous de commentaires ou des suggestions additionnels ?:
_________________________________________________________________________________
___________________________________________________________________________
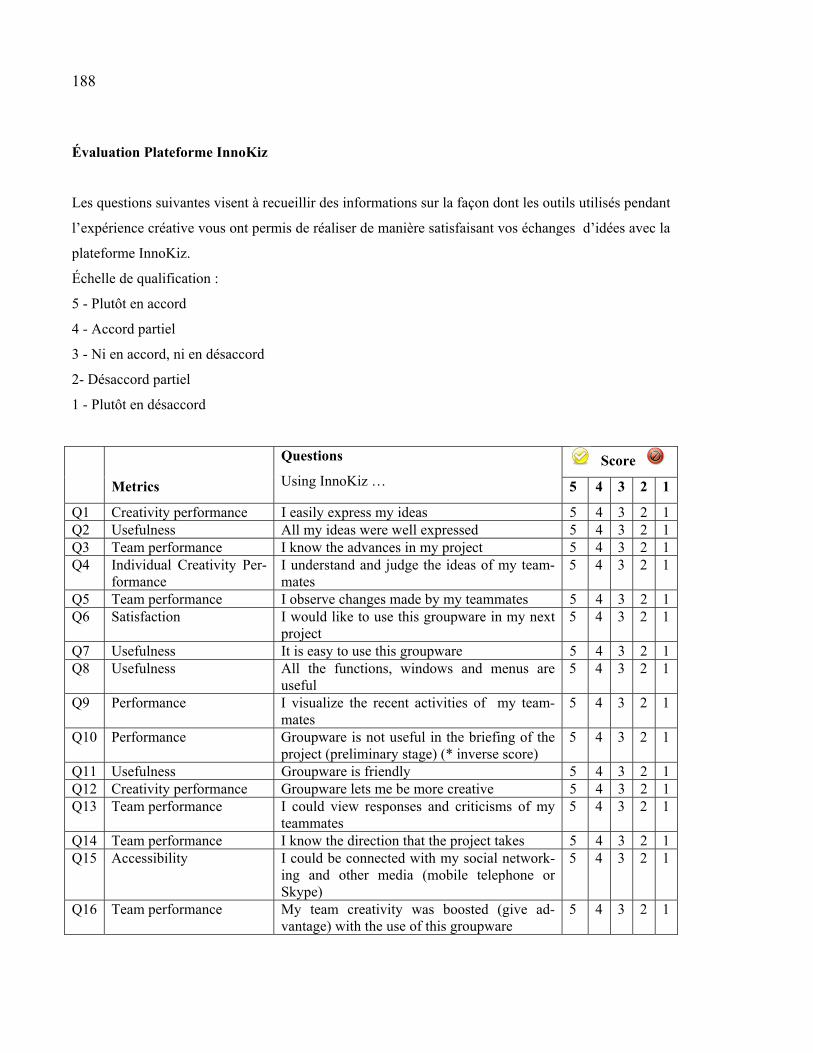
188
Évaluation Plateforme InnoKiz
Les questions suivantes visent à recueillir des informations sur la façon dont les outils utilisés pendant
l’expérience créative vous ont permis de réaliser de manière satisfaisant vos échanges d’idées avec la
plateforme InnoKiz.
Échelle de qualification :
5 - Plutôt en accord
4 - Accord partiel
3 - Ni en accord, ni en désaccord
2- Désaccord partiel
1 - Plutôt en désaccord
Questions
Using InnoKiz … Score
Metrics 5 4 3 2 1
Q1 Creativity performance I easily express my ideas 5 4 3 2 1 Q2 Usefulness All my ideas were well expressed 5 4 3 2 1 Q3 Team performance I know the advances in my project 5 4 3 2 1 Q4 Individual Creativity Per-
formance I understand and judge the ideas of my team-mates
5 4 3 2 1
Q5 Team performance I observe changes made by my teammates 5 4 3 2 1 Q6 Satisfaction I would like to use this groupware in my next
project 5 4 3 2 1
Q7 Usefulness It is easy to use this groupware 5 4 3 2 1 Q8 Usefulness All the functions, windows and menus are
useful 5 4 3 2 1
Q9 Performance I visualize the recent activities of my team-mates
5 4 3 2 1
Q10 Performance Groupware is not useful in the briefing of the project (preliminary stage) (* inverse score)
5 4 3 2 1
Q11 Usefulness Groupware is friendly 5 4 3 2 1 Q12 Creativity performance Groupware lets me be more creative 5 4 3 2 1 Q13 Team performance I could view responses and criticisms of my
teammates 5 4 3 2 1
Q14 Team performance I know the direction that the project takes 5 4 3 2 1 Q15 Accessibility I could be connected with my social network-
ing and other media (mobile telephone or Skype)
5 4 3 2 1
Q16 Team performance My team creativity was boosted (give ad-vantage) with the use of this groupware
5 4 3 2 1
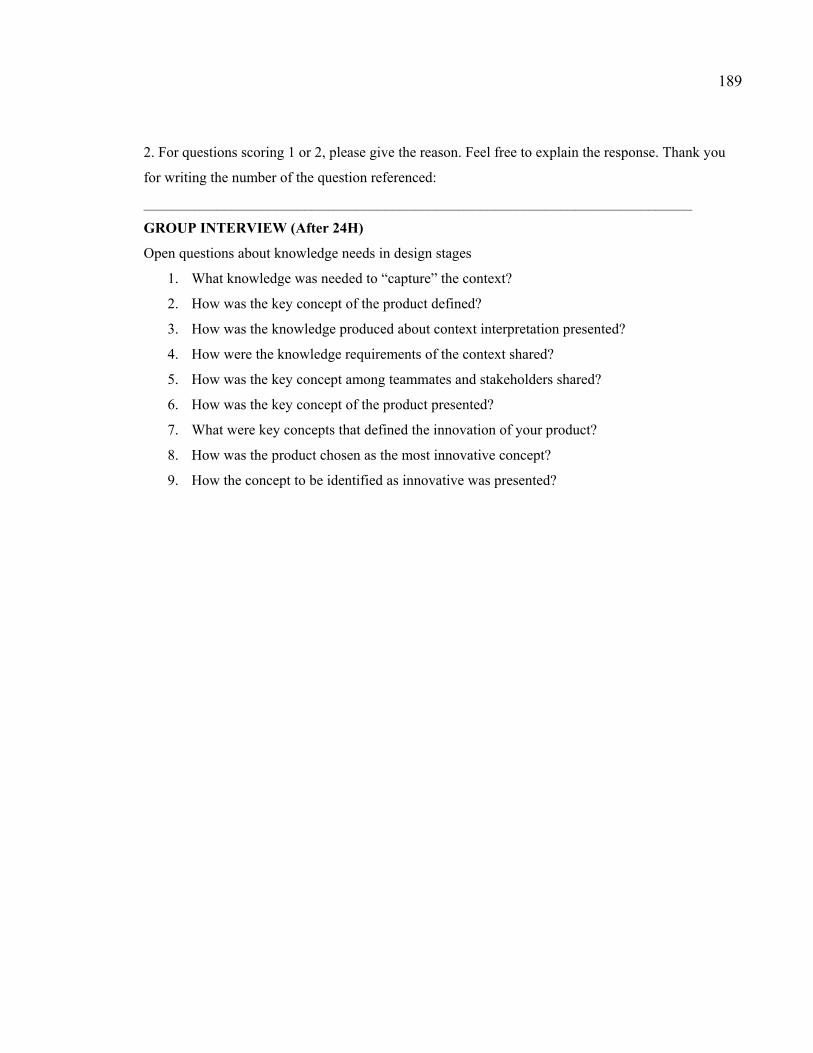
189
2. For questions scoring 1 or 2, please give the reason. Feel free to explain the response. Thank you
for writing the number of the question referenced:
___________________________________________________________________________
GROUP INTERVIEW (After 24H)
Open questions about knowledge needs in design stages
1. What knowledge was needed to “capture” the context?
2. How was the key concept of the product defined?
3. How was the knowledge produced about context interpretation presented?
4. How were the knowledge requirements of the context shared?
5. How was the key concept among teammates and stakeholders shared?
6. How was the key concept of the product presented?
7. What were key concepts that defined the innovation of your product?
8. How was the product chosen as the most innovative concept?
9. How the concept to be identified as innovative was presented?

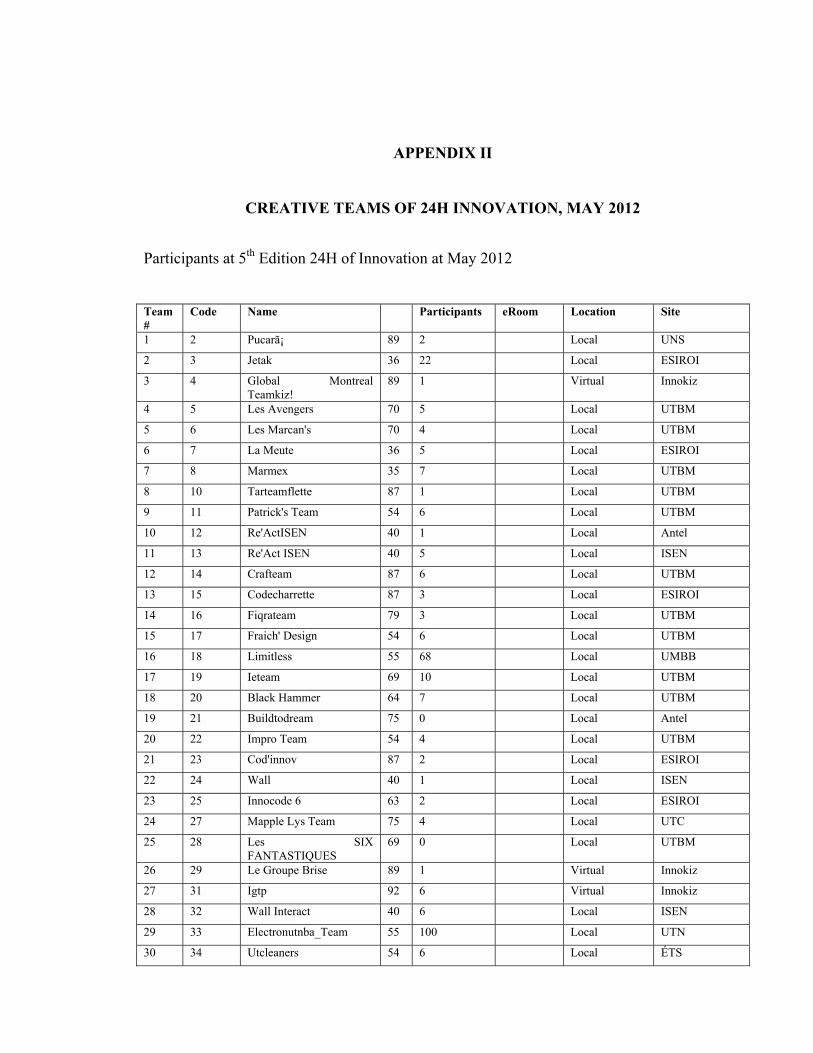
APPENDIX II
CREATIVE TEAMS OF 24H INNOVATION, MAY 2012
Participants at 5th Edition 24H of Innovation at May 2012
Team #
Code Name Participants eRoom Location Site
1 2 Pucarã¡ 89 2 Local UNS
2 3 Jetak 36 22 Local ESIROI
3 4 Global Montreal Teamkiz!
89 1 Virtual Innokiz
4 5 Les Avengers 70 5 Local UTBM
5 6 Les Marcan's 70 4 Local UTBM
6 7 La Meute 36 5 Local ESIROI
7 8 Marmex 35 7 Local UTBM
8 10 Tarteamflette 87 1 Local UTBM
9 11 Patrick's Team 54 6 Local UTBM
10 12 Re'ActISEN 40 1 Local Antel
11 13 Re'Act ISEN 40 5 Local ISEN
12 14 Crafteam 87 6 Local UTBM
13 15 Codecharrette 87 3 Local ESIROI
14 16 Fiqrateam 79 3 Local UTBM
15 17 Fraich' Design 54 6 Local UTBM
16 18 Limitless 55 68 Local UMBB
17 19 Ieteam 69 10 Local UTBM
18 20 Black Hammer 64 7 Local UTBM
19 21 Buildtodream 75 0 Local Antel
20 22 Impro Team 54 4 Local UTBM
21 23 Cod'innov 87 2 Local ESIROI
22 24 Wall 40 1 Local ISEN
23 25 Innocode 6 63 2 Local ESIROI
24 27 Mapple Lys Team 75 4 Local UTC
25 28 Les SIX FANTASTIQUES
69 0 Local UTBM
26 29 Le Groupe Brise 89 1 Virtual Innokiz
27 31 Igtp 92 6 Virtual Innokiz
28 32 Wall Interact 40 6 Local ISEN
29 33 Electronutnba_Team 55 100 Local UTN
30 34 Utcleaners 54 6 Local ÉTS
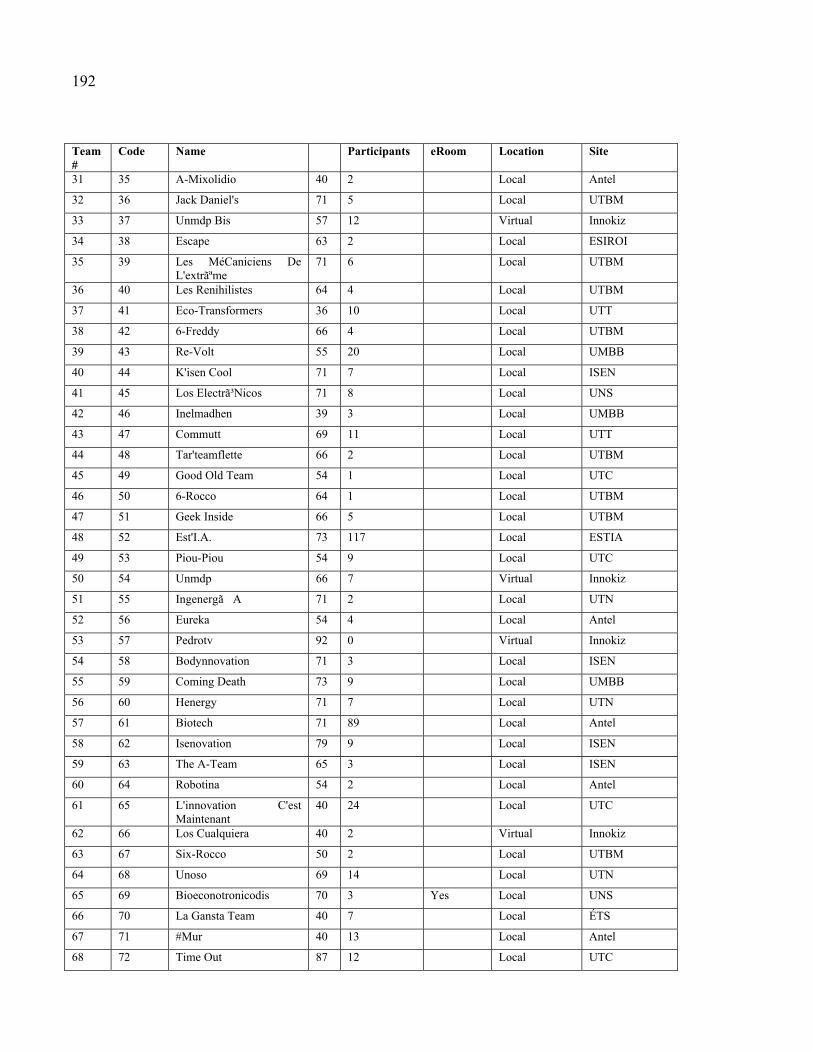
192
Team #
Code Name Participants eRoom Location Site
31 35 A-Mixolidio 40 2 Local Antel
32 36 Jack Daniel's 71 5 Local UTBM
33 37 Unmdp Bis 57 12 Virtual Innokiz
34 38 Escape 63 2 Local ESIROI
35 39 Les MéCaniciens De L'extrãªme
71 6 Local UTBM
36 40 Les Renihilistes 64 4 Local UTBM
37 41 Eco-Transformers 36 10 Local UTT
38 42 6-Freddy 66 4 Local UTBM
39 43 Re-Volt 55 20 Local UMBB
40 44 K'isen Cool 71 7 Local ISEN
41 45 Los Electrã³Nicos 71 8 Local UNS
42 46 Inelmadhen 39 3 Local UMBB
43 47 Commutt 69 11 Local UTT
44 48 Tar'teamflette 66 2 Local UTBM
45 49 Good Old Team 54 1 Local UTC
46 50 6-Rocco 64 1 Local UTBM
47 51 Geek Inside 66 5 Local UTBM
48 52 Est'I.A. 73 117 Local ESTIA
49 53 Piou-Piou 54 9 Local UTC
50 54 Unmdp 66 7 Virtual Innokiz
51 55 Ingenergã A 71 2 Local UTN
52 56 Eureka 54 4 Local Antel
53 57 Pedrotv 92 0 Virtual Innokiz
54 58 Bodynnovation 71 3 Local ISEN
55 59 Coming Death 73 9 Local UMBB
56 60 Henergy 71 7 Local UTN
57 61 Biotech 71 89 Local Antel
58 62 Isenovation 79 9 Local ISEN
59 63 The A-Team 65 3 Local ISEN
60 64 Robotina 54 2 Local Antel
61 65 L'innovation C'est Maintenant
40 24 Local UTC
62 66 Los Cualquiera 40 2 Virtual Innokiz
63 67 Six-Rocco 50 2 Local UTBM
64 68 Unoso 69 14 Local UTN
65 69 Bioeconotronicodis 70 3 Yes Local UNS
66 70 La Gansta Team 40 7 Local ÉTS
67 71 #Mur 40 13 Local Antel
68 72 Time Out 87 12 Local UTC
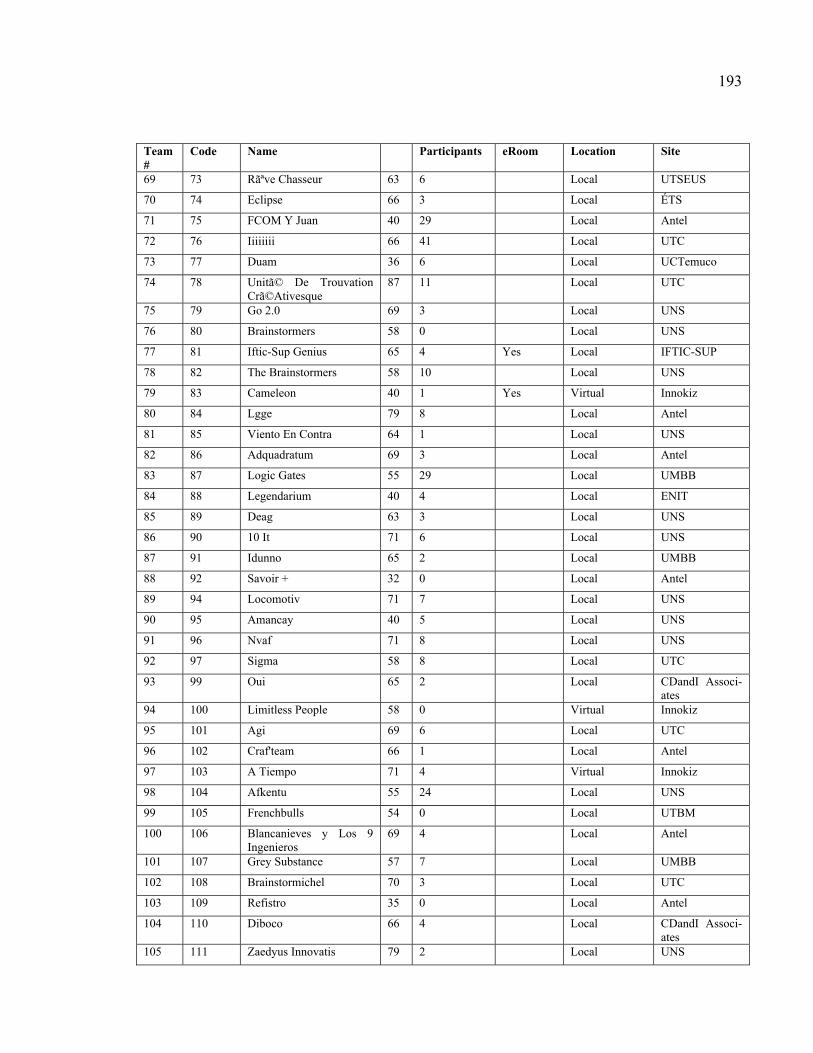
193
Team #
Code Name Participants eRoom Location Site
69 73 Rãªve Chasseur 63 6 Local UTSEUS
70 74 Eclipse 66 3 Local ÉTS
71 75 FCOM Y Juan 40 29 Local Antel
72 76 Iiiiiiii 66 41 Local UTC
73 77 Duam 36 6 Local UCTemuco
74 78 Unitã© De Trouvation Crã©Ativesque
87 11 Local UTC
75 79 Go 2.0 69 3 Local UNS
76 80 Brainstormers 58 0 Local UNS
77 81 Iftic-Sup Genius 65 4 Yes Local IFTIC-SUP
78 82 The Brainstormers 58 10 Local UNS
79 83 Cameleon 40 1 Yes Virtual Innokiz
80 84 Lgge 79 8 Local Antel
81 85 Viento En Contra 64 1 Local UNS
82 86 Adquadratum 69 3 Local Antel
83 87 Logic Gates 55 29 Local UMBB
84 88 Legendarium 40 4 Local ENIT
85 89 Deag 63 3 Local UNS
86 90 10 It 71 6 Local UNS
87 91 Idunno 65 2 Local UMBB
88 92 Savoir + 32 0 Local Antel
89 94 Locomotiv 71 7 Local UNS
90 95 Amancay 40 5 Local UNS
91 96 Nvaf 71 8 Local UNS
92 97 Sigma 58 8 Local UTC
93 99 Oui 65 2 Local CDandI Associ-ates
94 100 Limitless People 58 0 Virtual Innokiz
95 101 Agi 69 6 Local UTC
96 102 Craf'team 66 1 Local Antel
97 103 A Tiempo 71 4 Virtual Innokiz
98 104 Afkentu 55 24 Local UNS
99 105 Frenchbulls 54 0 Local UTBM
100 106 Blancanieves y Los 9 Ingenieros
69 4 Local Antel
101 107 Grey Substance 57 7 Local UMBB
102 108 Brainstormichel 70 3 Local UTC
103 109 Refistro 35 0 Local Antel
104 110 Diboco 66 4 Local CDandI Associ-ates
105 111 Zaedyus Innovatis 79 2 Local UNS
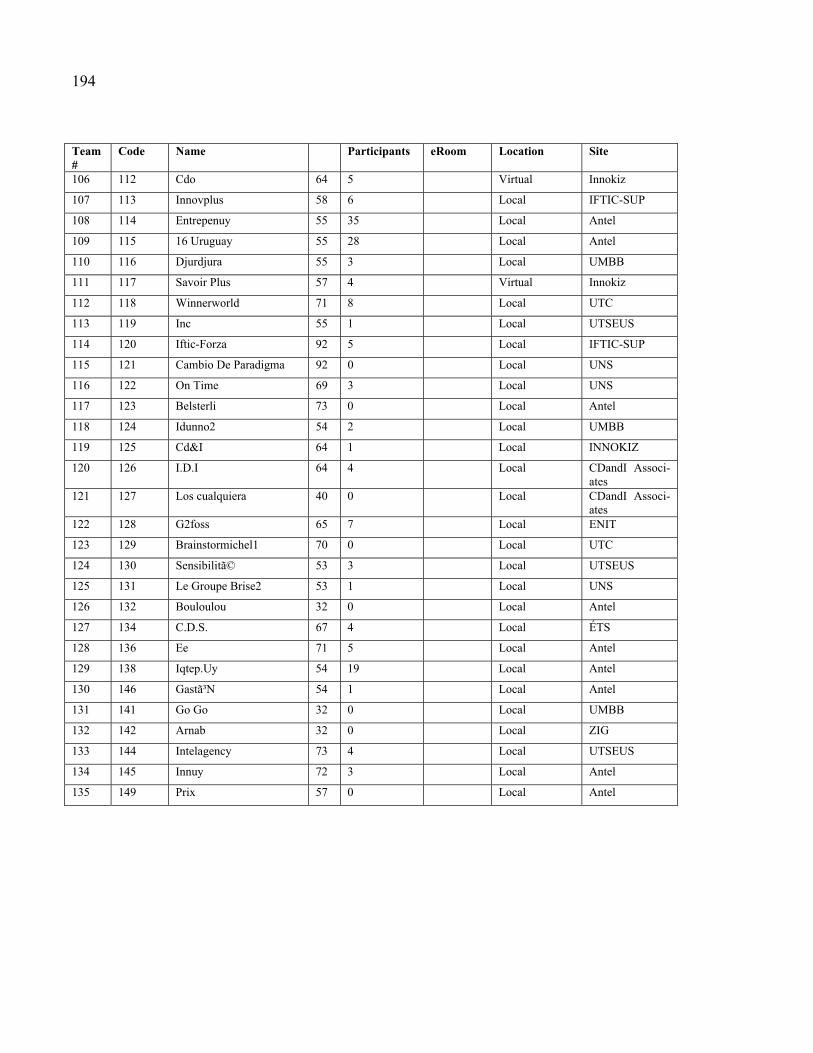
194
Team #
Code Name Participants eRoom Location Site
106 112 Cdo 64 5 Virtual Innokiz
107 113 Innovplus 58 6 Local IFTIC-SUP
108 114 Entrepenuy 55 35 Local Antel
109 115 16 Uruguay 55 28 Local Antel
110 116 Djurdjura 55 3 Local UMBB
111 117 Savoir Plus 57 4 Virtual Innokiz
112 118 Winnerworld 71 8 Local UTC
113 119 Inc 55 1 Local UTSEUS
114 120 Iftic-Forza 92 5 Local IFTIC-SUP
115 121 Cambio De Paradigma 92 0 Local UNS
116 122 On Time 69 3 Local UNS
117 123 Belsterli 73 0 Local Antel
118 124 Idunno2 54 2 Local UMBB
119 125 Cd&I 64 1 Local INNOKIZ
120 126 I.D.I 64 4 Local CDandI Associ-ates
121 127 Los cualquiera 40 0 Local CDandI Associ-ates
122 128 G2foss 65 7 Local ENIT
123 129 Brainstormichel1 70 0 Local UTC
124 130 Sensibilitã© 53 3 Local UTSEUS
125 131 Le Groupe Brise2 53 1 Local UNS
126 132 Bouloulou 32 0 Local Antel
127 134 C.D.S. 67 4 Local ÉTS
128 136 Ee 71 5 Local Antel
129 138 Iqtep.Uy 54 19 Local Antel
130 146 Gastã³N 54 1 Local Antel
131 141 Go Go 32 0 Local UMBB
132 142 Arnab 32 0 Local ZIG
133 144 Intelagency 73 4 Local UTSEUS
134 145 Innuy 72 3 Local Antel
135 149 Prix 57 0 Local Antel
APPENDIX III
QUALITATIVE DATA ABOUT INNOKIZ EVALUATION
This appendix presents the data obtained following low scores for some InnoKiz functionali-
ties. 40 participants responded.

196
QUALITATIVE ANALYSIS. Table 1
Pa
rtic
ipa
nt
Please, describe why did you rate low 1 or 2 the last questions (about InnoKiz use/satisfaction)
Categories about low functionnalities rating
Why use InnoKiz ? Which functionnalities did you use?
P1 non non
P21. No usé la plataforma para la comunicación dado que estuvimos siempre en el mismo sitio.
Non use of InnoKiz, I am in a Colocalised team
Para comunicarme con el administrador y controlar el proyecto
P3Le site n'est pas assez érgonomique ..... on doit se familiariser plus avec le site. Low human factors web conférence.
P4 no escogi uno ni dos Unfamiliarity no lo utilice
P5porque no necesitamos usarla, sentimos que perdíamos mas tiempo usándola Non necessary the utilisation la usamos muy poco
P6 No se entiende la pregunta.
Lost of time using a platform for a colocalised team Para subir las ideas.
P7hubo buenos recursos humanos en el grupo. todos escuchamos las ideas y las criticas de todos Good communication with the team
para compartir tareas y opinar de su viabilidad y elegir la optima.Permite calificar al proyecto según diferentes competencias (ecológicas, económicas, etc.)
P8
Innokiz est une plateforme collaborative d'echange de connaissances et de création en terme d'innovation
pour la recherche de la créativité en terme d'innovation
P9la herramienta tiene sus limitaciones. y el relleno de tantos formularios complica el trabajo
Limitations of the information exchanged para contactarse con todo el equipo
P10
el sistemael formulario a veces es poco cprensible (sobre todo los cuadros de doble entrada) y además es excesivamente burocrático y va en contra d ela creatividad del grupo. Not necessary complete information
ideas, mails, contactos.. informes del resto, noticias de la organización
P11me sentí muy cómoda con el grupo, lo que permitio que me exprese libremente Not interesting see guide
para mantenerme en contacto en la red con mis compañeros del equipo
P12todo el equipo estuvo reunido en un solo sitio y no fue necesario usar herramientas de teamwork Colocalised team
para conocer los mensajes y completar los formularios
P13
No volvería a usar esta plataforma, ya que existen otras que permiten incorporar la misma información, y q son de uso diario. It is not easy incorporate information
La usamos únicamente para subir la idea final, porque creimos que era obligatorio.
P14 Dfurust
Other platform more easy and on basic diary use(Dropbox) solo para informarme de algunas cosas
P15 no las seleccione no se como se utiliza
P16es poco práctica la herramienta, en eficiciencia de tiempos Not efficient información sobre el evento
P17 no puse ningun 1 o 2para saber el avance del equipo y como iban el resto de los equipos
P18 N/Npara poder hacer un auto seguimiento, y reportar el progreso del equipo.
P19 no eleji ninguna no lo utilice
P20 - pas utilisé
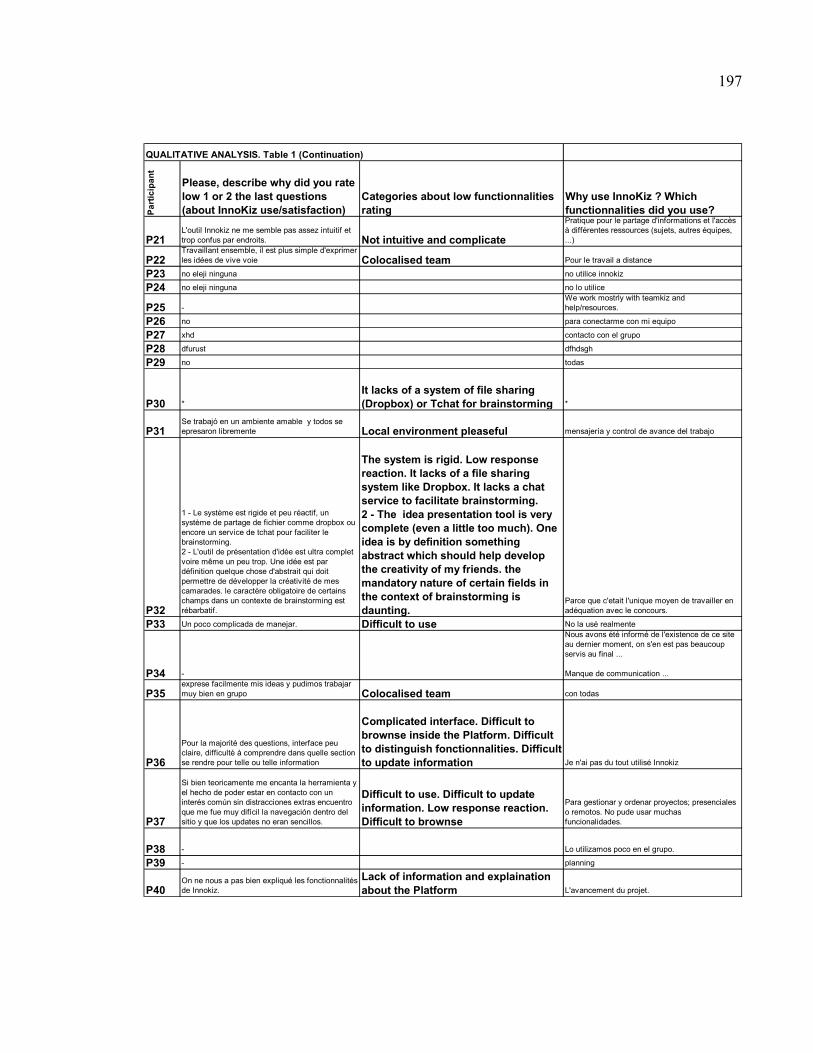
197
QUALITATIVE ANALYSIS. Table 1 (Continuation)P
art
icip
an
t
Please, describe why did you rate low 1 or 2 the last questions (about InnoKiz use/satisfaction)
Categories about low functionnalities rating
Why use InnoKiz ? Which functionnalities did you use?
P21L'outil Innokiz ne me semble pas assez intuitif et trop confus par endroits. Not intuitive and complicate
Pratique pour le partage d'informations et l'accès à différentes ressources (sujets, autres équipes, ...)
P22Travaillant ensemble, il est plus simple d'exprimer les idées de vive voie Colocalised team Pour le travail a distance
P23 no eleji ninguna no utilice innokiz
P24 no eleji ninguna no lo utilice
P25 -We work mostrly with teamkiz and help/resources.
P26 no para conectarme con mi equipo
P27 xhd contacto con el grupo
P28 dfurust dfhdsgh
P29 no todas
P30 *
It lacks of a system of file sharing (Dropbox) or Tchat for brainstorming *
P31Se trabajó en un ambiente amable y todos se epresaron libremente Local environment pleaseful mensajería y control de avance del trabajo
P32
1 - Le système est rigide et peu réactif, un système de partage de fichier comme dropbox ou encore un service de tchat pour faciliter le brainstorming. 2 - L'outil de présentation d'idée est ultra complet voire même un peu trop. Une idée est par définition quelque chose d'abstrait qui doit permettre de développer la créativité de mes camarades. le caractère obligatoire de certains champs dans un contexte de brainstorming est rébarbatif.
The system is rigid. Low response reaction. It lacks of a file sharing system like Dropbox. It lacks a chat service to facilitate brainstorming.2 - The idea presentation tool is very complete (even a little too much). One idea is by definition something abstract which should help develop the creativity of my friends. the mandatory nature of certain fields in the context of brainstorming is daunting.
Parce que c'etait l'unique moyen de travailler en adéquation avec le concours.
P33 Un poco complicada de manejar. Difficult to use No la usé realmente
P34 -
Nous avons été informé de l'existence de ce site au dernier moment, on s'en est pas beaucoup servis au final ...
Manque de communication ...
P35exprese facilmente mis ideas y pudimos trabajar muy bien en grupo Colocalised team con todas
P36
Pour la majorité des questions, interface peu claire, difficulté à comprendre dans quelle section se rendre pour telle ou telle information
Complicated interface. Difficult to brownse inside the Platform. Difficult to distinguish fonctionnalities. Difficult to update information Je n'ai pas du tout utilisé Innokiz
P37
Si bien teoricamente me encanta la herramienta y el hecho de poder estar en contacto con un interés común sin distracciones extras encuentro que me fue muy difícil la navegación dentro del sitio y que los updates no eran sencillos.
Difficult to use. Difficult to update information. Low response reaction. Difficult to brownse
Para gestionar y ordenar proyectos; presenciales o remotos. No pude usar muchas funcionalidades.
P38 - Lo utilizamos poco en el grupo.
P39 - planning
P40On ne nous a pas bien expliqué les fonctionnalités de Innokiz.
Lack of information and explaination about the Platform L'avancement du projet.

198
QUALITATIVE ANALYSIS. Table 1 (Continuation)
Pa
rtic
ipa
nt
Categories about Why use InnoKiz?
Do you think that it lacks of tools to creative teamwork? Software or materials? What do you propose?
Categories to add resources for collaborate
P1 non
P2 Administration Board
P3 Project control
Un contacte audio visuel avec les propriétaires de projets.Une description encore plus détaillé des limites de nos innovations.
Audio-visual contact with Project owners
P4 WebConference
P5 Ideas Sharing creo que no
P6 Ideas Selection No falta nada.
P7 Project qualification
P8Research in Creativity and Innovation
oui!!!dans notre cas il faut :
-- Connection internet très haut débit-- materiel de conception-- expertise metier-- ajout d'un module de messagerie instantanée sur Innokiz entre les membres d'une équipe ou d'un pays
Internet High Velocity, Material for design, Expertise in the domain, Agregates an instant messages to InnoKiz among team et among world participants
P9 To be connected with the team no
P10Ideas, mails, contacts and new of the organisation si. faltan anteriormente lo expresé
P11 Contact with my teammates no
P12 Knowing messages and guides la experiencia no permite opinar.
P13Display result (a part of competition)
Estuvo muy mal organizado el manejo de interne. En el lugar central de trabajo, internet andaba con una velocidad muy baja e incluso llegó a cortarse. Hubo grandes problemas de información a lo largo de toda la competencia.
Internet Problems, Organization of information for the Competence
P14 creo q no.P15
P16 Events information quiza.
P17Knowing teamwork changes and advancing no creo q falte nada
P18 Following others teamsNo. Tuvimos todo a lo que necesitamos a nuestro alcance. Time
P19
P20 -
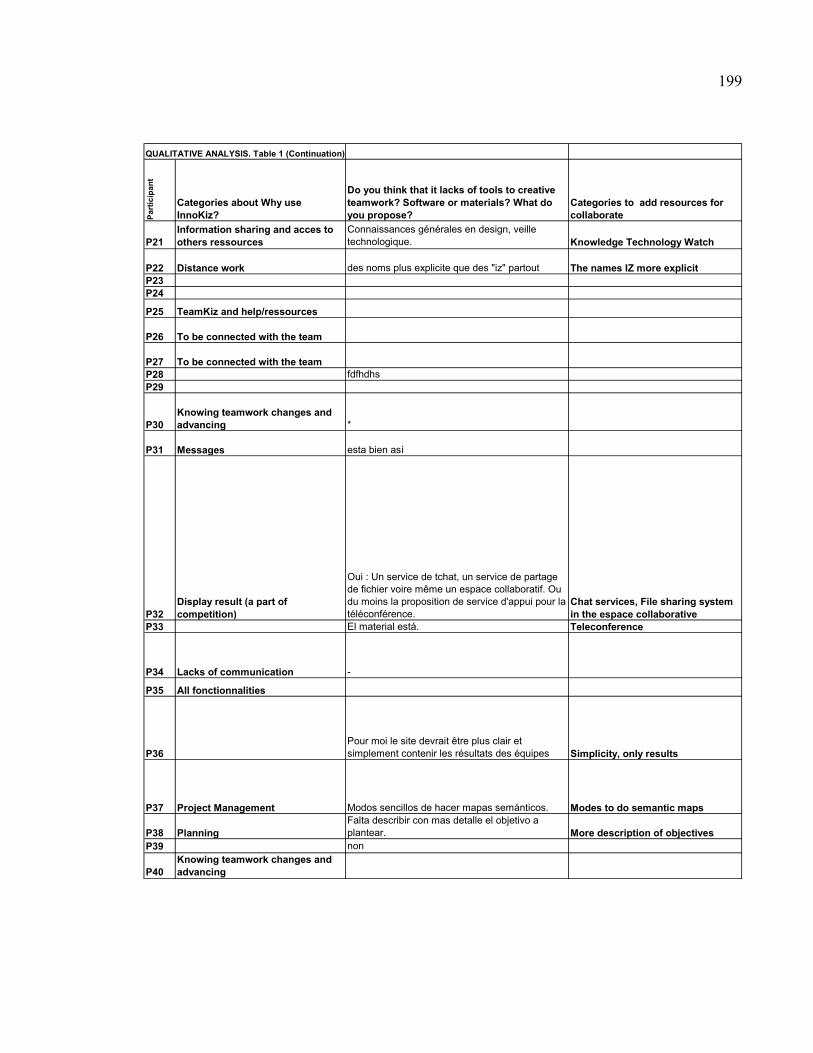
199
QUALITATIVE ANALYSIS. Table 1 (Continuation)P
art
icip
an
t
Categories about Why use InnoKiz?
Do you think that it lacks of tools to creative teamwork? Software or materials? What do you propose?
Categories to add resources for collaborate
P21Information sharing and acces to others ressources
Connaissances générales en design, veille technologique. Knowledge Technology Watch
P22 Distance work des noms plus explicite que des "iz" partout The names IZ more explicitP23P24
P25 TeamKiz and help/ressources
P26 To be connected with the team
P27 To be connected with the teamP28 fdfhdhsP29
P30Knowing teamwork changes and advancing *
P31 Messages esta bien así
P32Display result (a part of competition)
Oui : Un service de tchat, un service de partage de fichier voire même un espace collaboratif. Ou du moins la proposition de service d'appui pour la téléconférence.
Chat services, File sharing system in the espace collaborative
P33 El material está. Teleconference
P34 Lacks of communication -
P35 All fonctionnalities
P36Pour moi le site devrait être plus clair et simplement contenir les résultats des équipes Simplicity, only results
P37 Project Management Modos sencillos de hacer mapas semánticos. Modes to do semantic maps
P38 PlanningFalta describir con mas detalle el objetivo a plantear. More description of objectives
P39 non
P40Knowing teamwork changes and advancing
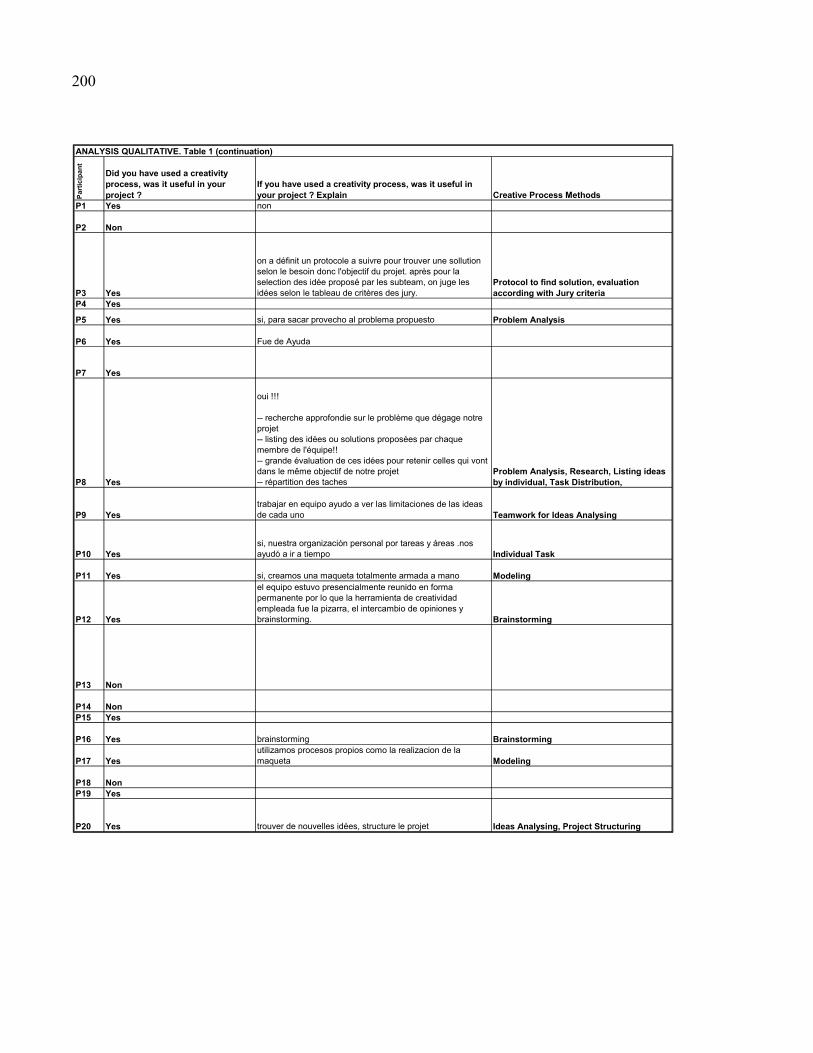
200
ANALYSIS QUALITATIVE. Table 1 (continuation)
Pa
rtic
ipa
nt
Did you have used a creativity process, was it useful in your project ?
If you have used a creativity process, was it useful in your project ? Explain Creative Process Methods
P1 Yes non
P2 Non
P3 Yes
on a définit un protocole a suivre pour trouver une sollution selon le besoin donc l'objectif du projet. après pour la selection des idée proposé par les subteam, on juge les idées selon le tableau de critères des jury.
Protocol to find solution, evaluation according with Jury criteria
P4 Yes
P5 Yes si, para sacar provecho al problema propuesto Problem Analysis
P6 Yes Fue de Ayuda
P7 Yes
P8 Yes
oui !!!
-- recherche approfondie sur le problème que dégage notre projet-- listing des idées ou solutions proposées par chaque membre de l'équipe!!-- grande évaluation de ces idées pour retenir celles qui vont dans le même objectif de notre projet-- répartition des taches
Problem Analysis, Research, Listing ideas by individual, Task Distribution,
P9 Yestrabajar en equipo ayudo a ver las limitaciones de las ideas de cada uno Teamwork for Ideas Analysing
P10 Yessi, nuestra organización personal por tareas y áreas .nos ayudó a ir a tiempo Individual Task
P11 Yes si, creamos una maqueta totalmente armada a mano Modeling
P12 Yes
el equipo estuvo presencialmente reunido en forma permanente por lo que la herramienta de creatividad empleada fue la pizarra, el intercambio de opiniones y brainstorming. Brainstorming
P13 Non
P14 NonP15 Yes
P16 Yes brainstorming Brainstorming
P17 Yesutilizamos procesos propios como la realizacion de la maqueta Modeling
P18 NonP19 Yes
P20 Yes trouver de nouvelles idées, structure le projet Ideas Analysing, Project Structuring

201
ANALYSIS QUALITATIVE. Table 1 (continuation)P
art
icip
an
t
Did you have used a creativity process, was it useful in your project ?
If you have used a creativity process, was it useful in your project ? Explain Creative Process Methods
P21 Yes
P22 NonP23 YesP24 Yes
P25 Yes
P26 Yes
P27 Yes noP28 Yes dfzhdysdP29 Yes
P30 Non
P31 Yes La solución más simple es la correcta Seaching simplicity in the solution
P32 YesLe travail était surtout ponctué par des pic de créativité et de productivité.
Criteria Definition for Creativity and Productivity
P33 Yes
P34 Yes -
P35 Yes
P36 Non
P37 Yes
P38 Yes Si fue de ayuda para el proyecto elejido.P39 Non
P40 Non

202
ANALYSIS QUALITATIVE. Table 1 (continuation)
Pa
rtic
ipan
t
Explain specifying the name of creativity tool used Name of Creative Method
What kind of obstacles did you have to collaborate? Explain Obstacles collaboration
P1 non je saia pas
P2
P3
OrganisationImaginationEcriture de toute idée ou pensé dans l'axe de la solution.
Organisation, Imagination, Writing of all ideas
Les petites querelles pour imposer nos avis.le stresse liée au temps.la fatigue.le silence.En plus de ça je trouve que l'outil informatique doit etre perfectionner.car pour l'instant rien ne remplace le stylo et le cahier ainsi que le tableau.
Personal conflicts to impose ideas. Stress for time. Fatigue. Informatics tools non improved. Workbook and pencil, tablet
P4
P5 si, utilizamos brainstorming Brainstorming no hubo obstáculos
P6 Fueron Utiles
P7
P8
oui !!!-- organisation au niveaux des idées !!!-- travail ordonné!!-- evaluation du projet-- evaluation financière et économique du projet-- avantages du projet-- limites du projet
Ideas Organisation, Orderly Work, Project Evaluation, Financial Project Evaluation, Project Limitations
-- choix des idées !!!-- choix des solutions !!--confection du noyau de notre projet!!
Ideas, Solutions Selection. Searching for the project core
P9nos ayudo a coordinar rapidamente debido a la limitacion de tiempo
Quickly coordination to manage time el sueño Sleepless
P10si por lo expresado, eficiencia de tiempos y no colgar.
Quickly coordination to manage time el sueño. Sleepless
P11muy util, pudimos representar nuestro proyecto Project Representation
P12ninguna informatica debido a las condiciones relatadas.
P13
P14
P15
P16si, todo participabamos activiamente brindadndo ideas al equipo
el sueño las diferencias en los campos de trabajo
Sleepless, Domaine work differences
P17
si fueron utiles ya que nos permitieron crear de manera mas real el prototipo ninuguna
P18 N/N
P19
P20
oui, un peuanalyse de la valeurbrainstorming
le manque de connaissance des competences respectives
lack of knowledge of the respective competences

203
ANALYSIS QUALITATIVE. Table 1 (continuation)
Pa
rtic
ipa
nt
Explain specifying the name of creativity tool used Name of Creative Method
What kind of obstacles did you have to collaborate? Explain Obstacles collaboration
P21
P22 La fatigue Fatigue
P23
P24
P25
P26
P27 corelP28 dsghgjxdP29
P30 *
P31
P32Non, c'est le démon de la deadline qui a fait tout le boulot ^^
P33
P34 -
création de l'équipe 5 minutes avant le début de la compétition ...
alors que les autres équipe connaissaient leurs coéquipiers. Team without preparation
P35
P36Fatigue, équipe trop grande (10 personnes)
Fatigue. Large team about 10 participants
P37
P38 Si fueron muy utiles. si
P39 aucun
P40


APPENDIX IV
UML 2 GLOSSARY
- Activity diagram “shows a sequential flow of actions. The activity diagram is typically used
to describe the activities performed in a general process workflow, though it can also be used
to describe other activity flows, such as a use case or a detailed control flow” (p.28).
- Architecture: as cited by Eriksson et al. (2004): “The architecture works as a map of the
system that defines the different parts of the system, their relationships and interactions, their
communication mechanisms, and the overall rules for how parts may be added or changed”
(Eriksson et al., 2004, p. 361).
- Class diagram shows a static structure, it describes architecture, focusing on the structure of
the system divided into “packages, components, and their dependencies and interfaces”
(Eriksson et al., 2004, p. 254). A class is distinguished because it defines a series of activities
that have to be structured and organized to put in place all system interactions. Also, a class
is an entity that defines the task to be achieved in the system, and sometimes could describe
“members that are attributes, operations, and relationships to other classes” (Eriksson et al.,
2004, p. 463).
- Classes represent the “things” that are handled in the system. “A class diagram shows the
static structure of classes in the system. [And] Classes can be related to each other” (p. 25).
- Composite structure diagrams “show parts and connectors [...]. Parts are shown in a similar
manner as an object, but the name is not underlined. The diagram specifies the structural fea-
tures that will be required to support the enclosing classifier” (Eriksson et al., 2004, p. 258).
Composite structure diagrams explain the logical architecture, which for its part gives a
“clear understanding of the construction of the system to make it easier to administer and
coordinate the work” (Eriksson et al., 2004, p. 254). There are two diagrams that explain the
architecture of a system: the class diagram and the logical architecture structure.
- Interaction diagrams “provide a number of diagrams that show the interaction between
objects during the execution of the software. These diagrams include sequence diagrams,
which emphasize modeling the potential ordering options of an interaction; communication

206
diagrams, which look at the structures of the interacting objects; and interaction overview
diagrams, which place interaction fragments, or fragments of sequence diagrams, in a high-
level workflow” (p. 29);
- Sequence diagrams: “illustrate how objects interact with each other. They focus on message
sequences, that is, how messages are sent and received between a number of objects”
(Eriksson et al., 2004, p. 174).
- A State machine “is typically a complement to the description of a class. It shows all the
possible states that objects of the class can have during a life-cycle instance, and which
events cause the state to change. An event can be triggered by another object that sends a
message to it—for example, that a specified time has elapsed—or that some condition has
been fulfilled. A change of state is called a transition. A transition can also have some sort of
behaviour connected to it that specifies what is done in connection with the state transition”.
(p.26);
- Use case View is a formal model that shows the systems to external actors (Charroux et al,
p.35). “The use case view is used by customers, designers, developers, and testers; it is de-
scribed in use case diagrams, sometimes with support from activity diagrams” (Eriksson et
al., 2004, p. 22), the use case view has to be explained by the follow diagrams:
- Use cases “help to focus mounds of technical information on tangible value” (Eriksson et
al., 2004, p. 57) for the user. Also, use case diagrams “show concisely and efficiently, even
with stick figures and circles, what a system can provide” (idem). The use cases describe
how the system is composed of subsystems.

BIBLIOGRAPHY
Allen, Robert C. 1979. Collective invention. Vancouver: Department of Economics,
University of British Columbia. Amesse, Fernand, et P. Cohendet. 2001. « Technology transfer revisited from the perspective
of the knowledge-based economy ». Research Policy, vol. 30, no 9, p. 1459-1478. Amin, Ash, et Patrick Cohendet. 2004. Architectures of knowledge : firms, capabilities, and
communities. Oxford, UK; New York: Oxford University Press. Antunes, Pedro , Valeria Herskovic, Sergio F. Ochoa et Jose A. Pino. 2008. « Structuring
dimensions for collaborative systems evaluation ». ACM Comput. Surv., vol. 44, no 2, p. 1-28.
Baeza-Yates, Ricardo, et José A. Pino. 2006. « Towards formal evaluation of collaborative
work ». Information Research, vol. 11, no 4. Balmisse, Gilles. 2002. Gestion des connaissances : outils et applications du knowledge
management. Paris: Vuibert. Balmisse, Gilles. 2004a. « Du Web 2.0 à l'entreprise : entretien blueKiwi ». In Knowledge
consult. < http://gillesbalmisse.com/v2/page.php3?page=imprimer&id_article=159 >. Retrieved 9 novembre 2010.
Balmisse, Gilles. 2004b. « Outils de travail collaboratif : Positionnement et critères de choix
». Archimag: les technologies de l ‘information, vol. 175, p. 43-47. Benghozi, Pierre-Jean, Patrice Pollet, Jacques Trahand et Nicole Vardanega-Lachaud. 2002.
Le travail en réseau-Au-delà de l'organisation hiérarchique et des technologies de demain. Paris: Editions L'Harmattan, 95 p.
Bevan, Nigel. 2009. « Extending Quality in Use to Provide a Framework for Usability
Measurement Human Centered Design ». In, sous la dir. de Kurosu, Masaaki. Vol. 5619, p. 13-22. Coll. « Lecture Notes in Computer Science »: Springer Berlin / Heidelberg. < http://dx.doi.org/10.1007/978-3-642-02806-9_2 >.
Bititci, Umit, Patrizia Garengo, Viktor Dörfler et Sai Nudurupati. 2012. « Performance
Measurement: Challenges for Tomorrow* ». International Journal of Management Reviews, vol. 14, no 3, p. 305-327.

208
Bureau Translation Canada. 2011. « Termium plus ». < http://www.termiumplus.gc.ca/ >. Retrieved 10 Jan 2011.
Carroll, J.M. 2010. « The essential tension of creativity and rationale in software design ».
Human Technology: An Interdisciplinary Journal on Humans in ICT Environments, vol. 6, no 1, p. 4-10.
Carroll, John Bisell. 1993. Human cognitive abilities: A survey of factor-analytic studies.
New York: Cambridge University Press, 810 p. Cavallucci, D. 2012. « Cours C-K et TRIZ ». In Notes de cours GOL-512 Ingénierie
simultanée dans le développement de produits, sous la dir. de Gardoni, Mickaël. Montreal: École de technologie supérieure.
Charroux, Benoît, Aomar Osmani et Yann Thierry-Mieg. 2008. UML 2: pratique de la
modélisation (synthèse de cours & exercices corrigés). Coll. « Informatique ». Paris: Pearson Education France.
Chesbrough, Henry. 2006. Open business models: How to thrive in the new innovation
landscape. Boston: Harvard Business Press. CNRTL. 2009. « Portail lexical du Centre National de Resseurces Textuelles et Lexicales.
France ». < http://www.cnrtl.fr >. Retrieved 10th November 2010. Cohendet, Patrick, et Frieder Meyer-Krahmer. 2001. « The theoretical and policy
implications of knowledge codification ». Research Policy, vol. 30, no 9, p. 1563-1591.
Cooper, Randolph B. 2000. « Information Technology development creativity: a case study
of attempeted radical change [1] ». MIS Quarterly, vol. 24, no 2, p. 245. Coutaz, Joëlle, et Sandrine Balbo. 1994. « Evaluation des interfaces utilisateur: Taxonomie et
recommandations ». In IHM'94. (Lille-France) Vol. 94, p. 211-218. Crandall, B., G.A. Klein et R.R. Hoffman. 2006. Working minds: A practitioner's guide to
cognitive task analysis. Boston: The MIT Press. Crescent, René. 2007. L'évaluation technologique : comment mieux investir dans les
nouvelles technologies. Sainte-Foy : Multimondes. Dalkir, Kimiz. 2005. Knowledge management in theory and practice. Amsterdam; Boston:
Elsevier/Butterworth Heinemann. Dalkir, Kimiz. 2012. Knowledge management in theory and practice. Cambridge, Mass.
[u.a.]: MIT Press.

209
Dalsgaard, Peter. 2010. « Research in and through design: an interaction design research approach ». In Proceedings of the 22nd Conference of the Computer-Human Interaction Special Interest Group of Australia on Computer-Human Interaction. (Brisbane, Australia), p. 200-203. 1952265: ACM.
Davis, J.R. 2011. « Crowdsourcing for Challenging Technical Problems-It Works! ». In 62nd
International Astronautical Congress (IAC). (Cape Town; South Africa, 3-7 Oct). NASA.http://ntrs.nasa.gov/archive/nasa/casi.ntrs.nasa.gov/20110003414_2011001692.pdf >.
De Michelis, Giorgio. 1997. « Work processes, organizational structures and cooperation
supports: Managing complexity ». Annual Reviews in Control, vol. 21, p. 149-157. Demoly, F., D. Monticolo, B. Eynard, L. Rivest et S. Gomes. 2010. « Multiple viewpoint
modelling framework enabling integrated product–process design ». International Journal on Interactive Design and Manufacturing, vol. 4, no 4, p. 269-280.
DiPietro, Jon. 2012. Social media for engineers and scientists. New Jersey: Momentum
Press. Eriksson, Hans-Erikson, Magnus Penker, Brian Lyons et David Fado. 2004. UML 2 Toolkit.
Coll. « OMG Press Books ». Indiana: Wiley Publishing, Inc. Esser, Klaus, Wolfgang Hillebrand, Dirk Messner et Jörg Meyer-Stamer. 1996. Systemic
Competitiveness: New Governance Patterns for Industrial Development. London: Frank Cass & Co. LTD., 192 p.
Forgues, D. 2006. « Increasing client capabilities through requirement engineering ». In Joint
International Conference on Computing and Decision Making in Civil and Building Engineering. (Montreal, June 14-16).
Frappaolo, C. 2006. Knowledge management. West Sussex: John Wiley & Sons. Frappaolo, Carl, et Thomas Koulopoulos. 2000. « Why do a knowledge audit? ». The
knowledge management yearbook 2000-2001, p. 418 - 424. Gaither, Carl C., et Alma E. Cavazos-Gaither. 2000. Scientifically speaking a dictionary of
quotations. Philadelphia, PA: Institute of Physics Pub. Gardoni, Mickael. 2005. « Concurrent Engineering in Research Projects to Support
Information Content Management in a Collective Way ». Concurrent Engineering, vol. 13, no 2, p. 135-144.
Genin, Patrick, Samir Lamouri et André Thomas. 2005. « La planification industrielle et ses
limites AG5115. ». In, sous la dir. de normalisation, Association française de. Paris:
210
Techniques de l'ingenieur. Available in: < http://www.techniques-ingenieur.fr/search.html?level=1&type=ENCYCLOPEDIA&query=AG5115&search_form_submit=+ >.
Germani, Michele, Maura Mengoni et Margherita Peruzzini. 2012a. « An approach to
assessing virtual environments for synchronous and remote collaborative design ». Advanced Engineering Informatics, no 0.
Germani, Michele, Maura Mengoni et Margherita Peruzzini. 2012b. « A QFD-based method
to support SMEs in benchmarking co-design tools ». Computers in Industry, vol. 63, no 1, p. 12-29.
Gliner, Jeffrey A., et George A. Morgan. 2000. Research Methods in Applied Settings : An
Integrated Approach to Design and Analysis. Book. Mahwah, N.J.: Lawrence Erlbaum.
Golder, Scott A., et Bernardo A. Huberman. 2006. « Usage patterns of collaborative tagging
systems ». Journal of Information Science, vol. 32, no 2, p. 198-208. Gottschalk, Peter. 2005. Strategic knowledge management technology. Norway: Idea Group
Publishing IGP Global. Hatchuel, Armand, et Benoît Weil. 2002. « La théorie CK: Fondements et usages d’une
théorie unifiée de la conception. ». In Colloque «Sciences de la conception». (Lyon, France, 15-16 mars).
Hayek, Friedrich August. 1975. « The Pretence of Knowledge ». The Swedish Journal of
Economics, vol. 77, no 4, p. 433-442. Helander, M.G., et J. Jiao. 2002. « Research on E-product development (ePD) for mass
customization ». Technovation, vol. 22, no 11, p. 717-724. Hendler, Jim. 2009. « Web 3.0 Emerging ». Computer, vol. 42, no 1, p. 111-113. Herskovic, Valeria, José Pino, Sergio Ochoa et Pedro Antunes. 2007. « Evaluation Methods
for Groupware Systems ». In Groupware: Design, Implementation, and Use, sous la dir. de Haake, Jörg, Sergio Ochoa et Alejandra Cechich. Vol. 4715, p. 328-336. Coll. « Lecture Notes in Computer Science »: Springer Berlin / Heidelberg. < http://dx.doi.org/10.1007/978-3-540-74812-0_26 >.
Hill, William, JD. Hollan, D. Wroblewski et T. McCandless. 1992. « Edit wear and read
wear ». In., p. 3-9. ACM. Hoc, Jean-Michel. 1991. « L'extraction des connaissances et l'aide à l'activité humaine ».
Intellectica, vol. 2, no 12, p. 33-64.
211
Huifeng, Wu, et Jin Lijuan. 2010. « A Cross-Platform Supported Technique for Embedded Software Generation ». In International Conference on Computational Intelligence and Software Engineering (CiSE). (10-12 Dec. 2010), p. 1-4.
Jiménez-Narvaez, Luz-Maria, Kimiz Dalkir et Mickaël Gardoni. 2012. « Managing
Knowledge Needs during New Product Lifecycle Design on Quick-term Project Development QPD: Case Study of 24 Hours of Innovation – ETS Montreal ». In Product Lifecycle Management. Towards Knowledge-Rich Enterprises, sous la dir. de Rivest, Louis, Abdelaziz Bouras et Borhen Louhichi. Vol. 388, p. 25-34. Coll. « IFIP Advances in Information and Communication Technology »: Springer Berlin Heidelberg. < http://dx.doi.org/10.1007/978-3-642-35758-9_3 >.
Jiménez-Narvaez, Luz-Maria, et Mickael Gardoni. 2012. Collaborative knowledge-based
networking for innovation among R&D firms: Analysis of Canadian Case". Work paper: École de technologie supérieure.
Jiménez-Narváez, Luz-María, Arturo Segrera et Mickaël Gardoni. 2013. « Opportunities and
Limitations of the Cloud Computing Environment: In the Early Stage of Design Process ». International Journal of Designed Objects, vol. 6.
Jiménez-Narvaez, Luz Maria. 2010. « Étude expérimentale de la production collective d'idées
en utilisant des technologies de collaboration synchrone à distance ». Master Dissertation. Montreal, École polytechnique.
Jimenez-Narváez, Luz María. 2005. « Modelacion sistémica de la innovacion y el
aprendizaje tecnologico ». Innovar, vol. 15, no 25, p. 81-89. Jiménez-Narváez, Luz María 2000. « Design's Own Knowledge ». Design Issues, vol. 16, no
1, p. 36-51. Jiménez, Luz Maria, et Adrian Vargas. 2004. « Construcción de ambientes creativos virtuales
para la innovación ». In Towards what knowledge society? ( II Congreso Online), sous la dir. de Observatorio para la Cibersociedad. < http://www.cibersociedad.net/congres2004/grups/fitxacom_publica2.php?grup=26&id=295&idioma=es >.
Jiménez, Luz Maria, Adrian Vargas et Johnny Tamayo. 2004. « Diseño y puesta en marcha
de la Red Interactiva Virtual de Innovacion RIVI ». In Towards what knowledge society? ( II Congreso Online), Ed. Observatorio para la Cibersociedad. < http://www.cibersociedad.net/congres2004/ >.
Keevil, Benjamin. 1998. « Measuring the usability index of your Web site ». In Proceedings
of the 16th annual international conference on Computer documentation. (Quebec,Canada), p. 271-277. 296394: ACM.

212
Kock, N., et J. Nosek. 2005. « Expanding the Boundaries of E-Collaboration ». Professional Communication, IEEE Transactions on, vol. 48, no 1, p. 1-9.
Kohn, Nicholas W., Paul B. Paulus et YunHee Choi. 2011. « Building on the ideas of others:
An examination of the idea combination process ». Journal of Experimental Social Psychology, vol. 47, no 3, p. 554-561.
Koskinen, Ilpo, John Zimmerman, Thomas Binder, Johan Redstrom et Stephan Wensveen
(Eds). 2011. Design Research Through Practice: From the Lab, Field, and Showroom. Morgan Kaufmann Publishers Inc., 224 p.
Koulopoulos, TM, et C. Frappaolo. 2000. Smart - Lo fundamental y más efectivo de la
Gerencia del conocimiento. Bogota: Editorial Mc Graw-Hill. Kucharavy, Dmitry, et Roland De Guio. 2011. « Application of S-shaped curves ». Procedia
Engineering, vol. 9, no 0, p. 559-572. Kunz, Werner, et Horst W.J. Rittel. 1970. Issues as elements of information systems. Coll. «
Working Paper 131 ». Berkeley: Center for Urban and Regional Development, University of California Berkeley.
Lang, Sherman Y. T., John Dickinson et Ralph O. Buchal. 2002. « Cognitive factors in
distributed design ». Computers in Industry, vol. 48, no 1, p. 89-98. Láscaris-Comneno, Tatiana 2002. « Estructura organizacional para la Innovación
Tecnológica. El caso de América Latina ». Revista Ciencia, Tecnología, Sociedad mas Innovación no 3.
Lee, Hong Joo, Jong Woo Kim et Joon Koh. 2009. « A contingent approach on knowledge
portal design for R&D teams: Relative importance of knowledge portal functionalities ». Expert Systems with Applications, vol. 36, no 2, Part 2, p. 3662-3670.
Legardeur, J., O. Zéphir, O. Pialot et G. Rivière. 2010. « 24H Équipes - heure par heure ». <
http://www.24h.estia.fr/sauv_24_guillaume/Public/equipes.php?lang=fr >. Retrieved September 20th.
Legardeur, Jérémy, Jean Boujut et Henri Tiger. 2010. « Lessons learned from an empirical
study of the early design phases of an unfulfilled innovation ». Research in Engineering Design, vol. 21, no 4, p. 249-262.
Levan, Serge. 2009. « La loi du 90-9-1 de participation ». In Le travail collaboratif en ligne.
< http://travailcollaboratif.typepad.com/ >.

213
Lonmo, Charlene. 2007. Innovators, non-innovators and venture firms what is the nature of firms in research and development services industries? Ottawa: Statistics Canada. Electronic Information Division.
Lundvall, Bengt-Åke 2005. « Interactive Learning, Social Capital and Economic
Performance ». In Advancing Knowledge and the Knowledge Economy at the National Academies. (Washington D.C, 10-11 January 2005), Ed. OECD, National Science Foundation NSF (Etats-Unis) &. < http://advancingknowledge.com/ >.
MacLean, A., R.M. Young, V.M.E. Bellotti et T.P. Moran. 1991. « Questions, options, and
criteria: Elements of design space analysis ». Human-computer interaction, vol. 6, no 3, p. 201-250.
Marlowe, Thomas J., Norbert Jastroch, Susu Nousala et Vassilka Kirova. 2011. « The
Collaborative Future ». Journal of Systemics, Cybernetics and Informatics, vol. 9, no 5, p. 1-5.
Maxwell, Joseph A. 2004. Qualitative research design: An interactive approach. Coll. «
Applied Social Research Series ». Thousand Oaks: Sage Publications Incorporated. McLoughlin, C., et M.J.W. Lee. 2007. « Social software and participatory learning:
Pedagogical choices with technology affordances in the Web 2.0 era ». In ICT: Providing choices for learners and learning. (Singapur), sous la dir. de Education, Australian Society for Computers in Learning in Tertiary.
Mell, Peter, et Grance Tim. 2011. The NIST definition of cloud computing. Coll. « Computer
Security Division, Information Technology Laboratory ». Gaithersburg, MD: National Institute of Standards and Technology.http://purl.fdlp.gov/GPO/gpo17628 >.
Mengoni, Maura, Michele Germani, Margherita Peruzzini et Marco Mandolini. 2011. «
Supporting virtual teamwork in Collaborative Product Development ». International Journal of Product Development, vol. 15, no 1, p. 90-114.
Merrill, M.D. 1998. « Knowledge objects ». CBT solutions, vol. 2, p. 1-11. Meyer-Stamer, Jörg. 2005. Systemic Competitiveness Revisited: Conclusions for Technical
Assistance in Private Sector Development. Duisburg: Mesopartner. Moser, Paul. 1993. « Tripartite definition of knowledge ». A Companion to Epistemology.
Second edition. < www.blackwellreference.com >. Retrieved 14 octobre 2011 Nemiro, Jill. 1998. « Creativity in virtual teams ». Claremont Graduate University. Nielsen, Jakob. 2006. « Participation inequality: Encouraging more users to contribute ».
Jakob Nielsen’s Alertbox, vol. 9, p. 2006.

214
Nielsen, Jakob, et Thomas K. Landauer. 1993. « A mathematical model of the finding of usability problems ». In Proceedings of the INTERACT '93 and CHI '93 conference on Human factors in computing systems. (Amsterdam, The Netherlands), p. 206-213. 169166: ACM.
Nielsen, Michael A. 2012. Reinventing discovery : the new era of networked science.
Princeton, N.J.: Princeton University Press. Nijstad, B.A., et W. Stroebe. 2006. « How the group affects the mind: A cognitive model of
idea generation in groups ». Personality and Social Psychology Review, vol. 10, no 3, p. 186.
Nof, S. Y. 2007. « Collaborative control theory for e-Work, e-Production, and e-Service ».
Annual Reviews in Control, vol. 31, no 2, p. 281-292. Nonaka, I, et R Toyama. 2003. « The knowledge-creating theory revisited: knowledge
creation as a synthesizing process ». Knowledge Management Research &# 38; Practice, vol. 1, no 1, p. 2-10.
Nonaka, Ikujiro, et Hirotaka Takeuchi. 1995. The knowledge creating company : how
Japanese companies create the dynamics of innovation. New York [u.a.]: Oxford Univ. Press.
Nonaka, Ikujiro, Hirotaka Takeuchi, Marc Ingham et Gérard Koenig. 1997. La connaissance
créatrice : la dynamique de l'entreprise apprenante. Paris; Bruxelles: De Boeck Université.
O'Reilly, T. 2005. « What Is Web 2.0. Design Patterns and Business Models for the Next
Generation of Software. ». < http://www.oreillynet.com/pub/a/oreilly/tim/news/2005/09/30/what-is-web-20.html >. Retrieved november 2009.
Ocker, R., S. R. Hiltz, M. Turoff et J. Fjermestad. 1995. « Computer support for distributed
asynchronous software design teams: experimental results on creativity and quality ». In System Sciences, 1995. Vol. IV. Proceedings of the Twenty-Eighth Hawaii International Conference on. (3-6 Jan 1995) Vol. 4, p. 4-13 vol.4.
Ocker, Rosalie J. 2007. « Creativity in Asynchronous Virtual Teams: Putting the Pieces
Together ». In Higher creativity for virtual teams : developing platforms for co-creation, sous la dir. de MacGregor, Steven P., et Teresa Torres-Coronas. New York: Information Science Reference.
Ocker, Rosalie J., et Jerry Fjermestad. 2008. « Communication differences in virtual design
teams: findings from a multi-method analysis of high and low performing experimental teams ». SIGMIS Database, vol. 39, no 1, p. 51-67.

215
Oxford Dictionary of Philosophy. 2008. Oxford: Oxford University Press. < http://www.oxfordreference.com >.
Paquette, Gilbert. 2002. « Modélisation des connaissances et des compétences un langage
graphique pour concevoir et apprendre ». < http://site.ebrary.com/id/10225809 >. Paulus, P.B., et H.C. Yang. 2000. « Idea generation in groups: A basis for creativity in
organizations ». Organizational Behavior and Human Decision Processes, vol. 82, no 1, p. 76-87.
Paulus, Paul B., Karen Leggett Dugosh, Mary T. Dzindolet, Hamit Coskun et Vicky L.
Putman. 2005. « Social and Cognitive Influences in Group Brainstorming: Predicting Production Gains and Losses ». In European Review of Social Psychology. p. 299-325. John Wiley & Sons, Ltd. < http://dx.doi.org/10.1002/0470013478.ch10 >.
Paulus, Paul B., Mary Dzindolet et Nicholas W. Kohn. 2012. « Chapter 14 - Collaborative
Creativity—Group Creativity and Team Innovation ». In Handbook of Organizational Creativity, sous la dir. de Michael, D. Mumford. p. 327-357. San Diego: Academic Press. < http://www.sciencedirect.com/science/article/pii/B9780123747143000148 >.
Prahalad, C. K., et M. S. Krishnan. 2008. The new age of innovation driving cocreated value
through global networks. New York: McGraw-Hill. Prahalad, C. K., et Venkat Ramaswamy. 2004. The future of competition : co-creating unique
value with customers. Boston, MA: Harvard Business School Publishing. Quintana, V., L. Rivest, R. Pellerin, F. Venne et F. Kheddouci. 2010. « Will Model-based
Definition replace engineering drawings throughout the product lifecycle? A global perspective from aerospace industry ». Computers in Industry, vol. 61, no 5, p. 497-508.
Rama, Jiten, et Judith Bishop. 2006. « A Survey and Comparison of CSCW Groupware
Applications ». In Proceedings of SAICSIT 2006. p. 198 -205. Rao, Modanmohan (Ed). 2005. Knowledge management tools and techniques: practitioners
and experts evaluate KM solutions. Burlington: Butterworth-Heinemann, 438 p. Rittel, Horst. 1971. « Some Principles for the Design of an Educational System for Design ».
Journal of Architectural Education, vol. 25, no 2, p. pp. 16-27. Rittel, Horst W.J., et Melvin M Webber. 1973. « Dilemmas in a general theory of planning ».
Policy sciences, vol. 4, no 2, p. 155-169. Roger, Lee (10). 2013. Software Engineering: A Hands-On Approach (2013/01/01). Atlantis
Press, 191-216 p.
216
Rollett, H. 2003. Knowledge management: processes and technologies. Norwell, MA: Kluwer Academic Publishers.
Rosenberg, Doug, et Kendall Scott. 1999. Use case driven object modeling with UML : a
practical approach. Reading, MA: Addison-Wesley. Sage, Andrew P. 2003. « Knowledge Management ». AccessScience from Mc-Graw-Hill. <
http://www.accessscience.com >. Retrieved April 28, 2011. Schuster, Ilona, Birgit Dick, Petra Badke-Schaub et Udo Lindemann. 2007. « Evaluation of a
methodological training in design education ». In International Conference on Engineering Design, ICED'07. (Paris, France, 28 - 31 August), Ed. Society, Design.
Seffah, Ahmed, Mohammad Donyaee, Rex Kline et Harkirat Padda. 2006. « Usability
measurement and metrics: A consolidated model ». Software Quality Journal, vol. 14, no 2, p. 159-178.
Semyon, D. Savransky, et Semyon D. Savransky. 2000. Engineering of creativity :
introduction to TRIZ methodology of inventive problem solving. Boca Raton, Flor.: Boca Raton, Flor. : CRC Press.
Simon, Herbert A. 1973. « The structure of ill structured problems ». Artificial intelligence,
vol. 4, no 3-4, p. 181-201. Simon, Herbert A. 1979. « Information Processing Models of Cognition ». Annual Reviews
Psychology, vol. 30, p. 363-396. Statistics Canada. 2005. « Survey of Innovation, selected service industries, innovative
business units using sources of information needed for contributing to the development of innovation ».
Statistics Canada. 2008. « Table 358-0007. Survey of electronic commerce and technology
utilisation ». Ottawa. Statistics Canada. 2010. « Table 360-0002 and Table 360-0005. Specialised design and
engineering service companies in Canada, 1998-2008 period, by North American Industry Classification System (NAICS) ». Otawa.
Stempfle, Joachim, et Petra Badke-Schaub. 2002. « Thinking in design teams - an analysis of
team communication ». Design Studies, vol. 23, no 5, p. 473-496. Sternberg, R.J., J.C. Kaufman et J.E. Pretz. 2002. The creativity conundrum: A propulsion
model of kinds of creative contributions. Psychology Pr.

217
Terveen, Loren, et William Hill. 1998. « Evaluating emergent collaboration on the Web ». In CSCW '98 Proceedings of Conference on Computer Supported Cooperative Work. (New York), p. 355-362. Association for Computer Machinery.
Tödtling, Franz, Patrick Lehner et Alexander Kaufmann. 2009. « Do different types of
innovation rely on specific kinds of knowledge interactions? ». Technovation, vol. 29, no 1, p. 59-71.
Trépanier, M. , et P-M. Gosselin. 2007. Faire du design industriel au Québec, Étude sur les
pratiques professionnelles des designers industriels québécois. Quebec: Institut national de recherche scientifique, INRS. < http://www.adiq.ca/DocumentsUser/FairedudesignindustrielauQuebec_rapportfinal.pdf >. Retrieved November 2008.
Ulrich, Karl T., et Steven D. Eppinger. 2008. Product design and development. New York,
N.Y: McGraw-Hill Higher Education. Vander Wal, Thomas. 2007. « Folksonomy Coinage and Definition ». In vanderwal.net. <
http://vanderwal.net/folksonomy.html >. Retrieved 19th, March. VanGundy, Arthur B. 1984. Managing group creativity : a modular approach to problem
solving. New York: American Management Associations. Visser, Willemien. 2006. The cognitive artifacts of designing. Paris: Laboratoire Traitement
et Communication de l'Information. Wallace, Danny P. 2007. Knowledge management: Historical and cross-disciplinary themes.
Westport: Libraries Unlimited Incorporated. Wallin, Johanna, Andreas Larsson, Ola Isaksson et Tobias Larsson. 2011. « Measuring
Innovation Capability – Assessing Collaborative Performance in Product-Service System Innovation Functional Thinking for Value Creation ». In, sous la dir. de Hesselbach, Jürgen, et Christoph Herrmann. p. 207-212. Springer Berlin Heidelberg. < http://dx.doi.org/10.1007/978-3-642-19689-8_37 >.
Walther, J. B. 2001. « The impacts of emoticons on message interpretation in computer-
mediated communication ». Social science computer review, vol. 19, no 3, p. 324. Wang, Jing, Umer Farooq et John M. Carroll. 2010. « Does Design Rationale Enhance
Creativity? ». Human Technology, vol. 6, no 1, p. 129-149. Wenke, Dorit , et Peter A. Frensch. 2003. « Is Success or Failure at Solving Complex
Problems Related to Intellectual Ability? ». In The Psychology of Problem Solving, sous la dir. de Davidson, Janet E., et Robert J. Sternberg. p. 87-126. Cambridge UK: Cambridge University Press.

218
Wiig, Karl M. 1993. Knowledge management foundations : thinking about thinking, how people and organizations create, represent, and use knowledge. Arlington, Tex.: Schema Press.
Wiig, Karl M. 2004. People-focused knowledge management: How effective decision making
leads to corporate success. Burlington, MA: Butterworth-Heinemann. Wikipedia. 2012. « Web Content Management System ». <
http://en.wikipedia.org/wiki/Web_content_management_system >. Retrieved November, 2012.
Work Foundation. 2007. Staying ahead : the economic performance of the UK's creative
industries. London: Department for Culture, Media and Sport of Great Britain. Wu, Jen-Her. 2009. « A design methodology for form-based knowledge reuse and
representation ». Information & Management, vol. 46, no 7, p. 365-375. Xu, Jing, Rémy Houssin, Emannuel Caillaud et Mickaël Gardoni. 2011. « Fostering
continuous innovation in design with an integrated knowledge management approach ». Computers in Industry, vol. 62, no 4, p. 423-436.
Zika-Viktorsson, Annika, et Anders Ingelgård. 2006. « Reflecting activities in product
developing teams: conditions for improved project management processes ». Research in Engineering Design, vol. 17, no 2, p. 103-111.
Zimmerman, John, Jodi Forlizzi et Shelley Evenson. 2007. « Research through design as a
method for interaction design research in HCI ». In Proceedings of the SIGCHI conference on Human factors in computing systems. p. 493-502. ACM.
Zlotin, Boris, Alla Zusman et Frank Hallfell. 2011. « TRIZ to invent your future utilizing
directed evolution methodology ». Procedia Engineering, vol. 9, no 0, p. 126-134.