ecometabolomics: optimized nmrbased method - creaf
TRANSCRIPT

Ecometabolomics: optimizedNMR-basedmethod
Albert Rivas-Ubach1,2*†, MiriamP�erez-Trujillo3,†, Jordi Sardans1,2, Albert Gargallo-Garriga1,2,3,
Teodor Parella3 and JosepPe~nuelas1,2
1CREAF, Cerdanyola del Vall�es, Catalonia, 08193, Spain; 2CSIC,Global EcologyUnit CREAF-CEAB-CSIC, Cerdanyola del
Vall�es, Barcelona, 08193Catalonia, Spain; and 3Servei deResson�anciaMagn�etica Nuclear, Universitat Aut�onoma de
Barcelona, Cerdanyola del Vall�es, Barcelona, 08193Catalonia, Spain
Summary
1. Metabolomics is allowing great advances in biological sciences. Recently, an increasing number of ecological
studies are using a metabolomic approach to answer ecological questions (ecometabolomics). Ecometabolomics
is becoming a powerful tool which allows following the responses of the metabolome of an organism environ-
mental changes and the comparison of populations. Some NuclearMagnetic Resonance (NMR) protocols have
been published for metabolomics analyses oriented to other disciplines such as biomedicine, but there is a lack of
a description of a detailed protocol applied to ecological studies.
2. Here we propose a NMR-based protocol for ecometabolomic studies that provides an unbiased overview of
the metabolome of an organism, including polar and nonpolar metabolites. This protocol is aimed to facilitate
the analysis of many samples, as typically required in ecological studies. In addition to NMR fingerprinting, it
identifies metabolites for generating metabolic profiles applying strategies of elucidation of small molecules typi-
cally used in natural-product research, and allowing the identification of secondary and unknown metabolites.
We also provide a detailed description to obtain the numerical data from the 1H-NMR spectra needed to per-
form the statistical analyses.
3. We tested and optimized this protocol by using two field plant species (Erica multiflora andQuercus ilex) sam-
pled once per season. Both species showed high levels of polar compounds such as sugars and amino acids during
the spring, the growing season. E. multiflorawas also experimentally submitted to drought and the NMR analy-
ses were sensitive enough to detect some compounds related to the avoidance of water loses.
4. This protocol has been designed for ecometabolomic studies. It identifies changes in the compositions of
metabolites between individuals and detects and identifies biological markers associated with environmental
changes.
Key-words: ecology, ecometabolomics, metabolomics, NMR, plant physiology, protocol
Introduction
ECOMETABOLOMICS
Metabolomics as a new research approach has been widely
used in biomedicine (Nicholson, Lindon & Holmes 1999;
Urban et al. 2010), ecotoxicology (Robertson 2005; Alam
et al. 2010), animals (Deyrup et al. 2011) and plant biology
(Fiehn et al. 2000; Weckwerth et al. 2004; Scott et al. 2010),
and its application is increasing in ecological studies (Pe~nuelas
& Sardans 2009a, b; Sardans, Pe~nuelas & Rivas-Ubach 2011).
The metabolome is the entirety of molecules present in an
organism as the final expression of its genotype at a particular
moment (Fiehn 2002; Pe~nuelas & Sardans 2009a) and can be
considered a molecular picture of biological diversity because
each living species has its own metabolic profile (Gromova &
Roby 2010). In ecological studies, metabolomics (ecometabo-
lomics) has become a promising tool for following the
responses of the metabolome of organisms to biotic and
abiotic environmental changes (Sardans, Pe~nuelas & Rivas-
Ubach 2011). The metabolome is the chemical phenotype of
organisms and is the first to respond to internal and external
stressors to maintain physiological homeostasis (Fiehn et al.
2000; Sterner & Elser 2002; Pe~nuelas & Sardans 2009a; Leiss
et al. 2011; Sardans, Pe~nuelas &Rivas-Ubach 2011).
AN OPTIMIZED NMR-BASED PROTOCOL FOR
ECOMETABOLOMICS. SCOPE OF APPLICATION
Several protocols to explore the metabolome in humans and
animals (Beckonert et al. 2007; Martineau et al. 2012) and in
microorganisms (Smart et al. 2010; Roberts et al. 2012) have
recently been published. Vascular plants have received less
attention, but some methods for conducting metabolomic
analyses of laboratory subjects based on Nuclear Magnetic
Resonance (NMR) spectroscopy have been described (Kruger,
Troncoso-Ponce & Ratcliffe 2008; Leiss et al. 2009; Gromova
&Roby 2010; Kim, Choi &Verpoorte 2010; Kim&Verpoorte
2010). The field of ecology currently lacks a standard protocol*Correspondence author. E-mail: [email protected]
†Authors contributed equally to thismanuscript.
© 2013 The Authors. Methods in Ecology and Evolution © 2013 British Ecological Society
Methods in Ecology and Evolution 2013, 4, 464–473 doi: 10.1111/2041-210X.12028

for analysing the metabolomes of wild plants, which are sam-
pled from the field under very heterogeneous environmental
conditions. The objective of ecology is to explain general pat-
terns of structure, function, and evolution in ecosystems. This
task is complicated by the large number of factors interacting
concurrently and by the resulting high variability at all levels.
Wild individuals within the same species present large differ-
ences in elemental composition, metabolism, phenology, and
life style, much more so than do entries in a laboratory model.
This implies that the number of individuals to be analysed
should be sufficiently large for a consistent statistical analysis.
A protocol is thus needed to provide an overall analysis of the
main metabolites in field samples, including secondary and
nonpolar compounds, and which allows the detection and
identification of those metabolites that play a key role in an
organism’s response to environmental change. This protocol
must also be reproducible and amenable to robust statistical
analyses.
Among the different analytical techniques, NMR spectros-
copy has the advantage of providing an unbiased overview of
all the small molecules in a solution. Its analyses require mini-
mal sample preparation, are relatively quick, non-destructive
and highly reproducible and robust. 1H NMR signals are
directly and linearly correlated to metabolite abundance and it
is the key technique for the elucidation of unknown metabo-
lites, allowing the identification of most of the molecules
detected and the differentiation between structural isomers,
diastereoisomers (P�erez-Trujillo et al. 2010; Ellis et al. 2012),
and even enantiomericmolecules (P�erez-Trujillo et al. 2012).
Here, we describe an optimized NMR-based protocol for
ecometabolomic studies of wild plants, especially for those
plants with robust structures such as sclerophyllous leaves.
The samples are not part of laboratory models as described in
other protocols (Leiss et al. 2009; Gromova & Roby 2010;
Kim, Choi & Verpoorte 2010) but are typically taken from the
field, where variability among individuals is high and a large
number of samples are usually analysed, and where, therefore,
high reproducibility and robustness of method are critical. For
this, special stress is also put in the automation of the NMR
fingerprinting and in the use of NMR spectrometers of a high
magnetic field (600 MHz or higher), which provide high reso-
lutionNMRfingerprint spectra of the cohort of samples (Leiss
et al. 2009; Kim, Choi &Verpoorte 2010). Besides, themethod
considers polar and nonpolar metabolites and it optimizes the
sample preparationmethodology for their extraction (carefully
described in detail in the Materials and methods section).
Even so, this method may also be applied to greenhouse and
laboratory studies.
The following protocol covers from sample collection and
storage to the NMR spectra processing and statistical analysis
(Fig. 1), going through the metabolite extraction, the acquisi-
tion of NMR fingerprint data, and the identification of the
detected metabolites to obtain the metabolic profile following
the structural characterization of natural products (Robinette
et al. 2012) that also includes the identification of the second-
ary and unknownmetabolites, whichmay play a key role in an
organism’s response to an environmental change.
Even though this protocol has been optimized for the analy-
sis of plant structures, these procedures can also be applied to
the study of animals such as zooplankton, insects, annelids,
andmolluscs, among others, because the procedures have been
tested for detecting the most abundant metabolites in the
current extraction, making comparative analyses possible and
rigorous.
Materials andmethods
This protocol was optimized to obtain robust results in eco-
metabolomics studies. For this reason, we tested the grinding
time of samples, the amount of sample, the sonication time,
repeated extractions and the recovery (See supporting informa-
tion for details and the step by step procedure is also described).
The complete procedure as explained below (Fig. 2) is
divided into sixmain categories.
SAMPLE COLLECTION AND STORAGE (STEPS 1 –3 OF
FIG. 2)
Field fresh plant material was collected and rapidly packed,
labelled, and frozen in situ in a container of liquid nitrogen. It
prevented the degradation of metabolites (Kim & Verpoorte
2010). The physiological processes of plants vary throughout
the day, so individual subjects were sampledwithin a short per-
iod of time and under a constant environment to reduce any
effects of diurnal rhythms. The frozen plant material was
lyophilized and kept frozen in plastic cans. Lyophilization
(freeze-drying) avoids the hydrolysis of metabolites by main-
taining enzymes in an inactive state and is thus a crucial step in
ecometabolomics by keeping the metabolomes intact. Samples
were ground in a ball mill (Mikrodismembrator-U, B. Braun
Biotech International) at 1600 rpm for 9 min for leaves of
Fig. 1. General NMR-based procedures for an ecometabolomic
study.
© 2013 The Authors. Methods in Ecology and Evolution © 2013 British Ecological Society, Methods in Ecology and Evolution, 4, 464–473
Optimized NMR-based procedures: a tool for ecology field metabolomic studies 465

Erica multiflora and for 6 min for leaves ofQuercus ilex. Keep-
ing the samples lyophilized and frozen and using ball mills that
allow the rapid grinding of several samples independently of
their nature are highly recommended procedures for ecometa-
bolomic studies with a large number of samples, often more
than 100.
METABOLITE EXTRACTION AND NMR SAMPLE
PREPARATION (STEPS 4 –20 .A/16 .B OF FIG. 2 )
For each sample, a quantity of 100 mg of dried powder was
added to a 50 mL centrifuge tube. 6 mL of a water-methanol
(1/1) mixture and 6 mLof chloroformwere added and all sam-
ples were vortexed (15 s) and sonicated (2 min). Samples were
centrifuged at 1100 9 g (15 min). The two liquid phases were
collected separately.
For the aqueous extraction; for each sample, 4 mL of the
aqueous extract was collected by micropipette in another cen-
trifuge tube series. Then, the steps 5–10 of Fig. 2 were repeated
in the same tubes. After the two extractions, 25 mL of water
was added to each tube to reduce the methanol concentration
and allowing lyophilization and were kept at�80°C. Once fro-
zen, samples were lyophilized with caps loosened. A quantity
of 4 mL of water was added to each sample and were vortexed
(15 s) to resuspend all the content. Samples were centrifuged at
23 000 9 g (3 min) to concentrate the content at the bottom
and frozen again at �80°C. Again, the samples were lyophi-
lized with caps loosened. Once totally dried, 1 mL of phos-
phate buffer in D2O + 0�01% TSP (trymethyl silane propionic
acid sodium salt) was added to each sample and vortexed for
5 s. All the content was resuspended with a micropipette and
transferred to Eppendorf tubes. Eppendorf tubes were centri-
fuged at 23 000 9 g (3 min) and 0�6 mL of the supernatant
was transferred toNMR tubes.
Finally, the recovery of two polar metabolites (glucose and
alanine) was tested for validation.
For the organic extraction; for each sample, 4 mL of the
organic extraction was collected by crystal syringes in crystal
jars avoiding any collection of pellet. Then, the steps 5–10 of
Fig. 2 were repeated in the same tubes. The organic fractions
were placed into 25 mL round-bottomed evaporation flasks
and were dried in a rotary vacuum evaporator. To each flask,
1 mL of chloroform D + 0�03% TMS (tetramethylsilyl) was
added and closed. After 10 min of waiting, the content was
resuspended and transferred into Eppendorf tubes, centrifuged
at 23 000 9 g (3 min) and 0�6 mL of the supernatant was
transferred to NMR tubes. The use of Eppendorf tubes for
organic solvents is recommended to avoid any interaction of
chloroformwith plastic polymers.
ACQUIS IT ION OF NMR FINGERPRINT DATA
The NMR fingerprint of a sample consists of a quantitative
NMR spectrum of it. The spectra are obtained under specific
identical, defined conditions. This ecometabolomic protocol is
based on 1HNMR, but the procedures described may be help-
ful when using other nuclei (Palomino-Sch€atzlein et al. 2011).
All analyses are completely automatized to guarantee a high
reproducibility and robustness. For this, an autosampler
allowing a load of 60 samples is used (BACS; Bruker Biospin,
Rheinstetten, Germany). A NMR spectrometer of high mag-
netic field generating high resolution spectra (600 MHz or
higher) must be used, due to the typical high variability among
samples and complexity of the spectra in ecometabolomic
studies. A 600 MHzNMR spectrometer is used to assure high
resolution spectra (Avance 600 equipped with a triple inverse
5-mm tube Z-gradient TBI (Triple resonance Broadband
Inverse) probe and with a temperature control unit, Bruker
Fig. 2. Experimental procedure to obtain polar and nonpolar extracts forNMRanalyses.
© 2013 The Authors. Methods in Ecology and Evolution © 2013 British Ecological Society, Methods in Ecology and Evolution, 4, 464–473
466 A. Rivas-Ubach et al.

Biospin). The temperature of the equipment must be previ-
ously calibrated and maintained constant for all the experi-
ments (at 298 K). With this purpose an equilibration delay
must be left once the tube is in the magnet and prior to the
acquisition (2 min).
The automationmust be configured (ICONNMR software appli-
cation, Bruker Biospin) to allow the automatic control of pro-
cesses such as insertion/ejection of the sample into the magnet,
waiting delay, automatic locking onto the signal of the deuter-
ated solvent, tuning and/or adjusting the tune frequency to the
Larmor frequency of the nuclei measured, homogenization of
the magnetic field, adjustment of the receiver gain of the sample,
and the execution of the experiment, which includes the acquisi-
tion of the FID (Free Induction Decay), its Fourier transforma-
tion, and the preprocessing of the spectrum. The automation of
the aforementioned processes improves the reproducibility of
the analysis, reducing errors from human source.
Samples of the polar and nonpolar fractions are analysed
and compared separately. However, within each set of sam-
ples, it is recommended to randomize them (e.g. randomize
treatments, populations etc.). Polar samples are analysed using
a standard quantitative 90 pulse-acquisition 1H NMR experi-
ment with solvent suppression (Zheng & Price 2010). The
standard water presaturation experiment, a conventional com-
posite 90° 1H pulse sequence with suppression of the residual
water signal (Bax 1985), or a 90° 1H NOE enhanced pulse
sequence commonly termed 1D NOESY-presat (Nicholson
et al. 1995) is adequate (Table 1).Nonpolar samples are analy-
sed with a standard 90° pulse-acquisition 1H NMR experi-
ment. Acquisition parameters and processing parameters must
be set up adequately (carefully detailed in the Supporting
Information). All spectra must then be visually inspected, and
those that are poorly phased or baseline correctedmust be cor-
rected manually. Finally, the spectra must be calibrated using
the signal of the internal calibrating reference added to the
sample.
NMR-BASED METABOLITE IDENTIF ICATION. NMR
METABOLIC PROFILE
TheNMRmetabolic profile of a sample is obtained when each
peak of the NMR spectrum is assigned to its corresponding
metabolite. The profile gives the NMR signals a biomolecular
meaning. This analysis is usually performed on a single repre-
sentative sample. The differences observed among samples are
mainly due to differences in metabolite concentrations; how-
ever, qualitative differences may occur. When the assignment
of a specific peak is not possible (for example, when peaks
overlap or when signals are of low intensity) the analysis of
another sample can be helpful. A visual inspection of all spec-
tra of the fingerprinting can help to find a better sample for the
elucidation of a specific signal.
The assignment of the 1HNMR signals is conducted follow-
ing two approaches. First, by comparison of the resonance fre-
Table 1. Most commonNMR experiments for identification of metabolites. Standard versions and a brief description of their application for struc-
tural elucidation problems are indicated
Experiment Version (pulse sequencea) Descriptionb
1D 1H ●Conventional pulse-acquisition (zg)●With solvent presaturationc (zgpr or zgcppr),
also 1DNOESYwith presaturation (noesypr1d)
Standard experiment routinely used for fingerprinting, identification of
metabolites, and determining chemical shifts (d) and coupling-constant (J)
values. Also used for quantification.
2D 1H-1H
COSY
●Gradient selection (cosygpqf) (Aue, Bartholdi &
Ernst 1976;Nagayama et al. 1980)
●With solvent presaturation (cosypgqfpr)
Homonuclear Correlation Spectroscopy based on 1H-1H scalar coupling.
Routinely used for the identification ofmetabolites, it correlates spin
systems separated through chemical bonds.
2D 1H-1H
TOCSY
●Conventional (mlevph)(Braunschweiler &
Ernst 1983; Bax 1985)
●With solvent presaturation (mlevphpr)
●Selective 1Dmode (selmlgp.2)(Bax 1985;
Kessler et al. 1986; Stonehouse et al. 1994;
Stott et al. 1995)
Total Correlation Spectroscopy. Based on homonuclear 1H-1H scalar
coupling. It correlates spin subsystemswithin the samemolecule.
2D 1H-1H
NOESY
●Conventional (noesygpph) (Jeener et al. 1979;Wagner &Berger 1996)
●With solvent presaturation (noesygpphpr)
●Selective 1Dmode (selnogp) (Kessler et al. 1986;
Stonehouse et al. 1994; Stott et al. 1995)
NuclearOverhauser Effect Spectroscopy. Based on homonuclear 1H-1H
through-space interactions. Routinely used for the identification of
metabolites, it provides information about which protons are close
together in space (� 4�A).
2D 1H-13C
HSQC
●Conventional using adiabatic 13C pulses
(hsqcetgpsisp) (Palmer et al. 1991; Kay,Keifer &
Saarinen 1992; Schleucher et al. 1994)
Heteronuclear Single QuantumCorrelation. Based on heteronuclear
one-bond 1H-13C scalar coupling. Routinely used for the identification of
metabolites, it correlates protons to their directly bonded carbon atom.
2D 1H-13C
HMBC
●Conventional using low-pass J-filter (hmbcgplpndqf)
(Bax&Summers 1986; Bax&Marion 1988)
HeteronuclearMultiple BondCorrelation. Based on heteronuclear
long-range 1H-13C scalar coupling. Routinely used for the identification
ofmetabolites, it correlates protons to carbon atoms separated bymultiple
(usually 2, 3) bonds.
aAccording to Bruker nomenclature.bExtensive and updated description of the vast library of NMR experiments and their different versions is collected in the NMR Guide and
Encyclopedia of Bruker.cExperiments for suppression of the signal of the residual water.
© 2013 The Authors. Methods in Ecology and Evolution © 2013 British Ecological Society, Methods in Ecology and Evolution, 4, 464–473
Optimized NMR-based procedures: a tool for ecology field metabolomic studies 467

quencies (chemical shifts, d) and line shapes (multiplicity and
coupling constants, J) of the spectrum to bibliographical data
and NMR spectral databases (Table S1). Second, by the struc-
tural elucidation of the mixture (sample) through the perfor-
mance of a suite of 2D NMR experiments (Table 1) and the
concerted analyses of the data obtained. Basic NMR strategies
followed for the structural characterization of natural products
are applied for the elucidation of complex mixtures of small
biological molecules (metabolites), instead of to isolated mole-
cules as in the case of natural products research (Robinette
et al. 2012). Briefly, protons connected by three to five chemi-
cal bonds are identified using 2D 1H-NMR homonuclear
COSY and TOCSY correlations. 1H-1H NOESY experiments
determine connections between different parts of a same mole-
cule, and heteronuclear 1H-13C HSQC and HMBC methods
identify the carbon skeleton of a molecule. This approach, the
structural elucidation of the mixture by NMR spectroscopy, is
particularly helpful for the identification of secondary metabo-
lites, since only less published NMRdata of these are available
(Table 1). These experiments are time consuming, but they
only need to be performed once and just for one sample. 1D-
selective 1H experiments can be complementary to the 2D
experiments, depending on the problem requiring elucidation.
They are less time consuming than the 2D correlations, but
retain maximum resolution and are used to get specific infor-
mation of a chosen NMR signal of the 1D 1H spectrum. The
spectrum is much simpler to analyse and only shows the corre-
lation information for the selected peak. 1D-selective 1H exper-
iments are valuable tools for elucidating and confirming
problematic molecules (Ellis et al. 2012). NMR experiments
are performed at the same experimental temperature used for
the NMRfingerprint spectra (298 K) and using the same spec-
trometer (detailed in the Supporting Information). However,
to use the same NMR spectrometer is not necessary, since
NMR data are fully comparable independently of the spec-
trometer used. The use of cryoprobes will also increase the sen-
sitivity and considerably reduce the experimental time needed.
Each specific ecometabolomic study and assignment prob-
lem will require the performance of some or all of the experi-
ments indicated in Table 1. The version of the experiment with
water-signal presaturation is recommended for polar samples.
In this protocol, we describe the most common and useful
NMR experiments that provide structural information, but
many other NMR experiments are available in the spectromet-
ric libraries that can be useful for the elucidation of specific
problems.
SPECTRA PROCESSING
The NMR data from fingerprint spectra were adequately pro-
cessed before conducting the statistical analyses. The bucketing
process consists in obtaining the integral numeric value of the
selected regions of the spectra (buckets) directly correlatedwith
the molar concentration by their relationship to the initial con-
centration of the internal standard (TMS or TSP). In our pro-
tocol for ecometabolomics, we used a variable-size bucketing
that is highly recommended over regular-size bucketing (Leiss
et al. 2009; Gromova & Roby 2010; Kim, Choi & Verpoorte
2010) for reducing the number of variables for statistical analy-
ses. First, a pattern for each kind of spectrum (polar and non-
polar) was created. The pattern is determined from identifying
exactly where an NMR signal (peak) begins and ends for all
peaks in the spectrum, and then the bucketing process can be
(a)
(b)
(c)
Fig. 3. PCA plots conducted from 1H NMR fingerprinting data from
Quercus ilex leaves. (a) panel of loadings of PC1 and (b) panel of load-
ings of PC2. Loadings of the different spectral regions are represented
by different colours as indicated. (c) Panel of individuals categorized by
season. Arrows outside the plot indicate the mean PC score for each
season. The statistically significant differences between seasons are indi-
cated by lowercase letters (P < 0�05).
© 2013 The Authors. Methods in Ecology and Evolution © 2013 British Ecological Society, Methods in Ecology and Evolution, 4, 464–473
468 A. Rivas-Ubach et al.

executed based on this pattern. All empty areas (without
peaks) of spectra can also be introduced into the pattern to
detect any qualitative differences between samples. We used
the variable-size bucketing option of AMIX (Bruker Biospin),
scaling the buckets relative to the internal standard (TMS or
TSP), although other programmes can be used. The output
was a data set containing the integral values for each 1H-NMR
spectral peak accounted for in the described pattern.
The bucketed data sets from the NMR fingerprint spectra
can be analysed directly (without a previous assignment of the
metabolites), because rapidly classifying samples according to
their origin or their ecological or ecophysiological relevance is
sufficient (Sardans, Pe~nuelas & Rivas-Ubach 2011) (Figs 3
and S1). This last approach does not attempt to identify all
metabolites, but provides the metabolomic signature of the
organism and allows detection of any shift or anomaly in its
metabolism (Figs 3 and S1).
Statistical analyses of metabolomic profiles can be per-
formed by two main ways when the 1H-NMR spectra have
been treated by variable-size bucketing. (i) All 1H-NMR spec-
tral buckets can be used as individual variables. Here the result
is a data set where the number of variables is equivalent to the
number of buckets in the bucketing process. (ii) The buckets
corresponding to the same molecular compound can be added
up. The final number of variables in the data set is reduced and
the statistical results are easier to interpret. For our analyses
we used this method adding up the buckets corresponding to
same compound.
STATIST ICAL DATA ANALYSIS
Principal component analysis (PCA) and PLS-DA (Partial
Least Squares - Discriminant Analysis) are the most common
multivariate ordination analysis (MOA) used in metabolomic
Fig. 4. Typical 1H NMR metabolic-profile spectra of polar and nonpolar extracts of E. multiflora and Q. ilex leaves. Polar metabolites: a-glucose(aG); b-glucose (bG); sucrose (Suc); alanine (Ala); asparagine (Asp); glutamine (Gln); leucine (Leu); isoleucine (Ile); threonine (Thr); valine (Val);
6-deoxypyranose (10); 4-hydroxyphenylacetate (11); malate (12); maleate (13); citrate (14); 3-amino-4-hydroxybutyrate (15); N-acetyl group (N-Ac,
16); quinic acid (Q.ac); tartaric acid (T.ac); arbutin (Arb); choline (Ch); 1,2-propanediol (21); 22, c-hydroxybutyrate (22); lactate (23); quercitol
(Quer); formate (For); catechin derivative (U1). Nonpolar metabolites (assigned signals/regions indicated with letters): A, C, D, and F, fatty acid
spectral regions; B, linoleyl fatty acid region; E and L, unsaturated fatty acid regions; G, free fatty acid region; H, polyunsaturated fatty acid region;
I, diacylglycerid and triacylglycerid region; J, triacylglycerid 2 region; K, triacylglycerid 1 region;M, 1,2 diacylglycerid region; N, polyphenol region;
O, aldehyde group region; Ac, acetyl group; DGA, 1,2-diacylglycerid; FAI, fatty alcohols; Lin, linolenyl chain; P1, polyphenol derivative of p-coum-
aric acid 1; P2, polyphenol derivative of p-coumaric acid 2; Ter, terpene compound 1; TGA1, triacylglycerid 1; TGA2, triacylglycerid 2; U1,
unknown compound 1; U2, unknown compound 2 (data fromEricamultifloramodified fromRivas-Ubach et al. 2012).
© 2013 The Authors. Methods in Ecology and Evolution © 2013 British Ecological Society, Methods in Ecology and Evolution, 4, 464–473
Optimized NMR-based procedures: a tool for ecology field metabolomic studies 469

studies (Ramadan et al. 2006; Ebbels & Cavill 2009; Leiss
et al. 2009; Kim, Choi & Verpoorte 2010; Rivas-Ubach et al.
2012). MOA do not provide any measure of significance and it
is limited to show the relation of cases with the used variables.
PCs loadings of cases provided by MOA can be used to detect
any significant difference of the investigated treatments by
statistical inference such as t-student test or ANOVAS (See sup-
plementary information for more details). To get measures of
statistical significance in multifactorial designs, MANOVA and
PERMANOVA (Permutational MANOVA) are the most suitable
options for metabolomic studies (Johnson et al. 2007;
Anderson, Gorley & Clarke 2008). PERMANOVA is a modern
statistical multivariate method used when the data for all
metabolites are non-normal or when a better accommodation
of random effects and interaction terms is needed (Anderson,
Gorley&Clarke 2008; Rivas-Ubach et al. 2012).
In addition, O-PLS (Orthogonal PLS) and GAs (Genetic
Algorithms) are other statistical methods also used in meta-
bolomic analyses (Ramadan et al. 2006; Ebbels & Cavill
2009).
Results and discussion
OPTIMIZAT ION OF THE PROCEDURE
Different steps of the metabolite extraction procedure were
tested to optimize the time and obtain reliable results for the
statistical analyses.
Ball mills
Most metabolomic studies have used liquid nitrogen for grind-
ing plant samples in mortars (Leiss et al. 2009; Gromova &
Roby 2010; Kim, Choi &Verpoorte 2010). In our protocol, we
preferred a ball mill, for three main reasons. First, the sampled
plant materials frequently resist hand-grinding in mortars with
liquid nitrogen due to the large proportion of cuticles and lig-
nin (slerophyllous leaves, needles, wood, roots, among others),
making the grinding difficult and time consuming. Second,
lyophilization helps to maintain the metabolomes of sampled
organisms intact for a long period of time (Kim, Choi &
Verpoorte 2010), and grinding in mortars is laborious once the
water is removed. Third, ecological studies often require a large
(a)
(b)
Fig. 5. Plots of the first principal component (PC1) vs. the third (PC3)
resulting from PCA conducted through the metabolomic profiles of E.
multiflora leaves. (a) Panel of metabolomic variables. Variables are
indicated by different colours: blue, polar metabolites from primary
metabolism; red, glucose and sucrose; orange, polar metabolites from
secondary metabolism; black, nonpolar compounds. Different meta-
bolic families are separated by clusters in different colours: blue, sugars;
yellow, amino acids; green, compounds related to amino acids and
sugar metabolism in plants (RCAAS); violet, lipids. Variable labels are
described in Fig. 4 and variables from 30 to 55 represent overlapped
signals (Table S4). (b) Panel of samples categorized by season. Seasons
are indicated by different colours (red, summer; yellow, autumn; blue,
winter; and green, spring). Arrows outside the plots indicate the mean
PC score for each season. The statistically significant differences
between seasons are indicated by lowercase letters (P < 0�05) (Adapted
fromRivas-Ubach et al. 2012).
Fig. 6. Plots of the PCAs conducted on the 1H NMR metabolomic
variables of the Erica multiflora analyses that presented different
responses to experimental climatic treatments in summer. Variable
labels are described in Fig. 4 and Table S4. Treatment is indicated by
colour: green, control; yellow, drought. Arrows indicate the mean PC
score for each treatment. The statistically significant differences are
indicated by arrows with lowercase letters (P < 0�05) (Adapted from
Rivas-Ubach et al. 2012).
© 2013 The Authors. Methods in Ecology and Evolution © 2013 British Ecological Society, Methods in Ecology and Evolution, 4, 464–473
470 A. Rivas-Ubach et al.
number of samples, and ball mills allow a more rapid grinding
of several samples than do mortars and produce also a homo-
geneous powder, with minimal variability in particle size
between samples. Liquid nitrogen and mortars, though, may
also be used with soft tissues by applying some modifications
to the first steps of sample processing (detailed in supplemen-
tary information).
Sonication time
After testing different times of sonication, our experiments
showed that the optimum extraction of metabolites was
obtained with 2 min of sonication (Step 7 of Fig. 2) (Table S2
and Figs S2 and S3). The use of chloroform during extraction
will dissolve cellular membranes and thereby reduce the time
of sonication, being then an interesting step when processing
different batches of samples in the same day. In other NMR
protocols of polar metabolites (whithout chloroform extrac-
tion), sonication for 15–20 min has been recommended (Kim,
Choi & Verpoorte 2010). In addition, longer times for sonica-
tion reduce the signal strength of metabolites in 1H NMR
spectra, perhaps due to the heating of samples and the
formation ofmetabolite artifacts (t’Kindt et al. 2008).
Repeated extractions
The importance of repeated extractions has been discussed in
protocols based on LC-MS analyses (t’Kindt et al. 2008), but
there is a lack of metabolomic studies showing the differences
between different extractions. In our protocol we tested one,
two and three extractions (See supporting information) and
our tests showed that two extraction procedures were the opti-
mum since the NMR samples presented the maximum concen-
tration of metabolites in the extracts (Table S3). A first
extraction from E. multiflora and Q. ilex leaves yielded 78�5%and 85�6% metabolites, respectively, relative to a second
extraction, although the differences were not statistically signif-
icant (ANOVA test of the global concentration of metabolites;
P = 0�32 for E. multiflora and P = 0�26 for Q. ilex). Three
extractions from these species showed no differences to two
extractions (ANOVA test of the global concentration of metabo-
lites; P = 0�97 for E. multiflora and P = 0�89 forQ. ilex); more
than 98% of metabolites from the third extraction had already
been extracted after the second extraction (See supporting
information for details).
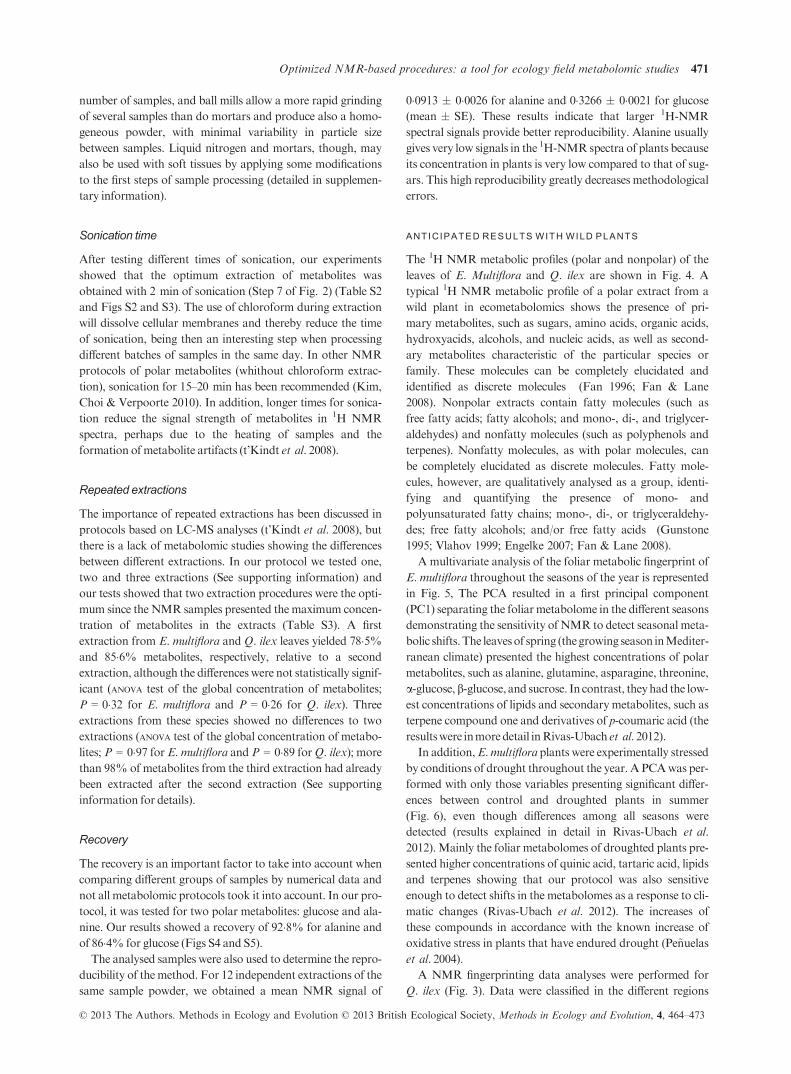
Recovery
The recovery is an important factor to take into account when
comparing different groups of samples by numerical data and
not all metabolomic protocols took it into account. In our pro-
tocol, it was tested for two polar metabolites: glucose and ala-
nine. Our results showed a recovery of 92�8% for alanine and
of 86�4% for glucose (Figs S4 and S5).
The analysed samples were also used to determine the repro-
ducibility of themethod. For 12 independent extractions of the
same sample powder, we obtained a mean NMR signal of
0�0913 � 0�0026 for alanine and 0�3266 � 0�0021 for glucose
(mean � SE). These results indicate that larger 1H-NMR
spectral signals provide better reproducibility. Alanine usually
gives very low signals in the 1H-NMRspectra of plants because
its concentration in plants is very low compared to that of sug-
ars. This high reproducibility greatly decreases methodological
errors.
ANTIC IPATED RESULTS WITH WILD PLANTS
The 1H NMR metabolic profiles (polar and nonpolar) of the
leaves of E. Multiflora and Q. ilex are shown in Fig. 4. A
typical 1H NMR metabolic profile of a polar extract from a
wild plant in ecometabolomics shows the presence of pri-
mary metabolites, such as sugars, amino acids, organic acids,
hydroxyacids, alcohols, and nucleic acids, as well as second-
ary metabolites characteristic of the particular species or
family. These molecules can be completely elucidated and
identified as discrete molecules (Fan 1996; Fan & Lane
2008). Nonpolar extracts contain fatty molecules (such as
free fatty acids; fatty alcohols; and mono-, di-, and triglycer-
aldehydes) and nonfatty molecules (such as polyphenols and
terpenes). Nonfatty molecules, as with polar molecules, can
be completely elucidated as discrete molecules. Fatty mole-
cules, however, are qualitatively analysed as a group, identi-
fying and quantifying the presence of mono- and
polyunsaturated fatty chains; mono-, di-, or triglyceraldehy-
des; free fatty alcohols; and/or free fatty acids (Gunstone
1995; Vlahov 1999; Engelke 2007; Fan & Lane 2008).
A multivariate analysis of the foliar metabolic fingerprint of
E. multiflora throughout the seasons of the year is represented
in Fig. 5, The PCA resulted in a first principal component
(PC1) separating the foliarmetabolome in the different seasons
demonstrating the sensitivity of NMR to detect seasonal meta-
bolic shifts.The leavesof spring (thegrowing season inMediter-
ranean climate) presented the highest concentrations of polar
metabolites, such as alanine, glutamine, asparagine, threonine,
a-glucose,b-glucose, and sucrose. In contrast, theyhad the low-est concentrations of lipids and secondary metabolites, such as
terpene compound one and derivatives of p-coumaric acid (the
resultswere inmoredetail inRivas-Ubach et al.2012).
In addition,E.multiflora plants were experimentally stressed
by conditions of drought throughout the year. A PCAwas per-
formed with only those variables presenting significant differ-
ences between control and droughted plants in summer
(Fig. 6), even though differences among all seasons were
detected (results explained in detail in Rivas-Ubach et al.
2012).Mainly the foliar metabolomes of droughted plants pre-
sented higher concentrations of quinic acid, tartaric acid, lipids
and terpenes showing that our protocol was also sensitive
enough to detect shifts in the metabolomes as a response to cli-
matic changes (Rivas-Ubach et al. 2012). The increases of
these compounds in accordance with the known increase of
oxidative stress in plants that have endured drought (Pe~nuelas
et al. 2004).
A NMR fingerprinting data analyses were performed for
Q. ilex (Fig. 3). Data were classified in the different regions
© 2013 The Authors. Methods in Ecology and Evolution © 2013 British Ecological Society, Methods in Ecology and Evolution, 4, 464–473
Optimized NMR-based procedures: a tool for ecology field metabolomic studies 471
(Fig. S1). The results revealed, as in the case of E. multiflora,
higher concentrations of polar compounds such as sugars and
amino acids in spring leaves. Also, leaves of the summer (the
warmest season) presented lower concentrations of nonpolar
compounds than the rest of the seasons in agreement with
other experimental warming studies on plants (Livonen et al.
2004), chlorophyta (Fuschino et al. 2011), and zooplankton
(Gladyshev et al. 2011).
Conclusions
Herewe have presented a new optimizedNMR-based protocol
for application of metabolomics to field ecology. It has been
specially developed to reduce the experimental errors and to be
applied to a large number of samples, as often required in ecol-
ogy. It thus allows performing more accurate statistical analy-
ses. It has demonstrated to be sensitive enough to detect the
differences in metabolomes of plants across different seasons
and among different experimental climatic treatments. This
protocol has been designed for studying the metabolome of
wild plants but can also be used with animals and it is effective
both for targeted and untargeted studies. It will help to increase
the knowledge in the shifts of thewild organism’smetabolomes
across environmental gradients and it will allow making a
step forwards in the understanding of the role of metabolism
driving the ecosystem structure and function.
Acknowledgements
We thank C. Mulder and two anonymous referees for their constructive com-
ments on our manuscript, Gemma Montalvan, Sara F�erez and Laia Mateu for
laboratory and field support. This studywas founded by the SpanishGovernment
Projects CGL2010-17172/BOS, CTQ2009-08328, Consolider-Ingenio Montes
CSD2008-00040 and by the CatalanGovernment Project SGR 2009-458.
References
Alam, T.M., Kathleen Alam, M., Neerathilingam, M., Volk, D.E., Sarkar, S.,
Shakeel Ansari, G.A. & Luxon, B.A. (2010) 1 HNMRmetabonomic study of
rat response to tri-phenyl phosphate and tri-butyl phosphate exposure.Meta-
bolomics, 6, 386–394.Anderson,M.J., Gorley, R.N. &Clarke, K.R. (2008)PERMANOVA+ for PRI-
MER:Guide to Software and StatisticalMethods. Primer-E, Plymouth,UK.
Aue, W.P., Bartholdi, E. & Ernst, R.R. (1976) 2-Dimensional spectroscopy -
application to nuclear magnetic-resonance. Journal of Chemical Physics, 64,
2229–2246.Bax, A.D. (1985) A spatially selective composite 90 radiofrequency pulse. Journal
of magnetic resonance, 65, 142–145.Bax, A. &Marion, D. (1988) Improved resolution and sensitivity in H-1-detected
heteronuclear multiple-bond correlation spectroscopy. Journal of Magnetic
Resonance, 78, 186–191.Bax, A. & Summers, M.F. (1986) H-1 and C-13 assignments from sensitivity-
enhanced detection of heteronuclear multiple-bond connectivity by 2D multi-
ple quantumNMR. Journal of theAmericanChemical Society, 108, 2093–2094.Beckonert, O., Keun, H.C., Ebbels, T.M.D., Bundy, J., Holmes, E., Lindon, J.C.
&Nicholson, J.K. (2007)Metabolic profiling, metabolomic andmetabonomic
procedures for NMR spectroscopy of urine, plasma, serum and tissue extracts.
Nature Protocols, 2, 2692–2703.Braunschweiler, L. & Ernst, R.R. (1983) Coherence transfer by isotropic mixing-
application to proton correlation spectroscopy. Journal of Magnetic Reso-
nance, 53, 521–528.Deyrup, S.T., Eckman, L.E., McCarthy, P.H., Smedley, S.R., Meinwald, J. &
Schroeder, F.C. (2011) 2D NMR-spectroscopic screening reveals polyketides
in ladybugs. Proceedings of the National Academy of Sciences of the United
States of America, 108, 9753–9758.
Ebbels, T.M.D. &Cavill, R. (2009) Bioinformatic methods in NMR-basedmeta-
bolic profiling.Progress in NuclearMagnetic Resonance Spectroscopy, 55, 361–374.
Ellis, J.K., Athersuch, T.J., Thomas, L.D.K., Teichert, F., P�erez-Trujillo, M.,
Svendsen, C., Spurgeon,D.J., Singh, R., J€arup, L. &Bundy, J.G. (2012)Meta-
bolic profiling detects early effects of environmental and lifestyle exposure to
cadmium in a human population.BMCMedicine, 10, 61.
Engelke, U. (2007) NMR spectroscopy of body fluids a metabolomics approach
to inborn errors of metabolism. PhD Thesis, RadboundUniversity Nijmegen,
TheNetherlands.
Fan, T.W.M (1996) Metabolite profiling by one- and two-dimensional NMR
analysis of complex mixtures. Progress in Nuclear Magnetic Resonance Spec-
troscopy, 28, 161–219.Fan, T.W.M. & Lane, A.N. (2008) Structure-based profiling of metabolites and
isotopomers byNMR. Progress in NuclearMagnetic Resonance Spectroscopy,
52, 69–117.Fiehn, O. (2002) Metabolomics - the link between genotypes and phenotypes.
PlantMolecular Biology, 48, 155–171.Fiehn, O., Kopka, J., D€ormann, P., Altmann, T., Trethewey, R.N. &Willmitzer,
L. (2000) Metabolite profiling for plant functional genomics. Nature Biotech-
nology, 18, 1157–1161.Fuschino, J.R., Guschina, I.A., Dobson, G., Yan, N.D., Harwood, J.L. & Arts,
M.T. (2011) Rising water temperatures alter lipid dynamics and reduce N-3
essential fatty acid concentrations in Scenedesmus obliquus (Chlorophyta).
Journal of Phycology, 47, 763–774.Gladyshev, M.I., Semenchenko, V.P., Dubovskaya, O.P., Fefilova, E.B.,
Makhutova, O.N., Buseva, Z.F., Sushchik, N.N., Razlutskij, V.I., Lepskaya,
E.V. & Baturina, M.A. (2011) Effect of temperature on contents of essential
highly unsaturated fatty acids in freshwater zooplankton. Limnologica-
Ecology andManagement of InlandWaters, 41, 337–339.Gromova, M. & Roby, C. (2010) Toward Arabidopsis thaliana hydrophilic
metabolome: assessment of extraction methods and quantitative 1H NMR.
Physiologia Plantarum, 140, 111–127.Gunstone, F.D., Harwoold, J.L. & Padley, F.B. (1994) The Lipid Handbook, 2nd
edn. Chapman andHall, London.
Jeener, J., Meier, B.H., Bachmann, P. & Ernst, R.R. (1979) Investigation of
exchange processes by 2-Dimensional NMR-spectroscopy. Journal of Chemi-
cal Physics, 71, 4546–4553.Johnson, H.E., Lloyd, A.J., Mur, L.A.J., Smith, A.R. & Causton, D.R. (2007)
The application of MANOVA to analyze Arabidopsis thaliana metabolomic
data from factorially designed experiments.Metabolomics, 3, 517–530.Kay, L.E., Keifer, P. & Saarinen, T. (1992) Pure absorption gradient enhanced
heteronuclear single quantum correlation spectroscopy with improved sensi-
tivity. Journal of the American Chemical Society, 114, 10663–10665.Kessler, H., Oschkinat, H., Griesinger, C. & Bermel, W. (1986) Transformation
of homonuclear two-dimensional NMR techniques into one-dimensional
techniques using Gaussian pulses. Journal of Magnetic Resonance, 70, 106–133.
Kim, H.K., Choi, Y.H. &Verpoorte, R. (2010) NMR-based metabolomic analy-
sis of plants.Nature Protocols, 5, 536–549.Kim, H.K. & Verpoorte, R. (2010) Sample preparation for plant metabolomics.
Phytochemical Analysis, 21, 4–13.t’Kindt, R., De Veylder, L., Storme, M., Deforce, D. & Van Bocxlaer, J. (2008)
LC-MS metabolic profiling of Arabidopsis thaliana plant leaves and cell cul-
tures: optimization of pre-LC-MS procedure parameters. Journal of Chroma-
tography B, 871, 37–43.Kruger, N.J., Troncoso-Ponce,M.A. &Ratcliffe, R.G. (2008) 1HNMRmetabo-
lite fingerprinting and metabolomic analysis of perchloric acid extracts from
plant tissues.Nature Protocols, 3, 1001–1012.Leiss, K.A., Choi, Y.H., Abdel-Farid, I.B., Verpoorte, R. &Klinkhamer, P.G.L.
(2009) NMR metabolomics of thrips (Frankliniella occidentalis) resistance in
Senecio hybrids. Journal of Chemical Ecology, 35, 219–229.Leiss, K.A., Choi, Y.H., Verpoorte, R. & Klinkhamer, P.G.L. (2011) An over-
view of NMR-based metabolomics to identify secondary plant compounds
involved in host plant resistance.Phytochemistry Reviews, 10, 205–216.Livonen, S., Saranpaa, P., Sutinen, M.L. & Vapaavuori, E. (2004) Effects
of temperature and nutrient availability on plasma membrane lipid com-
position in Scots pine roots during growth initiation. Tree Physiology,
24, 437–446.Martineau, E., Tea, I., Loa€ec, G., Giraudeau, P. & Akoka, S. (2012) Strategy for
choosing extraction procedures for NMR-based metabolomic analysis of
mammalian cells.Analytical and Bioanalytical Chemistry, 401, 2133–2142.Nagayama, K., Kumar, A., Wuthrich, K. & Ernst, R.R. (1980) Experimental-
techniques of two-dimensional correlated spectroscopy. Journal of Magnetic
Resonance, 40, 321–334.
© 2013 The Authors. Methods in Ecology and Evolution © 2013 British Ecological Society, Methods in Ecology and Evolution, 4, 464–473
472 A. Rivas-Ubach et al.

Nicholson, J.K., Lindon, J.C. &Holmes, E. (1999) ‘Metabonomics’: understand-
ing the metabolic responses of living systems to pathophysiological stimuli via
multivariate statistical analysis of biological NMR spectroscopic data. Xeno-
biotica, 29, 1181–1189.Nicholson, J.K., Foxall, P.J.D., Spraul, M., Farrant, R.D. & Lindon, J.C. (1995)
750 MHz 1H and 1H–13C NMR spectroscopy of human blood plasma.Ana-
lytical Chemistry, 67, 793–811.Palmer, A.G., Cavanagh, J., Wright, P.E. & Rance, M. (1991) Sensitivity
improvement in proton-detected 2-Dimensional heteronuclear correlation
NMR-spectroscopy. Journal ofMagnetic Resonance, 93, 151–170.Palomino-Sch€atzlein,M., Escrig, P.V., Boira, H., Primo, J., Pineda-Lucena, A. &
Cabedo, N. (2011) Evaluation of nonpolar metabolites in plant extracts by
13C NMR spectroscopy. Journal of Agricultural and Food Chemistry, 41,
11407–11416.Pe~nuelas, J. & Sardans, J. (2009a) Ecological metabolomics.Chemistry and Ecol-
ogy, 25, 305–309.Pe~nuelas, J. & Sardans, J. (2009b) Elementary factors.Nature, 460, 803–804.Pe~nuelas, J., Munn�e-Bosch, S., Llusi�a, J. & Filella, I. (2004) Leaf reflectance
and photo- and antioxidant protection in field-grown summer-stressed
Phillyrea angustifolia. Optical signals of oxidative stress? New Phytologist,
162, 115–124.P�erez-Trujillo, M., Gomez-Caravaca, A.M., Segura-Carretero, A., Fern�andez-
Guti�errez, A. & Parella, T. (2010) Separation and identification of phenolic
compounds of extra virgin olive oil from Olea europaea L. by HPLC-DAD-
SPE-NMR/MS. Identification of a new diastereoisomer of the aldehydic form
of oleuropein aglycone. Journal of Agricultural and Food Chemistry, 58, 9129–9136.
P�erez-Trujillo, M., Lindon, J.C., Parella, T., Keun, H.C., Nicholson, J.K. &
Athersuch, T.J. (2012) Chiral metabonomics: H-1NMR-based enantiospecific
differentiation of metabolites in human urine via direct cosolvation with beta-
cyclodextrin.Analytical Chemistry, 84, 2868–2874.Ramadan,Z., Jacobs,D.,Grigorov,M.&Kochhar, S. (2006)Metabolic profiling
using principal component analysis, discriminant partial least squares, and
genetic algorithms.Talanta, 68, 1683–1691.Rivas-Ubach, A., Sardans, J., P�erez-Trujillo, M., Estiarte, M. & Pe~nuelas, J.
(2012) Strong relationship between elemental stoichiometry and metabolome
in plants. Proceedings of the National Academy of Sciences of the United States
of America, 109, 4181–4186.Roberts, L.D., Souza, A.L., Gerszten, R.E. & Clish, C.B. (2012) Targeted
Metabolomics. Current Protocols in Molecular Biology, 98, 30.2.1–
30.2.24.
Robertson, D.G. (2005) Metabonomics in toxicology: a review. Toxicological
Sciences, 85, 809–822.Robinette, S.L., Brueschweiler, R., Schroeder, F.C. & Edison, A.S. (2012) NMR
in metabolomics and natural products research: two sides of the same coin.
Accounts of Chemical Research, 45, 288–297.Sardans, J., Pe~nuelas, J. & Rivas-Ubach, A. (2011) Ecological metabolomics:
overview of current developments and future challenges. Chemoecology, 21,
191–225.Schleucher, J., Schwendinger, M., Sattler, M., Schmidt, P., Schedletzky, O.,
Glaser, S.J., Sorensen, O.W. & Griesinger, C. (1994) A general enhancement
scheme in heteronuclearmultidimensionalNMRemploying pulsed-field gradi-
ents. Journal of BiomolecularNmr, 4, 301–306.Scott, I.M., Vermeer, C.P., Liakata, M., Corol, D.I., Ward, J.L., Lin, W.,
Johnson, H.E., Whitehead, L., Kular, B. & Baker, J.M. (2010) Enhancement
of plant metabolite fingerprinting by machine learning. Plant Physiology, 153,
1506–1520.Smart, K.F., Aggio, R.B.M., Van Houtte, J.R. & Villas-Boas, S.G. (2010)
Analytical platform for metabolome analysis of microbial cells using methyl
chloroformate derivatization followed by gas chromatography-mass spec-
trometry.Nature Protocols, 5, 1709–1729.Sterner, R.W. & Elser, J.J. (2002) Ecological Stoichiometry: The Biology of
Elements From Molecules to The Biosphere. Princeton University Press,
Princeton.
Stonehouse, J., Adell, P., Keeler, J. & Shaka, A.J. (1994) Ultrahigh-quality NOE
spectra. Journal of the AmericanChemical Society, 116, 6037–6038.
Stott, K., Stonehouse, J., Keeler, J., Hwang, T.L. & Shaka, A.J. (1995) Excitation
sculpting in high-resolution nuclear-magnetic-resonance spectroscopy - appli-
cation to selective NOE experiments. Journal of the American Chemical Soci-
ety, 117, 4199–4200.Urban, M., Enot, D.P., Dallmann, G., K€orner, L., Forcher, V., Enoh, P., Koal,
T., Keller, M. & Deigner, H.P. (2010) Complexity and pitfalls of mass spec-
trometry-based targetedmetabolomics in brain research.Analytical Biochemis-
try, 406, 124–131.Vlahov, G. (1999) Application of NMR to the study of olive oils. Progress in
NuclearMagnetic Resonance Spectroscopy, 35, 341–357.Wagner, R. & Berger, S. (1996) Gradient-selectedNOESY - a fourfold reduction
of themeasurement time for theNOESY experiment. Journal ofMagnetic Res-
onance SeriesA, 123, 119–121.Weckwerth,W., Loureiro,M.E.,Wenzel, K. & Fiehn, O. (2004) Differential met-
abolic networks unravel the effects of silent plant phenotypes. Proceedings of
theNational Academy of Sciences of theUnited States of America, 101, 7809.
Zheng, G. & Price, W.S. (2010) Solvent signal suppression in NMR. Progress in
NuclearMagnetic Resonance Spectroscopy, 56, 267–288.
Received 2November 2012; accepted 8 January 2013
Handling Editor: Gabriel Bowen
Supporting Information
Additional Supporting Information may be found in the online version
of this article.
Figure S1. Example of the 1H NMR spectra of the polar and nonpolar
extracts ofEricamultiflora leaves.
Figure S2. One-way ANOVA of the entire polar metabolome of Erica
multiflora submitted to different sonication times (0, 2, 5, 12, and 20
minutes).
Figure S3. One-way ANOVA of the entire nonpolar metabolome of
Erica multiflora submitted to different sonication times (0, 2, 5, 12, and
20 min).
Figure S4.Recovery test for alanine inEricamultiflora foliar samples.
Figure S5.Recovery test for glucose inEricamultiflora foliar samples.
Table S1. The following table shows some relevant bibliography
regarding the identification ofmetabolites atNMR spectra.
Table S2. Integral values of spectra referred to internal standards (TSP
or TMS) of polar and nonpolar metabolites extracted from Erica mul-
tiflora foliar samples submitted to different sonication times (0, 2, 5, 12,
and 20 min).
Table S3. Integral values of spectra referred to internal standards (TSP
or TMS) of polar metabolites extracted from Erica multiflora, Quercus
ilex, and Fagus sylvatica foliar samples submitted to different numbers
of extractions (1, 2, or 3).
Table S4.Number assignation for the polar compounds elucidated and
the overlapped 1H-NMR signals.
© 2013 The Authors. Methods in Ecology and Evolution © 2013 British Ecological Society, Methods in Ecology and Evolution, 4, 464–473
Optimized NMR-based procedures: a tool for ecology field metabolomic studies 473