economic analysis of sequential species protection … water quality regs full report.pdfeconomic...
TRANSCRIPT

Economic Analysis of Sequential
Species Protection and Water Quality
Regulations in the Delta
PREPARED FOR
Southern California Water Committee and the Committee for
Delta Reliability
PREPARED BY
David L. Sunding, Ph.D.
April 2017
This report was prepared for the Committee for Delta Reliability and the Southern California
Water Committee. All results and any errors are the responsibility of the authors and do not
represent the opinion of The Brattle Group or its clients.
Acknowledgement: We acknowledge the valuable contributions of many individuals to this report
and to the underlying analysis, including members of The Brattle Group for peer review.
Copyright © 2016 The Brattle Group, Inc.

1 | brattle.com
I. Introduction and Findings
Over the past four decades, water exports from the Delta have been subjected to increasingly
stringent water quality and endangered species regulations. The effect of these interventions has
been to reduce water supplies available to urban and agricultural users. As a result, growers, farm
laborers, workers in related industries, and urban water consumers have experienced economic
losses in the form of increased shortages and expenditures on water supply alternatives.
This report examines the economic impact of sequential water quality and species protection
regulations in the Delta. Three regulatory regimes are examined in detail: D-1485 which was
enacted by the state in 1978, D-1641 adopted in 1999 and amended in 2000, and the current regime
based on 2008- and 2009 Biological Opinions (BiOps) issued by the federal government for delta
smelt and salmonid species. For each set of regulations, urban and agricultural water supplies are
forecasted to 2050 and valued. For the urban sector, the report focuses on the Metropolitan Water
District of Southern California (MWD), the major water supplier in Southern California and the
largest urban water agency receiving water from the Delta. Agricultural impacts are examined for
the entire portion of the San Joaquin Valley that receives Delta exports.
The California Department of Water Resources has analyzed the water supply impacts of these
sequential water quality regulations using its CALSIM II model. Their analysis shows that, on
average, D-1641 reduces annual state and federal project deliveries by approximately 300,000 acre-
feet per year relative to D-1485, whereas the BiOps reduces project deliveries by an additional one
million acre-feet relative to D-1641. Thus, relative to D-1485, current regulations reduce state and
federal project deliveries by over 20 percent.
In urban areas of California served by the State Water Project, tighter regulations in the Delta have
increased the frequency and severity of retail water shortages, and accelerated investments in
conservation and water supply alternatives. Since 2000, urban water agencies served by the State
Water Project have made additional investments in water supply reliability and incurred shortage
losses totaling over $5.7 billion in present value to cope with the water supply losses as a result of
moving from the regulatory scheme D-1485 to the BiOps. Looking to the future, urban consumers
will spend an additional $10.1 billion between the present and 2050 as a result of the shift from D-
1485 to D-1641 and the BiOps.
2 | brattle.com
For agriculture in the San Joaquin Valley, more stringent regulations in the Delta have resulted in
the fallowing of over 55,000 acres annually compared to D-1485, with the associated loss of 3,150
farm jobs each year and roughly $900 million in farmworker compensation between 2000 and the
present. Farmer net income losses from the BiOps as compared to D-1485 over this period have
totaled nearly $1.0 billion, including the lost production on fallowed acreage and the additional
costs of groundwater pumping. Considering the indirect and induced effects of this reduction in
economic activity (i.e., the impact of reduced agricultural production on other sectors of the
economy), statewide losses in employment and value added are roughly double these amounts.
In the coming years, San Joaquin Valley agriculture is expected to become more sensitive to
reductions in Delta water supplies. Historically, many growers were able to increase groundwater
pumping in response to reduced surface water deliveries. Such a response to drought and
environmental regulation likely will not be possible in the future, at least to the same degree as in
the past. The Sustainable Groundwater Management Act (SGMA) requires local agencies to form
dozens of new agencies to manage groundwater sustainably. The regulations implemented by these
local agencies may significantly limit farmers’ ability to extract groundwater in dry periods,
meaning that reductions in surface water deliveries would have to be accommodated by other
types of responses, notably increased fallowing. Under the assumption that within a decade farmers
are limited to sustainable yields in dry periods, the costs of the BiOps relative to D-1485 have a
present value of $4.0 billion in worker compensation and $2.0 billion in farm net income over the
period 2016 to 2050. These costs are in addition to the historical impacts detailed above.
The following table summarizes annual impacts and attributes changes to D-1641 and the BiOps:

3 | brattle.com
Totaling these annual impacts over the periods 2000 to the present and utilizing a 3 percent real
rate of interest to calculate present values, the transition from D-1485 to D-1641 followed by the
BiOps has already imposed the following costs:
• A loss of nearly 300,000 acre-feet annually as a result of D-1641 plus an additional loss of 1
million acre-feet annually as a result of the BiOps;
• additional urban water supply and conservation investments of $5.7 billion from 2000 to
the present;
• a loss of 3,150 on-farm jobs annually and $900 million in farmworker compensation from
2000 to the present; when multiplier effects are included, these losses total to 6,079 jobs
and $2.0 billion in lost income statewide;
• lost net farm income of $1.0 billion since 2000; including indirect and induced effects, these
impacts total to $1.8 billion.
Looking to the future, and assuming that SGMA begins to constrain agricultural groundwater
pumping in the San Joaquin Valley in 2027, the transition from D-1485 to the BiOps is expected
to result in the following impacts between the present and 2050:
• An additional $10.1 billion in water supply and conservation investments for the SWP
urban contractors.
UrbanImpacts
Fallowing EmploymentEmployeeCompensation
NetFarmIncome ValueAdded
Additional
InvestmentsandRationing
Present
D-1485toD-1641 12,874 727 $17,809 $18,600 $36,409 $110,769D-1641toBiOps 42,915 2,423 $59,365 $62,000 $121,365 $369,230DirectAnnualImpacts 55,789 3,150 $77,174 $80,600 $157,774 $480,000
FutureImpactsPost-SGMAD-1485toD-1641 45,061 2,544 $62,333 $24,716 $87,049 $110,769D-1641toBiOps 150,203 8,481 $207,779 $82,385 $290,164 $369,230DirectAnnualImpacts 195,265 11,025 $270,112 $194,190 $464,302 $480,000
AgriculturalImpacts
SummaryofAnnualEconomicImpacts
Fallowingmeasuredinacres;employmentmeasuredinjobs;valueaddedandadditionalinvestmentsmeasuredinthousandsof2016dollars.

4 | brattle.com
• potential fallowing of 195,000 acres in the San Joaquin Valley in average years following
the implementation of SGMA;
• lost farmworker jobs growing to 11,025 jobs annually following implementation of
groundwater pumping limitations; with multiplier effects included, these annual job losses
total 21,279 statewide;
• losses of $4.0 billion in worker compensation and $2.0 billion in net farm income;
including multiplier effects, these impacts imply statewide income losses of $8.8 and $3.8
billion, respectively.
Totaling past and future impacts, the imposition of sequentially tighter water quality and
endangered species regulations in the Delta has the following impacts:
• $5.0 billion in lost worker compensation and $3.0 billion in lost net farm income over the
period 2000 to 2050, for a total loss of $8.0 billion;
• including multiplier effects, these impacts imply lost value added (i.e., employee
compensation plus proprietor income) of $16.5 billion from 2000 to 2050;
• additional urban water supply investments and conservation efforts costing retail
customers a total of $15.8 billion from 2000 to 2050.
II. Sequential Water Quality and Species Protection Regulations in the
Delta
This study examines the economic impact of the following sequential regulations in the Delta: D-
1485, D-1641 and the current regime based on the 2008 Biological Opinion. In addition to
regulations adopted by the state, in 1993 the federal government enacted the Central Valley Project
Improvement Act that reduced project deliveries relative to D-1485 levels. The incremental
impacts of the CVPIA over and above D-1641 are not modeled here, but the requirements of the
Act are included in the modeling of the BiOps.
1. D-1485
5 | brattle.com
D-1485 was adopted by the State Water Resources Control Board on August 16, 1978. A central
principle of D-1485 was to impose water quality standards in the Delta intended to preserve water
quality at least as well as if no state or federal water projects had been constructed.1 It included
minimum Delta Outflow standards, required monthly reports of high tide salinity in the “interior
Marsh,”2 and called for permittees of Delta water resources to develop and implement a plan in
cooperation with other agencies to ensure that salinity standards were met.3 D-1485 established
five categories of water years – wet, above normal, below normal, dry, and critical – with the
understanding that standards would be less stringent in dry and critical years than in wet and
above normal years.4
2. Central Valley Project Improvement Act (CVPIA)
The CVPIA was signed into law by President Bush on October 30, 1992 and dictates management
changes to the Central Valley Project.5 The act’s goals were to protect natural habitats in the
Central Valley and Trinity River basins, to improve operational flexibility of the CVP, to expand
voluntary water transfers, and to balance demands for use of CVP water for wildlife, agriculture,
municipal use, and industrial and power use.6 The act’s requirements included 800,000 acre-feet
of water to be dedicated to fish and wildlife each year, tiered rates for new and renewed water
1 “Environmental Impact Reports: Environmental Report for the 1995 WQCP”, Chapter 3, III-1.
[http://www.waterboards.ca.gov/waterrights/water_issues/programs/bay_delta/eirs/eir1995/]
2 “Summary of Salinity Conditions in Suisun March During Water Years 1984 – 1992”, Environmental
Services Office, Department of Water Resources, November 23, 1994, 2 – 3.
3 “Summary of Salinity Conditions in Suisun March During Water Years 1984 – 1992”, Environmental
Services Office, Department of Water Resources, November 23, 1994, 2.
[http://www.waterboards.ca.gov/waterrights/water_issues/programs/bay_delta/wq_control_plans/1995
wqcp/admin_records/part05/330.pdf]
4 “Water Right Decision 1594 and Order WR 84-2,” California State Water Resources Control Board,
November 1983 and February 1984, 7.
[http://www.waterboards.ca.gov/waterrights/board_decisions/adopted_orders/decisions/d1550_d1599/
wrd1594.pdf]
5 Summary of CVPIA, [http://www.usbr.gov/mp/cvpia/]
6 “Central Valley Project Improvement Act”
[http://www.usbr.gov/mp/cvpia/title_34/public_law_complete.html]
Continued on next page

6 | brattle.com
contracts, water transfers provisions, several restoration efforts, and a prohibition on new water
contracts or contract renewals until specified environmental goals were achieved.7
3. D-1641
Water Right Decision 1641, issued December 29, 1999 and revised March 15, 2000 amended terms
and conditions that applied to water rights of the CVP and SWP. It introduced new water quality
and flow objectives not included in previous plans8 and specified amendments to the terms and
conditions of particular permits.9 The decision set forth a plan for water quality compliance and
baseline monitoring, ordered other monitoring plans to protect the Delta habitat,10 validated the
authority of the State Water Resources Control Board to impose specific requirements as needed
over time, and detailed a number of other regulations.11 It established water quality and monitoring
requirements by municipal and industrial uses, agricultural uses, fish and wildlife uses, Chipps
Island and Port Chicago maximum daily average electrical conductivity, and water quality
monitoring stations and sampling parameters.12
4. BiOps
The current regulatory regime governing Central Valley Project (CVP) and State Water Project
(SWP) operations in the Sacramento-San Joaquin Delta Estuary (“the Delta”) is guided by a 2008
7 Summary of CVPIA, [http://www.usbr.gov/mp/cvpia/]
8 “Chapter 1 Summary of Legal and Statutory Authorities, Water Rights, and Other Obligations Relevant
to the Action”, USBR, May 16, 2008, 1-6.
[http://www.usbr.gov/mp/cvo/OCAP/docs/OCAP_BA_001.pdf]
9 “Revised Water Right Decision 1641,” State Water Resources Control Board and California
Environmental Protection Agency, March 15, 2000, 146.
[http://www.waterboards.ca.gov/waterrights/board_decisions/adopted_orders/decisions/d1600_d1649/
wrd1641_1999dec29.pdf]
10 “Revised Water Right Decision 1641,” State Water Resources Control Board and California Environmental
Protection Agency, March 15, 2000, 147.
11 “Revised Water Right Decision 1641,” State Water Resources Control Board and California Environmental
Protection Agency, March 15, 2000, 147.
12 Sacramento-San Joaquin Bay-Delta Estuary D-1641 Salinity Monitoring and Compliance Program
Webpage, California State Water Resources Control Board. Accessed April 27, 2016.
[http://www.waterboards.ca.gov/waterrights/water_issues/programs/compliance_monitoring/sacrame
nto_sanjoaquin/]
Continued on next page

7 | brattle.com
Biological Opinion (Smelt BiOp) issued by the US Fish and Wildlife Service .13 The Smelt BiOps
concluded that under proposed CVP/SWP operations, inflows to the Delta would likely be reduced
and further damage the delta smelt’s habitat, threatening its existence.14 The Smelt BiOps included
Reasonable and Prudent Alternative (RPAs) requiring the following actions: “1)
preventing/reducing entrainment of delta smelt at Jones and Banks; 2) providing adequate habitat
conditions that will allow the adult delta smelt to successfully migrate and spawn in the Bay-Delta;
3) providing adequate habitat conditions that will allow larvae and juvenile delta smelt to rear; and
4) providing suitable habitat conditions that will allow successful recruitment of juvenile delta
smelt to adulthood.”15 Additionally, the alternative called for monitoring “delta smelt abundance
and distribution through continued sampling programs through the IEP.”16
The current regulatory regime also is governed by a 2009 National Marine Fisheries Service
Biological Opinion (Salmonid BiOp) that found that CVP/SWP operations were likely to threaten
the existence of Sacramento River winter-run Chinook salmon, Central Valley spring-run Chinook
salmon, Central Valley steelhead, Southern Distinct Population Segment of North American Green
sturgeon, and Southern Resident killer whales.17 The opinion identified several aspects of water
operations in the Delta as detrimental to the affected species, including a rise in water temperatures
due to insufficient cold water in storage to reduce downstream temperatures.18 Among other
conclusions, it found that Red Bluff Diversion Dam would impede upstream migration of adult fish
and would particularly threaten the green sturgeon. It additionally found that juvenile rearing
habitats must be improved in the long-term, that operations were diverting out-migrating
13 “Adaptive Management of Fall Outflow for Delta Smelt Protection and Water Supply Reliability”, Fall Outflow Adaptive Management Plan Milestone Draft, August 9, 2011, 1.
[http://www.fws.gov/sfbaydelta/documents/Adaptive%20Management%20of%20Fall%20Outflow%20
for%20Delta%20Smelt%20Protection%20and%20Water%20Supply%20Reliability.pdf]
14 “Formal Endangered Species Act Consultation on the Proposed Coordinated Operations of the Central
Valley Project (CVP) and State Water Project (SWP),” United States Department of the Interior Fish
and Wildlife Service, December 15, 2008, 276 – 277.
15 Smelt BiOp, 279.
16 “Formal Endangered Species Act Consultation on the Proposed Coordinated Operations of the Central
Valley Project (CVP) and State Water Project (SWP),” United States Department of the Interior Fish
and Wildlife Service, December 15, 2008, 279.
17 “Chinook Salmon/Sturgeon Biological Opinion,” National Marine Fisheries Service, June 4, 2009, 30.
Accessed July 6, 2016. [https://nrm.dfg.ca.gov/FileHandler.ashx?DocumentID=21473]
18 Ibid, 576.
Continued on next page

8 | brattle.com
juveniles to the interior Delta instead of the outer estuary, that out-migrating juveniles were
excessively exposed to water pumps, and that the Nimbus Fish hatchery steelhead program has
contributed to a loss of genetic diversity.19 The opinion put forth an RPA with requirements
including fish passage at particular dams, the provision of adequate rearing habitats through
alteration of operations and restoration projects, engineering projects to further reduce hydrologic
effects, and modifications to improve temperature management in Folsom Reservoir.20
III. Summary of Water Supply Impacts
Estimates of future CVP and SWP deliveries for three sets of regulations (D-1485, D-1641 and the
BiOps) are determined using the California Department of Water Resources’ CALSIM II model, a
generalized water resource simulation that generates hydrologic time series forecasts of large,
complex river basins. This model relies on early long-term water demand forecasts for the year
2020 and an extended record of runoff patterns. Data produced using CALSIM II are used to
estimate the water to be exported from the Delta and distributed to the south of Delta contractors,
including the Metropolitan Water District and Kern County Water Agency on the SWP, and
Westlands Water District on the CVP, among many others.
On average, D-1641 has resulted in approximately 300,000 acre-feet per year of additional Delta
outflow relative to D-1485, and the BiOps have resulted in approximately 1 million acre-feet per
year of additional Delta outflow over the levels required in D-1641. There is also an increased
reliance on water stored in upstream reservoirs to satisfy Delta flow requirements and other
beneficial uses of water. Increases in Delta flow requirements imposed by D-1641 and the BiOps
have further constrained CVP and SWP operations, resulting in decreases in operational flexibility
and increases in vulnerability to adverse dry year conditions for the environment and water
supply, primarily due to reduced carryover storage. There have been changes in flow patterns in
all major tributaries in the Central Valley that have affected beneficial uses of water. There have
been reductions in project reservoir storage and water deliveries and water supply reliability.
For both the CVP and the SWP, implementation of D-1641 and the BiOps has resulted in reduced
opportunities to capture uncontrolled flows into the Delta with an increased reliance on upstream
storage to satisfy both environmental requirements and water supply needs. Under the D-1485
19 Ibid, 576.
20 Ibid, 579.

9 | brattle.com
scenario, the CVP and the SWP could divert more water during periods of high flow (excess
conditions) than under the D-1641 scenario. This ability to divert more water during periods of
high flow has been reduced to a greater extent under the BiOps scenario; this is because terms in
the RPAs impose significantly more Delta export restrictions during late winter and spring periods
when flows are typically the highest. D-1641, and to a greater extent the RPAs, also result in
increased reservoir releases to comply with Delta outflow requirements during the fall period
when natural flows are typically the lowest. Increased Delta outflow has caused the CVP and the
SWP to increase their reliance on stored water. This effect has, in turn, altered the flow regimes
in upstream tributaries and changed the pattern of Delta export water diversions.
On average, increases in Delta outflow are approximately equal to reductions in Delta exports.
Average annual Delta exports in the D-1641 scenario are about 300,000 acre-feet lower than the
D-1485 scenario, and exports are reduced about another one million acre-feet in the BiOps scenario
relative to the D-1641 scenario. Table A allocations are lower under the BiOps, and surplus water
(available under Article 21 of SWP contracts) is available in about 90% of years in the D-1485
scenario, 82% of years in the D-1641 scenario, and only 25% of years in the BiOps scenario. For
each year type, the average water supply loss from the BiOps relative to D-1485 is between 1.0 and
1.5 million acre-feet, with an average of 1.3 million acre-feet across all water year types.
IV. Impacts to Urban Water Systems
The analysis of urban water supplies and demands is performed at the individual agency level
using the Supply-Demand Balance Simulation Model (or SDBSIM), developed by The Brattle
Group and detailed in Chapter 9 and Appendix 9A of the Bay Delta Conservation Plan.
SDBSIM is a stochastic simulation model that calculates changes in economic welfare of
consumers in 36 major water urban agencies receiving Delta water supplies directly or
indirectly. These agencies were chosen for analysis because they receive the bulk of the SWP
urban deliveries and because they have the largest potential to experience changes in welfare
as a result of variations in Delta yields. For this portion of the study, we focus on impacts to
the Metropolitan Water District of Southern California, which receives roughly half of all
available yields from the SWP.
The SWP is the most important source of imported water for Metropolitan Water District.
SWP deliveries consist of both Table A and Article 21 supplies. Table A supply is a contracted
quantity that totals roughly 2.6 MAF per year across all the urban member agencies in the

10 | brattle.com
model. Article 21 deliveries are unscheduled water that is available in wet years, and is
essentially the surplus water that remains after all operational, water quality, and Delta
requirements are met.
The first step toward valuing the urban water supply impacts of tighter water quality
regulations in the Delta is to identify the forecasted patterns of urban water shortages. The
SDBSIM evaluates water shortages in each sector21 given demand levels over time and water
supply forecasts for each of the SWP agencies. The model runs 83 different trials for each
agency by rotating through a historical hydrologic sequence. The shortage and demand outputs
are then used to calculate the value of losses to consumers associated with a shortage given a
constant elasticity of demand and avoided marginal cost of service. The water supplies
considered in the SDBSIM consist of the local and imported supplies discussed in the preceding
section. The water demands considered in the SDBSIM are based on an econometric forecast
model, discussed in detail in the subsequent section. For the purposes of this report, the
SDBSIM incorporates the 26 MWD member agencies.
The SDBSIM uses an indexed sequential Monte Carlo simulation method to measure the
supply-demand balance outcomes for forecasted years given the pattern of historical
hydrologic conditions between years 1922 and 2004. It adjusts the demand and supplies of a
forecasted year given a past year of hydrologic conditions, then takes the next sequential
forecasted year and adjusts the demand and supplies for that year given the next sequential
historical hydrologic year conditions, and so on. For example, the SDBSIM would adjust the
forecasted demand and supplies for the year 2012 given the hydrologic conditions of the year
1922, and adjust the forecasted demand and supplies of year 2013 given the hydrologic
conditions of year 1923, and so on. By preserving the series of climate patterns, or hydrologic
trace, the model is able to capture the operation of storage resources that are drawn upon and
refilled over the forecast horizon given a probabilistic sequence of hydrologic conditions. The
model then starts over and shifts the hydrologic year by one for each forecasted year. That is,
it will adjust the 2012 forecast given the 1923 historical hydrologic conditions, and accordingly
will adjust 2013 given 1924 conditions, and so forth. This shifting process is done 83 times such
that each forecasted year is evaluated under each hydrologic condition, while still preserving
21 Sectors are composed of single-family residential; multifamily residential; commercial, industrial and
institutional; and agriculture.

11 | brattle.com
the order of the hydrologic conditions, resulting in 83 different reliability outcomes for each
forecast year. The model considers the hydrologic conditions of 2004 to be followed by those
of year 1922. Thus, when forecasting using a trace that starts with a late hydrologic year, it
simply loops back around to the beginning of the climate cycle.
For each year, the SDBSIM compares the forecasted demand to the sum of available projected
local supplies and imported supplies less conservation savings in order to assess the disparity
between the amount of water desired and the amount that can be provided. Demand growth
is based on an econometric model that incorporates land use and population changes, expected
rate growth, income and household demographic changes, and the effect of conservation
programs operated by MWD and its member agencies. If a shortage exists, the SDBSIM may
release additional supplies from storage or transfer programs until supply and demand are
balanced or until these supplies are exhausted. A net shortage for the year results if the gap
between supplies and demands is too large to be balanced by storage and transfer programs. If
a surplus exists, the SDBSIM may allocate surplus water to various storage accounts until all
storage capacity is used; any remaining surplus supplies are considered unused or “wasted” and
are not available for use in subsequent years of the forecast.
The figure below shows average water shortages in the MWD service territory under the three
water quality regulations. It is apparent that shortages are larger and grow more quickly under
the current, most restrictive regime. At present, MWD customers will likely experience
shortages averaging 20,000 acre-feet per year, a figure that grows dramatically to nearly
120,000 acre-feet per year by 2050. To put shortages of this magnitude into perspective, the
Carlsbad desalination plant just put into service in northern San Diego County has a capacity
of 56,000 acre-feet annually, or just half of the region’s projected annual shortage under the
BiOps. The Carlsbad facility had a capital cost of over $1 billion, and operating costs that are
highly correlated with energy prices.
Average shortages under D-1641 and D-1485 are significantly smaller than under the BiOps.
In fact, there are no anticipated shortages, even in critically dry years, for more than a decade
under the two earlier regulatory regimes. Under D-1485, in fact, no shortages are expected in
Southern California until 2040.

12 | brattle.com
Expected annual shortages only reveal part of the economic impacts of water quality and
species protection regulations. Shortages occur predominately in dry years, meaning that when
a shortage occurs it can be much larger than the expected value that averages across dry and
wet years. The figure below shows the maximum dry-year shortage for each of the three water
quality regimes.

13 | brattle.com
The figure reveals that dry-year shortages in California are dramatically larger under the BiOps
than the two prior regulatory regimes. The BiOps drive dry-year shortages in the region to
roughly 250,000 acre-feet by 2026, over 600,000 acre-feet by 2036, and over 1.1 million acre-
feet by 2050. Dry year shortages under D-1641 are roughly half of these amounts, and are even
smaller under D-1485. In fact, under D-1485, there are no anticipated dry year shortages until
2040.
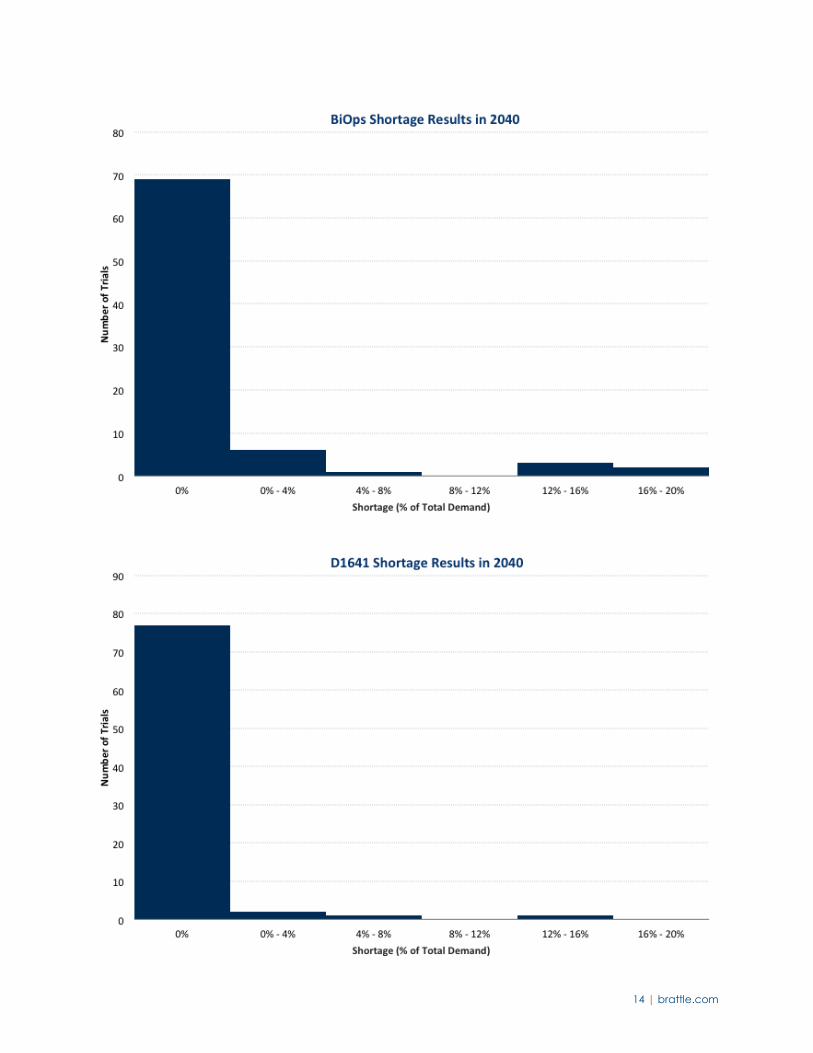
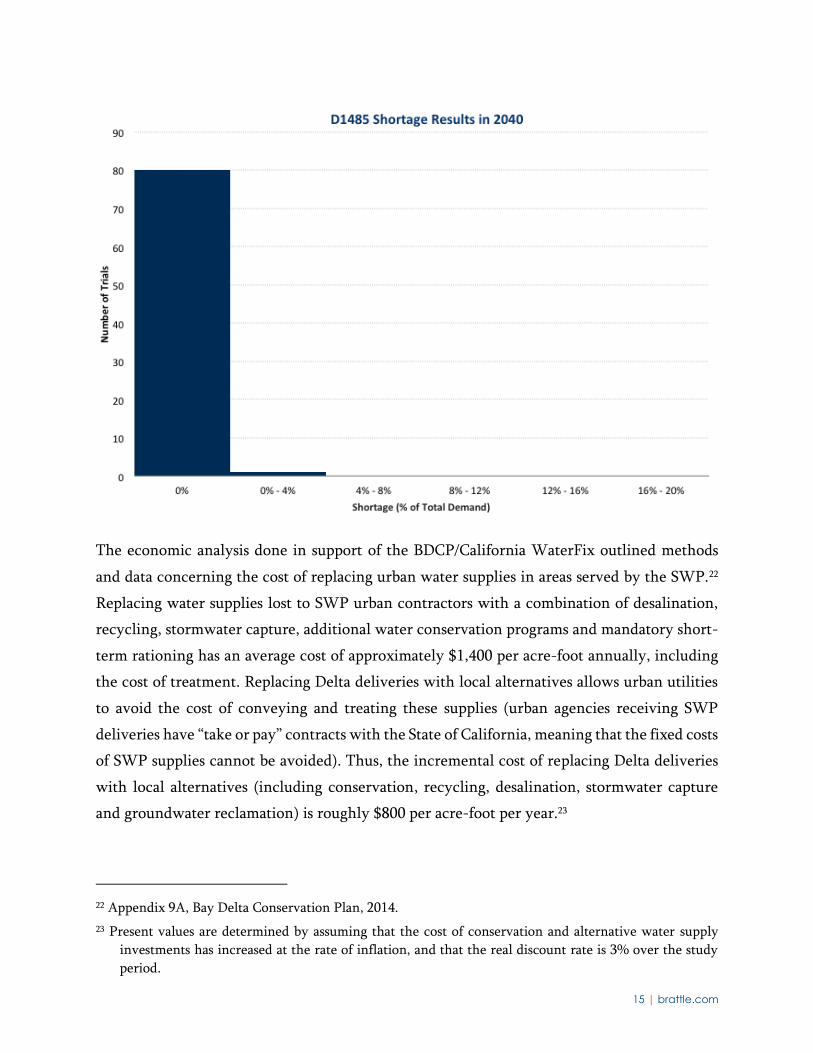
It is instructive to put these shortages into context. The following three figures show the
distribution of percent shortages for the year 2040 across wet and dry years. For example, the
first figure shows that for 2040 demand conditions and water supplies under the BiOps, there
are no forecasted shortages in the MWD service territory in nearly 70 percent of years.
However, shortages do occur in 30 percent of years, which is far larger than the current
frequency of shortages, with shortages reaching as large as 20 percent in the driest periods.
Percent shortages in 2040 are significantly smaller under D-1641 and D-1485.
14 | brattle.com
15 | brattle.com
The economic analysis done in support of the BDCP/California WaterFix outlined methods
and data concerning the cost of replacing urban water supplies in areas served by the SWP.22
Replacing water supplies lost to SWP urban contractors with a combination of desalination,
recycling, stormwater capture, additional water conservation programs and mandatory short-
term rationing has an average cost of approximately $1,400 per acre-foot annually, including
the cost of treatment. Replacing Delta deliveries with local alternatives allows urban utilities
to avoid the cost of conveying and treating these supplies (urban agencies receiving SWP
deliveries have “take or pay” contracts with the State of California, meaning that the fixed costs
of SWP supplies cannot be avoided). Thus, the incremental cost of replacing Delta deliveries
with local alternatives (including conservation, recycling, desalination, stormwater capture
and groundwater reclamation) is roughly $800 per acre-foot per year.23
22 Appendix 9A, Bay Delta Conservation Plan, 2014.
23 Present values are determined by assuming that the cost of conservation and alternative water supply
investments has increased at the rate of inflation, and that the real discount rate is 3% over the study
period.

16 | brattle.com
The results of the analysis indicate that urban water consumers in California have experienced
significant rate increases as a result of the move away from D-1485 and that these impacts will
continue into the future. Looking first at impacts that have already occurred, the imposition
of D-1641 followed by the BiOps has already resulted in additional ratepayer expenditures of
$5.7 billion in present value from 2000 through 2016. These expenditures result from a
combination of investments in local water supply alternatives and conservation efforts aimed
at reducing residential, multifamily and commercial/industrial water use.
Because SWP deliveries will continue to be affected by the BiOps, urban impacts persist into
the future. Over the period 2016 to 2050, urban consumers will spend an additional $10.1
billion replacing lost SWP supplies. This calculation assumes the same pattern of water supply
investments as in the past. If future water supply investments are valued at the cost of seawater
desalination (e.g., Carlsbad), then impacts would be significantly larger.
V. Fallowing and Farm Job Impacts
San Joaquin Valley agriculture is highly dependent on water supplies delivered from the Delta.
Accordingly, reductions in water deliveries caused by tighter standards in the Delta may result in
economic impacts to this region. This section of the report describes the methods used to calculate
impacts to harvested acreage and farm employment in the San Joaquin Valley, and implements
these methods to measure the incremental cost of moving from D-1485 to D-1641, and finally to
the BiOps.
The analysis rests on a statistical model of agriculture in the San Joaquin Valley that explains
historical patterns of planting and employment as a function of Delta water deliveries. The data
used in the statistical analysis are comprised of an annual panel data set covering the years 1980 to
2009. Counties in the analysis that receive irrigation water from either the CVP or SWP are the
following: Fresno, Kern, Kings, Merced, San Joaquin, Stanislaus and Tulare. As a control group to
capture the effects of macro-level changes in the agricultural economy, the analysis uses six
California counties that do not receive Delta water deliveries: Madera, Imperial, Monterey, Sutter,
Yolo and Yuba. The data period covered by the analysis evidences significant variation both in
employment and water deliveries. It also includes two of the largest droughts in the recent past
(1987-1992 and 2007-2009).

17 | brattle.com
County-level employment data are publicly available from the U.S. Bureau of Economic Analysis
(BEA).24 The data distinguish between direct farm employment, and total agricultural
employment. Direct farm employment includes anyone who works in the direct production of
agricultural commodities, including crops and livestock (SIC codes 01 – 02; NAICS code 111 -
112).25 Total agricultural employment is the sum of direct farm employment and employment in
the agricultural services sector (SIC code 07; NAICS code 113 - 115). The agricultural services
sector includes farm labor contractors.
Employment data from 1980 – 2000 are categorized in the Standard Industrial Classification (SIC)
system. In the 1990s, a new classification system (North American Industrial Classification System
(NAICS)) was introduced, in part to facilitate accounting under the North American Free Trade
Agreement. The SIC data series was discontinued in 2000. In that year, the BEA shifted to
reporting sectoral employment based on the SIC industry classification to reports based on the
NAICS classification. The BEA provides a concordance to match industry descriptions between
the two coding systems.26 As a control for year fixed effects in the preferred specification, if there
are year-to-year differences in employment that are due to the new classification, the method
controls for these differences.
Government water delivery data include both state deliveries from the SWP and CVP. The state
water delivery data come from the California Department of Water Resources’ Bulletin 132 and
24 Bureau of Economic Analysis, Regional Economic Accounts, Local Area Personal Income, Table CA25-
Total employment by industry, accessed at
http://www.bea.gov/regional/reis/default.cfm?selTable=CA25, June 1, 2011.
25 Bureau of Economic Analysis, Local Area Personal Income Methodology, Appendix: Concordance
between BEA industry descriptions and SIC codes, accessed at
http://www.bea.gov/regional/pdf/lapi2008/appendix.pdf, February 25, 2011.
26 Ibid.
Continued on next page

18 | brattle.com
the Kern County Water Agency.27 28 The federal water deliveries data are from the Bureau of
Reclamation.29 A Geographic Information System was employed to allocate water deliveries to
counties, first taking the intersection of the boundaries of each of the water districts and counties.
Then the acreage of the district-county intersection is divided by the acreage of each of the
districts. This ratio is multiplied by the water deliveries in each water district and the result is
then summed over the share of water deliveries in the district-county intersection over counties.
Thus, water deliveries are allocated to the county level according to the share of acres of each
water district that falls within each county.30 Annual deliveries are reported in acre-feet.
The data set also includes harvested acres by county. These data come from the Agricultural
Commissioners’ Offices of Fresno, Imperial, Kern, Kings, Madera, Merced, Monterey, San Joaquin,
Stanislaus, Sutter, Tulare, Yolo and Yuba counties for the years 1980 through 2009.31 The analysis
incorporates land allocated to a subset of crops: almonds, avocados, broccoli, cotton, grapes, hay,
lemons, lettuce, oranges, pistachios, rice, strawberries, tomatoes and walnuts. Harvested acreage is
more consistently defined for these individual crops than for total harvested acreage. For example,
some counties include rangeland in total area statistics in some years, but not in other years. The
crops in the analysis account for roughly two-thirds of total harvested acreage in the San Joaquin
Valley.
The effects of SWP and CVP deliveries on employment are estimated using a statistical model that
includes county and year fixed effects, using the data from 1980 - 2009 on the sample of the seven
27 California Department of Water Resources, State Water Project Analysis Office, Bulletin 132, Appendix
B. Years 1995-2007 accessed at: http://www.water.ca.gov/swpao/bulletin.cfm, July 21, 2009. Years 1973-
1994: PDF copies received via electronic communication with DWR, October 14, 2009. Years 2008-
2010: Microsoft Excel tables received via electronic communication with State Water Contractors,
February 24, 2011.
28 Kern County Water Agency, SWP Supply and Delivery Summary. Years 1970-2008, received via
electronic communication with KCWA, September 29, 2009. Year 2009 received via electronic
communication with KCWA on February 24, 2011.
29 US Bureau of Reclamation Mid-Pacific Region Central Valley Operations, Report of Operations Monthly
Delivery Tables. Years 1985-2009 accessed at: http://www.usbr.gov/mp/cvo/deliv.html, October 21,
2009. Years 1970-1984: PDF copies received via electronic communication with USBR, November 5,
2009.
30 Cal-Atlas Geospatial Clearing House, boundaries of “Federal,” “State” and “Private” water districts accessed
at: http://www.atlas.ca.gov/download.html, May 26, 2009. Boundaries of Counties obtained from ESRI
ArcGIS basemap layers.
31 Source: Various County Crop Reports.

19 | brattle.com
counties that receive Delta deliveries plus the set of control counties. For counties receiving Delta
water supplies, the estimated coefficient on deliveries is positive with a value of 0.00450, and is
significant at the 1% level. To put this estimated coefficient into perspective, it indicates that
reducing water deliveries by 222.22 acre-feet results in the loss of one farm job.
While this model does not formally test the mechanism of how changes in water deliveries
influence job losses, one would expect that acreage planted to crops would decrease if deliveries
are short, which would lead to lower labor requirements to service this smaller area. It is therefore
also important to test whether deliveries are correlated with total acreage cropped in the seven
counties in the sample receiving deliveries from the Delta.
There is a strong and statistically significant relationship between Delta exports and area harvested
in the SWP and CVP service areas. The model specifications are the same as those used in the
models explaining direct farm employment and total agricultural employment, only that the
dependent variable is total area harvested. The estimated coefficient on deliveries is 0.0797, which
is significantly different from 0 at the 1% level with clustered standard errors. This finding
suggests that a reduction in Delta deliveries of 12.55 acre-feet causes one additional acre to be
fallowed. Recall that the model is estimated based on plantings of a subset of crops accounting for
roughly two-thirds of total harvested acreage in the San Joaquin Valley. Accounting for the crops
not in the sample, and assuming the same acreage response to changes in water deliveries, it follows
that a reduction in water deliveries of around 8.37 acre-feet would result in an extra acre of total
fallowing.
To calculate the fallowing and lost jobs resulting from more stringent regulations, the estimated
coefficients of the statistical models for employment and harvested acreage are multiplied by the
change in agricultural water deliveries across regulatory scenarios forecasted using CALSIM II.
It is necessary to incorporate two types of grower responses when determining the economic
impacts of changes in Delta deliveries. First, reduced deliveries may lead to some degree of
fallowing. This response is captured in the econometric model described above. Second, reduced
deliveries may cause farmers to increase their groundwater pumping since groundwater and
surface water are substitutes. The number of acres fallowed as a result of the shift from D-1485 to
the BiOps is straightforward to estimate using the econometric results presented above.
Multiplying the change in Delta deliveries to agriculture by the estimated coefficient on harvested
acreage, it follows that over 55,000 acres have been fallowed on average in response to past changes
in deliveries. The remainder of the agricultural water supply loss is made up for by additional

20 | brattle.com
groundwater pumping. The unit cost of additional groundwater pumping varies throughout the
study area depending on depth to groundwater and is taken from the Statewide Agricultural
Production Model dataset.32
Taking this information together, the cost to San Joaquin Valley growers of moving from D-1485
to D-1641 to the BiOps has been $1 billion from 2000 to the present, measured as a present value
with a 3% real rate of interest and a 3% rate of inflation from 2000 to the present. 33 This cost
includes both the lost farm profit from fallowing plus the increase in farming cost due to
groundwater substitution.
Returning to impacts on farmworkers, once fallowing impacts are calculated, the econometric
results presented above can be used to determine the implicit impacts to farm jobs and worker
compensation. Comparing agricultural deliveries under D-1485 to those under the BiOps, the
econometric results presented above indicate that 3,150 workers have lost their jobs each year as
a result of more stringent regulations in the Delta, with a loss in worker compensation of over $900
million from 2000 to the present.34
In the coming years, agricultural production in the San Joaquin Valley is expected to become more
sensitive to reductions in Delta water supplies. Historically, many growers would increase
groundwater pumping in response to reduced surface water deliveries. Such a response to drought
and environmental regulation may not be possible in the future. The Sustainable Groundwater
Management Act (SGMA) requires California governments to form dozens of new agencies to
manage groundwater sustainably. The regulations implemented by these local agencies may
significantly limit farmers’ ability to extract groundwater in dry periods, meaning that reductions
in surface water deliveries would have to be accommodated by other types of responses, notably
increased fallowing.
Because local groundwater management plans have not yet been developed, it is not possible to
calculate precisely how much more sensitive to surface water reductions San Joaquin Valley
32 Appendix 9A, Bay Delta Conservation Plan, 2013.
33 Average annual CPI inflation from 1978 to 2016 is 3.69% according to the Bureau of Labor Statistics.
34 The worker compensation calculation incorporates the transition from D-1485 to D-1641 and then to the
BiOps.
Continued on next page
21 | brattle.com
agriculture will become. However, given that historically an acre-foot reduction in Delta deliveries
caused the fallowing of only 0.12 acres of farmland, and that the typical acre of farmland in the
San Joaquin Valley uses roughly 3 acre-feet of water, it is reasonable to expect that limiting
groundwater extraction in dry years could cause the impacts of reduced surface water deliveries to
increase by a factor of 3 to 4.35
To assess the potential future impacts of more restrictive water quality and species regulations in
the Delta, I assumed that SGMA would limit groundwater extraction to sustainable yield even in
dry years. In this circumstance, it is also reasonable to assume that fallowing resulting from reduced
Delta deliveries is 3.5 times its level at present. In this instance, the reduction in Delta deliveries
caused by a shift from D-1485 to the BiOps results in the fallowing of nearly 195,000 acres of
farmland in the San Joaquin Valley annually. Interestingly, this estimated amount of fallowing is
almost exactly enough to absorb the supply loss, indicating that the econometrically estimated
impact of supply variations on harvested area is reasonable.36
Assuming this implementation of SGMA, the present value of future farm income losses through
2050 is $2.0 billion, incorporating the costs of fallowing and residual groundwater pumping needed
to accommodate the reduction in Delta deliveries. Lost farm employment grows to over 11,000
jobs each year when groundwater pumping restrictions are accounted for. The present value of
lost farmworker compensation from the present to 2050 is $4.0 billion. This figure is large due to
the fact that groundwater pumping restrictions have the potential to significantly reduce the
amount of agricultural activity in the San Joaquin Valley. In the future, then, farmers will respond
to changes in Delta deliveries with more fallowing than has been the case in the past because
groundwater will no longer be an option.
San Joaquin Valley agriculture is linked with other sectors of the state’s economy. Thus, changes
in agricultural activity have effects that extend beyond this sector. Economists distinguish between
two types of “multiplier” effects of changes in production: indirect and induced effects. Farms
purchase goods and services from other California firms, which in turn use some portion of their
35 An acre of farmland in the San Joaquin Valley has an average irrigation requirement of 3-4 acre feet per
acre. If groundwater extraction is limited to sustainable yield in all types of water years, reductions in
surface water deliveries will have a proportional impact on acreage. 3.13=0.25/0.0797; 4.14=0.33/0.0797.
36 Or, 0.0797*3.5 ≈ 1/3.5.
Continued on next page

22 | brattle.com
earnings to purchase inputs from other local businesses. Similarly, farmers and their employees
spend part of their income locally – for housing, child care, entertainment and other household
needs.
Indirect and induced multipliers for San Joaquin Valley agriculture have been calculated by
researchers at the UC Davis Agricultural Issues Center using the standard IMPLAN model.37 The
multiplier for changes in San Joaquin Valley farm employee income is 2.19. This figure means that
every dollar change in farmworker compensation results in a total change in employee
compensation of $2.19. The corresponding multiplier for farm net income is 1.89. The IMPLAN
model also generates employment multipliers, which in the case of San Joaquin Valley crop
production is 1.93.
37 The Measure of California Agriculture, Agricultural Issues Center, UC Davis, 2009.
