economic and geographic access to food retailers and
TRANSCRIPT

Economic and Geographic Access to Food Retailers and Emergency Food PantriesContractor and Cooperator Report No. 76-2
June 2012
By David Jones and James Mabli, Mathematica Policy Research
Abstract
This study describes the environment in which low-income households acquire and purchase food by examining the local population characteristics of areas with and without emergency food pantries and by examining the loca-tions of food pantries in relation to the retail food environment. We found that emergency pantries are located in areas (census tracts) in which individuals have low socioeconomic status and where there is high demand for services that pantries offer. About 25 percent of high-poverty areas without a retail food store have at least one pantry compared with 15 percent in all areas. Among high-poverty areas without supermarkets or superstores, 41 percent have at least one pantry. The study also finds that areas with one or more retail stores are more likely to have one or more pantries. Among retail store types, the relationship is strongest for convenience stores. The percentage of areas with at least one pantry increases from 22 percent in areas with no convenience stores to 44 percent in areas with more than one convenience store—a 22 percentage point increase. For supermarkets and superstores, this increase is about 12 percentage points—from 28 percent in areas with no supermarkets or super-stores to 40 percent in areas with more than one store. Among areas with no stores, however, the percentage with at least one pantry is substantially higher in higher-poverty areas. Thus, while pantries and food retailers are located in similar areas, a sizable percentage of high-poverty areas with no stores have at least one pantry.
Keywords: Emergency food pantries, food access, food deserts, GIS, spatial analysis, FANRP
Aknowledgments
The authors would like to extend their gratitude to project manager Phil Kaufman of USDA’s Economic Research Service (ERS) for his guidance, review, and support. We received valuable input on methodology, presentation, and findings from four anonymous external reviewers and from USDA staff who attended a study briefing. Sev-eral Mathematica Policy Research staff made meaningful contributions to this research. Nancy Cole reviewed all study materials, Rosalie Malsberger provided computer programming support, Jeff Holt and Alice Anigacz helped to construct several data files, and Margaret Hallisey was responsible for the report production. Finally, valuable feedback and suggestions were received from Emily Engelhard, Feeding America.
This study was conducted under a cooperative research agreement with USDA’s Economic Research Service (ERS) Food and Nutrition Assistance Research Program (FANRP): agreement number 59-5000-0-0081 (ERS project representative: Phillip Kaufman). The views expressed are those of the authors and are not necessarily those of ERS or USDA.
Contract Number: 59-5000-0-0081
Mathematica Reference Number: 06818.500
Submitted to: USDA, ERS Food Economics Division 355 E Street, SW Washington, DC 20024-3221 Project Officer: Phil Kaufman
Submitted by: Mathematica Policy Research 955 Massachusetts Avenue Suite 801 Cambridge, MA 02139 Telephone: (617) 491-7900 Facsimile: (617) 491-8044 Project Director: James Mabli
Economic and Geographic Access
to Food Retailers and
Emergency Food Pantries
Final Report
February 20, 2012
David Jones James Mabli

Contents Mathematica Policy Research
iii
CONTENTS
EXECUTIVE SUMMARY .................................................................................... ix
I INTRODUCTION AND STUDY OVERVIEW ......................................................... 1
II DATA AND METHODOLOGY ........................................................................... 3
A. Data Sources ........................................................................................... 3
1. Store Tracking and Redemption System (STARS) 2009 ....................... 4 2. American Community Survey 2005–2009 .......................................... 4
B. Construction of Analysis File ................................................................... 5
1. Using Census Boundaries as the Unit of Observation ......................... 5 2. Mapping Addresses of Emergency Food Pantries and Retail
Food Establishments ......................................................................... 6 3. Defining Population Characteristics ................................................... 7 4. Combining Data Sources into the Final Analysis File .......................... 8
C. Methodology ........................................................................................... 9
1. Descriptive Analysis of Economic Access to Pantries .......................... 9 2. Multivariate Analysis of Economic Access to Pantries ......................... 9 3. Descriptive Analysis of Geographic Access to Pantries in
Relation to Retail Food Establishments ............................................ 10 4. Multivariate Analysis of Geographic Access to Pantries in
Relation to Retail Food Establishments ............................................ 10
III ECONOMIC ACCESS TO EMERGENCY FOOD PANTRIES ................................... 13
A. Introduction .......................................................................................... 13
B. Descriptive Analysis .............................................................................. 13
1. Distribution of Emergency Food Pantries ......................................... 13 2. Distribution of Emergency Food Pantries by Population
Demographics ................................................................................. 14
C. Multivariate Analysis .............................................................................. 18
1. General Model Findings ................................................................... 18 2. Findings in Model in Which Explanatory Variables Are
Defined Across Clusters of Census Tracts ........................................ 19 3. Findings in Models Accounting for Spatial Autocorrelation .............. 21
D. Summary of Findings ............................................................................. 24

Contents Mathematica Policy Research
iv
IV GEOGRAPHIC ACCESS TO EMERGENCY FOOD PANTRIES AND FOOD RETAILERS ................................................................................................... 25
A. Introduction .......................................................................................... 25
B. Descriptive Analysis .............................................................................. 25
C. Multivariate Analysis .............................................................................. 30
1. General Model Findings ................................................................... 30 2. Findings in Model Allowing Stores to Differ by Type ........................ 31 3. Findings in Model Estimated on Sample Restricted to
Highest-Poverty Quartile .................................................................. 32 4. Findings in Model in Which Explanatory Variables Are
Defined Across Clusters of Census Tracts ........................................ 33 5. Findings in Models Accounting for Spatial Autocorrelation .............. 34
D. Summary of Findings ............................................................................. 35
V CONCLUSION ............................................................................................... 37
A. Summary ............................................................................................... 37
B. Limitations of Study ............................................................................... 38
REFERENCES ................................................................................................. 39
APPENDIX A: GEOCODING METHODOLOGY ................................................... 41

List of Tables Mathematica Policy Research
v
TABLES
III.1 Distribution of the Number of Emergency Food Pantries, by Area Size and Metropolitan Status........................................................................ 14
III.2 Percentage of Census Tracts with One or More Emergency Food Pantries, by Population Characteristics and Metropolitan Status ................... 15
III.3 Percentage of Block Groups with One or More Emergency Food Pantries, by Population Characteristics and Metropolitan Status ................... 17
III.4 Percentage of Low Socioeconomic Status and High Minority Census Tracts with No Emergency Food Pantries and the Percentage of those Census Tracts with an Emergency Food Pantry in an Adjacent Census Tract ............................................................................................... 18
III.5 Associations of the Likelihood of a Census Tract Containing an Emergency Food Pantry with Population Characteristics, in Metropolitan Tracts ..................................................................................... 19
III.6 Associations of the Likelihood of a Census Tract Containing an Emergency Food Pantry with Population Characteristics, in Nonmetropolitan Tracts ............................................................................... 20
III.7 Associations of the Likelihood of a Census Tract Containing an Emergency Food Pantry with Population Characteristics of the Tract Including the Characteristics of All Surrounding Tracts, in Metropolitan Tracts ..................................................................................... 21
III.8 Associations of the Likelihood of a Census Tract Containing an Emergency Food Pantry with Population Characteristics of the Tract and the Characteristics of All Surrounding Tracts Specified as Separate Sets of Variables, in Metropolitan Tracts ........................................ 21
III.9 Associations of the Likelihood of a Census Tract Containing an Emergency Food Pantry with Population Characteristics Using a 25 Percent Random Sample, in Metropolitan Tracts .......................................... 23
III.10 Associations of the Likelihood of a Census Tract Containing an Emergency Food Pantry with Population Characteristics Using a 25 Percent Random Sample, in Nonmetropolitan Tracts .................................... 23
IV.1 Distribution of the Number of Retail Food Establishments, by Area Size and by Store Type................................................................................. 26
IV.2 Percentage of Census Tracts with at Least One Emergency Food Pantry per Census Tract, by the Number of Retail Food Establishments and Metropolitan Status ....................................................... 27

List of Tables Mathematica Policy Research
vi
IV.3 Percentage of Census Tracts with No Retail Stores (by Type) and at Least One Pantry .......................................................................................... 28
IV.4 Percentage of Census Tracts with No Retail Stores (by Type) and at Least One Pantry Among Census Tracts in the Highest Quartile of Poverty ........................................................................................................ 29
IV.5 Percentage of Census Tracts with No Retail Stores (by Type) and at Least One Pantry in the Census Tract or Adjacent Census Tracts, Among Census Tracts in the Highest Quartile of Poverty .............................. 29
IV.6 Associations of the Likelihood of a Census Tract Containing an Emergency Food Pantry with Access to Retail Food Establishments, in Metropolitan Tracts ................................................................................. 30
IV.7 Associations of the Likelihood of a Census Tract Containing an Emergency Food Pantry with Access to Retail Food Establishments, in Nonmetropolitan Tracts ........................................................................... 31
IV.8 Marginal Effects of an Additional Retail Food Establishment on the Likelihood of a Census Tract Containing an Emergency Food Pantry, by Metropolitan Status and by Whether Additional Retailer is First Retailer in the Tract ..................................................................................... 31
IV.9 Marginal Effects of an Additional Retail Food Establishment on the Likelihood of a Census Tract Containing an Emergency Food Pantry, by Metropolitan Status and by Store Type .................................................... 32
IV.10 Marginal Effects of an Additional Retail Food Establishment on the Likelihood of a Census Tract Containing an Emergency Food Pantry for Alternative Model Specifications, by Metropolitan Status ........................ 33
IV.11 Marginal Effects of an Additional Retail Food Establishment on the Likelihood of a Census Tract Containing an Emergency Food Pantry when Food Retailers are Measured over Clusters of Census Tracts, in Metropolitan Tracts ................................................................................. 34
IV.12 Marginal Effects of an Additional Retail Food Establishment on the likelihood of a Census Tract Containing an Emergency Food Pantry Using a 25 Percent Random Sample, by Metropolitan Status ........................ 34

vii
FIGURES
II.1 Calendar Year 2009 Percentage Distribution of SNAP Retailers ....................... 5
II.2 Locating Retail Food Establishments and Emergency Food Pantries on a Map of Census Tract Boundaries ............................................................ 7

This page has been left blank for double-sided copying.

Economic and Geographic Access to Food Retailers and Emergency Food Pantries Mathematica Policy Research
ix
EXECUTIVE SUMMARY
What Is the Issue?
Ensuring that Americans have adequate access to healthful, affordable food is an important policy goal. In the 2008 Farm Bill, the U.S. Congress directed the Economic Research Service (ERS), USDA to learn more about food access. ERS published a comprehensive review of published research, discussion of new empirical work, and accounting of the many methods and data used to examine food access limitations (ERS 2009). The report focused on physical access to food, which is measured by identifying places where a household can obtain food (such as supermarkets, grocery stores, and other food retailers) and how it can get to those places (such as by using public transportation, driving, or walking).
Access limitations are often characterized under the rubric of food deserts, defined in the 2008 Farm Bill as an area in the United States with limited access to affordable and nutritious food, particularly an area composed of predominantly lower-income neighborhoods and communities. Although ERS found that progress has been made in characterizing the problem of food deserts and describing their consequences for affected populations, it concluded that many aspects of food access are not well defined or understood (USDA 2009). Additional work is needed to identify appropriate measures of food access and to understand the causes and consequences of limited access.
Prior food access studies have focused on the retail food environment; however, it is important to also account for emergency food programs. This study contributes to a more comprehensive understanding of the environment in which low income households acquire and purchase food by examining access to emergency food pantries. Food pantries make up the majority of the three main types of emergency programs (pantries, soup kitchens, and emergency shelters) to which local food banks distribute food. The number of households acquiring food from pantries is at an all-time high and the number of pantries is also at record levels (Mabli et al. 2010).
This study has two research objectives. First, it describes households’ access to emergency food pantries by examining the local population characteristics of areas with and without pantries. Second, it examines the locations of emergency food pantries in relation to the retail food environment.
What Did the Study Find?
Emergency pantries are located in areas (census tracts) in which individuals have low socioeconomic status (higher percentages of families in poverty, individuals with at most a high school education, and female-headed households with children), where there are likely to be high numbers of residents that demand the services that pantries offer. In metropolitan areas, pantry location in a census tract is most strongly related with the percentage of population in poverty, followed by the percentage of the population completing at most high school, and the percentage of households that are headed by females and that have children. These relationships hold in nonmetropolitan areas, with the exception of education which is weak and not statistically significant.

Economic and Geographic Access to Food Retailers and Emergency Food Pantries Mathematica Policy Research
x
There is a strong positive relationship between the number of pantries and the number of retail food establishments in an area. Areas with one or more retail stores are more likely to have one or more pantries. About 15 percent of census tracts with no stores have at least one pantry, compared with 23 percent in areas with one store and 29 percent in areas with multiple stores. The relationship is consistent in metropolitan and nonmetropolitan areas, but is stronger in nonmetropolitan areas.
The relationship between the number of pantries and the number of food retailers in a census tract is consistent for all store types (including supermarkets and superstores; large, medium, and small groceries; convenience stores; specialty stores). It is strongest for convenience stores, where the difference in the percentage of areas with at least one pantry increases from 22 percent in areas with no convenience stores to 44 percent in areas with more than one convenience store—a 22 percentage point difference. For supermarkets and superstores, this difference is about 12 percentage points, increasing from 28 percent in areas with no supermarkets or superstores to 40 percent in areas with more than one store.
Among areas with no stores, the percentage with at least one pantry is higher in higher-poverty areas. About 25 percent of high-poverty areas without stores have at least one pantry compared with 15 percent in all areas. Among high-poverty areas without supermarkets or superstores, 41 percent have at least one pantry. Thus, while pantries and food retailers are located in similar areas, there are a sizable percentage of high-poverty areas with no stores that have at least one pantry.
Figure 1 summarizes these results by displaying the locations of retail food stores and emergency food pantries in the contiguous U.S. by census tract. Census tracts that are not shaded contain no retail food stores and no emergency food pantries; areas that are shaded grey contain at least one retail food store, but no pantries; areas that are shaded yellow contain at least one retail store and at least one pantry; and areas that are shaded red contain at least one pantry, but no retail stores. The large proportion of yellow areas among all areas shaded yellow or red indicates that emergency food pantries are located predominantly in the same areas as retail food establishments. This descriptive finding was supported by a multivariate statistical analysis that accounted for differences across census tracts in population and area size. In addition, the nontrivial proportion of red areas among all areas shaded red or not shaded indicates that pantries provide food access to many low-income households in areas where there are no stores.

Economic and Geographic Access to Food Retailers and Emergency Food Pantries Mathematica Policy Research
xi
Figure 1. Locations of Retail Food Establishments and Emergency Food Pantries
Source: Hunger in America 2009; Store Traffic and Redemption System 2009; American Community Survey 2005 to 2009
Note: Census tracts serve as the geographic unit of observation in the map. Census tracts are the largest geographic boundaries defined by the U.S. Census Bureau and generally contain 1,500 to 8,000 people and a target size of 4,000. They are drawn to encompass similar population sizes and, thus, vary in spatial size depending on whether they are in a metropolitan or nonmetropolitan area.
How Was the Study Conducted?
Data for this study come from three main sources: (1) the 2009 Hunger in America (HIA) survey of emergency food clients and emergency food programs, conducted between February and May 2009 by Mathematica Policy Research for Feeding America; (2) the 2009 Store Tracking and Redemption System (STARS) national database of retailers authorized to accept Supplemental Nutrition Assistance Program (SNAP) benefits; and (3) the 2005–2009 American Community Survey (ACS) U.S. Census Bureau geographic boundaries and population characteristics summary files. Street address information for pantries came from the HIA survey, while street address information for SNAP-authorized food retailers came from the STARS database. The U.S. Census Bureau boundary files were used to define areas for measuring food access; the corresponding ACS data files provided the population characteristics of those areas.

Economic and Geographic Access to Food Retailers and Emergency Food Pantries Mathematica Policy Research
xii
We use census tracts as the unit of observation for most of the analysis after examining the distribution of emergency food pantries and retail food establishments in areas of different geographic sizes (block groups, tracts, groups of tracts, and counties). To generate a map of all emergency food pantries and retail food establishments, we geo-coded street addresses of emergency food pantries and retail food establishments in 47 states and the District of Columbia. A census tract analysis file was constructed by counting the number of emergency food pantries and the number of retail food establishments in each area (by store type) and assigning population characteristics from the ACS to each area using a unique census tract identifier.
This report includes descriptive and multivariate analyses. Descriptive analyses examine the distributions of emergency food pantries and retail food establishments, and the percentage of areas without stores that have at least one pantry. Multivariate logistic regression models are used to estimate (1) the local population characteristics associated with an area containing a pantry, and (2) the association between an additional retail food establishment in the area and the likelihood that the area contains an emergency food pantry. The econometric models were re-estimated to test the sensitivity of the findings to various subgroups of the population (such as areas with the highest levels of poverty) and to geographic assumptions in the model (such as spatial autocorrelation).

Economic and Geographic Access to Food Retailers and Emergency Food Pantries Mathematica Policy Research
1
I. INTRODUCTION AND STUDY OVERVIEW
Characteristics of the retail food environment are critical in determining individuals’ access to affordable and nutritious food. Key characteristics include the locations of various store types (supermarkets, grocery stores, and other food retailers) in relation to where individuals live and work, the types and prices of food each store offers, and the availability of various means of transportation. The Economic Research Service (ERS) of the USDA has examined the extent of access limitations through a comprehensive review of related research as well as its own empirical work (USDA 2009). Much of this research examines access to supermarkets or large grocery stores, where the price of healthy food is often lowest. There is also a focus on food deserts, defined in the 2008 Farm Bill as an area in the United States with limited access to affordable and nutritious food, particularly such an area composed of predominantly lower income neighborhoods and communities.
While ERS stated in the review that progress has been made in characterizing the problem of food deserts and in describing their consequences for affected populations, it concluded that the many aspects of food access are not well defined or understood. Additional work is needed to identify appropriate measures of food access, and to understand the causes and consequences of limited access.
In particular, prior studies of food access have focused on the retail food environment, but little attention has been paid to the role of emergency food programs, such as food pantries, soup kitchens, and shelters, and nonemergency food programs, such as senior congregate feeding programs and child day care centers. For example, where are these programs located relative to other food environment resources? Are these programs more prevalent in areas with very low levels of retail access, such as food deserts? Mabli et al. (2010) document that the number of low-income households receiving food from emergency food programs is at an all-time high, with 37 million different people having received emergency food in 2009, up 46 percent from 2005.1 The number of emergency food programs also increased significantly between 2005 and 2009. The size and breadth of this emergency food network, and clients’ increased usage, together underscore the importance of taking these programs into account when examining the extent of food access limitations.
This study characterizes access to emergency food pantries, which make up the majority of the three main types of emergency programs (pantries, soup kitchens, and emergency shelters) to which local food banks distribute food. The study has two research objectives. First, it describes the local population characteristics of areas with and without pantries. This descriptive work tells us about the economic circumstances of households with and without access to emergency food pantries, which we refer to as economic access. Economic access in this study is defined as a household’s ability to acquire and purchase food based primarily on income and vehicle access. We extend the definition to include observed correlates of economic access, such as education, race and ethnicity, and household composition in order to more specifically characterize local populations. Second, this study examines geographic access to emergency food pantries in relation to the retail food
1 Statistics are based on surveys of households receiving food from a network of emergency food providers operated by Feeding America, the largest charitable food organization in the country. Its network contains more than 80 percent of the nation’s food banks.

Economic and Geographic Access to Food Retailers and Emergency Food Pantries Mathematica Policy Research
2
environment. The findings from this study contribute to developing a more comprehensive understanding of the environment in which low income households acquire and purchase food.
The analysis file for this study was constructed using three main data sources: (1) the 2009 Hunger in America (HIA) survey of emergency food programs, (2) the 2009 Store Tracking and Redemption System (STARS) national database of SNAP-authorized retailers, and (3) the 2005-2009 American Community Survey (ACS) U.S. Census Bureau geographic boundaries and population characteristics summary file. Emergency food program locations were obtained from the HIA survey, while the locations of retail food establishments were obtained from the STARS database. The U.S. Census Bureau boundary files were used to define the unit of observation in the analyses, and the corresponding ACS data files provided the population characteristics for each of the boundaries.
We describe these data sources, the construction of the analysis file, and the study’s methodology in Chapter II. We present analysis findings for the study of pantry locations and population characteristics in Chapter III and the study of geographic access in Chapter IV. In Chapter V we summarize the results and discuss limitations of the study.

Economic and Geographic Access to Food Retailers and Emergency Food Pantries Mathematica Policy Research
3
II. DATA AND METHODOLOGY
This chapter describes the sample for each of the data sources and how they were used to construct an analysis file. It also describes the descriptive and multivariate analyses presented in subsequent chapters.
A. Data Sources
Three data sources were used to create the analysis file: (1) the 2009 Hunger in America (HIA) survey of emergency food programs, (2) the 2009 Store Tracking and Redemption System (STARS) national database of SNAP-authorized retailers, and (3) the 2005-2009 American Community Survey (ACS) U.S. Census Bureau geographic boundaries and population characteristics summary file.
HIA 2009 is a survey of emergency food clients and emergency food programs, conducted between February and May 2009 by Mathematica Policy Research for Feeding America. The 2009 HIA data consist of program- and client-level data from 185 food banks in the United States covering all or part of 47 states and the District of Columbia.2 Connecticut, Oregon, and Montana, as well as select counties in various states, were not represented by participating food banks in the survey.
Each food bank provided the locations (street address and zip code) and the type of program (pantry, kitchen, or shelter) for all emergency food programs and nonemergency food programs to which they distribute food. The first step in constructing an analysis file for this study was to compile a list of emergency and nonemergency food programs. We later use this list to measure access to emergency food. Next, we excluded all nonemergency programs. These programs have a primary purpose other than emergency food distribution, though they also distribute food. Examples include day care programs, senior congregate feeding programs, and summer camps.
Out of the three types of emergency food programs (pantries, kitchens, and shelters), we focused only on emergency food pantries. This is because only emergency food pantries offer food in a similar form (such as a bag of groceries) to that which supermarkets, groceries, and other stores provide. Pantries are also the most common program, making up about 71 percent of all emergency food programs in the Feeding America network. Finally, analyses of the overlap between federal food assistance and private food assistance have focused almost exclusively on pantry food use.3
The final step in constructing the list of emergency food pantries was to remove duplicate entries, invalid addresses, and pantries with incomplete address information, giving us a final set of
2 These data include food rescue organizations, as well. These are nonprofit organizations that obtain mainly
prepared and perishable food products from groceries, farmers, warehouses and distributors, as well as from food service organizations, such as restaurants, hospitals, caterers, and cafeterias, and distribute to agencies that serve clients. In 2009, there were 205 food banks in the Feeding America network. These make up most of the food banks in the country.
3 Several examples include Duffy et al. (2007); Bhattarai et al. (2005); Bartfeld (2003); and Daponte (2000).

Economic and Geographic Access to Food Retailers and Emergency Food Pantries Mathematica Policy Research
4
28,812 unique emergency food pantries.4 We geocoded the addresses for this set of pantries and defined food access measures. The construction of these measures is described in more detail later in this chapter.
1. Store Tracking and Redemption System (STARS) 2009
STARS is the national database of SNAP-authorized retailers, maintained by USDA, Food and Nutrition Service (FNS). FNS uses STARS for retailer authorization, monitoring, and investigation. The file used for this study contains records for nearly 200,000 SNAP-authorized retailers authorized at any time during calendar year 2009. The retailer information originates in the SNAP retailer application process and includes firm name, type, location, and monthly SNAP redemptions. For this study we used only the firm type and location. Firm type includes 27 categories and was self-reported by retailers until 2009, when FNS began coding this item to ensure consistency. Firm types include retailers (supermarkets and superstores; small, medium-size, and large grocery stores; specialty stores; convenience stores; farmers’ markets, and so on) and meal services (meal delivery services; homeless services; and treatment facilities).
Figure II.1 presents the distribution of store types. Supermarkets or superstores make up 18.6 percent of all SNAP retailers, while large, medium, and small grocery stores make up 1.8, 5.6, and 8.5 percent, respectively. Convenience stores make up the largest percentage (34.4 percent). The remaining stores are grouped into two types: specialty food stores (stores selling specialty items such as baked goods or bread; fruits or vegetables; meat or poultry products; or seafood products) and other outlets (combination grocery/other stores, delivery routes, farmers’ markets, nonprofit food buying cooperatives, wholesalers, or meal service providers). Specialty food stores make up 6.5 percent of retailers, and other outlets make up 24.6 percent.
2. American Community Survey 2005–2009
Five-year data from the ACS were used to obtain local-area population characteristics for several census geographies. To obtain characteristics for small census geographies, such as census block groups and tracts, the Census Bureau aggregated data over five years (2005 to 2009). These data contain population characteristics for 2005 to 2009 for all census tracts in the United States. Section C discusses the ACS variables used in the analyses.
4 The 28,812 pantries do not include all pantries in the Feeding America network. For example, it does not reflect
pantries operated by agencies that chose not to participate in the Hunger in America survey. In addition, this excludes mobile pantries that distribute food to clients using a dry or refrigerated vehicle in an organized format managed either by a food bank or agency staff.

Economic and Geographic Access to Food Retailers and Emergency Food Pantries Mathematica Policy Research
5
Figure II.1. Calendar Year 2009 Percentage Distribution of SNAP Retailers
Source: STARS 2009 data.
Notes: “Specialty food stores” comprise stores classified as selling one of the following specialized items: baked goods/bread, fruits/vegetables, meat/poultry products, or seafood products.
“Other outlets” comprise stores classified as a combination grocery/other store, delivery route, farmers’ market, nonprofit food buying cooperative, wholesaler, or meal service provider.
Data excludes stores located in Oregon, Montana, Connecticut, Guam, and the Virgin Islands and stores with incomplete street address information.
B. Construction of Analysis File
We constructed an analysis file to include stores and pantries, and the population characteristics of the areas where they are located. We first identified the locations of pantries and food retailers using address information. Using census tract and block group boundaries, we counted the number of pantries and food retailers in those areas. We also obtained data on the characteristics of the population living in those areas. We then combined the three data sources (pantries, food retailers, local population characteristics) into a final analysis file. In this section we summarize the construction of the analysis file, describe the areas used as the unit of analysis, and define all key variables.
1. Using Census Boundaries as the Unit of Observation
We use census block groups and census tracts to define geographic units of observation. We also use clusters of census tracts and counties to test the sensitivity of the results to the use of areas of varying size.
Census tracts are geographic boundaries developed by the U.S. Census Bureau. They are drawn to encompass similar population sizes and, thus, vary in spatial size depending on whether they are
18.6
1.8
5.6
8.5
34.4
6.5
24.6
0.0
5.0
10.0
15.0
20.0
25.0
30.0
35.0
40.0
Supermarket or
Superstore
Large Grocery Store
Medium Grocery Store
Small Grocery Store
Convenience Store
Specialty Store
Other Outlets
Perc
en
tag
e

Economic and Geographic Access to Food Retailers and Emergency Food Pantries Mathematica Policy Research
6
in a metropolitan or nonmetropolitan area. Census tracts are the largest geographies defined by the Census Bureau and generally contain 1,500 to 8,000 people and a target size of 4,000. Because the population characteristics in the ACS 2005-2009 summary data file are defined using the 2000 census tract boundaries, we used the same 2000 version of the boundaries for our analysis. In 2000, the United States was divided into more than 60,000 census tracts.
Block groups are necessarily equal to or smaller than census tracts in size. Block groups generally contain 600 to 3,000 people, with a target size of 1,500 people. Census tracts comprise one or more block groups, and block groups are aligned with census tracts such that they are contained entirely within the census tract boundary. Following the identical procedure used to construct the final census tract analysis file, we constructed an analysis file in which the unit of observation was the block group. In 2000, the United States was divided into more than 200,000 census tracts.
There are roughly 60,000 census tracts and 200,000 block groups in the U.S. but only just over 3,100 counties. On average, counties contain 20 census tracts and 65 block groups. Although census tract and block group boundaries are drawn to comprise targeted population sizes, the boundaries are also drawn to align with county boundaries. In other words, census boundaries never cross county boundaries and counties are comprised of a set number of census tracts and block groups.
An alternative to using census boundaries is to use equally sized grid cells. USDA (2009), for example, used one-square-kilometer grid cells from the Socioeconomic Data and Applications Center (SEDAC) to examine food access. Defining areas using census boundaries has several advantages over using grid cells, however. First, the most recent population characteristics attached to the SEDAC grid cells are taken from the 2000 Census; we have linked census tract to the 2005-2009 ACS data. Second, the population characteristics are limited to the handful of variables offered by SEDAC. By using census tract boundaries, we selected population characteristics from the entire set of variables included in the ACS. Third, census tract boundaries are drawn to equalize population, which is an important consideration when defining measures of access in a defined area (we discuss this later in the report). Last, using census tracts makes the analytic findings more widely accessible, as many researchers and policymakers are accustomed to thinking in terms of census boundaries rather than grid cells.
2. Mapping Addresses of Emergency Food Pantries and Retail Food Establishments
To construct the food access measures, we began with the 28,812 unique pantries in the HIA data file and located each pantry to the appropriate point on the map. We located the pantries using the geocoding tool in version 10 of ESRI’s ArcMap software. This process converted the address information contained in the HIA data to latitude and longitude coordinates and stored them in a newly created file. Pantries that either did not match to a point on a map or offered a post office box address in place of a street address were matched to the population-weighted centroid of their zip codes. The centroids represent the center of the population for the zip code and therefore, approximate the most likely location of the pantry within the zip code. We located 24,256 of the 28,812 pantries with their street location on a map (roughly 85 percent). The remaining 4,556 unmatched addresses and post office boxes were located with their zip code centroids. Appendix A describes the geocoding process for pantries; match rates are presented in Table A.1.
We located each SNAP food retailer to a point on the map by applying the same methodology used in locating the pantries. After omitting six records with incomplete street address information and establishments in counties, states, and territories for which we did not have HIA data (this

Economic and Geographic Access to Food Retailers and Emergency Food Pantries Mathematica Policy Research
7
consists of Connecticut, Oregon, Montana; Guam and the Virgin Islands; and select counties in various states), the final file contained 176,180 retail food establishments. We located 97 percent of stores to their street location on a map and located the remaining 3 percent of unmatched addresses with their zip code centroids. Appendix A details the geocoding process for retail food establishments and summarizes the match rates.
The final step was to use a tool in ArcMap (spatial join) that summed the number of pantries in each block group, census tract, and census tract cluster. Analogously, we counted the number of food retailers, both overall and by store type, in each geographic area.
Figure II.2 provides an example of the mapping process taken from actual data. First, we mapped the locations of the pantries, represented in the figure by stars. Next, we mapped the locations of food retailers, represented in the figure by small squares, and overlaid the food retailer map with the map of pantries. Next, we added the census tract boundaries, represented in the figure by lines, and overlaid these boundaries (with corresponding population characteristics) onto the map of retailers and pantries. The last step was to count the number of pantries and retail food establishments in each tract and store them on a data file in which each observation corresponds to a census tract. We then repeated these steps for block groups, counties, and clusters of tracts.
Figure II.2. Locating Retail Food Establishments and Emergency Food Pantries on a Map of Census Tract Boundaries
Source: Hunger in America 2009; STARS 2009; ACS 2005 to 2009
3. Defining Population Characteristics
We used the 2005 to 2009 ACS summary files to obtain a set of population characteristics for each geographic unit of analysis. Because the ACS reports at the block group and tract levels, no

Economic and Geographic Access to Food Retailers and Emergency Food Pantries Mathematica Policy Research
8
additional work was required to define the variables at these geographic units. We defined a set of variables for each block group and tract intended to capture the socioeconomic conditions of the local areas. We chose variables that are likely to be related to numbers of pantries and food retailers in an area:
• Total population
• Total geographic area
• Percentage of families with income below 200 percent of federal poverty threshold
• Percentage of total population that is non-white
• Percentage of total population that is Hispanic
• Percentage of population over 25 years of age that has, at most, completed high school
• Percentage of female-headed households with children
• Percentage of housing units without access to a vehicle
In much of the analytic work, we divide the sample by whether the census tract was in a metropolitan or nonmetropolitan area. These descriptors are defined for each block group and tract according to the June 2003 Office of Management and Budget (OMB) urban/rural continuum codes for the counties in which they are located. Metropolitan/nonmetropolitan counties are identified according to the OMB definitions outlined on the ERS website.5 Metropolitan counties have codes between 1 and 3, and nonmetropolitan counties have codes between 4 and 9. In the analysis file, roughly 80 percent of the census tracts were in metropolitan counties.
4. Combining Data Sources into the Final Analysis File
The final step in creating the analysis file was to combine the number of pantries in each census tract, the number of retail food establishments (overall and by store type) in each tract, and the population characteristics of each tract. (We repeat this procedure for block groups, as well). We performed a basic merge using the unique census tract identifiers defined by the U.S. Census Bureau. The number of census tract observations in the final analysis file was 58,601, 89.7 percent of all tracts in the United States, representing all or part of 47 states and Washington, DC. (The block group level file contained 187,256 block group observations, 91.0 percent of all block groups in the United States, also representing all or part of the 47 states and Washington, D.C.) Table A.3 in Appendix A presents this information in more detail.
5 http://www.ers.usda.gov/briefing/rurality/ruralurbcon/

Economic and Geographic Access to Food Retailers and Emergency Food Pantries Mathematica Policy Research
9
C. Methodology
In this section we describe the methodology used for the descriptive and multivariate analyses that are presented in Chapters III and IV.
1. Descriptive Analysis of Economic Access to Pantries
We use three descriptive analyses to characterize pantry locations. First, we estimate the distribution of the number of pantries per area – overall, and for metropolitan and non metropolitan areas. This analysis uses four alternate definitions of geographic area: block group, census tract, census tract cluster, and county. We estimated the percentage of areas with at least one pantry as well as the mean, median, and standard deviation of the number of pantries in areas with at least one pantry.
Next, we examined how these distributions vary by the characteristics of the local population. We categorized the population characteristics by quartiles, where quartile 1 includes the areas with the lowest 25 percent of values for a given characteristic. For example, quartile 1 for the percentage of families below 200 percent of the federal poverty threshold represents the areas with the lowest levels of poverty. Conversely, quartile 4 includes the areas with the highest levels of poverty.
We also examined the relationship between the number of pantries and the population characteristics of the larger surrounding areas. That is, we maintained the count of pantries at the census tract level, but defined the population characteristics over a larger area surrounding each of the census tracts. The purpose of this analysis was to examine whether the characteristics of areas outside of the census tract are also related to the number of pantries in the area.
2. Multivariate Analysis of Economic Access to Pantries
We also conducted a multivariate analysis to examine the relationships between pantry location and population characteristics. Because a large percentage of census tracts have no pantries, we use a logistic regression model to examine the likelihood that a pantry is located in an area. In addition to estimating a general specification, we estimated several alternative specifications to test the sensitivity of the model to various specification changes. For each model, we calculated the marginal effect of changing a population characteristic by one unit (such as an increase in the percentage of households in the area without access to a vehicle of one percentage point) on the likelihood of having a pantry in the area.
The first type of sensitivity analysis expanded upon the analyses conducted in the descriptive section to determine how the characteristics of surrounding areas influence the results. We included characteristics of the larger areas surrounding the census tracts (census tract clusters) as covariates to determine whether an association exists between characteristics of the larger region and the likelihood of a pantry.
The second type of sensitivity analysis addresses potential spatial autocorrelation. Spatial autocorrelation occurs when the error terms between observations (in other words, geographic areas) are correlated due to some unobserved factors that are related across regions (Wooldridge 2002). For example, particularly poor economic conditions in a region that influence access to pantry locations will be reflected in the error terms if they are unobserved or omitted from the specifications, causing the error terms for all census tracts in the area to be correlated. Spatial

Economic and Geographic Access to Food Retailers and Emergency Food Pantries Mathematica Policy Research
10
autocorrelation can be positive or negative (although most often it is positive), meaning that geographies in the same area can be more or less likely to share similar characteristics. In our analysis, the correlation is likely to be positive because the census boundaries are not typically drawn around any meaningful boundaries that might cause adjacent areas to be less alike, such as state borders or school districts. On the other hand, spatial correlation might be negative, especially in metropolitan areas where tracts are smaller, because the presence of a pantry in one tract might provide adequate access in surrounding tracts, thus reducing the need for pantries in those tracts.
Our general specification may suffer from some degree of spatial autocorrelation. Correlations between areas tend to be greater as the distance between them decreases. Because we are estimating the model on a sample of census boundaries that represents the entire nation with no space in between (with the exception of counties covered by nonparticipating food banks), each of our observations will be adjacent to other observations in the analysis file. If unaccounted for, spatial autocorrelation results in standard errors that are underestimated by the regressions. To account for spatial autocorrelation, we present regression results for a 25 percent random subsample. The subsample minimizes spatial autocorrelation by increasing the distance between census tracts as the sample size decreases.
3. Descriptive Analysis of Geographic Access to Pantries in Relation to Retail Food Establishments
The central question for this analysis is where are pantries located in relation to food retailers? We examined the distribution of the number of pantries per geographic area, relative to the number of food retailers in the area. To do this, we categorized areas by the number of stores (zero, one, and more than one store) and tabulated the number of pantries per area by these categories. This information tells us, for example, whether pantry access is greater in areas with stores and greater still in areas with multiple stores. We also reported the distribution of pantries by the distribution of stores by store type (supermarkets and superstores, large and medium groceries, small groceries, convenience stores, specialty food stores, and other stores) and by poverty quartile of the local area.
4. Multivariate Analysis of Geographic Access to Pantries in Relation to Retail Food Establishments
Pantries and food retailers may be located in proximity because both locate near population centers. Therefore, we account for area population and geographic size when assessing the relationship between pantries and food retailer locations. We estimated a logistic regression model of whether an area contains a pantry. The main explanatory variable of interest was the number of retail food establishments in each census tract (or block group). In addition to estimating a general specification, we estimated several alternative specifications to test the sensitivity of the model to various specification changes. For each model, we calculated the marginal effect of increasing the number of food retailers in an area on the likelihood of having a pantry in the area.
In the first alternative model specification, we re-estimated the model for areas in the highest quartile of poverty. This was measured using distribution of the percentage of households with income below 200 percent of the federal poverty threshold.
In the second alternative model specification, we replaced the number of food retailers with individual variables denoting the number of each of the six store types (using the same definitions as

Economic and Geographic Access to Food Retailers and Emergency Food Pantries Mathematica Policy Research
11
in the descriptive analysis). We calculated the marginal change in the likelihood of having a pantry in an area associated with an increase in the number of each store type.
As a third model specification, we expanded upon the sensitivity analyses conducted in the descriptive section to determine how the characteristics of surrounding areas influence the results. Specifically, we included characteristics of the larger areas surrounding the census tracts (census tract clusters) to determine whether an association exists between characteristics of the larger region and the likelihood of a pantry.
The fourth type of model specification attempts to address spatial autocorrelation and is similar to the spatial autocorrelation regressions in the analysis of economic access to pantries described in the previous section. To account for spatial autocorrelation, we generated regression results for a 25 percent random subsample. The subsample minimizes spatial autocorrelation by increasing the distance between census tracts as the sample size decreases.

This page has been left blank for double-sided copying.

Economic and Geographic Access to Food Retailers and Emergency Food Pantries Mathematica Policy Research
13
III. ECONOMIC ACCESS TO EMERGENCY FOOD PANTRIES
A. Introduction
This chapter describes households’ economic access to emergency food pantries by examining the local population characteristics of areas with and without pantries. We define economic access not only using area measures of household poverty and household resources such as vehicle access, but also using area measures of socioeconomic status based on education, race, ethnicity, and female household headship. We begin by presenting descriptive statistics of distributions of pantries for various geographic units of observation and for areas denoted by different local population characteristics. Next, we present results from a multivariate analysis estimating the relationship between the likelihood that an area contains a pantry and local population measures of poverty, education level, vehicle access, race, ethnicity, and female household headship.
B. Descriptive Analysis
We present the results of the descriptive analyses in two parts: the distribution of pantries by different geographic units of observation and the distribution of pantries for areas with specific population characteristics.
1. Distribution of Emergency Food Pantries
About 12.1 percent of block groups have at least one pantry, compared with 31.3 percent of census tracts (Table III.1). Among areas with at least one pantry, the average number of pantries in block groups is 1.3, about 16 percent lower than the average for census tracts, 1.5. In addition, among areas with at least one pantry, more than 50 percent of block groups and tracts have exactly one pantry, illustrated by a median value of one.
We also examined the distribution of pantries by cluster of census tracts and by county, as a point of comparison to illustrate the relatively small size of block groups and census tracts. A census tract cluster consists of the core census tract and all adjacent tracts. About 80.2 percent of census tract clusters have at least one pantry and among clusters with at least one pantry, the average is more than 4 pantries, compared with one to two pantries in block groups or tracts (Table III.1). Among counties with at least one pantry, the average is more than 11 pantries and is five times higher in metropolitan counties than in nonmetropolitan counties. This difference is much smaller at the block group and tract levels.
The information in Table III.1 helped to inform the final decision to use census tracts as the unit of observation for the descriptive and multivariate analyses. Because there is a larger percentage of areas with zero pantries at the block group level than at the census tract level, there is less variation in the dependent variable when using block group level data. Block groups appear to be too small to define an area of access for pantries given that there are nearly 30,000 pantries in our analysis file and only about 12 percent of block groups contain at least one pantry. In deciding which geography to use as the unit of observation, we attempted to ensure the geographic unit of observation was large enough to contain pantries that can be accessed by the local population but excluded pantries that are out of reach. The next steps in the descriptive analysis, the number of pantries by population characteristics, provide additional evidence to support this decision.

Economic and Geographic Access to Food Retailers and Emergency Food Pantries Mathematica Policy Research
14
Table III.1. Distribution of the Number of Emergency Food Pantries, by Area Size and Metropolitan Status
Percentage of Areas with at
Least One Emergency
Food Pantries
Number of Pantries Among Areas with at Least One Emergency Food Pantry:
Mean Median Standard Deviation
All Observations Block Group 12.1 1.3 1.0 0.7 Census Tract 31.3 1.5 1.0 1.1 Census Tract Cluster 80.2 4.2 3.0 3.8 County 86.8 11.3 4.0 27.0
Metropolitan Areas Block Group 11.8 1.3 1.0 0.7 Census Tract 29.8 1.6 1.0 1.1 Census Tract Cluster 80.6 4.2 3.0 3.9 County 96.6 23.0 9.0 40.5
Nonmetropolitan Areas Block Group 13.5 1.2 1.0 0.6 Census Tract 37.8 1.5 1.0 0.9 Census Tract Cluster 78.8 4.0 3.0 3.3 County 81.6 4.1 3.0 4.5
Source: Hunger in America 2009; STARS 2009; ACS 2005 to 2009
Note: Estimates do not represent the full population of pantries in the Feeding America network. See chapter II for details.
The percentages of block groups with at least one pantry are similar in metropolitan and nonmetropolitan areas (Table III.1). In contrast, the percentage of census tracts with at least one pantry is eight percentage points lower in metropolitan areas than in nonmetropolitan areas (29.8 percent and 37.8 percent, respectively). Although greater percentages of tracts and block groups have at least one pantry in the nonmetropolitan sample, the average numbers of pantries among areas with at least one pantry are slightly higher in metropolitan areas than nonmetropolitan areas for both block groups and tracts (1.3 versus 1.2 for block groups and 1.6 versus 1.5 in census tracts).
2. Distribution of Emergency Food Pantries by Population Demographics
A strong inverse relationship exists between socioeconomic status and the percentage of areas with one or more pantries when defining the unit of observation as the census tract (Table III.2). Areas characterized by lower socioeconomic status (higher percentages of families in poverty, individuals with at most a high school education, female-headed households, and housing units without access to a vehicle) are more likely to have at least one pantry. For example, 43.9 percent of areas with the highest level of poverty (quartile 4) have at least one pantry compared with 17.1 percent in areas with lowest level of poverty (quartile 1). Similarly, 35.8 percent of areas with the highest percentage of households without a vehicle have at least one pantry compared with 25.8 percent in areas with the lowest percentage of households without a vehicle.
The relationships between the number of pantries in an area and population demographics (total population, race, and ethnicity) are mixed. The percentages of census tracts with one or more pantries increase as total population increases, particularly in nonmetropolitan areas (Table III.2). Similarly, the percentage of the population that is non-white shows a positive relationship with the percentage of census tracts with one or more pantries. The number of pantries does not change as

Economic and Geographic Access to Food Retailers and Emergency Food Pantries Mathematica Policy Research
15
the percentage of the population that is Hispanic increases in metropolitan areas. However, there appears to be a slight positive relationship between having more than one pantry and having a greater percentage of individuals of Hispanic origin in nonmetropolitan areas.
Table III.2. Percentage of Census Tracts with One or More Emergency Food Pantries, by Population Characteristics and Metropolitan Status
All Census Tracts
Census Tracts in Metropolitan
Areas
Census Tracts in Nonmetropolitan
Areas
Total 18,355 14,073 4,282
Total Population Quartile 1 (0 to 2,839) 28.0 28.6 25.5 Quartile 2 (2,840 to 4,117) 30.7 28.3 36.5 Quartile 3 (4,118 to 5,755) 31.7 29.1 42.3 Quartile 4 (5,756 or more) 35.0 33.0 47.1
Percentage of Population with Income Below 200 Percent of the Federal Poverty Threshold
Quartile 1 (0 to 19) 17.1 15.2 29.9 Quartile 2 (20 to 31) 28.2 25.6 34.8 Quartile 3 (32 to 46) 36.3 34.6 41.2 Quartile 4 (47 to 100) 43.9 43.5 45.7
Percentage of Population Completing at Most High School
Quartile 1 (0 to 15) 18.3 16.6 36.9 Quartile 2 (16 to 23) 30.0 26.3 37.7 Quartile 3 (24 to 30) 37.9 35.7 40.1 Quartile 4 (31 to 100) 39.0 39.6 36.3
Percentage of Households Female-Headed with Children
Quartile 1 (0 to 5) 19.6 18.2 25.5 Quartile 2 (6 to 9) 28.2 26.3 35.3 Quartile 3 (10 to 16) 34.0 32.1 41.9 Quartile 4 (17 to 100) 42.5 42.4 47.5
Percentage of Housing Units Without a Vehicle Quartile 1 (0 to 1) 25.8 24.9 31.5 Quartile 2 (2) 31.7 30.0 37.9 Quartile 3 (3) 34.9 32.9 41.3 Quartile 4 (4 to 100) 35.8 34.5 41.1
Percentage of Population that is Non-White Quartile 1 (0 to 4) 29.4 25.9 30.2 Quartile 2 (5 to 14) 27.3 25.3 36.8 Quartile 3 (15 to 36) 30.1 29.3 37.4 Quartile 4 (37 to 100) 38.7 38.4 45.3
Percentage of Population that is Hispanic Quartile 1 (0 to 1) 33.1 31.7 35.3 Quartile 2 (2 to 5) 32.5 29.9 38.4 Quartile 3 (6 to 15) 29.1 27.3 39.3 Quartile 4 (16 to 100) 30.5 30.0 39.6
Source: Hunger in America 2009; STARS 2009; ACS 2005 to 2009

Economic and Geographic Access to Food Retailers and Emergency Food Pantries Mathematica Policy Research
16
Note: Quartile values listed in table are for all census tracts.
We observe some of the same basic relationships between socioeconomic status and the number of pantries in block groups: Block groups with at least one pantry are more likely to be in higher poverty than lower poverty areas (Table III.3). However, when the area is defined as the block group instead of tracts, the magnitudes are much smaller. For example, for the metropolitan sample, the difference in the percentage of census tracts with at least one pantry between the lowest and highest poverty quartiles is about 28 percentage points, while the difference for block groups is slightly less than 13 percentage points. Similarly, the relationships between the number of pantries and total population and vehicle access are smaller in both metropolitan and nonmetropolitan areas when block groups are used versus when census tracts are used. The smaller percentage of block groups with at least one pantry appears to limit the amount of variation we can observe in areas of this size, relative to census tracts.
In general, the relationships between the number of pantries and population characteristics are consistent in the metropolitan and nonmetropolitan samples. In both areas, pantry location is associated with high poverty, female-headed households, higher percentages of non-white residents, and lower access to vehicles. However, although there appears to be a strong relationship between pantry location and lower educational attainment at the population level in metropolitan areas, there is no such association in the nonmetropolitan sample.
The observed relationships between pantry locations and population characteristics for census tracts and block groups provide further support for the adoption of census tracts as the unit of analysis for this study. The lack of variation in the likelihood that a pantry was located in a block group was evidenced by the less pronounced relationships between pantry location and population characteristics when compared with the relationships using census tracts. Conversely, census tracts have much greater variation in the number and level of pantries.
Although census tracts are preferred to block groups, it is possible that census tracts are too small to properly assess where pantries are located relative to their target population. To address this, we re-estimated the relationships between pantry locations and population characteristics defined over larger census tract clusters—a census tract and all adjacent tracts—and found that the relationships are nearly identical to those observed for census tracts. This result provides evidence that it is sufficient to consider population characteristics at the census tract level, because expanding to the larger area does not drastically change the characteristics linked to the unit of observation.
Next, for each census tract we determined whether there is a pantry in the set of adjacent tracts. For simplicity, we focus on tracts located in the highest quartiles of the distribution of each population characteristic. We find that the percentage of census tracts without pantries that have a pantry in the adjacent tract is fairly high, ranging from about 70 to 85 percent. For example, about 56.1 percent of census tracts in high poverty areas do not have a pantry, but 82.6 percent have a pantry in an adjacent tract (Table III.4). For tracts with a high percentage of Hispanic individuals, 72.3 percent of tracts without a pantry have a pantry in an adjacent tract.
We conclude that census tracts are a useful unit of observation for analyzing where pantries are located and the population characteristics those areas, but it is important to consider a larger area around the tract when considering the characteristics of households served by pantries. For this reason, in the multivariate analysis, we account for the characteristics of the population living in a specific census tract, as well as the characteristics of the population living just outside of it.

Economic and Geographic Access to Food Retailers and Emergency Food Pantries Mathematica Policy Research
17
Table III.3. Percentage of Block Groups with One or More Emergency Food Pantries, by Population Characteristics and Metropolitan Status
All Block Groups
Block Groups in Metropolitan
Areas
Block Groups in Nonmetropolitan
Areas
Total 22,721 17,414 5,307
Total Population Quartile 1 (0 to 795) 11.1 10.9 11.3 Quartile 2 (796 to 1149) 11.3 10.9 12.5 Quartile 3 (1150 to 1701) 12.5 11.9 13.9 Quartile 4 ( > 1702) 13.6 13.4 16.3
Percentage of Population with Income Below 200 Percent of the Federal Poverty Threshold
Quartile 1 (0 to 16) 6.4 5.9 10.1 Quartile 2 (17 to 30) 10.3 9.6 12.2 Quartile 3 (31 to 48) 13.6 13.3 14.3 Quartile 4 (49 to 100) 18.3 18.4 17.3
Percentage of Population Completing at Most High School
Quartile 1 (0 to 14) 7.6 6.8 13.6 Quartile 2 (15 to 23) 12.1 10.9 13.7 Quartile 3 (24 to 31) 14.1 13.8 13.5 Quartile 4 (32 to 100) 14.9 15.5 13.3
Percentage of Households Female-Headed with Children
Quartile 1 (0 to 2) 8.7 8.4 9.8 Quartile 2 (3 to 8) 10.4 9.7 12.4 Quartile 3 (9 to 17) 12.7 12.2 14.5 Quartile 4 (18 to 100) 16.7 16.8 17.3
Percentage of Housing Units Without a Vehicle Quartile 1 (0) 10.5 10.2 12.1 Quartile 2 (1) 14.3 15.2 12.5 Quartile 3 (2 to 3) 13.5 13.1 14.9 Quartile 4 (4 to 100) 13.5 13.1 14.4
Percentage of Population that is Non-White Quartile 1 (0 to 3) 9.7 8.8 10.4 Quartile 2 (4 to 12) 10.3 9.7 12.6 Quartile 3 (13 to 35) 11.9 11.6 13.5 Quartile 4 (36 to 100) 16.8 17.0 17.3
Percentage of Population that is Hispanic Quartile 1 (0) 12.0 11.8 12.4 Quartile 2 (1 to 4) 12.5 12.0 13.1 Quartile 3 (5 to 15) 11.7 11.1 14.2 Quartile 4 (16 to 100) 12.3 12.1 14.7
Source: Hunger in America 2009; STARS 2009; ACS 2005 to 2009
Note: Quartile values listed in table are for all census tracts.

Economic and Geographic Access to Food Retailers and Emergency Food Pantries Mathematica Policy Research
18
Table III.4. Percentage of Low Socioeconomic Status and High Minority Census Tracts with No Emergency Food Pantries and the Percentage of those Census Tracts with an Emergency Food Pantry in an Adjacent Census Tract
Percentage of Census
Tracts with No Pantries
Among Census Tracts with No Pantries, the Percentage of Tracts
with at Least One Pantry in an Adjacent
Census Tract
Total Population Quartile 4 (5,756 or more)
65.0 74.5
Percentage of Population with Income Below 200 Percent of the Federal Poverty Threshold Quartile 4 (47 to 100)
56.1 82.6
Percentage of Population Completing at Most High School Quartile 4 (31 to 100)
61.0 83.0
Percentage of Households Female-Headed with Children Quartile 4 (17 to 100)
57.5 81.2
Percentage of Housing Units Without a Vehicle Quartile 4 (4 to 100)
64.2 76.9
Percentage of Population that is Non-White Quartile 4 (37 to 100)
61.3 77.2
Percentage of Population that is Hispanic Quartile 4 (16 to 100)
69.5 72.3
Source: Hunger in America 2009; STARS 2009; ACS 2005 to 2009
Note: Quartile values listed in table are for all census tracts.
C. Multivariate Analysis
The tables presented in this section complement those in the descriptive analysis by estimating the association between each population characteristic and the likelihood that a pantry is located in a census tract, while accounting for differences across tracts in the other characteristics. We estimate a logistic regression of the likelihood that a pantry is located in a census tract using the set of local population characteristic examined in the descriptive analysis. In presenting our findings, we present the marginal effects for all variables.
1. General Model Findings
Low socioeconomic status (percentage in poverty, percentage with at most a high school education, and percentage of female-headed households) is positively associated with a census tract having a pantry for tracts in metropolitan areas. Poverty has the largest association; a one percent increase in the percentage of families with income below 200 percent of the Federal poverty threshold is associated with an increase of 0.47 percentage points in the likelihood of the tract containing a pantry (Table III.5). The percentage of the population completing at most high school has the next largest association, followed by the percentage of households that are headed by females and that have children. While census tracts have about the same number of people living in them, on average, we find that the number of people in the area is positively associated with the

Economic and Geographic Access to Food Retailers and Emergency Food Pantries Mathematica Policy Research
19
likelihood of a tract having a pantry in it. Finally, the likelihood of a pantry is inversely related to the percentage of Hispanic individuals in the tract.
Table III.5. Associations of the Likelihood of a Census Tract Containing an Emergency Food Pantry with Population Characteristics, in Metropolitan Tracts
Variable Coefficient
Standard Error of
Coefficient Marginal Effectsa
Standard Error of Marginal Effects
Population Characteristics
Total population 0.009 0.001 0.299*** 0.023
Total area -0.007 0.005 -0.001 0.001
Percentage of families with income below 200 of Federal poverty threshold 2.019 0.141 0.470*** 0.034
Percentage of population completing at most high school (25+ years old) 2.455 0.208 0.377*** 0.034
Percentage of households female-headed with children 1.118 0.269 0.102*** 0.025
Percentage of housing units without a vehicle 0.739 0.850 0.013 0.015
Percentage of population that is non-white 0.030 0.132 0.006 0.026
Percentage of population that is Hispanic -1.360 0.252 -0.147*** 0.029
Source: Hunger in America 2009; STARS 2009; ACS 2005-2009.
a The marginal effects are the percentage point changes in the likelihood of a pantry associated with a 1 percentage point increase in the population variable measured at the mean.
**Significantly different from zero at the .05 level, two-tailed test. ***Significantly different from zero at the .01 level, two-tailed test.
Unlike for census tracts in metropolitan areas, the relationships between pantry location and both education and Hispanic population in nonmetropolitan areas are not statistically significant (Table III.6). In addition, the association with poverty is smaller (0.314 for nonmetropolitan areas, compared to 0.470 for metropolitan areas), while the association with female-headed households with children is slightly larger (0.164 for nonmetropolitan areas, compared to 0.102 for metropolitan areas).
2. Findings in Model in Which Explanatory Variables Are Defined Across Clusters of Census Tracts
We estimated two auxiliary models in which the population characteristics were measured using clusters of census tracts, rather than a single census tract. In the first model, we defined all population characteristics at the tract cluster level and included them as a single set of explanatory variables in the model. In the second model, we included the population characteristics for the census tract and all adjacent tracts as separate sets of explanatory variables. In both models, the number of pantries continued to be the dependent variable and the census tract continued to be the unit of observation. Because the impact on the findings from measuring population characteristics using clusters of tracts in place of a single tract is likely to be greatest in metropolitan areas, rather than nonmetropolitan areas, we present the following tables only for tracts in metropolitan areas.

Economic and Geographic Access to Food Retailers and Emergency Food Pantries Mathematica Policy Research
20
Table III.6. Associations of the Likelihood of a Census Tract Containing an Emergency Food Pantry with Population Characteristics, in Nonmetropolitan Tracts
Variable Coefficient
Standard Error of
Coefficient Marginal Effectsa
Standard Error of Marginal Effects
Population Characteristics
Total population 0.016 0.001 0.408*** 0.029
Total area -0.008 0.004 -0.010** 0.004
Percentage of families with income below 200 of Federal poverty threshold 1.285 0.232 0.314*** 0.057
Percentage of population completing at most high school (25+ years old) -0.326 0.322 -0.057 0.056
Percentage of households female-headed with children 2.636 0.419 0.164*** 0.026
Percentage of housing units without a vehicle -0.720 0.941 -0.011 0.015
Percentage of population that is non-white -0.023 0.178 -0.002 0.015
Percentage of population that is Hispanic -0.119 0.178 -0.005 0.007
Source: Hunger in America 2009; STARS 2009; ACS 2005-2009.
a The marginal effects are the percentage point changes in the likelihood of a pantry associated with a 1 percentage point increase in the population variable measured at the mean.
**Significantly different from zero at the .05 level, two-tailed test. ***Significantly different from zero at the .01 level, two-tailed test.
All of the relationships found when defining population characteristics at the tract level continue to hold when defining them at the tract cluster level (Table III.7). In fact, the magnitudes of most of the associations are slightly larger at the tract cluster level. For example, a one percentage point increase in the percentage of the population with income below 200 percent of the Federal poverty threshold is associated with a 0.533 percentage point increase in the likelihood of a tract containing a pantry. This compares to a 0.470 percentage point increase when defining poverty in the core census tract only. We conclude that the findings in the metropolitan area analyses are robust to defining population characteristics at the tract cluster level.
The second model includes the population characteristics for the census tract and all adjacent tracts as separate sets of explanatory variables. The likelihood of a tract containing a pantry is positively associated with poverty, less education, and the percentage of female-headed households with children for both the census tract “core” and the set of adjacent tracts (Table III.8). For poverty, the magnitude of the estimate is larger for the core census tract than the set of adjacent tracts, though the opposite is true for education and the percentage of female-headed households with children. While there was no association with race in the original model or the tract cluster model, decomposing the tract cluster into the core and the set of adjacent tracts shows that the small positive association with the percentage of the population that is non-white in the core tract is offset by the small negative association with the percentage of the population that is non-white in the adjacent tracts. The likelihood of a tract containing pantry is also positively associated with the percentage of housing units without a vehicle in the core tract, but not the outer set of tracts. Finally, the negative association with the percentage of individuals of Hispanic origin that we found in the original model is present in this auxiliary model too, but only for the percentage measured in the adjacent tracts; there is no statistically significant association in the core census tract.

Economic and Geographic Access to Food Retailers and Emergency Food Pantries Mathematica Policy Research
21
Table III.7. Associations of the Likelihood of a Census Tract Containing an Emergency Food Pantry with Population Characteristics of the Tract Including the Characteristics of All Surrounding Tracts, in Metropolitan Tracts
Variable Coefficient
Standard Error of
Coefficient Marginal Effectsa
Standard Error of Marginal Effects
Population Characteristics (Defined for the census tract and all adjacent tracts)
Total population 0.009 0.001 0.314*** 0.023 Total area -0.009 0.006 -0.001 0.001 Percentage of families with income below 200 of Federal poverty threshold 2.329 0.299 0.533*** 0.068 Percentage of population completing at most high school (25+ years old) 3.514 0.375 0.534*** 0.059 Percentage of households female-headed with children 2.675 0.800 0.240*** 0.073 Percentage of housing units without a vehicle -0.633 2.149 -0.011 0.037 Percentage of population that is non-white -0.352 0.228 -0.069 0.045 Percentage of population that is Hispanic -1.700 0.271 -0.186*** 0.031
Source: Hunger in America 2009; STARS 2009; ACS 2005-2009.
a The marginal effects are the percentage point changes in the likelihood of a pantry associated with a 1 percentage point increase in the population variable measured at the mean.
**Significantly different from zero at the .05 level, two-tailed test. ***Significantly different from zero at the .01 level, two-tailed test.
3. Findings in Models Accounting for Spatial Autocorrelation
Because the relationship between the number of pantries and population characteristics in a census tract may be associated purely due to omitted observed (or unobserved) factors not included in the model that are correlated across geographic regions, we examine the extent of spatial autocorrelation in the general model. We present regression results for a 25 percent random subsample to help account for spatial autocorrelation, with the idea that a smaller sample will necessarily increase the amount of distance between census tracts and thus decrease any potential correlation across census boundaries.
The findings in Tables III.9 and III.10 show that spatial autocorrelation has little impact on the standard errors of the parameter estimates in our general model. The associations between pantry location and population characteristics are measured precisely, and the magnitude and statistical significance are generally consistent with the finding using the full set of census tracts. Using the percentage of households with income below 200 percent of the Federal poverty threshold as an example, we find that the marginal effect is 0.462 percentage points in metropolitan areas and 0.365 percentage points in nonmetropolitan areas when the sample is restricted to 25 percent of its size. This compares to 0.470 and 0.314 percentage points, respectively, in the full sample in Tables III.5 and III.6. Although the standard errors generally increase as the sample size decreases, the marginal effects that were significant at the 0.01 significance level in the full sample models continue to be measured with the same level of precision (0.01 significance level) in the 25 percent subsample model.

Economic and Geographic Access to Food Retailers and Emergency Food Pantries Mathematica Policy Research
22
Table III.8. Associations of the Likelihood of a Census Tract Containing an Emergency Food Pantry with Population Characteristics of the Tract and the Characteristics of All Surrounding Tracts Specified as Separate Sets of Variables, in Metropolitan Tracts
Variable Coefficient
Standard Error of
Coefficient Marginal Effectsa
Standard Error of Marginal Effects
Population Characteristics
Total population in census tract (in 100’s) 0.010 0.001 0.199*** 0.012 Total population in adjacent tracts (in 100’s) -0.018 0.015 -0.369 0.315
Total area in census tract < 0.001 < 0.001 0.001 0.003 Total area in adjacent tracts < 0.001 < 0.001 < 0.001 < 0.001
Percentage of families with income below 200 of federal poverty threshold in census tract 0.012 0.001 0.251*** 0.023 Percentage of families with income below 200 of federal poverty threshold in adjacent tracts 0.009 0.003 0.179*** 0.060
Percentage of population completing at most high school (25+ years old) in census tract 0.009 0.002 0.190*** 0.033 Percentage of population completing at most high school (25+ years old) in adjacent tracts 0.026 0.004 0.533*** 0.076
Percentage of households female-headed with children in census tract 0.007 0.002 0.138*** 0.034 Percentage of households female-headed with children in adjacent tracts 0.019 0.007 0.395*** 0.145
Percentage of housing units without a vehicle in census tract 0.012 0.004 0.242*** 0.088 Percentage of housing units without a vehicle in adjacent tracts -0.020 0.020 -0.403 0.411
Percentage of population that is non-white in census tract 0.003 0.001 0.069*** 0.023 Percentage of population that is non-white in adjacent tracts < -0.000 < 0.001 -0.001*** < 0.001
Percentage of population that is Hispanic in census tract -0.001 0.002 -0.014 0.031 Percentage of population that is Hispanic in adjacent tracts -0.016 0.003 -0.322*** 0.055
Source: Hunger in America 2009; STARS 2009; ACS 2005-2009.
a The marginal effects are the percentage point changes in the likelihood of a pantry associated with a 1 percentage point increase in the population variable measured at the mean.
**Significantly different from zero at the .05 level, two-tailed test. ***Significantly different from zero at the .01 level, two-tailed test.

Economic and Geographic Access to Food Retailers and Emergency Food Pantries Mathematica Policy Research
23
Table III.9. Associations of the Likelihood of a Census Tract Containing an Emergency Food Pantry with Population Characteristics Using a 25 Percent Random Sample, in Metropolitan Tracts
Variable Coefficient
Standard Error of
Coefficient Marginal Effectsa
Standard Error of Marginal Effects
Population Characteristics (Defined for the census tract and all adjacent tracts)
Total population 0.009 0.001 0.308*** 0.029
Total area -0.005 0.005 -0.001 0.001
Percentage of families with income below 200 of Federal poverty threshold 1.989 0.213 0.462*** 0.051
Percentage of population completing at most high school (25+ years old) 2.421 0.300 0.371*** 0.048
Percentage of households female-headed with children 1.155 0.381 0.105*** 0.035
Percentage of housing units without a vehicle 0.655 0.940 0.011 0.017
Percentage of population that is non-white 0.111 0.152 0.021 0.029
Percentage of population that is Hispanic -1.344 0.281 -0.145*** 0.031
Source: Hunger in America 2009; STARS 2009; ACS 2005-2009.
a The marginal effects are the percentage point changes in the likelihood of a pantry associated with a 1 percentage point increase in the population variable measured at the mean.
**Significantly different from zero at the .05 level, two-tailed test. ***Significantly different from zero at the .01 level, two-tailed test.
Table III.10. Associations of the Likelihood of a Census Tract Containing an Emergency Food Pantry with Population Characteristics Using a 25 Percent Random Sample, in Nonmetropolitan Tracts
Variable Coefficient
Standard Error of
Coefficient Marginal Effectsa
Standard Error of Marginal Effects
Population Characteristics (Defined for the census tract and all adjacent tracts)
Total population 0.015 0.002 0.387*** 0.060
Total area -0.015 0.011 -0.017 0.013
Percentage of families with income below 200 of Federal poverty threshold 1.492 0.439 0.365*** 0.108
Percentage of population completing at most high school (25+ years old) -0.443 0.593 -0.077 0.103
Percentage of households female-headed with children 2.956 0.921 0.182*** 0.057
Percentage of housing units without a vehicle -1.792 1.628 -0.028 0.025
Percentage of population that is non-white -0.117 0.307 -0.009 0.025
Percentage of population that is Hispanic 0.044 0.321 0.002 0.014
Source: Hunger in America 2009; STARS 2009; ACS 2005-2009.
a The marginal effects are the percentage point changes in the likelihood of a pantry associated with a 1 percentage point increase in the population variable measured at the mean.
**Significantly different from zero at the .05 level, two-tailed test. ***Significantly different from zero at the .01 level, two-tailed test.

Economic and Geographic Access to Food Retailers and Emergency Food Pantries Mathematica Policy Research
24
D. Summary of Findings
A strong inverse relationship exists between socioeconomic status and the percentage of areas with one or more pantries. Census tracts characterized by lower socioeconomic status (higher percentages of families in poverty, individuals with at most a high school education, and female-headed households with children) are more likely to have at least one pantry for tracts in metropolitan areas. Poverty has the largest association, followed by the percentage of the population completing at most high school, and the percentage of households that are headed by females and that have children. These relationships hold in nonmetropolitan areas, with the exception of education which is weak and not statistically significant.

Economic and Geographic Access to Food Retailers and Emergency Food Pantries Mathematica Policy Research
25
IV. GEOGRAPHIC ACCESS TO EMERGENCY FOOD PANTRIES AND FOOD RETAILERS
A. Introduction
This chapter examines where emergency food pantries are located in relation to the retail food environment. We assess whether pantries are located in areas with higher or lower levels of access to retail food establishments. We also explore whether this relationship differs by certain store types. We begin by presenting descriptive statistics of the distributions of pantries by the number of food retailers in the area and by store type. Next, we present results from a multivariate analysis estimating the association of the likelihood of an area containing a pantry with the number of (and type of) retail food establishments in the area, while accounting for area population and geographic size.
B. Descriptive Analysis
Table IV.1 presents the distribution of retail food establishments (all stores and by store type) for block groups, census tracts, and counties. About 81 percent of tracts have at least one store, compared to less than 48 percent of block groups. There are 3.7 stores, on average, in census tracts with at least one store compared to 2.0 stores in block groups. In addition, half of census tracts have three or more retail stores. As discussed in Chapter III, we continue with the census tract as our unit of observation due to the lack of variation in pantry location in block groups, but tested the sensitivity of our findings to the use of block groups.
Among the six types of retail stores included in Table IV.1, convenience stores are the most common (53.0 percent of tracts with at least one store, mean value of 2.0) followed by other outlets (42.4 percent with at least one store, mean value of 1.6) and supermarkets and superstores (37.4 percent with at least one store, mean value of 1.5). Large and medium groceries, small groceries, and specialty food stores are slightly less common. About 17.6 percent of tracts have large or medium groceries; 14.7 percent have small groceries; and 15.2 percent have specialty food stores. The mean number of stores range from 1.3 to 1.7 for these store types.6
There is a strong positive relationship between the number of pantries and the number of retail food establishments (Table IV.2) at the census tract level. Areas with one or more retail stores are more likely to have one or more pantries. About 15 percent of census tracts with no stores have at least one pantry, compared with 23.4 percent in areas with one store and 38.7 percent in areas with multiple stores. Consequently, the percentages of areas with multiple pantries are higher in areas with one or more stores.
6 The distributions of retail food establishments are similar in metropolitan and nonmetropolitan samples and can
be found, by store type, for various area sizes in Appendix B.

Economic and Geographic Access to Food Retailers and Emergency Food Pantries Mathematica Policy Research
26
Table IV.1. Distribution of the Number of Retail Food Establishments, by Area Size and by Store Type
Percentage of Areas with at Least One Retail Food Establishment
Number of Retail Food Establishments Among Areas with at Least One Establishment:
Mean Median Standard Deviation
All Retail Food Establishments Block Group 47.6 2.0 1.0 1.5 Census Tract 81.1 3.7 3.0 2.9 County 99.3 61.5 20.0 207.9
Supermarkets and Superstores Block Group 14.0 1.3 1.0 0.6 Census Tract 37.4 1.5 1.0 0.9 County 88.9 12.8 4.0 36.0
Large and Medium Groceries Block Group 6.3 1.1 1.0 0.4 Census Tract 17.6 1.3 1.0 0.6 County 74.8 6.1 2.0 26.5
Small Groceries Block Group 5.9 1.3 1.0 0.7 Census Tract 14.7 1.7 1.0 1.4 County 52.8 9.4 2.0 61.3
Convenience Stores Block Group 24.8 1.3 1.0 0.6 Census Tract 53.0 2.0 1.0 1.3 County 91.2 23.0 8.0 74.5
Specialty Food Storesa Block Group 5.3 1.2 1.0 1.3 Census Tract 15.2 1.3 1.0 1.4 County 61.2 6.6 2.0 20.3
Other Outletsb Block Group 16.9 1.3 1.0 0.6 Census Tract 42.4 1.6 1.0 1.0 County 90.3 15.6 6.0 36.6
Source: Hunger in America 2009; STARS 2009; ACS 2005 to 2009
a “Specialty food stores” comprises stores classified as selling one of the following specialized items: bakery/bread, fruits/vegetables, meat/poultry products, or seafood products.
b “Other outlets” comprises stores classified as combination grocery/other, delivery route, farmers’ market, nonprofit food buying cooperative, wholesaler, or meal service providers.
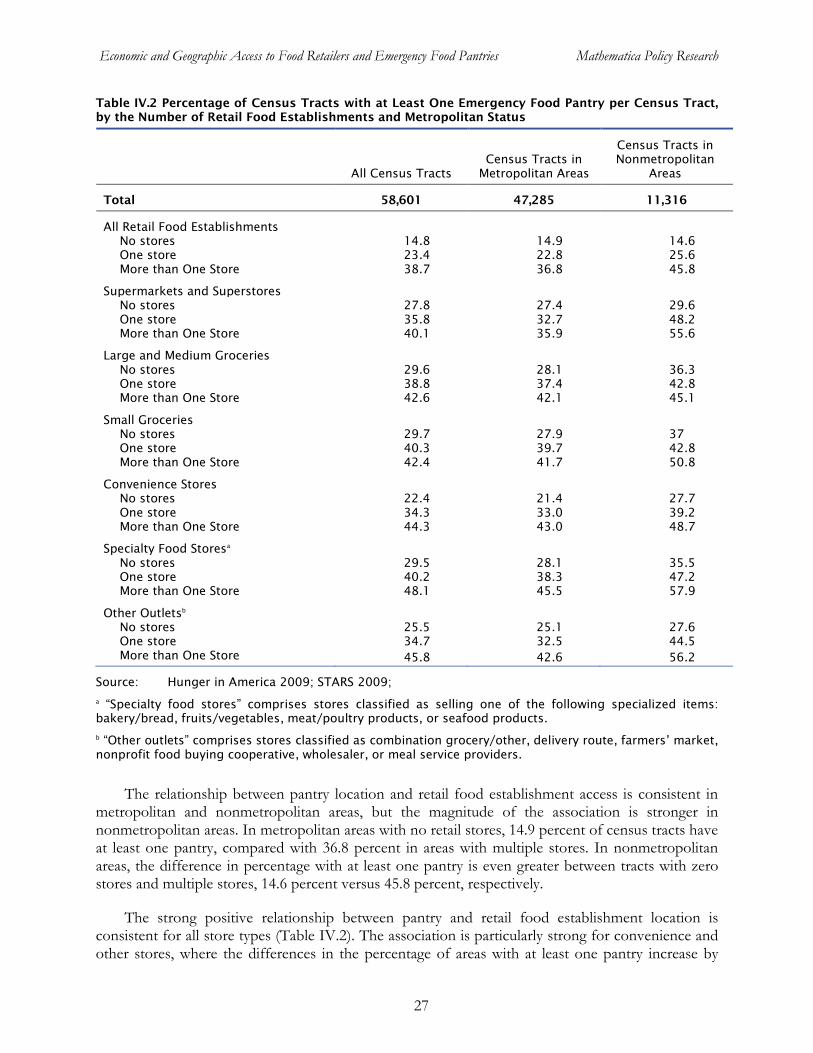
Economic and Geographic Access to Food Retailers and Emergency Food Pantries Mathematica Policy Research
27
Table IV.2 Percentage of Census Tracts with at Least One Emergency Food Pantry per Census Tract, by the Number of Retail Food Establishments and Metropolitan Status
All Census Tracts
Census Tracts in Metropolitan Areas
Census Tracts in Nonmetropolitan
Areas
Total 58,601 47,285 11,316
All Retail Food Establishments No stores 14.8 14.9 14.6 One store 23.4 22.8 25.6 More than One Store 38.7 36.8 45.8
Supermarkets and Superstores
No stores 27.8 27.4 29.6 One store 35.8 32.7 48.2 More than One Store 40.1 35.9 55.6
Large and Medium Groceries
No stores 29.6 28.1 36.3 One store 38.8 37.4 42.8 More than One Store 42.6 42.1 45.1
Small Groceries
No stores 29.7 27.9 37 One store 40.3 39.7 42.8 More than One Store 42.4 41.7 50.8
Convenience Stores
No stores 22.4 21.4 27.7 One store 34.3 33.0 39.2 More than One Store 44.3 43.0 48.7
Specialty Food Storesa
No stores 29.5 28.1 35.5 One store 40.2 38.3 47.2 More than One Store 48.1 45.5 57.9
Other Outletsb
No stores 25.5 25.1 27.6 One store 34.7 32.5 44.5 More than One Store 45.8 42.6 56.2
Source: Hunger in America 2009; STARS 2009;
a “Specialty food stores” comprises stores classified as selling one of the following specialized items: bakery/bread, fruits/vegetables, meat/poultry products, or seafood products.
b “Other outlets” comprises stores classified as combination grocery/other, delivery route, farmers’ market, nonprofit food buying cooperative, wholesaler, or meal service providers.
The relationship between pantry location and retail food establishment access is consistent in metropolitan and nonmetropolitan areas, but the magnitude of the association is stronger in nonmetropolitan areas. In metropolitan areas with no retail stores, 14.9 percent of census tracts have at least one pantry, compared with 36.8 percent in areas with multiple stores. In nonmetropolitan areas, the difference in percentage with at least one pantry is even greater between tracts with zero stores and multiple stores, 14.6 percent versus 45.8 percent, respectively.
The strong positive relationship between pantry and retail food establishment location is consistent for all store types (Table IV.2). The association is particularly strong for convenience and other stores, where the differences in the percentage of areas with at least one pantry increase by

Economic and Geographic Access to Food Retailers and Emergency Food Pantries Mathematica Policy Research
28
more than 20 percentage points moving from zero to more than one store. In general, the patterns are consistent for both metropolitan and nonmetropolitan samples, with slightly more pronounced positive relationships between pantry location and store access in the nonmetropolitan samples. For supermarkets and superstores, the percentage of areas with at least one pantry increases by 8 percentage points in metropolitan areas by going from zero stores to at least one store, but increases by 26 percentage points in nonmetropolitan areas.
Focusing on selected retailer types shows that the percentage of areas without stores that have at least one pantry is higher than the 14.8 percent found for when all retail food establishments are considered. That is, whereas Table IV.2 presents the percentages of areas with no stores that have at least one pantry for each store type, Table IV.3 repeats this for several groupings of store types. The percentage of areas without supermarkets or superstores that have at least one pantry is 27.8 percent. This decreases to 25.7 percent when large and medium groceries are considered with supermarkets and superstores, and to 24.1 percent when large, medium, and small groceries are considered. The findings are similar in metropolitan and nonmetropolitan areas.
Table IV.3 Percentage of Census Tracts with No Retail Stores (by Type) and at Least One Pantry
Percentage of Census Tracts with One or More Pantry
All Census Tracts
Census Tracts in Metropolitan Areas
Census Tracts in Nonmetropolitan
Areas
Census Tracts with No Stores by Type of Store
All Retail Food Establishments 14.8 14.9 14.6
Supermarkets and Superstores 27.8 27.4 29.6
Supermarkets, Superstores, Large and Medium Groceries
25.7 25.4 27.1
Supermarkets, Superstores, Large, Medium, and Small Groceries
24.1 23.6 26.5
Source: Hunger in America 2009; STARS 2009;
The percentage of areas without stores that have at least one pantry is higher in areas in the highest quartile of poverty7. Table IV.4 re-estimates the statistics in Table IV.3 by restricting the sample to those areas in the highest quartile of poverty. While the basic finding remains the same—the percentage of tracts with no stores that have at least one pantry is higher among the more traditional stores consisting of supermarkets and superstores and groceries—the percentages are higher in the poorest areas. About 25.3 percent of areas without stores in the highest-poverty quartile have at least one pantry (Table IV.4) compared to 14.8 percent in all areas (Table IV.3). The percentage of areas without supermarkets or superstores in the highest-poverty quartile that have at least one pantry is almost 41 percent. When all types of groceries are considered too, the estimate
7 This is the fourth quartile of the distribution of the percentage of households in the area with income below 200
percent of the federal poverty threshold presented in Chapter III.

Economic and Geographic Access to Food Retailers and Emergency Food Pantries Mathematica Policy Research
29
falls to 24.1 percent. Thus, while pantries and food retailers are located in similar areas, there is a sizable percentage of areas in the highest-poverty quartile with no stores that have at least one pantry.
Table IV.4 Percentage of Census Tracts with No Retail Stores (by Type) and at Least One Pantry Among Census Tracts in the Highest Quartile of Poverty
Percentage of Census Tracts with One or More Pantry
All Census Tracts
Census Tracts in Metropolitan Areas
Census Tracts in Nonmetropolitan
Areas
Census Tracts with No Stores by Type of Store
All Retail Food Establishments 25.3 26.6 18.3
Supermarkets and Superstores 40.8 41.9 36.4
Supermarkets, Superstores, Large and Medium Groceries
39.2 40.4 34.7
Supermarkets, Superstores, Large, Medium, and Small Groceries
37.4 38.5 34.2
Source: Hunger in America 2009; STARS 2009;
The percentage of areas without stores that have at least one pantry in areas in the highest quartile of poverty is higher when pantries in the adjacent census tract are considered. Table IV.5 re-estimates the statistics in Table IV.4 by including pantries not only in the core census tract, but in the set of adjacent tracts as well. We find that 84.6 percent of tracts with no retail food establishments have at least one pantry in the tract or adjacent tract. About 90 percent of tracts with no supermarkets or superstores have at least one pantry in the tract or adjacent tract.
Table IV.5 Percentage of Census Tracts with No Retail Stores (by Type) and at Least One Pantry in the Census Tract or Adjacent Census Tracts, Among Census Tracts in the Highest Quartile of Poverty
Percentage of Census Tracts with One or More Pantry
All Census Tracts
Census Tracts in Metropolitan Areas
Census Tracts in Nonmetropolitan
Areas
Census Tracts with No Stores by Type of Store
All Retail Food Establishments 84.6 84.0 87.6
Supermarkets and Superstores 90.3 90.0 91.3
Supermarkets, Superstores, Large and Medium Groceries
90.4 90.1 91.8
Supermarkets, Superstores, Large, Medium, and Small Groceries
89.6 89.3 91.0
Source: Hunger in America 2009; STARS 2009;

Economic and Geographic Access to Food Retailers and Emergency Food Pantries Mathematica Policy Research
30
C. Multivariate Analysis
The descriptive results provide evidence that pantries and retail stores tend to be located in the same areas, meaning areas with at least one retail food establishment are also likely to have at least one pantry. The results account for variation in total population among the census tracts to the extent that census boundaries are drawn to have similar populations but different total areas. In the multivariate analysis, we control for population and geographic size of census tracts to further isolate the relationship between pantry and food retailer location apart from the role of population density.
The analysis described in this section consists of estimating a logistic regression of the likelihood that a pantry is located in a census tract. The key explanatory variable is the number of food retailers in the census tract. We also include population and geographic size of the census tract (or clusters of census tracts) in all regressions.
In presenting our findings, we focus on the associations of the dependent variable with a variable measuring the number of retail food establishments in the area. We present the marginal effects on the probability of an area containing a pantry of increasing the number of retail food stores by an additional store.
1. General Model Findings
The likelihood of a pantry being located in a census tract is positively associated with the number of retail food establishments in a census tract (Tables IV.6 and IV.7). We observe this statistically significant positive relationship in both the metropolitan and nonmetropolitan areas. In metropolitan areas, an additional store in a census tract is associated with a 3.262 percentage point increase in the likelihood that the area has a pantry (Table IV.6). The magnitude of the relationship is larger in nonmetropolitan areas, a pattern that is consistent with the results in the descriptive analysis. An increase in one store from the mean number of stores is associated with a 4.236 percentage point increase in the likelihood of a pantry in nonmetropolitan areas. The changes in the likelihood of a pantry reflect increases over the means of census tracts with a pantry, 30 percent in metropolitan areas and 38 percent in nonmetropolitan areas.
Table IV.6. Associations of the Likelihood of a Census Tract Containing an Emergency Food Pantry with Access to Retail Food Establishments, in Metropolitan Tracts
Variable Coefficient
Standard Error of
Coefficient Marginal Effecta
Standard Error of Marginal
Effecta
Number of Retail Food Establishments 0.158 0.009 3.262*** 0.236
Population Characteristics Total population -0.001 0.001 -0.029** 0.015 Total area 0.008 0.007 0.004 0.003
Source: Hunger in America 2009; STARS 2009; ACS 2005-2009.
a Marginal effects and standard error of marginal effects in percentage points (all estimates have been multiplied by 100).
**Significantly different from zero at the .05 level, two-tailed test. ***Significantly different from zero at the .01 level, two-tailed test.

Economic and Geographic Access to Food Retailers and Emergency Food Pantries Mathematica Policy Research
31
Table IV.7. Associations of the Likelihood of a Census Tract Containing an Emergency Food Pantry with Access to Retail Food Establishments, in Nonmetropolitan Tracts
Variable Coefficient
Standard Error of
Coefficient Marginal Effecta
Standard Error of Marginal
Effecta
Number of Retail Food Establishments 0.181 0.008 4.236*** 0.202
Population Characteristics Total population 0.005 0.001 0.125*** 0.027 Total area -0.014 0.005 -0.003*** 0.001
Source: Hunger in America 2009; STARS 2009; ACS 2005-2009.
a Marginal effects and standard error of marginal effects in percentage points (all estimates have been multiplied by 100).
**Significantly different from zero at the .05 level, two-tailed test. ***Significantly different from zero at the .01 level, two-tailed test.
Moving from zero stores to one store is associated with a slightly smaller increase in the likelihood of a pantry, 2.582 percentage points in metropolitan areas and 3.364 percentage points in the nonmetropolitan areas (Table IV.8). Therefore, an additional store in a census tract, all else being equal, is associated with a larger increase in the likelihood of a pantry than the addition of the first store in that tract.8
Table IV.8 Marginal Effects of an Additional Retail Food Establishment on the Likelihood of a Census Tract Containing an Emergency Food Pantry, by Metropolitan Status and by Whether Additional Retailer is First Retailer in the Tract
Metropolitan Nonmetropolitan
Marginal Effecta
Standard Errora
Marginal Effecta
Standard Errora
Overall marginal effect 3.262*** 0.236 4.236*** 0.202
No Stores to One store 2.582*** 0.154 3.364*** 0.157
Source: Hunger in America 2009; STARS 2009;
a Marginal effects and standard error of marginal effects in percentage points (all estimates have been multiplied by 100).
**Significantly different from zero at the .05 level, two-tailed test. ***Significantly different from zero at the .01 level, two-tailed test.
2. Findings in Model Allowing Stores to Differ by Type
The numbers of each type of store, with the exception of specialized food stores in metropolitan areas and small groceries in nonmetropolitan areas (not statistically different from zero), show a positive association with the likelihood of a pantry in the census tract (Table IV.9). Convenience stores and other food stores demonstrate the strongest association with pantry location. In metropolitan areas, an increase of one convenience store is associated with a 5.076
8 The marginal effect of adding another store eventually decreases as the number of stores in the tract increases.

Economic and Geographic Access to Food Retailers and Emergency Food Pantries Mathematica Policy Research
32
percentage point increase in the likelihood of a pantry, while an increase in one store in the other category is associated with a 4.809 percentage point increase. Supermarkets and superstores show the weakest association with a less than one percentage point increase in the likelihood of a pantry with the addition of one store. This is not true in nonmetropolitan areas, where supermarkets and superstores show one of the strongest associations, about 4.5 percentage points, from an additional store in the area.
Table IV.9 Marginal Effects of an Additional Retail Food Establishment on the Likelihood of a Census Tract Containing an Emergency Food Pantry, by Metropolitan Status and by Store Type
Metropolitan Nonmetropolitan
Marginal Effecta
Standard Errora
Marginal Effecta
Standard Errora
Supermarkets and Superstores 0.604** 0.280 4.496*** 0.688
Large and Medium Groceries 2.085*** 0.764 5.274*** 0.913
Small Groceries 2.407*** 0.545 1.660 1.276
Convenience Stores 5.076*** 0.420 3.409*** 0.386
Specialty Food Storesb 0.887 0.564 2.594** 1.060
Other Outletsc 4.809*** 0.399 5.844*** 0.570
Source: Hunger in America 2009; STARS 2009;
a Marginal effects and standard error of marginal effects in percentage points (all estimates have been multiplied by 100).
b “Specialty food stores” comprises stores classified as selling one of the following specialized items: bakery/bread, fruits/vegetables, meat/poultry products, or seafood products.
c “Other outlets” comprises stores classified as combination grocery/other, delivery route, farmers’ market, nonprofit food buying cooperative, wholesaler, or meal service providers.
**Significantly different from zero at the .05 level, two-tailed test. ***Significantly different from zero at the .01 level, two-tailed test.
3. Findings in Model Estimated on Sample Restricted to Highest-Poverty Quartile
We re-estimated the original model by restricting the sample to include those tracts in the highest-poverty quartile. The findings show that the magnitudes of the associations, while still statistically significant at the 0.01 level, are slightly smaller than the associations for all areas (2.127 compared to 3.262 in metropolitan areas and 3.724 compared to 4.236 in nonmetropolitan areas).

Economic and Geographic Access to Food Retailers and Emergency Food Pantries Mathematica Policy Research
33
Table IV.10 Marginal Effects of an Additional Retail Food Establishment on the Likelihood of a Census Tract Containing an Emergency Food Pantry for Alternative Model Specifications, by Metropolitan Status
Metropolitan Nonmetropolitan
Marginal
Effect Standard
Error Marginal
Effect Standard
Error
All Areas 3.262*** 0.236 4.236*** 0.202
Restricted to Highest Poverty Census Tractsa 2.127*** 0.289 3.724*** 0.341
Source: Hunger in America 2009; STARS 2009;
a The highest poverty tracts were defined as the top quartile of census tracts for the percentage of families below 200 percent of the federal poverty threshold (quartile cutoffs were 45 percent for metropolitan areas and 47 percent for nonmetropolitan areas)
**Significantly different from zero at the .05 level, two-tailed test. ***Significantly different from zero at the .01 level, two-tailed test.
4. Findings in Model in Which Explanatory Variables Are Defined Across Clusters of Census Tracts
We estimated two auxiliary models in which the number of food retailers, as well as the population size and geographic area were measured using clusters of census tracts, rather than a single census tract. In the first model, we defined these variables at the tract cluster level and included them as a single set of explanatory variables in the model. In the second model, we included them for the census tract and all adjacent tracts are separate sets of explanatory variables. In both models, the number of pantries continued to be the dependent variable, and the census tract continued to be the unit of observation. Because the impact on the findings from measuring population characteristics using clusters of tracts in place of a single tract is likely to be greatest in metropolitan areas, rather than nonmetropolitan areas, we present the following tables only for tracts in metropolitan areas.
When the number of food retailers is measured using clusters of census tracts, the addition of one store is associated with a 0.624 percentage point change in the likelihood of a pantry in the census tract in a metropolitan area (Table IV.11).9 When allowing the number of retailers in the census tract and adjacent tracts to be separate variables, the number of pantries in the census tract is statistically associated with the number of retailers in both the “core” census tract and the set of adjacent tracts; the marginal effect, however, is almost eight times larger in the “core” tract than the adjacent tracts. The findings taken together provide evidence that access to retail stores in the “core” tracts have a much stronger relationship to pantry location than stores in the surrounding area, although the latter still show a statistically significant, positive relationship with pantry location.
9 The average number of food retailers for these larger areas is 21, roughly seven times higher than the average for
census tracts.

Economic and Geographic Access to Food Retailers and Emergency Food Pantries Mathematica Policy Research
34
Table IV.11 Marginal Effects of an Additional Retail Food Establishment on the Likelihood of a Census Tract Containing an Emergency Food Pantry when Food Retailers are Measured over Clusters of Census Tracts, in Metropolitan Tracts
Marginal Effect Standard Error
Original Model (Census Tract) 3.262*** 0.236
First Auxiliary Model (Cluster of Census Tracts)a 0.624*** 0.086
Second Auxiliary Model (Core Census Tract and Cluster of Census Tracts as Separate Variables)a
Number of Retailers in Census Tract 2.699*** 0.192
Number of Retailers in Adjacent Tracts 0.350*** 0.060
Source: Hunger in America 2009; STARS 2009;
b The number of retail food establishments and the population and geographic size are measured using the census tract and all adjacent tracts.
**Significantly different from zero at the .05 level, two-tailed test. ***Significantly different from zero at the .01 level, two-tailed test.
5. Findings in Models Accounting for Spatial Autocorrelation
Because the number of pantries in a census tract may be correlated across adjacent geographic regions by characteristics omitted from the regressions leading to underestimates of the standard errors, we examined the extent of spatial autocorrelation in the general model. We present regression results for a 25 percent random subsample to help account for spatial autocorrelation, with the idea that a smaller sample will necessarily increase the amount of distance between census tracts and thus decrease any potential correlation across census boundaries.
The findings in Table IV.12 show that spatial autocorrelation has little impact on the standard errors of the parameter estimates in our general model. The associations between pantry location and food retailer access are measured precisely, and the magnitudes are consistent with the finding using the full set of census tracts. In metropolitan areas, an additional retail food establishment in a census tract is associated with a 3.252 percentage point increase in the likelihood that the area has a pantry for each of the subsamples. In nonmetropolitan areas, the magnitude of the association is larger (as it was using all census tracts); an additional retail food establishment in a census tract is associated with a roughly 4.318 percentage point increase in the likelihood that the area has a pantry for each of the subsamples. Although the standard errors increase as the sample size decreases, all of the marginal effects continue to be measured precisely at the 0.01 significance level.
Table IV.12. Marginal Effects of an Additional Retail Food Establishment on the likelihood of a Census Tract Containing an Emergency Food Pantry Using a 25 Percent Random Sample, by Metropolitan Status
Metropolitan Nonmetropolitan
Marginal Effect
Standard Error
Marginal Effect
Standard Error
All Areas 3.262*** 0.236 4.236*** 0.202
25 Percent Random Sample 3.252*** 0.284 4.318*** 0.377
Source: Hunger in America 2009; STARS 2009; ACS 2005-2009. a The marginal effects are the percentage point changes in the likelihood of a pantry associated with a 1 percentage point increase in the population variable measured at the mean.

Economic and Geographic Access to Food Retailers and Emergency Food Pantries Mathematica Policy Research
35
***Significantly different from zero at the .01 level, two-tailed test.
D. Summary of Findings
There is a strong positive relationship between the number of pantries and the number of retail food establishments. Areas with one or more retail stores are more likely to have one or more pantries. About 15 percent of census tracts with no stores have at least one pantry, compared with 23 percent in areas with one store and 29 percent in areas with multiple stores. The relationship is consistent in metropolitan and nonmetropolitan areas, but is stronger in nonmetropolitan areas.
The relationship between the number of pantries and the number of food retailers is also consistent for all store types including supermarkets and superstores as well as large, medium, and small groceries. It is strongest for convenience stores, though, where the difference in the percentage of areas with at least one pantry increases from 22 percent in areas with no convenience stores to 44 percent in areas with more than one convenience store—a 22 percentage point difference. For supermarkets and superstores, this difference is about 12 percentage points, increasing from 28 percent in areas with no supermarkets or superstores to 40 percent in areas with more than one store.
The percentage of areas without stores that have at least one pantry is higher in higher-poverty areas. About 25 percent of high-poverty areas without stores have at least one pantry compared to 15 percent in all areas. The percentage of high-poverty areas without supermarkets or superstores that have at least one pantry is about 41 percent. Thus, while pantries and food retailers are located in similar areas, there is a sizable percentage of high-poverty areas with no stores that have at least one pantry.
While the differences in the percentages of areas that have pantries between areas with and without stores may partly reflect population centers around the country, a statistical analysis that accounted for differences in population and geographic size across areas showed that areas with more stores also contain more pantries. In metropolitan areas, increasing the mean number of food retailers in a census tract by an additional store is associated with a 3.3 percentage point increase in the probability that the tract has an emergency food pantry. The magnitude of the relationship is larger in nonmetropolitan areas where an increase of one retail food establishment is associated with a 4.2 percentage point increase in the probability of an emergency food pantry in nonmetropolitan areas. Moving from zero to one retail food establishment is associated with similar increases in the probability of an emergency food pantry, 2.6 percentage points in metropolitan areas and 3.4 percentage points in the nonmetropolitan areas.

This page has been left blank for double-sided copying.
Economic and Geographic Access to Food Retailers and Emergency Food Pantries Mathematica Policy Research
37
V. CONCLUSION
A. Summary
This study characterizes the emergency food program environment in two ways. First, it describes households’ economic access to emergency food pantries by examining the local population characteristics of areas with and without pantries. Second, it examines geographic access to emergency food pantries in relation to the retail food environment. Both analyses focus on emergency food pantries, which make up the majority of the three main types of emergency programs (pantries, soup kitchens, and emergency shelters).
A strong inverse relationship exists between socioeconomic status and the percentage of areas with one or more pantries. Census tracts characterized by lower socioeconomic status (higher percentages of families in poverty, individuals with at most a high school education, and female-headed households with children) are more likely to have at least one pantry for tracts in metropolitan areas. Poverty has the largest association; a one percent increase in the percentage of families with income below 200 percent of the federal poverty threshold is associated with an increase of about a half of a percentage point in the probability that the tract has a pantry. The percentage of the population completing at most high school has the next largest association, followed by the percentage of households that are headed by females and that have children. Unlike for census tracts in metropolitan areas, the relationship between pantry location and education in nonmetropolitan areas is weak and not statistically significant.
There is a strong positive relationship between the number of pantries and the number of retail food establishments. Areas with one or more retail stores are more likely to have one or more pantries. About 15 percent of census tracts with no stores have at least one pantry, compared with 23 percent in areas with one store and 29 percent in areas with multiple stores. The relationship is consistent in metropolitan and nonmetropolitan areas, but is stronger in nonmetropolitan areas.
The relationship between the number of pantries and the number of food retailers is also consistent for all store types including supermarkets and superstores as well as large, medium, and small groceries. It is strongest for convenience stores, though, where the difference in the percentage of areas with at least one pantry increases from 22 percent in areas with no convenience stores to 44 percent in areas with more than one convenience store—a 22 percentage point difference. For supermarkets and superstores, this difference is about 12 percentage points, increasing from 28 percent in areas with no supermarkets or superstores to 40 percent in areas with more than one store.
The percentage of areas without stores that have at least one pantry is higher in higher-poverty areas. About 25 percent of high-poverty areas without stores have at least one pantry compared to 15 percent in all areas. The percentage of high-poverty areas without supermarkets or superstores that have at least one pantry is about 41 percent. Thus, while pantries and food retailers are located in similar areas, there is a sizable percentage of high-poverty areas with no stores that have at least one pantry.
While the differences in the percentages of areas that have pantries between areas with and without stores may partly reflect population centers around the country, a statistical analysis that accounted for differences in population and geographic size across areas showed that areas with

Economic and Geographic Access to Food Retailers and Emergency Food Pantries Mathematica Policy Research
38
more stores also contain more pantries. In metropolitan areas, increasing the mean number of food retailers in a census tract by an additional store is associated with a 3.3 percentage point increase in the probability that the area has an emergency food pantry. The magnitude of the relationship is larger in nonmetropolitan areas where an increase of one retail food establishment is associated with a 4.2 percentage point increase in the probability of an emergency food pantry in nonmetropolitan areas. Moving from zero to one retail food establishment is associated with similar increases in the probability of an emergency food pantry, 2.6 percentage points in metropolitan areas and 3.4 percentage points in the nonmetropolitan areas.
B. Limitations of Study
As a basis for assessing the study findings, it is important to note that the research involves several important limitations. The emergency food pantries in the data are most, but not all, of the pantries to which 185 food banks distributed food in the HIA survey. The data file does not contain pantries that were operated by agencies that did not participate in the HIA survey and does not contain mobile pantries. In addition, there are other food banks in the Feeding America network (20 others as of 2009) that did not participate in the survey and for which we did not have pantry location information. There are also pantries that receive food from food banks outside of this network of emergency food providers. Thus, the set of pantries in this study do not reflect all pantries in the United States in 2009 and areas described in tables or depicted in a map as not having a pantry may in fact have one. With over 80 percent of food banks participating in the HIA survey, however, we believe this study contains most pantries in the country.
Another limitation is that the information in the STARS data available for food retailers includes store types but not information on food quality, selection, and prices. It is possible that food access is determined not only by the availability of stores in the area but by the availability of affordable food (in other words, shopping stores with lower prices) and greater availability and depth of stock of food items (in other words, having to travel to fewer stores to obtain the full set of food items wanted). In addition, STARS is not the population of food retailers, but only those that are authorized to accept SNAP benefits. As a result, STARS may underrepresent retailers in high income areas if retailers do not apply for SNAP authorization in areas in which there are small numbers of SNAP participants. Because most emergency food pantry households live in lower-income areas, this latter aspect of using STARS data is likely not to be too limiting, but should nevertheless be acknowledged.
Just as the number of stores in the area does not capture other dimensions of food access such as the depth of stock of items within the store, measuring access to emergency pantries using the number of pantries does not capture the potentially sizable degree of variation in the hours and days each week that pantries operation and the amount of food received from pantries. Pantries generally are open much more seldom than stores, with some operating only for a single day per month. The amount of food obtained at a pantry is also likely to vary greatly across pantries and may consist in some cases of a single grocery bag of food. Finally, there may also be regulations in areas regarding how often households may receive food from a single pantry and, in areas in which emergency food networks coordinate food distribution to households, whether households may obtain food from multiple pantry sites. Our measures of access to pantries do not account for these additional dimensions of access, but they are important for interpreting access measures.

Economic and Geographic Access to Food Retailers and Emergency Food Pantries Mathematica Policy Research
39
REFERENCES
Bartfeld, Judith. Single Mothers, Emergency Food Assistance, and Food Stamps in the Welfare Reform Era. The Journal of Consumer Affairs 37(2), 2003.
Bhattarai, Gandhi Raj, Patricia A. Duffy, and Jennie Raymond. 2005. Use of Food Pantries and Food Stamps in Low-Income Households in the United States. The Journal of Consumer Affairs 39 (2): 276-98.
Duffy, Patricia A. “ Food Stamp Use among Food Pantry Clients in the United States”, Forum on Public Policy, Winter 2007.
Daponte, B. O. (2000). “Private versus Public Relief: Use of Food Pantries versus Food Stamps among Poor Households.” Journal of Nutrition Education, 32(2): 72-81.
Mabli, James, Rhoda Cohen, Frank Potter, and Zhanyun Zhao. 2010. Hunger in America 2010: National Report Prepared for Feeding America. Princeton, NJ: Mathematica Policy Research Institute.
U.S. Department of Agriculture, Economic Research Service. “Access to Affordable and Nutritious Food: Measuring and Understanding Food Deserts and Their Consequences.” Report to Congress. Washington, DC: USDA, ERS, June 2009.
Wooldridge, Jeffrey M. 2002. Econometric Analysis of Cross Section and Panel Data. Cambridge, MA: MIT Press.

This page has been left blank for double-sided copying.

APPENDIX A
GEOCODING METHODOLOGY

This page has been left blank for double-sided copying.
A.3
We employed a three-step process to locate each of the pantries to a point on the map of the United States. Each step can also be thought of as a match category, where the first category is the closest match and the third category is the least precise. The first category comprises addresses that match a street address on a map with a high level of confidence. The third category comprises addresses that do not match with a street address and, therefore, are matched to the center of the zip code. This third group includes post office boxes and addresses that cannot be matched to a street address on the map using even the lowest matching criterion. Finally, the second category comprises addresses that match to a street address with a lower level of confidence; however, its matching zip code increases its precision to the level of the third category, which uses only a zip code to match the addresses. We discuss each of the steps taken to obtain the three categories and summarize the match rates below.
The first step was to run the entire set of pantry street addresses through the geocoding tool in ESRI’s ArcMap software version 10 with a match score threshold of 80. The software assigns the match scores based on how well the input street address (the pantry address) matches a candidate street address in the ArcMap database of addresses in the United States. The closer the input address is to the candidate address, the higher the match score will be. For example, a candidate address with a city, state, and zip code identical to the input address but with the street suffix spelled differently (Ave. versus Avenue) will receive a relatively high (though not perfect) match score. We targeted a threshold for this first step to be confident that the matches were the correct point on the map. We chose a threshold of 80 after carefully reviewing a random sample of matches at a variety of scores and conversing with ESRI technical support. In general, candidate addresses with match scores equal to or greater than 80 have trivial differences with the input addresses and refer to the same point on the map.
The second step was to locate the addresses that did not meet the match score threshold of 80 using a lower threshold and ensure that, at a minimum, the zip codes on the input addresses match the candidate address zip codes. We ran the addresses that did not match at a threshold of 80 through the geocoding tool at a threshold of zero. This method returned a wide range of match scores from 0 to 79, and therefore a wide range of quality matches. Because of this variation, we imposed the secondary criterion that the candidate matches had to at least match the zip codes for the input addresses. Thus, it is likely that the matches are more precise than in the third category, where we matched pantries to the center of the zip codes. Furthermore, we are certain that the candidate match is at least within the boundaries of the correct zip code.
The final step in locating pantries was to assign unmatched addresses to the population-weighted centroids of the appropriate zip codes. The group of unmatched addresses comprises street addresses that did not match in the first two steps and post office boxes (none of which match to a street address). We merged the addresses with a data set of zip codes that included the coordinates for the population-weighted centroids of each zip code.10 The population-weighted centroids represent the center of the populations in zip codes and are calculated using detailed census populations within each zip code. We used population-weighted centroids rather than the
10The Missouri Census Data Center (http://mcdc.missouri.edu/) provided the set of population-weighted
centroids.

A.4
geographic center of the zip codes because the pantries are more likely to be located in the area of the zip code where people live than in the zip code’s center.
Table A.1 summarizes the match rates for each of the three categories. All 28,812 pantries were matched using one of the three steps. In the first step, we matched 23,751 of the 25,723 addresses not assigned to post office boxes at a threshold of 80 in the ArcMap geocoding tool (92.3 percent). In addition, 21,628 (84.1 percent) were identical matches (match score equal to 100). Conversely, 1,972 (7.7 percent) of the pantries had a match score below 80. Of the 1,972 addresses that did not match in step one, 704 matched at a threshold of zero, and the input zip code matched the candidate zip code (35.7 percent). Of the 1,268 addresses that did not match in step two, 411 matched an address but the zip code did not match; 857 did not match any candidate address even at a threshold of zero. The final step was to combine the 1,268 unmatched addresses with the 3,089 post office boxes and match the total 4,357 addresses to the population-weighted centroids. In the end, 24,455 of the 28,812 pantries were matched to a street address (84.9 percent) and 4,357 were matched to a zip code centroid (15.2 percent).
We employed the same three-step process to locate the 195,897 retail food establishments. The only difference was that the set of retail food establishments did not contain post office boxes. Thus, the percentage of addresses matched to zip code centroids was much lower than for pantries, and the match rate to street addresses was much higher. Table A2 summarizes the results of each step of the geocoding process.
All of the 195,897 retail food establishments were matched to either a street address or a zip code centroid. First, 189,943 retail food establishments (96.5 percent) were matched to a street address using the geocoding tool in ArcMap and a threshold of 80. Most of the addresses received a match score of 100 (84.7 percent of all retail food establishments). On the other hand, 6,954 retail food establishments (3.5 percent) did not match a candidate street address using a threshold of 80. Of the 6,954 unmatched addresses, 1,832 retail food establishments matched a street address using a threshold of zero, and the input zip code matched the candidate zip code (26.3 percent). Of the 5,122 addresses that did not match in step two, 1,881 matched an address, but the zip code did not match, and 3,241 did not match any candidate address even at a threshold of zero. The final step was to match the 5,122 addresses to population-weighted zip code centroids. In the end, 191,775 of the 196,897 pantries were matched to a street address (97.4 percent), and 5,122 were matched to a zip code centroid (2.6 percent).

A.5
Table A.1. Summary of Emergency Food Pantry Geocoding Procedure
Address Category Number Percent Matched and Unmatched
Total Pantries 28,812 --
Street Addresses 25,723
Matched (Threshold = 80) 23,751 92.3
100 21,628 84.1
95 to 100 815 3.2
90 to 94 948 3.7
85 to 89 135 0.5
80 to 84 225 0.9
Unmatched (Threshold = 80) 1,972 7.7
Matched (Threshold = 0)a 704 35.7
75 to 79 28 1.4
70 to 74 204 10.3
65 to 69 229 11.6
60 to 65 124 6.3
50 to 59 79 4.0
0 to 49 40 2.0
Unmatched (Threshold = 0) 1,268 64.3
Matched zip not the same as pantry zip 411 32.4
No candidate address 857 67.6
PO Boxes 3,089 -
Total Matches to Street Addresses 24,455 84.9
Total Matches to Zip Code Centroid (Unmatched + PO Boxes)b
4,357 15.1
Source: Hunger in America 2009
a We consider addresses with match scores between 0 and 79 to be matches if the matched address zip code is the same as the pantry's zip code.
b All unmatched addresses (3,089 PO Boxes and 1,268 unmatched street addresses) were matched to a population weighted or geographic zip code centroid.

A.6
Table A.2. Summary of Retail Food Establishment Geocoding Procedure
Address Category Number Percent Matched and Unmatched
Total Stores 196,897 -
Matched (Threshold = 80) 189,943 96.5
100 166,722 84.7
95 to 100 4,519 2.3
90 to 94 13,940 7.1
85 to 89 2,234 1.1
80 to 84 2,528 1.3
Unmatched (Threshold = 80) 6,954 3.5
Matched (Threshold = 0)a 1,832 26.3
75 to 79 28 0.4
70 to 74 377 5.4
65 to 69 341 4.9
60 to 65 305 4.4
50 to 59 547 7.9
0 to 49 234 3.4
Unmatched (Threshold = 0) 5,122 73.7
Matched zip not the same as store zip 1,881 36.7
No candidate address 3,241 63.3
PO Boxes
Total Matches to Street Addresses 191,775 97.4
Total Matches to Zip Code Centroid (Unmatched + PO Boxes)b
5,122 2.6
Source: Hunger in America 2009
a We consider addresses with match scores between 0 and 79 to be matches if the matched address zip code is the same as the store's zip code.
b All unmatched addresses (5,405 unmatched street addresses) were matched to a population weighted or geographic zip code centroid.

A.7
Table A.3 Summary of Block Group and Census Tracts Samples
Category Sample
Total Number of Block Groups 64,341
Block Groups in Excluded Counties 5,740
Final Block Group Sample 58,601
Total Number of Census Tracts 205,665
Census Tracts in Excluded Counties 18,409
Final Census Tract Sample 187,256
Source: American Community Survey 2005 to 2009
Note: 388 emergency food pantries and 423 pantries are excluded from the analysis because they are located in block groups and tracts, respectively, in counties that were excluded from the study

www.mathematica-mpr.com