economic and institutional factors affecting business ... et al... · economic and institutional...
TRANSCRIPT

1
Economic and Institutional Factors Affecting Business Environmental Management
David Ervin, JunJie Wu, Madhu Khanna, Cody Jones, Teresa Wirkkala and Patricia Koss
Professor Ervin, Dr. Jones and Professor Koss are with the Departments of Economics and Environmental Science and Management, P.O. Box 751, Portland State University, Portland, OR 97207-0751 Professor Wu and Ms. Wirkkala (formerly Hall) are with the Department of Agricultural and Resource Economics, 200 Ballard Extension Hall, Oregon State University, Corvallis, OR 97331-3601 Professor Khanna is with the Department of Agricultural and Consumer Economics, University of Illinois, 326 Mumford Hall, MC-710, 1301 West Gregory Drive, Urbana, IL 61801-3605
Correspondence Address:
David Ervin Department of Economics
241 M Cramer Hall Portland State University Portland, OR 97207-0751
Office: 503-725-3935 Fax: 503-725-3945
Email: [email protected]

2
Economic and Institutional Factors Affecting Business Environmental Management
Abstract. Two different conceptual frameworks, profit maximization and institutional theory,
have been used to analyze why firms voluntarily undertake environmental management. The
neoclassical economic approach centers on rationalizing environmental management decisions
based on their potential to decrease cost, increase revenue and improve the manager’s utility.
Institutional theory takes a broader view and emphasizes how external pressures from market
and non-market constituents shape the firm’s environmental efforts. Studies of business
environmental management often adopt one or the other framework. We view the two
approaches as complementary, since institutional pressures can influence upper management’s
view of what is in the firm’s economic interest and help explain environmental efforts that go
beyond compliance. Therefore we postulate a model that includes both types of motivations to
analyze environmental management actions by small, medium and large facilities in Oregon’s
major manufacturing and service sectors. Survey data are used to estimate the magnitude and
significance of economic and institutional factors in a facility’s choice of environmental practice
routines and pollution-prevention operational activities. Our findings support the hypothesized
model built using both conceptual frameworks. Specifically, the results show significant
influences by firm factors, including cost barriers, upper management attitudes toward
environmental stewardship, and parent company ownership, and by external institutional forces
including regulatory, investor and competitor pressures. The robust coefficient on the proxy for
upper management’s environmental attitudes suggests that explanatory models should go beyond
profit maximization theory to include this important behavioral influence. Taken as a whole, the
findings imply that a multifaceted policy strategy extending beyond public regulation and
incentives can advance environmental management by facilities in Oregon, and likely elsewhere.
Key words: Environmental practices; pollution-prevention activities; management
environmental attitudes; economic factors; institutional theory
1
I. Introduction
Expanding markets for ‘green’ products and stocks, tighter pollution standards, and the
growing likelihood of greenhouse gas regulation have elevated environmental management to a
strategic level for many businesses. It has been suggested that such firms increasingly view pro-
active environmental management as an opportunity not simply to minimize the expense of
complying with regulations, but to control risks, lower operating costs, respond to stakeholders,
enhance revenues, and improve their competitive advantage (Esty and Winston, 2006). Insights
about the significant factors influencing these efforts can enhance the cost-effectiveness of the
next generation of public and private environmental policies.
Observing this shift in strategy for many firms, scholars from multiple disciplines have
contributed to an extensive literature on voluntary environmental management since the early
1990s (Alberini and Segerson, 2002; deLeone and Rivera 2009; Khanna, 2001; Lyon and
Maxwell, 2004; Reinhardt, 2005). Some early work advanced a conceptual framework that
incorporated the constraints imposed by the natural environment into strategic business
management, termed a natural resource-based view of the firm (e.g., Hart, 1995). This
framework focused attention on strategies for key firm resources, e.g., R&D capacity, that
contribute to sustained comparative advantage. In a second body of work, management scholars
have applied institutional and neo-institutional theory to understand business’ environmental
management actions, such as adopting environmental management systems (EMS) (e.g., Darnall
et al, 2008; Delmas and Toeffel, 2004, 2008; Rivera, deLeon and Koerber, 2009). Delmas and
Toeffel (2004;210) note:
“However, the institutional perspective does not address the fundamental issue of
business strategy: why do organizations subject to the same level of institutional pressure
pursue different strategies?”
2
The authors theorize the differing responses reflect divergences in ‘objective’ and ‘perceived’
pressures, the latter being influenced by the management’s perspectives on the impact of various
institutional pressures on a firm’s financial and environmental performance which in turn depend
on the firm’s organizational structure other characteristics.
Economists have mostly sought to explain business environmental decisions using a
profit maximization framework that emphasizes the influences of external market and regulatory
forces and internal firm characteristics on expected costs and returns (Konar and Cohen, 1997,
2001; Khanna and Brouhle, 2009). This approach considers internal firm decisions and variables
under the control of managers to affect such actions, e.g., production process innovations as well
as external factors that affect profit, e.g., certification and marketing expense to differentiate
products, that may be influenced by the external pressures defined by institutional theory (Wu,
2009). A few economists have advanced a utility maximization approach in which managers
holding strong environmental values receive the equivalent of a monetary incentive from
increased environmental action by their firms (e.g., Baron, 2001; Nakamura, et al., 2001).
Several studies have empirically analyzed the effects of various institutional pressures
from market actors, government and non-governmental organizations, the effects of leadership
values and managerial attitudes and the influence of various departments within the organization
(see review in Delmas and Toeffel, 2004; Delmas and Toeffel, 2008; Cordano and Frieze, 2000).
Other studies have used observed facility characteristics and various proxies for economic
incentives to explain firm participation in voluntary environmental programs (VEPs), such as
ISO 14001, WasteWise, and the National Environmental Performance Track (Arora and Cason,
1995; DeCanio and Watkins, 1998; Innes and Sam, 2008; Khanna and Damon, 1999, Nishitani,
2009; Videras and Alberini, 2000); and the adoption of selected environmental management
practices (EMPs) (Anton, et al., 2004; Dasgupta, at al., 2000; Henriques and Sadorsky, 1996;
3
Johnstone and Labone, 2009; Khanna and Anton, 2002). Nakamura, et al., 2001) applied a
utility maximization approach to examine the effect of managerial attitudes towards
environmental stewardship on voluntary environmental action by their firms. In general, these
studies show that a relatively small set of factors appear to influence such decisions, including
regulatory intensity, firm size and economic performance while the effects of public recognition
are mixed (Alberini and Segerson, 2002; Cohen, 1997; Johnstone and Labone, 2009; Khanna,
2001, Khanna and Brouhle, 2009; Harrington et al., 2008).
As pointed out by Delmas and Toeffel (2004), a comprehensive framework that combines
both objective pressures and perceived pressures and allows for the evaluation of their
differential influences on environmental management actions is lacking. Available data often
limit analysis of the full spectrum of motivations for business environmental initiatives,
including the role of management’s values. Further, many of the empirical tests cover only
publicly-traded and large manufacturing firms, leaving out private firms, small- and medium-
sized enterprises (SMEs), and the service sector. Therefore, our understanding of drivers and
their effects on firm decisions remains partial and limits insights into effective policy approaches
for these industry segments. Analyses of business environmental management decisions should
ideally include all relevant motivations and barriers, and be tested across the full range of
facilities to best inform public and private policies.
The research reported here takes a first step in combining the economic and institutional
frameworks as suggested by Delmas and Toeffel (2004). With this more comprehensive model,
we enlarge the domain of empirical analysis on the internal and external factors that affect
business environmental actions. We use survey data from facilities in six major Oregon
industries to shed new light on what is driving green business behavior in a state with a strong
environmental tradition. SMEs and large facilities in manufacturing and service sectors populate
4
the database, which more closely mirrors national patterns of industrial activity than many other
samples. By focusing on one state, the analysis holds constant some policy and unobservable
factors that can confound analyses of environmental management drivers and impacts across
states. We develop a utility maximization model that also includes perceived external
institutional pressures to analyze facilities’ reported environmental management practices (EMP)
and pollution-prevention activities (P2). The two-equation model is tested over alternative
specifications of facility and institutional explanatory variables to ascertain robustness.
An early analysis of the survey data examined differences in the types of facilities that
are likely to participate in voluntary environmental programs (VEPs) and those likely to adopt
EMPs using Poisson and ZIP models with counts of EMPs and VEPs as the dependent variables
(Khanna et al, 2007). That paper examined the effect of observed facility characteristics on the
number of VEPs in which a firm participated and the number of EMPs it adopted. The main
findings of that study were that facilities that faced environmental regulations for a larger
number of environmental impacts and those that considered the environment to be a significant
issue for the facility were more likely to engage in VEPs and EMPs. It also found that larger
facilities are more likely to participate in VEPs while innovative facilities, as measured by R&D
capacity, are more likely to adopt more EMPs.
This analysis expands upon the earlier study in several respects. First, our EMP measure
expands beyond the count of practices to capture the reported level of their use based on a five-
point Likert scale. Second, we add another dimension of environmental management, the
amount of pollution-prevention (P2) activity, an indicator of the facility’s actions to avoid
pollution and other environmental harms. Including the P2 measures allows us to capture a fuller
spectrum of environmental initiatives. Third, perhaps more importantly, our unique, primary data
allow us to introduce an expanded suite of economic and institutional explanatory variables,

5
including several perceived market and non-market pressures, that have been hypothesized by
the utility maximization and the institutional theories to play important roles, but have been
rarely tested in the previous studies. These additions allow us to probe the roles of institutional
forces alongside management values and observed facility characteristics in shaping the
organization’s environmental management efforts. In particular, building on the findings in
Khanna et al. (2007) our analysis sheds light on some of the perceived institutional pressures that
could be correlated with the facility viewing the environment to be a significant issue for them
and that increase the likelihood of adoption of EMPs and P2 activities. Two other studies that use
this survey data focus on examining firms’ motivations for environmental violations and
overcompliance, without examining firms’ adoption of environmental management practices or
policies (Wu and Wirkkala, 2009; Wu, 2009).
The remainder of this article is organized as follows. In the next section, we develop a
simple conceptual model that draws on economics and management concepts to guide our
empirical analysis. Section III describes the sample and the survey, and summarizes the data
collected. Section IV reports the variables created and hypotheses, and section V presents
econometric results. The final section draws conclusions and policy implications for advancing
business environmental management efforts.
II. Conceptual Framework
We develop a framework that draws upon the existing literature and views a facility
manager’s utility as depending on the facility’s profits, its environmental performance and
managerial attitudes that influence the impact of the first two factors on his/her utility. This
approach is based on the view posited by institutional theory that external social and cultural
pressures exerted on organizations in a common field create and diffuse a common set of values,

6
norms and rules that influence their practices and structures beyond mere profit maximization
motives (Scott, 1992). Institutional pressures on firms’ environmental decisions could be
imposed by shareholders, suppliers, competitors, industry (trade) associations, government
regulators, consumers, community groups, and environmental activists (Delmas and Toeffel,
2004). These institutional pressures can change the way firms view the cost and benefits of
environmental management by transforming the marketplace environment in which firms operate
and facilitate the emergence of external benefits from such actions (Auld et al. 2008).1 However,
we expect that the same set of institutional pressures will have a differential impact on a
facility’s environmental management actions due to differences in the way these pressures are
perceived by the facility management and the way they affect the facility’s profitability (Wu,
2009). For example, investor preferences for stronger environmental programs could reduce the
firm’s cost of raising external capital. Facilities differ in these impacts due to heterogeneity in
their characteristics and the attitudes of the management. Managers’ views are shaped by
prevailing social and cultural environments and their desire to ensure legitimacy of their firm.
A facility motivated solely by a desire to maximize profits would only undertake a
voluntary environmental activity, either as an internal initiative or in response to external
institutional pressures, if it results in higher profits. Upper managers who hold altruistic
preferences obtain additional value from the facility preventing environmental harm. They can
be expected to lead the organization to voluntarily improve its environmental performance even
if the actions are not profit maximizing (Marshall, Cordano and Silverman, 2005).
1While institutional theory predicts fairly homogeneous responses to market and non-market pressures by organizations in the same field, observations in the real world suggest heterogeneous firm environmental management actions occur in any field. New institutional theory attributes such heterogeneity to variations in firm structure and culture. For example, various functional departments, such as legal affairs or marketing, receive pressures from different sources and have varying capacity to translate them into environmental actions in different firms (Delmas and Toeffel, 2008).

7
Voluntary environmentally-friendly actions may serve to increase a firm’s profitability in
response to internal initiatives and external pressures. Such actions can lead to increased demand
and higher prices for the firm’s output through product differentiation. Such actions can also lead
to increased efficiency of the production system, reduced waste in the use of inputs, and lower
operating costs. As noted above, such efforts may also lower costs of financial capital. A facility
may also benefit by improving its corporate reputation, gaining consumer and community
goodwill, lowering expenses for obtaining permits for expanding their facilities and preventing
boycotts by environmental interest groups. Voluntary environmental actions may also lower
transaction costs in dealing with regulatory authorities and preempt the threat of anticipated
regulations, thereby limiting future financial liabilities. Of course, such actions can impose added
expense in the form of employee training, change in production and pollution control methods.
Improvements in environmental performance of a facility may be achieved by adopting
EMPs and/or by taking P2 actions. While the former involves changes in routine operating
policies and procedures, such as setting environmental goals and policies, training employees
and undertaking environmental auditing and reporting, the latter includes changes in the methods
of pollution control. The extent to which the above motivations drive facilities to adopt EMPs or
P2 can be expected to differ depending on the effectiveness of EMP and P2 in achieving the
particular objectives driving their adoption and in being observable and credible signals of the
facility’s environmental responsibilities to consumers, other stakeholders and the government.
We represent these motivations using the following model in which we hypothesize that
the facility manager’s utility is a function of profit (π) and environmental performance (EP):
U(π, EP; α), where α is a parameter denoting the manager’s attitudes and values toward
environmental management. Environmental performance (EP) in a facility depends on its

8
environmental practices (EMP), pollution-prevention activities (P2), and a vector of exogenous
facility characteristics (X), such as multinational operations and R&D capacity and α:
EP = E(EMP, P2, X; α). (1)
Profit (π) depends on the product price (p), the quantity of sales (Q), and the cost of
production (C): π = pQ -C. Thus, to understand how a manager makes her environmental
decisions, we must also specify how EMP and P2 actions affect the price (p), the quantity of
sales (Q), and the cost of production (C). We assume that, given the external institutional
pressures for environmental management such as consumers’ willingness to pay for
environmentally-friendly products, investor and other stakeholder concerns, and regulatory
pressures, both the price and sales of a facility, as well as its cost of production, are potentially
affected by its environmental efforts and performance because both of them may enhance the
firm’s public image and resource efficiency. Adoption of EMPs and P2 may reduce costs of
production by increasing efficiency of resource use or they may increase costs of production
because they involve more employee training and effort and new equipment. Formally,
p = p(EMP, P2, EP│ I, B, X), (2)
Q = Q(EMP, P2, EP│ I, B, X), (3)
C = C(EMP, P2, EP│ I, B, X), (4)
where I is a vector of perceived external institutional pressures, including those by consumers,
investors, competitors, environmental interest groups, and regulators; and B is a vector of
internal barriers (e.g., upfront cost, downtime risks) to adopting EMP and carrying out P2
actions.
The manager’s objective is to maximize her utility by choosing EMP and P2:
Max U(π, EP; α), (5)
s.t. expressions (1) - (4).

9
The first-order condition defines the facility’s optimal choice of environmental management
policy and pollution-prevention actions through these two reduced form equations:
EMP* = f(I, B, X, α) (6)
P2* = g(I, B, X, α) (7)
Based on the conceptual framework using utility maximization and institutional theories, we set
forth three hypotheses about factors that motivate the adoption of EMPs and P2 by facilities.
Hypothesis I: The stronger the threat of regulatory pressures faced by a facility, the greater the
extent of adoption of EMPs and P2.
Several theoretical studies suggest that the potential to preempt environmental regulations
and shape future regulations provides incentives for adopting voluntary environmental
initiatives. Segerson and Miceli (1998) show that an anticipated regulatory threat could lead
firms to undertake voluntary abatement in order to preempt regulation that would otherwise
involve higher abatement costs and transactions. In a test of this proposition, Delmas and Toeffel
(2008) find that facilities more receptive to nonmarket pressures, including regulatory factors,
were significantly more likely to participate in voluntary government environmental programs.
Lutz et al. (2000) show that firms have an incentive to voluntarily produce goods with improved
environmental attributes if it can be used to influence the minimum quality standards likely to be
set by the government.
Hypothesis II: The stronger the pressures to be environmentally responsible from consumers,
interest groups, investors and competitors, the greater the extent of adoption of EMPs and P2.
When consumers prefer products produced using environmentally-friendly practices or
possess certain environmental attributes, firms may be able to charge premium prices or increase
market shares at existing prices by differentiating their products through adoption of EMPs

10
and/or P2s. Arora and Gangopadhyay (1995) examine the conditions under which firms produce
high-quality environmental products to differentiate themselves from other firms and gain
market share in the presence of consumer willingness to pay premiums for environmentally-
friendly products and firm desire to relax price competition. Henriques and Sadorsky (1996) find
that customer pressure was the second most cited source of pressure to adopt an environmental
management plan by Canadian firms, and Florida and Davison (2001) found that firms that were
more actively engaged with community stakeholders were more likely to institute pollution
prevention programs.
Firms may also have incentives to undertake voluntary adoption to preempt consumer
groups from lobbying for more stringent abatement regulations, particularly when it is not very
costly for consumer groups to organize themselves and influence the political process (Maxwell
et al., 2000). Baron (2001) shows the conditions under which an activist group can create
incentives for a facility to be socially responsible and that these incentives increase if the facility
faces greater competitive pressures or if the management has stronger altruistic preferences.
Delmas and Toeffel (2004) hypothesize that market-related groups, including consumers,
suppliers, investors and others exert pressure through corporate marketing departments. Delmas
and Toeffel (2008) found that increased receptivity to environmental interest group pressure by
the legal affairs department had a significant positive effect on a facility’s participation in
voluntary government environmental programs.
In addition to consumers and interest groups, investors can also influence a facility’s
decisions about environmental management. The capital markets pressure firms to increase their
value. Firms that undertake environmental management to increase their profits can benefit by
facing a lower cost of raising capital. Kristrom and Lundgren (2003) show that a firm’s value is
linked to its stock of “green goodwill” and that a firm can increase that stock by investing in

11
environmentally-friendly projects. However, capital markets can also pressure firms to avoid
environmental management that is driven by altruistic motives and is unprofitable. Thus the
impact of investor pressures on incentives for adopting EMPs and P2 is ambiguous. Delmas and
Toeffel (2008) find that pressures from consumers, investors and suppliers are stronger if they
have strong preferences for improved environmental management and the facility’s marketing
department has influence over facility decisions.
Several scholars theorize that less competitive or more concentrated industries are more
likely to undertake voluntary environmental efforts because their profit margins are larger (Brau
and Cararro 1999) and there are weaker incentives for free riding (Maxwell, Lyon and Hackett
2000). This may also be the case because firms in these industries face lower costs of inter-firm
coordination (Glachant 1999) and have greater market power and ability to differentiate products
(Arora and Gangopadhyay 1995; Garvie 1997). An industry dominated by a few big firms is also
more effective in inducing its suppliers to adopt environmental management practices as
compared to an industry that is fragmented; this could be a major reason why automotive
suppliers in the US adopted similar environmental management practices (Delmas and Toeffel,
2004).
Hypothesis III: The stronger the moral motivations of the managers toward the environment, the
greater the extent of adoption of EMPs and P2.
Several case studies of firms suggest that managers’ attitudes and commitment play an
important role in filtering, interpreting and prioritizing the signals they receive from the external
environment and in facilitating or impeding proactive environmental management (Nash, 2000).
Baron (2001) develops a formal model to show that altruistic managerial preferences can lead a
facility to go further in adopting socially-responsible practices than is profit maximizing.
Cordano and Frieze (2000) find that managerial attitudes influenced preferences for source

12
reduction activities, suggesting that when a manager’s attitudes toward a behavior become more
favorable, the intention and effort exerted to perform the behavior are likely to increase. Neo-
institutional scholars argue that business firms are not exclusively bound to profit maximization
and also seek social legitimacy for their long term survival (Rivera, deLeon and Koerber 2009).
This motive could translate into positive attitudes by managers toward environmental
stewardship that mirror public opinion. As noted above, Nakumura, Takahashi, and Vertinsky
(2001) found empirical support for the influence of managers’ attitudes toward environmental
stewardship on related management actions by a sample of Japanese firms.
Next, we discuss the survey design and the data that are used to estimate equations (6)
and (7) and test the above hypotheses.
III. Data
The sample comprised all facilities in Oregon employing at least 10 employees2 (R3.7),
operating primarily in one of the following sectors3: Construction of Buildings (Construction;
NAICS 236), Food Manufacturing (Food; NAICS 311), Wood Product Manufacturing (Wood;
NAICS 321), Computer and Electronic Product Manufacturing (Electronics; NAICS 334), Truck
Transportation (Transport; NAICS 484), and Accommodation (Accommodation; NAICS 721).
The chosen sectors accounted for nearly 33% of employment, 30% of all facilities, and 30% of
corporate tax revenues in Oregon industry in 2004 (DOR, 2004; Graham Slater, OED
2 The lower limit was arbitrarily set at 10 employees on the reasoning that facilities with fewer than 10 workers likely would not have enough resources to implement a formal environmental program. Setting it at a higher level, such as 50 workers, would have eliminated the majority of the sample facilities. 3 Facility name, location, number of employees and primary industry classification were obtained from the Oregon Employment Department (OED), which is authorized by Oregon Revised Statutes (ORS) 657.665(3) to release information to state agencies for the purposes of socioeconomic analysis. No individual persons are identified, and information is provided subject to strict confidentiality rules (State of Oregon, 2005a, 2005b, 2005c; Graham Slater, personal communication, 2005). The North American Industry Classification System (NAICS) replaces the earlier Standard Industry Classification (SIC) system. NAICS codes contain up to six digits; however, sectors were defined at the 3-digit level in this study.

13
unpublished data 2005; USCB, 2003). These six sectors constitute some of Oregon’s major
industries and include both manufacturing and service sectors. Facilities were selected as the
appropriate business unit to survey because studies suggest that environmental management can
vary substantially across facilities within a company; environmental permits are typically issued
at the facility level, and; emission data are typically reported at the facility level (DEQ, 2006;
Rivera and De Leon, 2004; Rivera, De Leon and Koerber, 2006).
To ensure a high response rate, each facility in the sample was contacted by telephone to
verify its mailing address and identify the individual who was most knowledgeable about
environmental management. These contacts resulted in a list of 1,964 eligible facilities after
eliminating facilities that had discontinued business. A description of the sampling and survey
procedures is given in Jones (2007).
Appendix A describes the development of the survey instrument and presents the version
sent to wood products, electronics, and food manufacturing facilities. The sections of the survey
include: (1) environmental management motivations (e.g., investor, regulatory, and
competitiveness pressures) and barriers/costs; (2) environmental management practices (EMPs,
e.g., environmental goals, documented environmental policy, regular environmental audits); (3)
P2 activities (e.g., emphasizing pollution prevention, reducing spills, and choosing raw materials
to reduce impacts); (4) environmental performance (e.g., amounts and changes in waste water
discharged, solid waste landfilled, hazardous/toxic wastes generated); and (5) general
information (e.g., annual facility revenue and publicly traded versus privately owned status).
The survey structure was the same for all sectors; only the performance measures and examples
of voluntary environmental programs were tailored to the individual sectors. Ordered response
and Likert scales were designed in accordance with accepted empirical methods (Fowler, 1995;
Smith and Albaum, 2005).
14
The mail survey was conducted from October 2005 through March 2006. A series of
reminders and additional mailings were sent to improve the response rate. A randomly-selected
subgroup of the mailings was sent Priority Mail with a $5 incentive to increase responses. An
overall response rate of just over 35 percent and 689 responses allows reliable multivariate
analysis and testing (see Table 1).
Self-selection bias is a concern in environmental management surveys because facilities
with stronger environmental programs may be more inclined to respond than those with weak
records. To test for potential bias, we conducted a telephone survey of 900 non-respondents,
selected at random from among all non-respondents. We received responses from 370 facilities
that did not complete the mail survey, for a response rate of just over 41 percent. The survey
included seven questions regarding the firm’s characteristics, environmental regulatory actions,
and reasons for not responding. An analysis of the responses indicated that the non-respondents
did not differ significantly from responding facilities with regard to facility size in terms of
employment levels or environmental regulatory actions: approximately 2 percent of respondents
and non-respondents alike reported receiving an infraction such as a notice of violation or
penalty. The most frequently cited reason for not responding was that the survey was too long
and required too much time, a comment also received by several respondents. In addition, the
non-respondents did not differ significantly from respondents with respect to geographic location
or facility size based on the number of employees (Jones, 2007).4 These findings together
provide a reasonable indication that our results are not significantly affected by substantial non-
response bias. 4 Surveys were sent to facilities in 34 Oregon counties, and responses were received from 31 counties. Among responding counties, the proportions of the state’s population and the proportions of responding facilities varied by no more than 1.1%, and reflected the state’s population distribution. A total of 10 surveys (0.5% or the sample) were sent to the counties that did not respond. These counties comprise 0.5% of Oregon’s population.

15
In summary, the sample is dominated by small, independently-operated facilities, with 69
percent employing fewer than 50 individuals, and 95 percent employing fewer than 250
individuals. Facilities were also primarily independent; just 21 percent reported being owned by
a parent firm. Under 22 percent reported that either the facility or the parent firm had a research
and development (R&D) department, with the vast majority in manufacturing sectors. Less than
one-half of respondents (42 percent) reported selling directly into retail markets (Q24 in
Appendix A). The median number of close competitors reported was six (Q25).
IV. Variables
The following variables used in the econometric analyses were constructed from responses to
survey questions. As such, the quantitative measures used in the empirical analysis represent
responses by facility representatives who were most knowledgeable of their environmental
affairs. In some cases, the responses require subjective assessments, such as rating the strength
of various perceived motivations, while others require objective data to complete. Following the
survey protocols in the Dillman Tailored Design method, including maintaining strict
confidentiality, minimizes the potential for error or bias from the true population measure.
Summary statistics for each variable are presented in Table 2.
Dependent variables
1. Environmental management practices (EMP) – the extent and degree of EMP is
measured with an index constructed using Principal Component Analysis (PCA) of the responses
to Q12a-Q12k (see the Questionnaire in Appendix). PCA optimally weights chosen observed
variables and combines them linearly to create new principal component variables (Kennedy,
2003). Example practice dimensions include the following (for a complete list of practices, see
Appendix A):
16
• Our environmental goals guide operational decisions.
• We conduct environmental audits for our own performance goals, not just for
compliance.
• We require our suppliers to pursue environmentally friendly practices.
This, and the indexes of other motivations constructed using PCA discussed below, are scaled to
range between zero and one, where zero suggests the action or motivation is not present and one
suggests full implementation or a complete motivational force (Hall, 2006).
2. Pollution prevention activities (P2) – the level of pollution prevention actions is
measured with an index of the responses to Q14a-Q14f, constructed using PCA. Example
pollution prevention actions include the following (for a list of all actions, see Appendix A):
• Efforts have been made to reduce spills and leaks of environmental contaminants.
• We choose raw materials that minimize environmental impacts.
• We have modified our production systems to reduce waste and environmental
impacts.
Insufficient survey responses precluded an analysis of the facilities’ environmental
performance.5
5 Extensive efforts were made both to collect data on actual performance outcomes from the survey respondents, and also to supplement responses with secondary data from publicly available sources. These efforts did not generate a sufficient quantity and quality of usable data. Secondary data was collected for those facilities which reported to the US EPA’s Toxic Release Inventory (TRI), or which held one or more environmental regulatory permits. In this sample, only 24 respondents reported to the TRI, and only 240 held an environmental regulatory permit. Regarding primary data, the large numbers of missing responses to the survey questions resulted in a substantial loss of observations, and where responses were received, much of the data could not be considered sufficiently reliable. Regarding missing data, although 95% of respondents answered the compliance questions (questions 15a through 15e in the appendix), and 70 percent responded to at least one question regarding changes in impact levels (question 17a through 17h in the appendix), only 56 percent responded to one or more of the outcome questions (questions 16a through 16h in the appendix). However, performance questions were industry specific, and not all questions could be combined in multi-sector analysis. Within sectors, response rates were low (ranging from 2 to 54 percent, depending on the question), and sample sizes too small, to generate meaningful results that could be extrapolated to the larger marketplace.

17
Explanatory variables
We now describe the specific explanatory variables that are included to estimate the
reduced form equations for EMP and P2 obtained from the general theoretical framework posited
in section II. Each equation is a function of all the exogenous variables in the model.
Institutional (I) pressures
1. Issue: Environmental issues were a significant concern for the facility (yes = 1, no = 0
to Q1). We hypothesize that facilities that recognize that their operations face significant
environmental issues are more likely to implement EMPs. We also hypothesize that this
recognition could lead to more P2 activities. A similar variable indicating the perception of a
significant erosion control problem on farms was significant in explaining the number and extent
of soil conservation practices by farmers (Ervin and Ervin, 1982). Khanna et al (2007) find that
this factor has a significant effect in motivating adoption of a larger number of environmental
management practices (EMP) using count data methods, in a model that excluded reported
institutional pressures, management attitudes and barriers.
2. Consumer pressures – measured with an index constructed using PCA of Q3a-Q3c
We hypothesize that higher levels of perceived pressures by consumers for environmentally-
friendly products and processes are directly related to increased levels of EMP and P2.
Henriques and Sadorsky (1996) found that consumer pressures were a significant motivator in
the adoption of an environmental plan. Khanna and Anton (2002) also found firms facing more
consumer pressures adopt more comprehensive environmental management systems.
3. Interest group pressures – measured with an index constructed using PCA of Q3d-Q3f
We hypothesize that higher levels of pressure by environmental interest groups will increase
EMP and P2. Previous studies have found evidence of this hypothesized effect. Maxwell, Lyon

18
and Hackett (2000) estimated that changes in company emission levels reported to the EPA’s
Toxics Release Inventory (TRI) between 1988 and 1992 were lower in states with more active
environmental organizations. McClelland and Horowitz (1999) found that a sample of paper
mills generally exceeded water pollution regulatory standards and attributed the overcompliance
to community pressures to be a ‘good neighbor’. Henriques and Sadorsky (1996) found that
perceived pressures from lobby groups and neighborhood and community groups were
significant in motivating voluntary actions, while Khanna and Damon (1999) found a similar
effect by trade associations. Most of these studies concerned behavior by larger public firms.
It’s unclear whether the effect extends to environmental action by smaller and private firms.
4. Investor pressures – measured with an index constructed using PCA of Q4a-Q4c
We hypothesize that greater pressure by investors increases facility environmental management.
Alberini and Segerson (2002) and Khanna (2001) conclude that empirical studies have generally
found that stock prices are sensitive to a firm’s environmental performance and, by inference, to
its environmental management effort. By implication, publicly traded firms will undertake more
EMP and P2 than privately owned facilities. It’s possible that investors and their advisers can
more readily screen facility environmental practices than P2 activities, and therefore the effect on
EMP may be stronger.
5. Regulatory pressures – measured with an index constructed using PCA of Q4d-Q4h
We hypothesize that higher perceived pressure from current and future environmental
regulations result in higher levels of EMP and P2. Reviews generally conclude that regulatory
pressure exerts a robust positive effect on environmental management efforts (Alberini and
Segerson, 2002; Khanna, 2001). Our index of regulatory pressures tilts more toward future or
anticipated regulations than current (3 of 5 elements), and therefore may show more influence on
P2 activities.

19
6. Competitive pressures – measured with an index constructed using PCA of Q5a-Q5f
Some investigators hypothesize that increases in various market pressures to keep up with
competitors, reduce costs, differentiate products, and increase productivity lead to higher levels
of environmental management policy and pollution prevention actions (Arora and Cason 1995;
Khanna and Damon 1999). Empirical studies have found mixed effects of competitiveness
influences on environmental management (see survey in Khanna 2001).
Management attitudes toward the environment (α)
7. We measure these with an index constructed using PCA of Q7 a,b,d and f. Elements c
and e of Q7 were not included in this index because their content was more economic in nature.
We hypothesize that upper management attitude supportive of facility environmental stewardship
translates into higher levels of EMP and P2, similar to Nakamura, Takahashi and Vertinsky
(2001). As in that study, we assume that these attitudes are primarily exogenous. The survey did
not set out to collect information to explain the potential causes of these attitudes.
Perceived Facility Barriers (B)
8. Barriers are measured with an index constructed using PCA of Q8a-Q8h. The
potential barriers include high upfront expense, lack of availability of knowledgeable staff, high
day-to-day costs, significant upfront time commitment, uncertain future benefits of
environmental actions, risks of downtime or delivery interruptions during implementation,
contributions to environmental performance not included in performance appraisals, and
employees not being rewarded for contributions to facility environmental performance. These
factors represent either added costs in materials, equipment or staff, resource impediments,
increased risks for operations, or incentive incompatible management policies. Therefore, we
hypothesize that lower levels of the PCA index of perceived barriers will lead to increasing a
20
facility’s environmental friendliness. Environmental management studies have rarely measured
and tested the effects of such barriers to environmental management behavior. Alberini and
Segerson (2002) discuss the information costs associated with gathering information on pollution
abatement techniques and the added transaction costs of voluntary agreements. Nakamura,
Takahashi and Vertinsky (2001) include debt ratio in their analysis to estimate the effect of
increased costs of capital and employee age to capture the slower learning effect of older
workers on implementing environmental management.
Observed Facility characteristics (X)
9. Parent Ownership: Facility was owned by a parent company (yes = 1, no = 0 to Q18).
We hypothesize that parent company ownership makes more resources available to the facility to
develop its environmental policy and strategy, perhaps in the form of templates and guidance on
various EMPs. The parent company may also have information and experience on EMPs and
P2 activities that would make them more attractive to the facility.
10. Multinational: Facility or parent company was a multinational corporation (yes = 1,
no = 0 to Q21). Multinational firms face a more complex environmental management
environment in complying with a mosaic of regulations in multiple countries. This complexity
introduces greater risks from being found in non-compliance. We hypothesize that these risks
lead the facility to adopt higher levels of EMP than facilities that operate solely in the U.S.,
ceteris paribus. Multinationals also may be exposed to a wider array of environmental
management technologies because of their operations in a variety of countries and therefore may
be aware of more EMP and P2 that offer net benefits.
11. Private: Facility or parent company was privately owned (versus publicly traded or
other; yes = 1, no = 0 to Q22). We hypothesize that companies that are privately owned have

21
fewer incentives to adopt environmental practices and pollution-prevention actions than their
publicly traded counterparts because they are not subject to stock market pressures from
environmentally-conscious investors and other stakeholders. This rationale was also articulated
during the pre-survey interviews by a private firm engaged in voluntary environmental
management.
12. Facility R&D or Parent R&D: Facility had its own R&D department (Q23A) or
parent company has an R&D department (Q23B), (base is no R&D capacity). Adoption of P2
practices may also be influenced by a firm’s technological capabilities because strategies to
prevent pollution need to be customized to the particular production processes and products of
the adopting firm. Therefore, pollution prevention is likely to require technical expertise and
related experience. Cohen and Levinthal (1994) refer to these inputs as “complementary internal
expertise.” Indeed, surveys of firms suggest that adopters of pollution prevention techniques are
more innovative in general, with higher R&D intensity and a history of more frequent new
product introductions and product design changes (Florida and Jenkins, 1996). Therefore we
hypothesize that facilities with their own or parent company R&D capacity will adopt higher
levels of P2 practices. It’s also possible that the P2 activities could carry over to adopting more
EMPs to help facilitate their implementation.
13. Facility (Sales) Revenue: Total 2004 facility revenue was less than $25 million
(small, Q28A), or $25- $100 million (medium, Q28B), (base > $100 million; large). Several
investigators have hypothesized that larger firms have more incentive to participate in VEPs than
smaller firms because of economies of scale and more personnel that lower the costs of
participation and the threat of increased exposure to liability because of ‘deep pockets’ (Arora
and Cason, 1995; Khanna, 2001; Lyon and Maxwell, 2004; Videras and Alberini, 2000). We
assume these reasons carry beyond VEP participation to the adoption of EMP. We also

22
hypothesize that larger facilities have more resources to undertake P2 activities that often require
up-front investments than smaller facilities, ceteris paribus. The empirical evidence of the effect
of firm size on environmental effort is mixed and often insignificant. If the analysis does not
control for other motivations and barriers, firm size may be correlated with those factors and
capture some of their influences.
14. Management age: Average age of facility upper management was 20-40 years
(Q29A), or 41-60 (Q29B), (base > 60). Very few studies have examined the effect of
management age on firm environmental management behavior. Nakamura, Takahashi and
Vertinsky (2001) theorize that a lower average age of firm employees may increase firm
environmental actions because younger employees have a higher learning capacity. However,
their measure extends beyond managers to all employees. We hypothesize that older managers
have acquired more human capital over time to become proficient in all aspects of management,
and therefore are more likely to implement higher level of EMPs and to undertake more P2
activities that bring net benefits to the facility.
15. Industry sector: We include dummy variables for each manufacturing and service
sector to capture any sectoral effects on EMP and P2 not reflected by the motivations, barriers
and facility characteristic variables. A dummy variable is also included for those facilities that
did not identify a sector. The base sector for interpreting the coefficients is accommodations.
V. Econometric Results
We estimate reduced form equations for environmental management practices (EMP) and
pollution prevention actions (P2) based on equations (6) and (7) from the theoretical model.
Other studies of the factors affecting facility environmental management actions have used this
econometric approach, e.g., Johnstonne and Labonne (2009); Nakamura, Takahashi and

23
Vertinsky (2001). The equations allow an assessment of the size and significance of the effect of
a hypothesized explanatory variable on the dependent variables while controlling for the
influences of other exogenous factors. Specifically, the following two equations are estimated
using seemingly unrelated regression (SUR) estimation methods:
EMPi =β1’Ii + β2’ Bi + β3’ Xi + β4 αi + ε1i (8)
P2i = γ1’Ii, + γ2’ Bi + γ3’ Xi + γ4 αi + ε2i (9)
where εi’s are error terms.
Table 3 reports the estimations of three specifications of the reduced form equations to
check the robustness of the estimated results. Model 1 includes only the observed facility
characteristics and Issue and is similar to the specification included in Khanna et al. (2007). In
Model 2 we expand upon Model 1 to analyze the influences of perceived institutional pressures
and barriers along with the Issue and facility characteristics. To examine the possibility that
facilities that see the environment as a significant issue for them were also the ones that
perceived greater pressures from the sources described above, we estimate Model 3 while
excluding the variable Issue but including all the other variables in Model 2. We use this to
examine the robustness of the effect of the motivational and barrier variables. All models include
the sector dummies to control for structural differences across sectors that might affect the
decisions of firms to adopt EMP or P2. As more explanatory variables are included in the
model, the system weighted R2 increases from 0.15 to 0.48.
The estimation results for model 1 show that the facilities with Issue equal to one were
more likely to choose a higher level of EMPs and a higher level of P2 activities. Moreover,
facilities owned by a parent company and having an R&D department in the facility or the parent
company were statistically significantly more likely to have a higher level of EMPs. These
findings are consistent with those in Khanna et al. (2007). Additionally, we also find that
24
facilities that were publicly traded and therefore possibly faced greater institutional pressure
from shareholders, as well as those that had their own R&D department had a higher level of P2
activities.
Model 2 shows that with the inclusion of the suite of perceived institutional pressures, the
variable Issue is statistically less significant in explaining the level of EMPs and has an
insignificant effect on the level of P2 activities. Instead we find that a facility is more likely to
adopt more EMPs and P2 activities if a) it believes that a higher level of EMPs will increase its
competitive advantage and b) its upper management has a positive attitude toward environmental
stewardship. The perception that investors value reduced environmental risk is associated with
more EMP activities but not with more P2 activities. On the other hand, a facility is more likely
to take P2 actions if it states that its management desires to improve compliance with existing
and anticipated regulations and to preempt regulations. A facility is less likely to adopt EMPs if
it faces large barriers to environmental management such as high up-front costs, substantial time
investments, and a lack of knowledgeable personnel; however, concerns about such barriers had
an insignificant effect on the adoption of P2 activities. Facilities owned by a parent corporation
are more likely to adopt EMPs, while publicly traded facilities are more likely to engage P2
activities. After controlling for all external pressures, the Issue variable are no longer statistically
significant, suggesting some degree of correlation between Issue and the institutional factors
considered here. It is possible that the facilities for which environmental issues are significant are
those that recognize the market-based and non-market pressures for reducing environmental risks
and improving environmental performance. This model shows that the inclusion of perceived
influences by external stakeholders and upper management attitudes adds to our understanding of
the mechanisms through which institutional pressures, social norms and economic concerns
25
could be playing a role in the extent to which a facility undertake various types of environmental
management.
In Model 3, we exclude Issue but include all the other variables included in Model 2. We
find that signs and significances of the other variables are qualitatively unchanged suggesting
that our results are robust across the various specifications considered here. Specifically, all
models provide robust evidence that pro-environment management attitudes increase the
likelihood of a firm undertaking a higher level of EMP and P2 activities. The uniform
significance and size of the coefficient on the management attitudes variable suggest that a utility
maximization approach can help explain corporate environmental actions. The construct derived
from the four stewardship-related elements in question 7 affirms the importance of these
personal values in business environmental management. It significantly increases the likelihood
of P2 activities suggesting that the influence of upper management attitudes does not end with
the adoption of EMPs, but extends to P2 activities as well.
As noted, institutional forces operating through capital markets in the form of investor
pressures and competitiveness concerns, and perceived facility barriers also exert positive effects
on EMP. The significance of the investor and competitiveness variables in the EMP equation
conforms to findings in several other studies (Dasgupta, Hettige and Wheeler, 2000; Henriques
and Sadorsky, 1996; Khanna and Anton, 2002; Videras and Alberini, 2000). The significance of
the competitiveness variable in the EMP equation suggests that interest in product and process
innovations and other cost-saving or differentiation strategies spread across the industries
surveyed, not just manufacturing. The composite measure of potential barriers, e.g., upfront time
commitment, significantly decreases EMPs. This finding suggests that responding facilities
perceive some significant impediments to improving the environmental friendliness of their
processes, products, and services. The barriers receiving the highest average ratings included

26
high upfront expense, high day-to-day costs, significant upfront time commitment, and uncertain
future benefits (Jones 2007). As noted, few other studies have had the data to conduct
quantitative analysis of the effects of such barriers.
The positive impact of having a parent company suggests those facilities can tap larger
reservoirs of resources to implement EMP than their independently-operated counterparts. The
implications for the design of future environmental policy are important, as only a very small
minority of facilities were owned by parent companies. Finally, facilities operating in the wood
products manufacturing and transportation sectors had significantly higher levels of EMP than
the base sector of accommodations.
In contrast to the level of EMP, a narrower set of factors motivates P2 actions. In
addition to management’s environmental attitudes, perceived regulatory pressure and
competiveness concerns are statistically significant in the P2 equation. This finding supports the
influential role of regulation on environmental activity hypothesized in this and other studies.
However, the impact of regulation does not extend back to more EMP for our sample of
facilities. P2 is more responsive to regulatory pressure than EMP perhaps because P2 has a
more direct effect on environmental compliance than EMP. The significant positive effect of
competitiveness concerns on P2 activities suggests that the sample facilities perceive these
actions as important in maintaining their economic viability. One facility characteristic, public
ownership, significantly increases P2 actions relative to private operations. This significant
effect only occurred in model 3, and therefore should not be considered as robust as the
influences of management attitudes, regulatory pressure and competitiveness concerns. The
finding that privately owned facilities practice significantly fewer P2 techniques supports our
hypothesis that they experience less pressure from environmentally conscious investors and other
stakeholders than their publicly traded counterparts. Finally, the wood products and food

27
manufacturing sectors exhibited significantly higher P2 activities than the accommodations
sector, ceteris paribus. This may reflect the more pollution reduction experience and
opportunities in the two manufacturing sectors that experience broad regulation of their wastes.
Surprisingly, the perceived pressures from consumers and environmental interest groups
and a variety of facility characteristics (e.g., size) are insignificant in the EMP equations. The
insignificance of consumer pressures accords with recent reviews that conclude this factor has
not exerted a large effect on environmental management to date (Alberini and Segerson, 2002;
Khanna, 2001). Environmental interest group pressure also has an insignificant effect on EMPs
and P2 activities. The significant coefficients on the wood products and transportation sector
dummies in the EMP model may be pulling some explanatory power from the interest group
variable. Several studies have found that such groups and environmentally-supportive political
jurisdictions are significantly associated with increased environmental activity (Innes and Sam,
2008). For example, Nisitami (2009) estimated that these stakeholders’ environmental
preferences/pressures influenced Japanese firms’ decisions to adopt ISO 14001.
The insignificance of facility size, measured by annual sales categories, on EMP and P2
intensity contrasts with other studies, which have found that large firms are more likely to
participate in a voluntary environmental program (Arora and Cason, 1995; Dasgupta, Hettige and
Wheeler, 2000; DeCanio and Watkins, 1998; King and Lenox, 2000; Videras and Alberini,
2000).6 Other studies have found facility size plays a significant role in adopting environmental
management systems. For example, Johnstone and Labonne (2009) find that the firms’
motivations for adopting EMSs can be divided into achieving better compliance or improved
6 We also ran the models with firm size defined based on the number of employees. The results stayed the same, that is, all variables that were significant before stayed significant, while variables that were insignificant before remained insignificant. This holds regardless whether small facilities are defined as those with 15, 20, or 25 employees or less and medium facilities are defined as those with 50, 75 or 100 employees or less.

28
performance, and signaling good environmental behavior to other market participants or
regulators. They found the relative importance of these motivations varies systematically by
facility size. Cost factors held more importance for smaller facilities in adopting EMSs, while
signaling exerted a significant influence for larger facilities. Our earlier analysis also found that
larger facilities, measured in terms of employment, were more likely to participate in voluntary
environmental programs, and adopt larger numbers of EMPs, but only if they saw environmental
issues as a serious concern (Khanna et al, 2007).
IV. Conclusions and Policy Implications
The popular press often reports stories of companies that transform their operations to
become more environmentally friendly. A growing number of studies have investigated the
factors that motivate firms to make these transformations. This study adds to that literature by
testing an enlarged set of potential motivations and barriers from both utility maximization and
institutional theories with survey data from a wide spectrum of manufacturing and service
businesses in an environmentally progressive state. We also use two measures of facility action,
environmental management routines and pollution prevention activities, to conduct the tests.
The results provide evidence that a broad suite of market and nonmarket institutional
pressures and internal factors explain business proactive environmental management. The results
also suggest that a combination of economic and institutional theories provides a sound
conceptual base to understand the mechanisms leading firms to adopt EMPs and P2. One of our
most robust findings is that a pro-environmental attitude towards the environment by upper
managers is strongly correlated with higher facility EMP and P2 activities. This result suggests a
utility maximization approach in addition to institutional theory can help understand business

29
environmental activities, similar to what Nakamura, Takahashi and Vertinsky (2001) found for
ISO program adoptions in Japanese firms.
The tests also suggest different sets of influences for the two environmental actions. We
find that surveyed facilities facing more intense competitive pressure for environmental
performance, lower costs (barriers) of adopting responsible environmental management and
greater pressure from investors have implemented higher levels of EMP. Facilities that report
environmental issues as a significant concern also have significantly higher EMP. On the other
hand, facilities reporting a higher level of regulatory pressure and competition and having a
positive attitude toward the environment are more likely to adopt P2 activities. Although our
survey would not permit such a test, the different sets of influences may reflect differing
institutional pressures on the facility departments most interested in each action as theorized by
Delmas and Toffel (2008).
An overarching policy implication flows from the empirical finding of substantially
different sets of significant factors in the EMP and P2 equations. As noted, both internal facility
characteristics and various institutional market factors are statistically significant in the EMP
equation. The diversity suggests that relying principally on a narrow strategy to advance EMP,
especially regulation, will not fare well. Indeed, policy attempts to influence the trajectory of
environmental management by altering just one factor may miss policy targets or be offset by
simultaneous changes in the other forces. For example, offering technical and financial
assistance to lower barriers to environmental management practice adoption may be offset if
these or other policies weaken competitiveness and investor pressures.
Another policy implication is that a facility is more likely to take pollution prevention
actions when it perceives higher regulatory pressures in the future. In an earlier analysis of these
data, regulatory intensity also significantly increased the probability of a facility participating in

30
voluntary environmental programs (Khanna et al, 2007). That finding, coupled with the
significant influence on P2 found in this study, implies that regulatory pressure is a complement
to voluntary environmental effort rather than a substitute for it. The two findings provide robust
support for the importance of perceived regulatory pressure because the two analyses differed in
significant ways, as noted earlier. In this study, the models included management attitudes and
pollution prevention as an added dimension of environmental management, and yet in both sets
of models, regulatory pressure remains a significant variable. The influential role of regulation
supports other theoretical and empirical studies that find credible regulatory threats are necessary
to advance voluntary environmental actions (Alberini and Segerson, 2002; Khanna, 2001; Lyon
and Maxwell, 2004; Segerson and Miceli, 1998). Without the threats, political appeals to
increase voluntary environmental management likely will fall short of public goals for pollution
control and other environmental stewardship objectives.
The study’s findings also provide insight into the roles of institutional pressures outside
of public environmental regulation and internal factors. Key market forces, particularly
competitiveness and investor pressures, along with cost barriers, are statistically significant in the
the environmental management practice equation. This provides evidence that public and private
policy actions to improve the quality of information about facility environmental management
and performance for investors, distribute reliable data on costs and returns of environmental
management practices, advance green technological innovations that aid competitiveness, and
technical assistance and educational programs to lower barriers could accelerate voluntary
environmental activity.
In closing, we identify two lines of inquiry that merit more attention. First, the robust role
of management attitudes toward the environment suggests that they should be an integral
element of business environmental management studies. Our survey was not designed to gather
31
information about the influential forces that explain the formation of such attitudes. This type of
intelligence would help understand the potential roles of private and public educational and other
measures to encourage a larger number of managers to pursue cost-effective voluntary actions.
Second, the integration of utility maximization and institutional theories appears to offer a more
powerful framework for understanding business environmental behaviors than one without the
other. We made a modest first attempt at this integration but believe carefully designed surveys
could provide richer details on the interaction of the two sets of forces. Findings from both lines
of inquiry would contribute to an improved understanding of effective strategies to induce
greater voluntary environmental effort by industry.
Acknowledgments
We are grateful for the valuable comments of three anonymous Journal reviewers whose
insights and suggestions significantly improved the content and clarity of this paper. The
research reported here comes from the project “Oregon Business Decisions for Environmental
Performance” funded by the U.S. Environmental Protection Agency (EPA) Program on
Corporate Environmental Behavior and Effectiveness of Government Intervention, June 2003 –
June 2007. Ervin and Wu are the senior co-authors of this paper. The authors thank Cameron
Speir for his valuable contributions to the survey development and enumeration and database
construction. Ervin acknowledges the helpful comments from seminar participants at Michigan
State University’s Elton R. Smith lecture series, the College of William and Mary, Reed College,
and the Organization for Economic Cooperation and Development, the valuable technical editing
assistance by Karen Carskadon, and helpful statistical support by Xixi Wang. Any opinions
expressed here are the authors’ and do not reflect the views or policies of the EPA.

32
References
Alberini, A. and K. Segerson, 2002. Assessing voluntary programs to improve environmental
quality. Environmental and Resource Economics 22(1-2): 157-184.
Anton, W., G. Deltas, and M. Khanna, 2004. Environmental management systems: Do they
improve environmental performance? Journal of Environmental Economics and
Management 48(1): 632-654.
Arora, S. and T. N. Cason, 1995. An experiment in voluntary environmental regulation:
Participation in EPA’s 33/50 Program. Journal of Environmental Economics and
Management 28(3): 271-287.
Arora, S. and S. Gangopadhyay, 1995. Toward a theoretical model of voluntary
overcompliance. Journal of Economic Behavior and Organization 28(3): 289-309.
Auld, G. S. Bernstein, and B. Cashore, 2008 “The New Corporate Social Responsibility”
Annual Review of Environment and Resources, Vol. 33: 413-435.
Baron, D.P. 2001. Private politics, corporate social responsibility, and integrated strategy.
Journal of Economics and Management Strategy 10(1): 7-45
Brau, R. and C. Carraro, 1999. Voluntary approaches, market structure and competition. CAVA
Working Paper 99/08/1. Paris, CERNA (Centre d’Économie Industrielle).
Cohen, M.A., 1997. “Firm Response to Environmental Regulation and Environmental
Pressures.” Managerial and Decision Economics 18:417-420.
Cohen, W. and D. Levinthal, 1994. Fortune favors the prepared firm. Management Science
40(2): 227-251.
Cordano, M and I.H. Frieze, 2000. “Pollution Reduction Preferences of U.S. Environmental
Managers: Applying Ajzen’s Theory of Planned Behavior” Academy of Management
Journal, 43 (4): 627-641.Dasgupta, S., H. Hettige, and D. Wheeler, 2000. What improves

33
environmental compliance? Evidence from Mexican industry. Journal of Environmental
Economics and Management 39(1): 39-66.
Darnall, N., I. Henriques and P. Sadorsky. 2008. “Do Environmental Management Systems
Improve Business Performance in an International Setting?” Journal of International
Management (14): 364-376.
DeCanio, S. J. and W. E. Watkins, 1998. Investment in energy efficiency: Do the characteristics
of firms matter? Review of Economic Statistics 80(1): 95-107.
deLeone, P. and J. Rivera, editors. 2009. Voluntary Environmental Programs: A Policy
Perspective. Plymouth (UK): Lexington.
Delmas, M. and M. W. Toffel. 2004. Stakeholders and environmental management practices:
An institutional framework. Business Strategy and the Environment 13(4): 209-222.
Delmas, M. and M. W. Toffel. 2008. Organizational responses to environmental demands:
Opening the Black box,” Strategic Management Journal., 29: 1027–1055.
Dillman, D., 2000. Mail and Internet Surveys: The Tailored Design Method, Second Edition.
New York, John Wiley & Sons, 464 pp.
Ervin, C. and D. Ervin, 1982. Factors affecting the use of soil conservation practices:
Hypotheses, evidence, and policy implications. Land Economics 58(3): 277-292.
Esty, D. C. and A. S. Winston, 2006. Green to gold: How smart companies use environmental
strategy to innovate, create value, and build competitive advantage. New Haven, Yale
University Press, 366 pp.
Florida, R. and P. D. Jenkins,1996. Adoption of organizational innovations by Japanese
transplants. Heinz School Working Paper. Pittsburg: Carnegie Mellon University.

34
Florida R, Davison D. 2001. Gaining from green management: environmental
management systems inside and outside the factory. California Management Review
43: 64.
Fowler, F. J., 1995. Improving survey questions: Design and evaluation. Thousand Oaks,
California: Sage Publications, 190 pp.
Garvie, D., 1997. Self-regulation of pollution: The role of market structure and consumer
information. Fondazione Eni Enrico Mattei (FEEM) Working Paper 59.97. Milan: FEEM.
Glachant, M., 1999. The cost efficiency of voluntary agreements for regulating industrial
pollution: A Coasean approach. In: Cararo, F. Lévêque (Editors), Voluntary Approaches in
Environmental Policy, Fondazione Eni Enrico Mattei (FEEM) Series on Economics, Energy,
Environment. C. S. Dordrecht, Kluwer Academic Publishers, pp. 75-90.
Greene, W. H. 2003. Econometric Analysis, Fifth Edition. New York: Macmillan Publishing
Company, 1026 pp.
———, 2002. Greene, W. H., 2002. Econometric modeling guide, volumes 1 and 2. New York:
Econometric Software, Inc.
Hall, T., 2006. Business decisions for voluntary environmental management:
motivations, actions and outcomes. Masters thesis. Corvallis, Oregon, Oregon State
University.
Henriques, I. and P. Sadorsky, 1996. The determinants of an environmentally responsive firm:
An empirical approach. Journal of Environmental and Economics and Management 30(3):
381-395.
Innes, R. and A. G. Sam, 2008. Voluntary pollution reductions and the enforcement of
environmental law: An empirical study of the 33/50 Program. Journal of Law and
35
Economics 51(2): 271-296.
Johnstone, N. and J. Labonne, 2009. Why do manufacturing facilities introduce environmental
management systems? Improving and/or signaling performance. Ecological Economics
68(2009): 719-730.
Jones, C. 2007. Voluntary environmental program participation in selected Oregon
manufacturing, construction, accommodation, and transport sectors: Perceived influences on
participation and effects on effort and outcomes. Master’s project. Portland, Oregon,
Portland State University.
Jones, Cody. 2008. What’s regulation got to do with it? Examining the impact of regulatory
intensity on facility environmental management and performance. Doctoral dissertation.
Portland State University: Portland, OR Kennedy, P., 2003. A guide to econometrics, Fifth
Edition. Cambridge, Massachusetts, MIT Press.
Khanna, M., 2001. Nonmandatory approaches to environmental regulation: A survey. Journal
of Economic Surveys 15(3): 291-324.
Khanna, M. and W. R. Q. Anton, 2002. Corporate environmental management: Regulatory and
market-based pressures. Land Economics 78(4): 539-558.
Khanna, M. and L. Damon, 1999. EPA’s Voluntary 33/50 Program: Impact on toxic releases
and economic performance of firms. Journal of Environmental and Economics and
Management 37(1): 1-25.
Khanna, M., P. Koss, C. Jones, and D. Ervin, 2007. Motivations for voluntary environmental
management. Policy Studies Journal 35(4): 751-772.
King, A. and M. J. Lenox, 2000. Industry self-regulation without sanctions: The chemical
industry’s Responsible Care Program. Academy of Management Journal 43(4): 698-716.

36
Konar, S., and M.A. Cohen. 1997. “Information as regulation: The effect of community right to
know laws on toxic emissions.” Journal of Environmental Economics and Management
32:109-124.
Konar, S., and M.A. Cohen. 1997. “Does the Market Value Environmental Performance?.” The
Review of Economics and Statistics 83: 281-289.
Kristom, B. and T. Lundgren, 2003. "Abatement investments and green goodwill," Applied
Economics 35(18): 1915-1921
Lutz, S., T. P. Lyon, and J. W. Maxwell. 2000. “Quality Leadership when Regulation Standards
are Forthcoming.” Journal of Industrial Economics 48 (3): 331-48.Lyon, T. P. and J. W.
Maxwell, 2004. Corporate environmentalism and public policy. Cambridge, UK:
Cambridge University Press, 191 pp.
Marshall, R. Scott, M. Cordano, and M. Silverman. 2005. “Exploring individual and
institutional drivers of proactive environmentalism in the US wine industry.” Business Strategy
and the Environment 14(2): 92-109.
Maxwell, J. W., T. P. Lyon, and S. Hackett, 2000. Self-regulation and social welfare: The
political economy of corporate environmentalism. Journal of Law and Economics 43(2):
583-617.
McClelland, J. D. and J. K. Horowitz, 1999. The costs of water pollution regulation in the pulp
and paper industry. Land Economics 75(2): 220-232.
Nakamura, M. T. Takahashi, and I. Vertinsky, 2001. Why Japanese firms choose to certify: A
study of managerial responses to environmental issues. Journal of Environmental and
Economics and Management 42(1): 23-52.
Nash, J., 2000. “Voluntary Codes of Practice: Non-Governmental Institutions for Promoting
Environmental Management in Firms,” National Academy of Sciences /National Research
37
Council Workshop on Education, Information and Voluntary Measures in Environmental
Protection, Washington D.C., November.
Nishitani, K., 2009. An empirical study of the initial adoption of ISO 14001 in
Japanese manufacturing firms. Ecological Economics 68(2009): 669-679.
Organization for Economic Cooperation and Development (OECD), 2003. Pollution abatement
and control expenditures in OECD countries. OECD Report ENV/EPOC/SE (2003)1. Paris,
OECD, 131 pp.
Portney, P. R., 2005. Corporate social responsibility: An economic and public policy
perspective. In: B. L. Hay, R. N. Stavins, and R. H.K. Vietor (Editors), Environmental
Protection and the Social Responsibility of Firms: Perspectives from Law, Economics, and
Business. Washington, D.C., Resources for the Future, pp. 107-131.
Powell, W. and P. Dimaggio, 1991. The New Instituionalism in Organizational Analysis.
Chicago: University of Chicago Press.
Reinhardt, F. L., 2005. Environmental protection and the social responsibility of firms:
Perspectives from the business literature. In: B. L. Hay, R. N. Stavins, and R. H.K. Vietor
(Editors), Environmental protection and the social responsibility of firms: Perspectives from
law, economics, and business. Washington, D.C., Resources for the Future, pp. 151-183.
———, 2000. Down to Earth: Applying principles to environmental management. Boston,
Harvard Business School Press, 291 pp.
Rivera, J. and P. De Leon, 2004. Is greener whiter? The Sustainable Slopes Program and the
voluntary environmental performance of western ski areas. Policy Studies Journal 32(3):
417-437.
Rivera, J. P. De Leon, and C. Koerber, 2006. Is greener whiter yet? The Sustainable Slopes
Program after five years. Policy Studies Journal 34(2): 195-224.
38
Salop, S.C. and D.T. Scheffman, 2006. Raising rivals’ costs. The American Economic Review
73(2): 267-271.
Scott, R.W. 2001. Institutions and Organizations. 2nd ed. Thousand Oaks, CA: Sage Publications
Segerson, K. and T. J. Miceli, 1999. Voluntary approaches to environmental protection: The
role of legislative threats. In: C. Cararo, F. Lévêque (Editors), Voluntary Approaches in
Environmental Policy. Fondazione Eni Enrico Mattei (FEEM) Series on Economics, Energy,
Environment. Dordrecht: Kluwer Academic Publishers, pp. 105-120.
———, 1998. Voluntary environmental agreements: Good or bad news for environmental
protection? Journal of Environmental Economics and Management 36(2): 109-130.
Smith, S. M. and G. S. Albaum, 2005. Fundamentals of Marketing Research. Thousand Oaks,
California: Sage Publications.
State of Oregon, 2005a. Oregon Revised Statutes, 2005 Edition, Statute 455.422. Salem,
Oregon: State of Oregon.
———, 2005b. Oregon Revised Statutes, 2005 Edition, Statute 459A.010. Salem, Oregon:
State of Oregon.
———, 2005c. Oregon Revised Statutes, 2005 Edition, Statute 657.665(3). Salem, Oregon:
State of Oregon.
State of Oregon., Department of Environmental Quality (DEQ), 2006. Permit handbook.
Portland, Oregon: DEQ, 64 pp.
State of Oregon, Department of Revenue (DOR), 2004. Oregon corporate excise and income
tax: Characteristics of corporate taxpayers, 2004 edition, covering fiscal year 2004 corporate
tax receipts and tax year 2002 corporate tax returns.” Report 150-102-405, Revised
December 2004. Salem, Oregon: DOR, 100 pp.
U.S. Census Bureau (USCB), 2003. Statistics of U.S. Business. Washington, D.C.: USCB.
39
US Department of Energy (US DOE) 2006. 2006 Buildings Energy Data Book, revised
December 6, 2006. Available at: http://buildingsdatabook.eere.energy.gov/. Accessed
January 12, 2007Videras, J. and A. Alberini, 2000. The appeal of voluntary environmental
programs: Which firms participate and why? Contemporary Economic Policy 18 (2000):
449-461.
Vogan, C. R., 1996. Pollution abatement and control expenditures, 1972-94. Survey of
Current Business 76(9): 48-67.
Wu, J. 2009. Environmental compliance: the good, the bad, and the super green. Journal of
Environmental Management. doi:10.1016/j.jenvman.2009.05.017.
Wu, J., and T. M. Wirkkala. 2009. Firms’ motivations for environmental overcompliance.
Review of Law and Economics 5: 399-433. http://www.bepress.com/rle/vol5/iss1/art17.
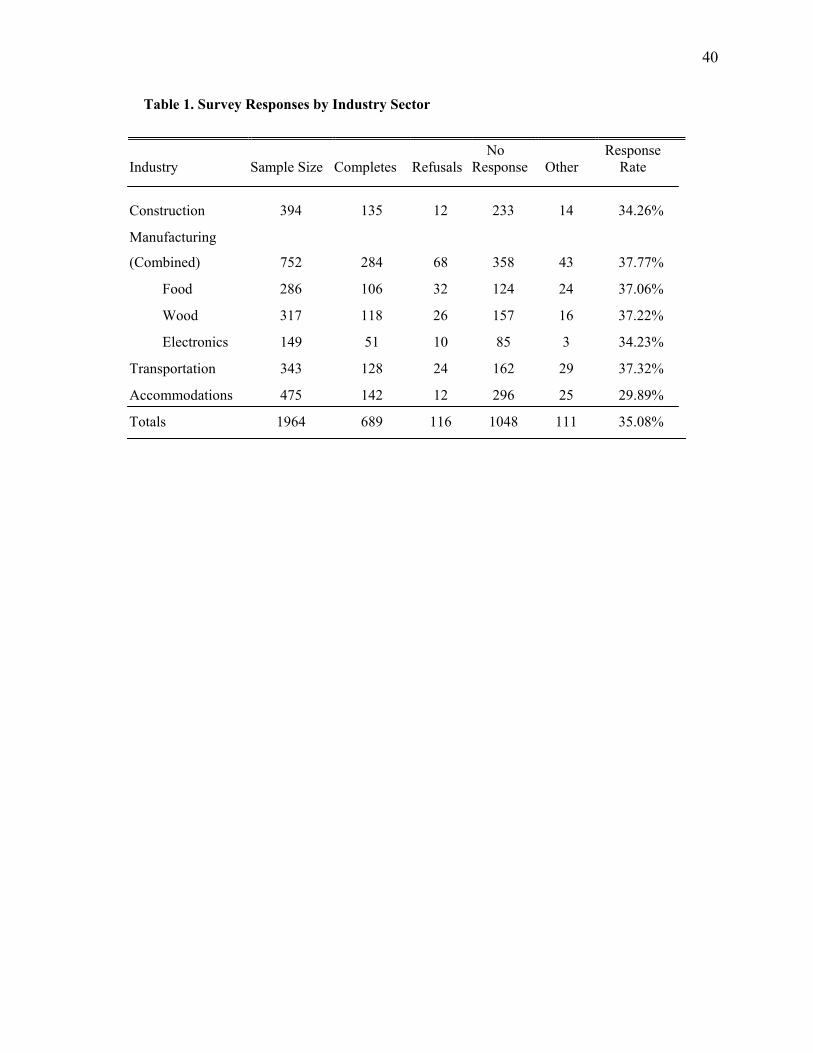
40
Table 1. Survey Responses by Industry Sector
Industry Sample Size Completes Refusals No Response Other
Response Rate
Construction 394 135 12 233 14 34.26%
Manufacturing
(Combined) 752 284 68 358 43 37.77%
Food 286 106 32 124 24 37.06%
Wood 317 118 26 157 16 37.22%
Electronics 149 51 10 85 3 34.23%
Transportation 343 128 24 162 29 37.32%
Accommodations 475 142 12 296 25 29.89%
Totals 1964 689 116 1048 111 35.08%

41
Table 2. Summary Statistics Variable Definition N Mean Std Dev Min Max EM Predicted environmental management policy score 507 0.412 0.228 0 1 P2 Predicted P2 action score 565 0.701 0.198 0 1 EP Predicted environmental performance score 305 0.562 0.129 0 1 Consumer Index of the importance of consumer demand for environmentally friendly goods and
services, willingness to pay for such goods and services, and the ability to earn public recognition and goodwill (Q3a-Q3c)
616 0.402 0.290 0 1
Interest group Index of the importance of interest group perceptions of the environment as a critical issue, the threat of boycotts, and the ability to promote an environmentally friendly image to interest groups (Q3d-Q3f)
623 0.276 0.265 0 1
Investor Index of the importance of investor desires for reduced environmental risk, enhancing facility value for investors, and lenders desires for reduced environmental risk (Q4a-Q4c)
599 0.501 0.311 0 1
Regulatory Index of the importance of complying with existing regulations, gaining regulatory relief, preparing for anticipated regulations, and preempting future regulations (Q4d-Q4f)
588 0.555 0.295 0 1
Competition Index of the importance of competitive advantages such as the ability to differentiate products or the facility, keeping up with competitors, innovations, reducing costs, and increasing employee productivity (Q5a-Q5f)
602 0.415 0.274 0 1
Management Index of the importance of management attitudes toward environmental stewardship, including belief in environmental responsibility, supporting environmental protection, conserving resources, and that environmental performance has stakeholder and financial benefits (Q7a, Q7b, Q7d, Q7f)
612 0.720 0.204 0 1
Barriers Index of the importance of barriers such as high up-front costs, substantial time investments, uncertain benefits, and a lack of knowledgeable personnel (Q8a-Q8h)
479 0.486 0.234 0 1
Issue Environmental issues are a significant concern for the facility (yes = 1, no =0) 689 0.524 0.498 0 1 Parent ownership The facility was owned by a parent company (yes = 1, no = 0) 689 0.212 0.410 0 1 Multinational operations The facility was a multinational corporation (yes = 1, no = 0) 689 0.127 0.334 0 1 Private ownership The facility was privately owned (versus publicly traded or other; yes =1, no = 0) 689 0.823 0.382 0 1 Facility R&D The facility had its own R&D department (yes = 1, no = 0) 689 0.138 0.345 0 1 Parent R&D The facility’s parent company had an R&D department (yes = 1, no = 0) 689 0.078 0.268 0 1 Small facility revenue Total 2004 facility revenue was less than $25 million (yes = 1, no = 0) 689 0.533 0.499 0 1 Medium facility revenue Total 2004 facility revenue was $25 - $100 million (yes = 1, no = 0) 689 0.111 0.314 0 1 Management age 41-60 Average age of facility upper management was 41-60 years (yes = 1, no = 0) 507 0.777 0.416 0 1 Management age over 60 Average age of facility upper management was over 60 years (yes = 1, no = 0) 565 0.054 0.226 0 1
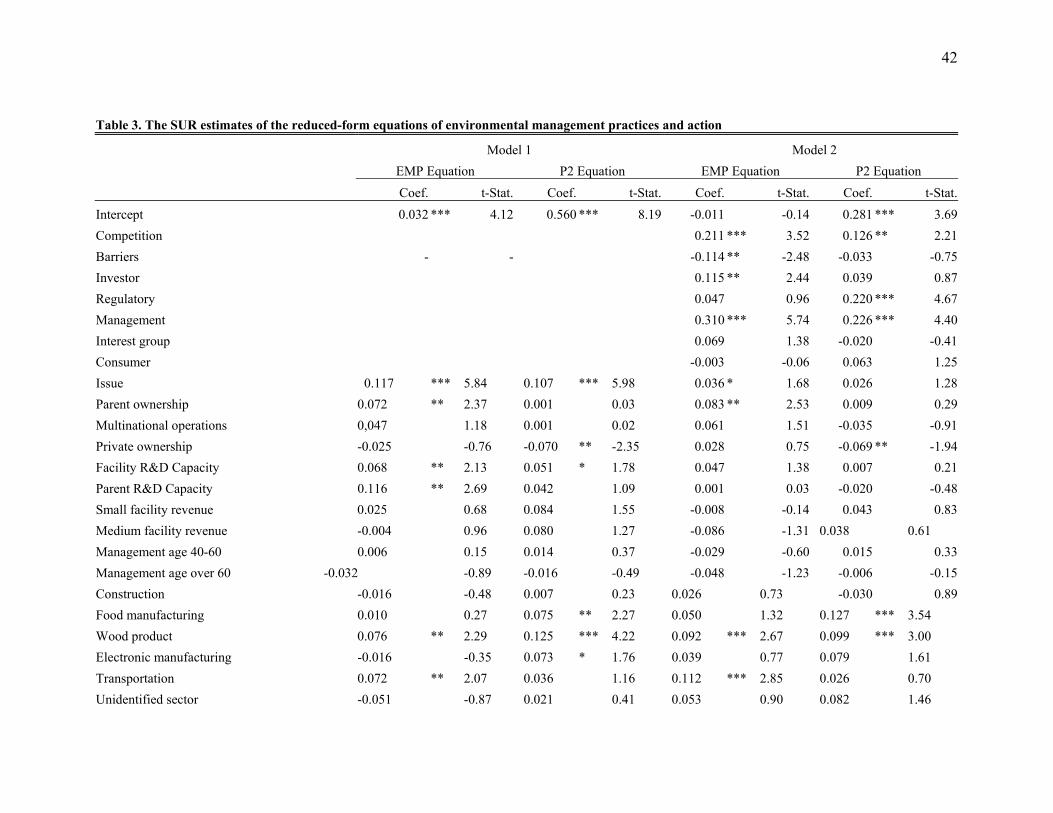
42
Table 3. The SUR estimates of the reduced-form equations of environmental management practices and action
Model 1 Model 2 EMP Equation P2 Equation EMP Equation P2 Equation Coef. t-Stat. Coef. t-Stat. Coef. t-Stat. Coef. t-Stat.Intercept 0.032 *** 4.12 0.560 *** 8.19 -0.011 -0.14 0.281 *** 3.69Competition 0.211 *** 3.52 0.126 ** 2.21Barriers - - -0.114 ** -2.48 -0.033 -0.75Investor 0.115 ** 2.44 0.039 0.87Regulatory 0.047 0.96 0.220 *** 4.67Management 0.310 *** 5.74 0.226 *** 4.40Interest group 0.069 1.38 -0.020 -0.41Consumer -0.003 -0.06 0.063 1.25Issue 0.117 *** 5.84 0.107 *** 5.98 0.036 * 1.68 0.026 1.28Parent ownership 0.072 ** 2.37 0.001 0.03 0.083 ** 2.53 0.009 0.29Multinational operations 0,047 1.18 0.001 0.02 0.061 1.51 -0.035 -0.91Private ownership -0.025 -0.76 -0.070 ** -2.35 0.028 0.75 -0.069 ** -1.94Facility R&D Capacity 0.068 ** 2.13 0.051 * 1.78 0.047 1.38 0.007 0.21Parent R&D Capacity 0.116 ** 2.69 0.042 1.09 0.001 0.03 -0.020 -0.48Small facility revenue 0.025 0.68 0.084 1.55 -0.008 -0.14 0.043 0.83Medium facility revenue -0.004 0.96 0.080 1.27 -0.086 -1.31 0.038 0.61 Management age 40-60 0.006 0.15 0.014 0.37 -0.029 -0.60 0.015 0.33Management age over 60 -0.032 -0.89 -0.016 -0.49 -0.048 -1.23 -0.006 -0.15Construction -0.016 -0.48 0.007 0.23 0.026 0.73 -0.030 0.89Food manufacturing 0.010 0.27 0.075 ** 2.27 0.050 1.32 0.127 *** 3.54 Wood product 0.076 ** 2.29 0.125 *** 4.22 0.092 *** 2.67 0.099 *** 3.00 Electronic manufacturing -0.016 -0.35 0.073 * 1.76 0.039 0.77 0.079 1.61 Transportation 0.072 ** 2.07 0.036 1.16 0.112 *** 2.85 0.026 0.70 Unidentified sector -0.051 -0.87 0.021 0.41 0.053 0.90 0.082 1.46
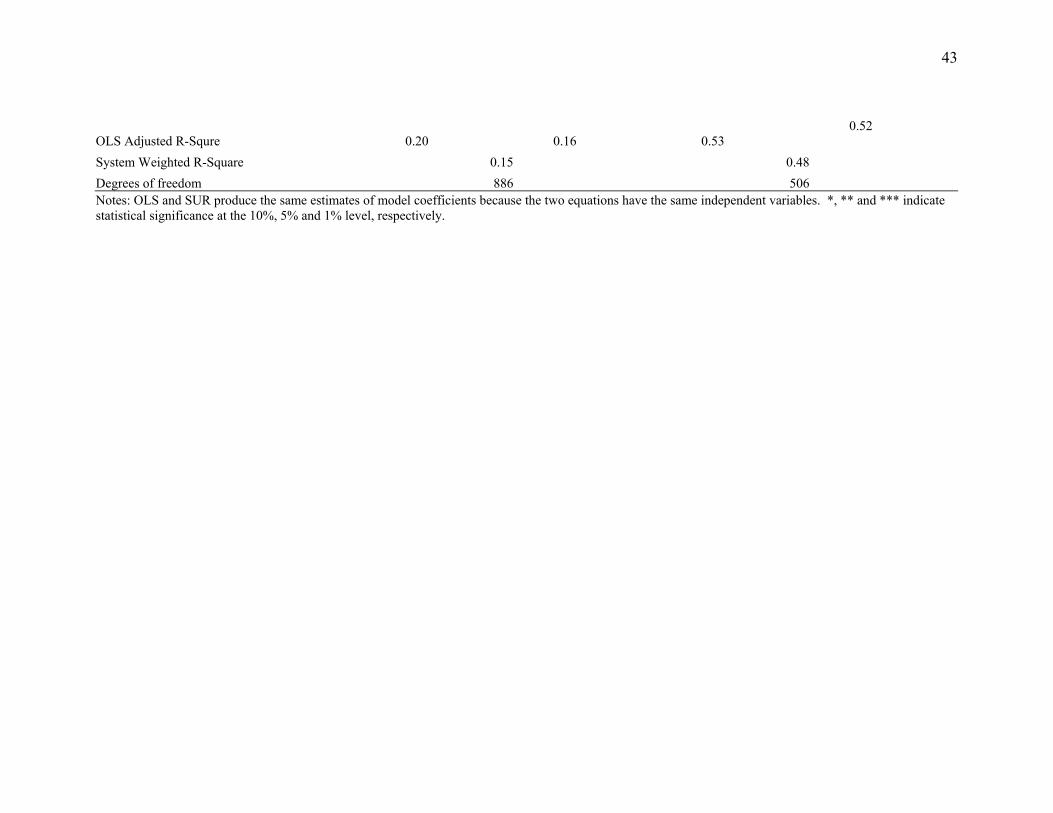
43
OLS Adjusted R-Squre 0.20 0.16 0.53 0.52
System Weighted R-Square 0.15 0.48 Degrees of freedom 886 506 Notes: OLS and SUR produce the same estimates of model coefficients because the two equations have the same independent variables. *, ** and *** indicate statistical significance at the 10%, 5% and 1% level, respectively.

44
Table 3, Continued. The SUR estimates of the reduced-form equations of environmental management policy and action
Model 3 EM Equation P2 Equation Coef. t-Stat. Coef. t-Stat.Intercept -0.005 -0.16 0.286 *** 3.76Competition 0.214 *** 3.55 0.129 ** 2.25Barriers -0.108 ** -2.36 -0.028 -0.65Investor 0.122 ** 2.59 0.044 0.99Regulatory 0.053 1.08 0.224 *** 4.77Management 0.319 *** 5.91 0.233 *** 4.54Interest group 0.066 1.32 -0.022 -0.45Consumer 0.003 0.06 0.068 1.34Issue Parent ownership 0.090 *** 2.73 0.013 0.43Multinational operations 0.058 1.43 -0.037 -0.97Private ownership 0.029 0.76 -0.068 * -1.94Facility R&D Capacity 0.050 1.47 0.007 0.21Parent R&D Capacity -0.010 -0.23 -0.020 -0.48Small facility revenue -0.014 -0.26 0.043 0.83Medium facility revenue -0.089 -1.37 0.038 0.61Management age 40-60 -0.037 -0.76 0.015 0.33Management age over 60 -0.047 -1.20 -0.006 -0.15Construction 0.023 0.65 0.030 0.89Food manufacturing 0.022 1.30 0.127 *** 3.54Wood product 0.089 ** 2.58 0.099 *** 3Electronic manufacturing 0.036 0.65 0.079 1.61Transportation 0.109 *** 2.76 0.026 0.7Unidentified sector 0.062 1.06 0.082 1.46

45
OLS Adjusted R-Squre 0.52 0.47 System Weighted R-Square 0.47 Degrees of freedom 508 Notes: OLS and SUR produce the same estimates of model coefficients because the two equations have the same independent variables. *, ** and *** indicate statistical significance at the 10%, 5% and 1% level, respectively.

46Appendix A
Oregon Business Environmental Management Survey Instrument for Manufacturing Sectors
Twenty telephone interviews were conducted with experienced environmental managers and
business decision-makers to begin construction of the survey instrument. These interviews revealed that
firms had multiple motivations for BEM and used a variety of methods to collect, monitor, audit, and
report environmental information. Upper management philosophy was found to be quite influential in a
firm’s decision to engage or not engage in voluntary environmental management.
The survey instrument was developed in collaboration with the Social and Economic Sciences
Research Center (SESRC) at Washington State University using principles from the Tailored Design
Method (Dillman 2000). The questions were designed to elicit responses based on feedback from the
telephone interviews and reviews of the corporate environmental management theoretical and empirical
literature to identify significant influences in BEM. The instrument was pre-tested at several firms,
including a commercial building contractor, two hotels, a major electronics manufacturer, and a
prominent wood products manufacturer. Based on the pretests, the environmental performance questions
were revised for simplicity and relevance to each sector.

47
SSeeccttiioonn II.. FFaacciilliittyy EEnnvviirroonnmmeennttaall MMaannaaggeemmeenntt Q1. Are environmental issues a significant concern for your facility?
A facility is typically a single physical location at the address where this survey was received or the location designated on the cover.
1 No Skip to Question 3 2 Yes
Q2. If yes, please list one or two of the most significant environmental concerns for your facility.
Q3. Please indicate the extent each of the following factors has influenced environmental management at
your facility in the last 5 years. (Please check only ONE box for each factor.) No Great Do Not Influence Influence Know ▼ ▼ ▼ ▼ ▼ ▼ a. Customer desire for environmentally friendly products and services .......................................... 1 2 3 4 5 D b. Customer willingness to pay higher prices for environmentally friendly products/services.... 1 2 3 4 5 D c. Ability to earn public recognition and customer goodwill with environmentally friendly actions .. 1 2 3 4 5 D d. Environmental interest groups’ perception that environmental protection is a critical issue .......... 1 2 3 4 5 D e. Preventing boycotts or other adverse actions by environmental interest groups ......................... 1 2 3 4 5 D f. Promoting an environmentally friendly image to environmental interest groups .......................... 1 2 3 4 5 D

48Q4. For your facility, please indicate the priority of each of the following factors in encouraging
environmental management in the last 5 years. (Please check only ONE box for each factor).
No Great Do Not Priority Priority Know ▼ ▼ ▼ ▼ ▼ ▼
a. Satisfying investor (owner) desires to reduce environmental risks and liabilities........................ 1 2 3 4 5 D
b. Protecting or enhancing the value of the facility or parent firm for investors (owners).................. 1 2 3 4 5 D
c. Satisfying lenders’ desires to reduce environmental risks and liabilities........................ 1 2 3 4 5 D
d. Complying with current government environmental regulations.................................... 1 2 3 4 5 D
e. Taking environmentally friendly actions to reduce regulatory inspections and make it easier to get environmental permits ..................... 1 2 3 4 5 D
f. Being better prepared for meeting anticipated environmental regulations ................. 1 2 3 4 5 D
g. Preempting future environmental regulations by voluntarily reducing regulated pollution beyond compliance levels (for example, air particulate emissions) .............. 1 2 3 4 5 D
h. Preempting future environmental regulations by voluntarily reducing unregulated impacts (for example, carbon dioxide) ................ 1 2 3 4 5 D
Q5. Please indicate the extent that each of the following factors has influenced environmental management at your facility in the last 5 years. (Please check only ONE box for each factor.)
No Great Do Not Influence Influence Know ▼ ▼ ▼ ▼ ▼ ▼
a. Investing in cleaner products and services differentiates our products or our facility............. 1 2 3 4 5 D
b. Improving environmental performance helps us keep up with competitors. ...................... 1 2 3 4 5 D
c. Environmentally friendly actions result in product or process innovations............................. 1 2 3 4 5 D
d. Environmentally friendly actions can reduce costs .......................................................... 1 2 3 4 5 D
e. Being environmentally responsible attracts quality employees and reduces employee turnover.......... 1 2 3 4 5 D
f. Being environmentally responsible improves employee morale, motivation and productivity.... 1 2 3 4 5 D

49Q6. Please indicate the percentage of your facility’s annual revenue spent on environmental management
(for example, energy and water conservation, recycling, pollution reduction, compliance inspections, audits, etc.) for the 2003 and 2004 calendar years. (Please check only ONE box for each year.)
Less 1% 2% 3% 5% 10% More than up to up to up to up to up to than 1% 2% 3% 5% 10% 20% 20% ▼ ▼ ▼ ▼ ▼ ▼ ▼
2004 Calendar Year ....................................................... 1 2 3 4 5 6 7 2003 Calendar Year ....................................................... 1 2 3 4 5 6 7 Q7. For your facility, please indicate the extent of your agreement or disagreement with the following
statements. (Please check only ONE box for each statement). Neither
Agree Strongly Somewhat nor Somewhat Strongly Do Not Disagree Disagree Disagree Agree Agree Know ▼ ▼ ▼ ▼ ▼ ▼
a. Facility upper management believes it has a moral responsibility to protect the environment. ........ 1 2 3 4 5 D b. Facility upper management supports protecting the environment even if substantial costs are incurred . ... 1 2 3 4 5 D c. Facility upper management believes that improvements in environmental performance will improve long-term financial performance. .......... 1 2 3 4 5 D
d. Facility upper management believes that customers and other stakeholders care about the environmental impacts of its products................... 1 2 3 4 5 D
e. Facility upper management believes that advances in technology can solve environmental problems while increasing profits at the same time......................... 1 2 3 4 5 D
f. Facility upper management believes that the facility should help conserve society’s limited natural resources ...................................................... 1 2 3 4 5 D
Q8. For your facility, please indicate the extent to which the following factors are barriers to increasing
the environmental friendliness of your processes, products, and/or services. (Please check only ONE box for each factor.)
No Large Do Not Barrier Barrier Know ▼ ▼ ▼ ▼ ▼ ▼ a. High upfront investment expense .................................. 1 2 3 4 5 D b. Availability of knowledgeable staff ............................... 1 2 3 4 5 D c. High day-to-day costs..................................................... 1 2 3 4 5 D d. Significant upfront time commitment ............................ 1 2 3 4 5 D e. Uncertain future benefits. ............................................... 1 2 3 4 5 D f. Risk of downtime or delivery interruptions
during implementation ................................................ 1 2 3 4 5 D g. Contributions to environmental performance are not included in performance appraisals................. 1 2 3 4 5 D h. Employees are not rewarded for contributions to environmental performance ........................................ 1 2 3 4 5 D

50
SSeeccttiioonn IIII.. FFaacciilliittyy EEnnvviirroonnmmeennttaall PPrraaccttiicceess Q9. Please indicate the types of employee involvement in environmental management at your facility.
(Check ALL types that apply.)
Dedicated environmental staff (For example, environmental, health, and safety managers, compliance specialists, etc.)
_________ Total number of full time equivalents (FTEs) in dedicated environmental positions (Count an employee who works half time on environmental management as 0.50 FTE, etc.)
Other staff with official environmental responsibilities (For example, production managers with official responsibility for environmental audits)
Staff who participate in environmental management on a voluntary basis (For example, employees who volunteer for environmental audits)
Environmental management is the responsibility of all employees Other ___________________________________________________________________
Q10. Who is primarily responsible for the majority of environmental decisions, including which
environmental practices to implement, at your facility? (Please check only ONE box.)
1 Owner 2 President or CEO 3 Vice President Title or Area of responsibility: 4 Director Title or Area of responsibility: 5 Executive Committee 6 Plant Manager/Facility Manager 7 Environmental Heath and Safety Manager 8 Other Environmental Manager (compliance, sustainability, etc.)
Title or Area of responsibility: 9 Other (Please specify)
Q11. For your facility, please indicate whether or not the following environmentally friendly practices have been implemented, and if yes, the year of implementation. (Please check only ONE box for each practice.)
No Yes Year Implemented a. Well-defined environmental goals .......................................... 1 2 b. Documented environmental policy ......................................... 1 2 c. Green purchasing policy ......................................................... 1 2 d. Environmental standards for suppliers .................................... 1 2 e. Environmental audits at regular intervals ............................... 1 2 f. Internal environmental standards ........................................... 1 2 g. Cost accounting to identify environmental problems and costs ............................................................... 1 2 h. Periodic publishing of environmental information in reports made available to the public ................................... 1 2 i. Environmental training for employees .................................... 1 2 j. Compensation to employees for their contributions to environmental performance ................................................ 1 2 k. ISO 14001 certification ........................................................... 1 2

51
Q12. For your facility, please indicate the extent of your agreement or disagreement with the following statements. (Please check only ONE box for each statement.)
Neither Agree Strongly Somewhat nor Somewhat Strongly Do Not Disagree Disagree Disagree Agree Agree Know ▼ ▼ ▼ ▼ ▼ ▼ a. Our environmental goals guide operational decisions...................................................................... 1 2 3 4 5 D
b. Environmental responsibility is emphasized through well-defined environmental policies and procedures ............................................................ 1 2 3 4 5 D
c. Our environmental standards are more stringent than mandatory governmental requirements ............... 1 2 3 4 5 D
d. We conduct environmental audits for our own performance goals, not just for compliance ................ 1 2 3 4 5 D
e. Employees receive incentives for contributions to environmental performance ........................................ 1 2 3 4 5 D
f. We use environmental cost accounting .......................... 1 2 3 4 5 D
g. We make continuous efforts to minimize environmental impacts ............................................... 1 2 3 4 5 D
h. We require our suppliers to pursue environmentally friendly practices......................................................... 1 2 3 4 5 D
i. Employees are conscious of the importance of minimizing negative environmental impacts .............. 1 2 3 4 5 D
j. An adequate amount of training in environmental management is provided to all employees .................. 1 2 3 4 5 D
k. Facility environmental achievements are given prominent coverage in facility annual reports............. 1 2 3 4 5 D
Q13. Does your facility participate in any voluntary programs designed to improve environmental performance or construct projects according to voluntary environmental standards? (For example, Climate Savers, ENERGY STAR ®, the National Environmental Performance Track, the Oregon Natural Step Network, WasteWise, etc.)
1 No 2 Yes Which programs:

52
52
Q14. For your facility, please indicate to what extent you agree or disagree with the following statements. (Please check only ONE box for each statement.)
Neither
Agree Strongly Somewhat nor Somewhat Strongly Do Not Disagree Disagree Disagree Agree Agree Know ▼ ▼ ▼ ▼ ▼ ▼
a. Pollution prevention is emphasized to improve environmental performance ...................... 1 2 3 4 5 D b. Efforts have been made to reduce spills and leaks of environmental contaminants ......................... 1 2 3 4 5 D c. We choose raw materials that minimize environmental impacts ................................................ 1 2 3 4 5 D d. We have modified our production systems to reduce waste and environmental impacts.................... 1 2 3 4 5 D e. We have modified our products to reduce environmental damage during production, consumption, and disposal. ......................................... 1 2 3 4 5 D f. We have increased recycling and reduced landfilling of our solid waste....................................... 1 2 3 4 5 D
SSeeccttiioonn IIIIII.. FFaacciilliittyy EEnnvviirroonnmmeennttaall PPeerrffoorrmmaannccee Q15. For your facility, please indicate the level of compliance with regulatory standards for any of the
following that were regulated by a government agency during the 2004 calendar year. (Please check only ONE box for each standard.)
Working Do More Not Towards Meet than Regulated Meeting Regulatory Regulation at your Regulation Standards Requires Facility ▼ ▼ ▼ ▼
a. Water pollution............................................... 1 2 3 4 b. Solid waste ..................................................... 1 2 3 4 c. Hazardous/toxic wastes .................................. 1 2 3 4 d. Hazardous air emissions (for example, sulfur oxides, nitrogen oxides, volatile organic compounds, particulates) ............... 1 2 3 4 e. Other............................................................... 1 2 3 4 (Please specify)
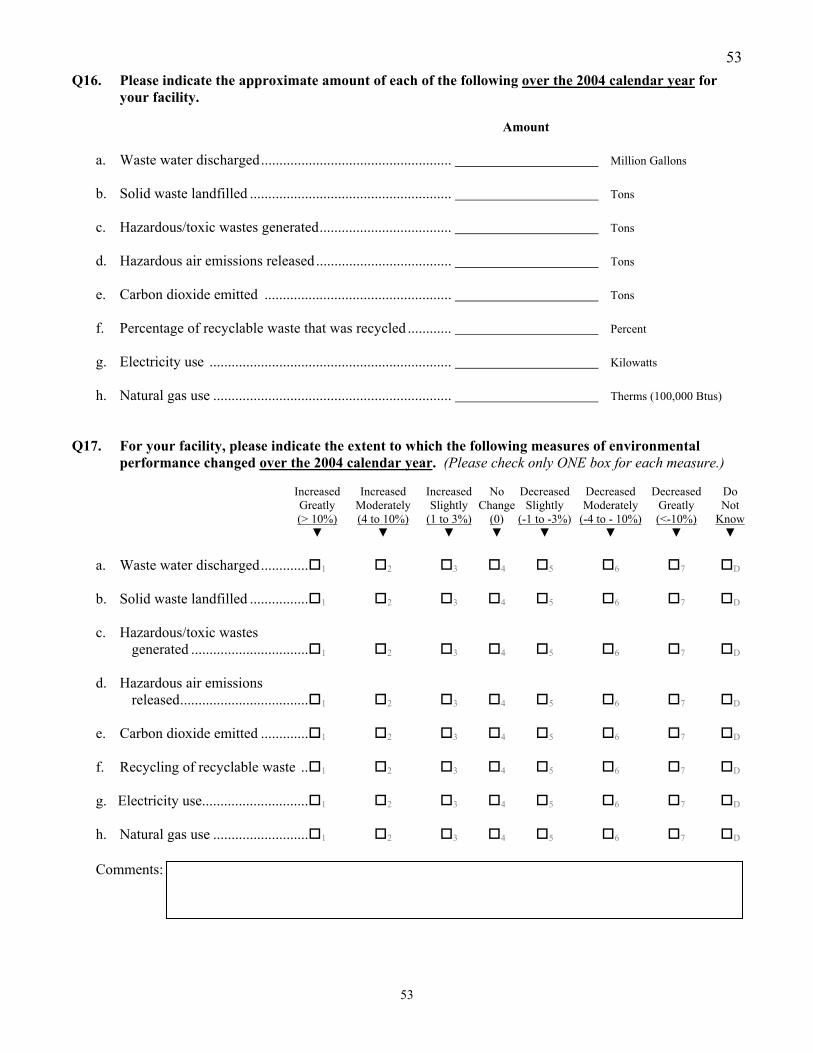
53
53
Q16. Please indicate the approximate amount of each of the following over the 2004 calendar year for your facility.
Amount a. Waste water discharged.................................................... Million Gallons b. Solid waste landfilled ....................................................... Tons c. Hazardous/toxic wastes generated.................................... Tons d. Hazardous air emissions released..................................... Tons e. Carbon dioxide emitted ................................................... Tons f. Percentage of recyclable waste that was recycled ............ Percent g. Electricity use .................................................................. Kilowatts h. Natural gas use ................................................................. Therms (100,000 Btus)
Q17. For your facility, please indicate the extent to which the following measures of environmental performance changed over the 2004 calendar year. (Please check only ONE box for each measure.)
Increased Increased Increased No Decreased Decreased Decreased Do Greatly Moderately Slightly Change Slightly Moderately Greatly Not (> 10%) (4 to 10%) (1 to 3%) (0) (-1 to -3%) (-4 to - 10%) (<-10%) Know ▼ ▼ ▼ ▼ ▼ ▼ ▼ ▼
a. Waste water discharged............. 1 2 3 4 5 6 7 D b. Solid waste landfilled ................ 1 2 3 4 5 6 7 D c. Hazardous/toxic wastes generated ................................ 1 2 3 4 5 6 7 D d. Hazardous air emissions released................................... 1 2 3 4 5 6 7 D e. Carbon dioxide emitted ............. 1 2 3 4 5 6 7 D f. Recycling of recyclable waste .. 1 2 3 4 5 6 7 D g. Electricity use............................. 1 2 3 4 5 6 7 D h. Natural gas use .......................... 1 2 3 4 5 6 7 D
Comments:

54
54
SSeeccttiioonn IIVV.. GGeenneerraall IInnffoorrmmaattiioonn Q18. Is your facility owned by a parent company?
1 No Skip to Question 21 2 Yes
Q19. If yes to Q18, what is the name of the parent company, and where is it located? Q20. If yes to Q18, please mark the extent of your agreement or disagreement with the following
statements. (Please check only ONE box for each statement.)
Neither Agree Strongly Somewhat nor Somewhat Strongly Do Not Disagree Disagree Disagree Agree Agree Know ▼ ▼ ▼ ▼ ▼ ▼ a. The parent company strongly encourages facility participation in voluntary environmental programs.. .. 1 2 3 4 5 D b. The parent company provides incentives and assistance for environmentally friendly practices and technologies.......................................................... 1 2 3 4 5 D c. The parent company has an environmental policy/standard that applies to all facilities.. ............... 1 2 3 4 5 D d. The parent company allows facilities to make environmental investments needed to go beyond compliance .................................................................. 1 2 3 4 5 D
Q21. Is your facility (or parent company) a multi-national corporation?
1 No 2 Yes
Q22. Is your facility (or parent company) publicly traded or privately owned? (Please check only ONE
box.)
1 Publicly traded 2 Privately owned 3 Other (please specify)

55
55
Q23. Does your facility or parent company have its own Research & Development department? (Please
check ALL that apply.)
Yes, facility has a Research & Development department. Yes, parent company has Research & Development department. No, neither facility nor parent company has Research and Development department.
Q24. Does your facility primarily produce a good/service sold directly to customers in retail markets?
1 No 2 Yes
Q25. Approximately how many close competitors does your facility have?
Number of close competitors
Q26. How many times was your facility inspected by an environmental agency during 2004?
Number of times facility inspected in 2004
Q27. How many penalties, third-party lawsuits or other sanctions for environmental management did your
facility have during 2004? Number of environmental penalties, other sanctions or third party lawsuits in 2004
Q28. What were the estimated annual total revenues of your facility during the 2004 calendar year?
(In million $)
Q29. What is the average age of facility upper management personnel (senior managers/directors and
above)? (Please check only ONE box.)
1 20-30 years old 2 31-40 years old 3 41-50 years old 4 51-60 years old 5 Over 61 years old
56
56
Q30. We have asked you about a wide range of potential influences on environmental management at your facility. Considering both motivations and barriers, please list the three most important influences on your facility in descending order of importance.
1. 2. 3.
Q31. No single questionnaire can adequately cover all points relevant to environmental management by
diverse Oregon firms. We welcome any additional comments, or elaboration on the answers to any of the questions. (Please note the question number if appropriate.)
Q32. If anyone else contributed to completing the survey, please list their positions/titles: Q33. Finally, please let us know if you would like to see a report of the study findings.
1 Yes, please email the website for the report. Email address:
2 Yes, please send a hard copy. Address (if different from the address this survey was sent to):
3 No, thanks.
Thank you very much for completing the survey!
Please return your completed questionnaire to:
Social & Economic Sciences Research Center Washington State University
PO Box 641801 Pullman, WA 99164-1801