economic benefits of the eu ecodesign directive - ecofys · besnl11688 1 1 ecodesign –...
TRANSCRIPT

Economic benefits of the EU Ecodesign Directive
Improving European economies

ECOFYS Netherlands B.V. | Kanaalweg 15G | 3526 KL Utrecht| T +31 (0)30 662 33 00 | F +31 (0)30 662 33 01 | E [email protected] | I www.ecofys.com
Chamber of Commerce 30161191
Economic benefits of the EU Ecodesign Directive
Improving European economies
By: Edith Molenbroek, Maarten Cuijpers, Kornelis Blok
Date: April 2012
Project number: BESNL11688
© Ecofys 2012 by order of: Natuur en Milieu

ECOFYS Netherlands B.V. | Kanaalweg 15G | 3526 KL Utrecht| T +31 (0)30 662 33 00 | F +31 (0)30 662 33 01 | E [email protected] | I www.ecofys.com
Chamber of Commerce 30161191
Summary
Massive economic and environmental savings lying in the EU’s backyard
The Ecodesign Directive is one of the most effective tools the European Union (EU) counts on in order
to deliver cost-effective energy savings. These savings would increase the EU’s security of supply,
would create jobs and would help the EU achieve its mid- and long-term climate and energy
objectives.
A correct implementation of the EU Ecodesign Directive would yield yearly savings of up to 600 TWh
of electricity and 600 TWh of heat1 in 2020, equivalent to 17% and 10% of the EU total electricity
and heat consumption, respectively. This would translate into 400 Mtonnes of CO2 emissions annually
in year 2020, comparable to the impact on greenhouse gas (GHG) emissions expected of the EU
Emissions Trading System (ETS).
In addition to the environmental benefits, this study has found the following economic benefits would
arise as a result of good implementation of the Directive:
- Net savings for European consumers and businesses of €90 billion per year (1% of EU’s
current GDP) in year 2020. This means net savings of €280 per household per year.
- Reinvesting these savings in other sectors of the economy would result in the creation of 1
million jobs.
- Dependency on imports of energy would be reduced by 23% and 37% for natural gas
and coal, respectively. This means the EU could slash natural gas imports from Russia by
more than half and imports of coal from Russia could be stopped altogether.
These benefits risk being left untapped unless policy makers in Brussels and European national
capitals give more attention to the correct implementation of the Ecodesign Directive.
But what is Ecodesign?
The Ecodesign Directive aims at reducing the environmental impact of a number of products sold in
the EU,with emphasis on their energy consumption. The Directive covers most energy-using products
(domestic appliances but also commercial and industrial equipment), covering products responsible
for as much as 80% and 60% of the EU’s electricity and heat consumption, respectively. As a
framework Directive, it lays out the process and general ‘framework’ in which ‘Implementing
Measures’ must be developed, but it is for these Implementing Measures to determine the energy
efficiency and other environmental requirements for each product group.
1 Measured as final energy.
ECOFYS Netherlands B.V. | Kanaalweg 15G | 3526 KL Utrecht| T +31 (0)30 662 33 00 | F +31 (0)30 662 33 01 | E [email protected] | I www.ecofys.com
Chamber of Commerce 30161191
Does Ecodesign deliver?
Currently Ecodesign does not deliver to its full potential. Two main concerns have been identified that
jeopardise progress:
1. Persistent delays. Six major product groups, among them boilers, water heaters and
computers, are still pending the approval of an Ecodesign Implementing Measure years after
the preparatory work was finalised, while the process should last no more than a few months.
These delays are partly due to the technical complexity of the work and partly to lack of
sufficient manpower at the European Commission.
2. Insufficient ambition. For product groups that did result in standards in a reasonable time
frame there is a risk that standards do not go far beyond business as usual and do not reach
the Ecodesign ambition of lowest life cycle costs. This is because standards are based on
information on efficiency and cost that is outdated by the time the standard takes effect. For
example, for televisions it was observed that the Minimum Energy Performance Standards
regulated by Ecodesign do not have any effect on the market, as the bulk of the appliances
sold was already more efficient than the imposed standards before the standards went into
effect. The standards were based on information that did not include efficient LED-backlit TVs
yet, whereas these are widely sold today.
Conclusions and recommendations
The correct implementation of the Ecodesign Directive would strengthen the competitive position of
the European Union and would bring considerable environmental benefits. A lack of enough
awareness of the full potential of the Ecodesign Directive and technical and organisational issues are
standing in the way between these benefits and the European citizens and businesses that would
benefit from them.
In order to reap the full fruit of this piece of legislation we recommend to boost efforts for effective
and timely Regulations that sufficiently encompass market and technological evolution:
1. Raise awareness among decision makers on the full power of the Ecodesign
Directive to reduce energy dependency of member states and diminish energy bills of
companies and citizens. In contrast to some other EU policies, strengthening the minimum
energy requirements of appliances would not deteriorate the competitive position of European
manufacturers. This is because non-EU manufacturers should also comply with these
requirements when entering the EU-market.
2. Devoting more manpower within the European Commission (EC) and/or Member States to
ensure that Ecodesign Implementing Measures are adopted timely and with sufficient
ambition.
3. Taking into account market dynamic and expected cost reductions of energy efficient
technologies when setting minimum energy performance standards under individual
Implementing Measures. Only then will Ecodesign measures be at the lowest life-cycle cost to
consumers by the time they enter into force.

ECOFYS Netherlands B.V. | Kanaalweg 15G | 3526 KL Utrecht| T +31 (0)30 662 33 00 | F +31 (0)30 662 33 01 | E [email protected] | I www.ecofys.com
Chamber of Commerce 30161191
4. Improve market monitoring, with particular attention to energy efficiency and cost data.
This would facilitate the job of setting minimum energy performance standards and will help
evaluate their effectiveness once they enter into force.
Structure of the study
In this scoping study we:
- Describe the functioning of the Ecodesign Directive (chapter 1)
- Quantify the potential benefits associated to the Directive (chapter 2)
- Evaluate the implementation of the Directive thus far (chapter 3)
- Make recommendations for improvement (chapter 4)

ECOFYS Netherlands B.V. | Kanaalweg 15G | 3526 KL Utrecht| T +31 (0)30 662 33 00 | F +31 (0)30 662 33 01 | E [email protected] | I www.ecofys.com
Chamber of Commerce 30161191
Table of contents
1 Ecodesign – introduction and scope 1
1.1 What is Ecodesign 1
1.2 Implementation Status 1
1.3 Scope 2
1.4 Legislative process 3
1.5 Ecodesign and the newly proposed Energy Efficiency Directive 4
1.6 Ecodesign and ETS 5
2 Economic impact of Ecodesign 6
2.1 Introduction 6
2.2 Ecodesign energy savings 6
2.3 Ecodesign net economic savings 7
2.3.1 Gross economic savings 7
2.3.2 Net economic savings 8
2.4 Job effects 9
2.5 Reduced dependency on energy imports 11
2.6 Other benefits 13
3 Does Ecodesign deliver? 15
3.1 Planning of measures 15
3.2 Ecodesign ambition: lowest life cycle costs 16
3.2.1 Televisions 19
4 Conclusions and recommendations 21
4.1 Recommendations 22
Annex A Ecodesign savings per appliance group 23
References 25

BESNL11688 1
1 Ecodesign – introduction and scope
1.1 What is Ecodesign The Ecodesign Directive was originally passed in 2005 (2005/32/EU) and was amended in 2008
(2008/28/EU) and 2009 (2009/125/EU). It aims at reducing the environmental impact of products
throughout their entire lifecycle. The Ecodesign Directive provides a framework for the Commission to
develop mandatory standards (or alternatively self-regulation by industry) on the environmental
impact (primarily energy efficiency) of a product group. Ecodesign regulations do not prescribe the
method for achieving higher energy efficiency but only the required objective, thereby leaving the
manufacturers free to determine their own technical solution. Initially, the Ecodesign Directive
targeted energy using products (EuP’s)2, but in its 2009 revision it was also extended to target
energy related products (ErP’s)3. According to the Directive, a product group can potentially be
regulated under Ecodesign when it:
- Has more than 200.000 units sold annually in the EU
- Has a significant environmental effect, judging by the number of products in use
- Has significant improvement potential
Ecodesign implementing measures for specific product groups should:
• have no (significant) negative impact on (1) functionality, (2) health and safety, (3)
affordability, (4) industry’s competitiveness.
• not impose proprietary technology on manufacturers
• not be an excessive administrative burden for manufacturers
Furthermore, Ecodesign parameters:
• consider all phases of the life cycle (manufacturing, transport, use, disposal)
• consider the essential environmental aspects (consumption, material, emission, waste etc.)
for each phase
• determine energy efficiency or energy consumption levels which allow minimum life cycle cost
for end consumers
1.2 Implementation Status Up until 2011, 12 products have been regulated under Ecodesign. For some of them new or revised
Energy Labels have also been enforced. The list of 12 regulated products is given below.
Furthermore, for four product groups a Voluntary Agreement has been made or is considered:
complex set top boxes (digital TV decoders), imaging equipment (such as copiers, printers), machine
2 EuP’s are products that consume energy to perform their function (e.g. televisions) 3 ErP’s are products that do not use energy to perform their function, but do have significant impact on energy use
(e.g. insulation)

BESNL11688 2
tools and medical imaging equipment. 29 product groups are ‘in the process’ or shortlisted to be
investigatedi.
Table 1.I. Overview of products regulated up until 2011ii.
1.3 Scope The scope of the Ecodesign Directive includes energy using products (EuP’s) as well as energy related
products (ErP’s)iii. In this report we have limited ourselves to discussion of the effects of measures on
energy using products because these groups have been the main focus of the policy process to date.
Energy using products that are in scope for Ecodesign regulations consume some 50% of Europe’s
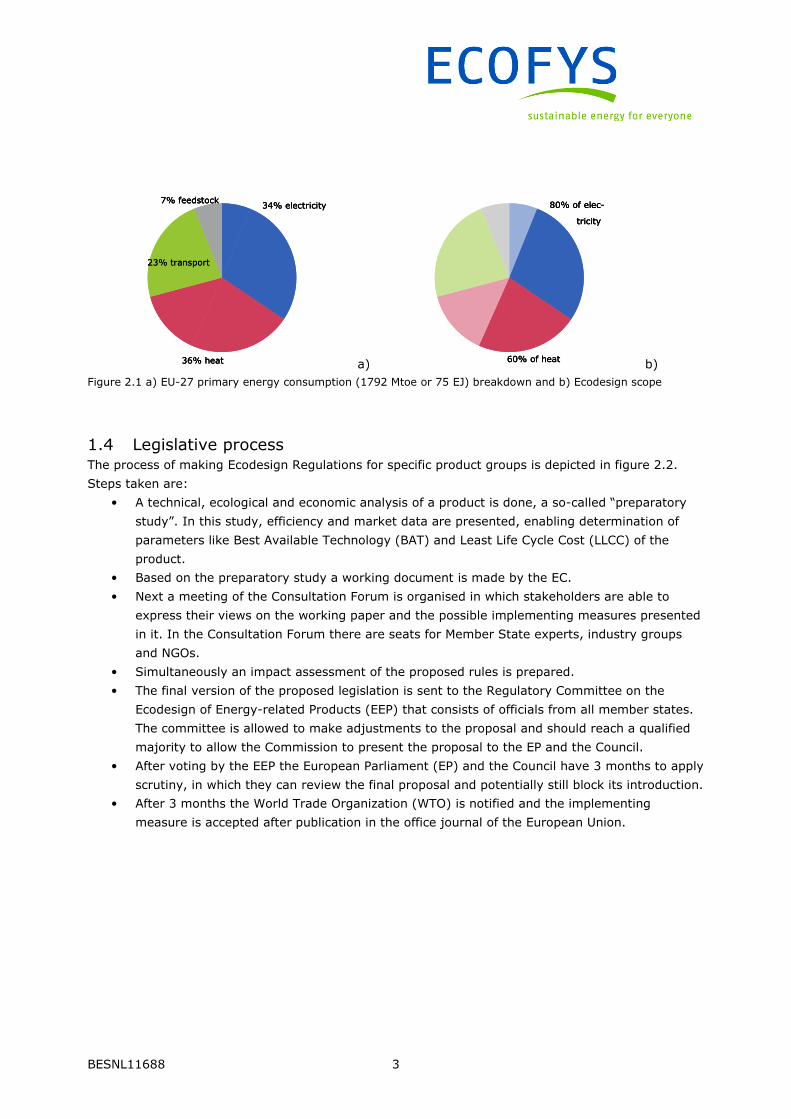
primary energy consumption, as is illustrated in figure 2.1.
In figure 2.1a) a breakdown of the EU primary energy consumption is given into the four main
groups: electricity, heat, transport and feedstock. Figure 2.1b) shows how much of this consumption
is used by products within scope of the Ecodesign Directive: roughly 80% of the total EU-27
electricity and 60% of the total heat consumptioniv.
Adopted implementing measures Estimated electricity savings (annual
savings by 2020) in TWh
Standby and off mode losses of electrical and
electronic equipment (household and office) 35
Simple set top boxes 9
Domestic lighting 39
Tertiary sector lighting 38
External power supplies 9
Televisions 43
Electric motors 135
Circulators 23
Domestic refrigeration 8
Domestic dishwashers 2
Domestic washing machines 1.5
Fans (driven by motors with an electric input
power between 125W and 500kW) 34
~ 376TWh
Almost 14% of the 2009 final electricity
consumption in the EU
BESNL11688 3
34% electricity
36% heat
23% transport
7% feedstock34% electricity
36% heat
23% transport
7% feedstock34% electricity
36% heat
23% transport
7% feedstock
a)
80% of elec-
tricity
60% of heat
80% of elec-
tricity
60% of heat
80% of elec-
tricity
60% of heat b)
Figure 2.1 a) EU-27 primary energy consumption (1792 Mtoe or 75 EJ) breakdown and b) Ecodesign scope
1.4 Legislative process The process of making Ecodesign Regulations for specific product groups is depicted in figure 2.2.
Steps taken are:
• A technical, ecological and economic analysis of a product is done, a so-called “preparatory
study”. In this study, efficiency and market data are presented, enabling determination of
parameters like Best Available Technology (BAT) and Least Life Cycle Cost (LLCC) of the
product.
• Based on the preparatory study a working document is made by the EC.
• Next a meeting of the Consultation Forum is organised in which stakeholders are able to
express their views on the working paper and the possible implementing measures presented
in it. In the Consultation Forum there are seats for Member State experts, industry groups
and NGOs.
• Simultaneously an impact assessment of the proposed rules is prepared.
• The final version of the proposed legislation is sent to the Regulatory Committee on the
Ecodesign of Energy-related Products (EEP) that consists of officials from all member states.
The committee is allowed to make adjustments to the proposal and should reach a qualified
majority to allow the Commission to present the proposal to the EP and the Council.
• After voting by the EEP the European Parliament (EP) and the Council have 3 months to apply
scrutiny, in which they can review the final proposal and potentially still block its introduction.
• After 3 months the World Trade Organization (WTO) is notified and the implementing
measure is accepted after publication in the office journal of the European Union.

BESNL11688 4
Figure 2.2 Ecodesign processv.
A Regulation (implementing measure) for appliances is directly applicable in all member states.
A preparatory study takes 18 – 24 months to finish. Another 17 months are estimated to be
necessary to complete the process.
This is the scheme adopted when a Regulation (also called Implementing Measure, IM) is made. If
the industry of a certain appliance group prefers a Voluntary Agreement and can fulfil conditions for
such agreements under Ecodesign, they are allowed to do that.
1.5 Ecodesign and the newly proposed Energy Efficiency Directive Ecodesign is not the only European Directive targeting energy efficiency in Europe. Currently the
Energy Services Directive (ESD) is in place, requiring member states to prepare NEEAPs (National
Energy Efficiency Plans). This should result in 9% savings by 2016.
Currently negotiations are underway to improve the effectiveness of this Directive. A proposal for the
Energy Efficiency Directive is currently negotiated, that combines goals of the ESD and the CHP-
Directive.
This newly proposed EED (Energy Efficiency Directive) currently proposes that annual energy
savings have to be equal to 1.5% of the volume of energy sales in the previous year. Such savings
should be achieved by obligations on energy suppliers or by alternative methods.
It is important for member states to realise that Ecodesign savings contribute directly to the EED
savings objective: achieving 17% Ecodesign savings on electricity and 10% savings on heat would be

BESNL11688 5
a substantial contribution toward fulfilling the EED objective. As the Ecodesign regulations process is
EU-wide and all member states benefit from its savings, any governmental effort to safeguard and
improve the effectiveness of Ecodesign is likely to contribute to EED goals in a very efficient way.
1.6 Ecodesign and ETS
Ecodesign and and the EU Emissions Trading System (EU ETS) are both important instruments in the
overall efforts to reduce the emission of greenhouse gases. In terms of reduction potential in 2020
they are very similar: about 400 Mtonnes of CO2 in 2020vi. In scope they are different, as ETS targets
industrial energy consumption and Ecodesign targets energy consumption of products used in all
sectors. Ecodesign savings contribute to CO2 emission savings by utilities and some industrial
equipment and therefore directly contribute to meeting ETS goals. This is an argument for further
limiting ETS permits.
Both Directives target about 50% of EU primary energy consumption. Given these similarities in
scope and potential, it is relevant for this work to note some important differences:
1. Within the ETS, only savings within Europe are achieved. Ecodesign measures apply to all
manufacturers that import products into the EU and therefore are likely to have a positive
effect on the efficiency of products on a much larger market outside of Europe as well.
2. Within the ETS system a balance needs to be found between the ambition of the ETS (the
setting of the cap) and the competitiveness of European industry. For Ecodesign on the other
hand, a level playing field exists regardless of the level of ambition, as all of industry
(European and non-European) is required to meet the standards.
3. ETS requires a considerable implementation effort in the member states for monitoring and
verification. Each member state has a National Emission Authority. In contrast, Ecodesign
measures, once agreed upon, are directly applicable in member states. All in all it is
estimated that on a member state level 10-20 times more people are active on ETS than on
Ecodesign.
Both ETS and Ecodesign are potentially powerful policy instruments. Nonetheless it looks like
Ecodesign is receiving much less attention on a member state level as well as on EU level.
On the EU-level international comparison points out understaffing. This observation was highlighted
in an evaluative study on Ecodesign ordered by the European Commission in 2011 (called CSES
Ecodesign evaluation hereafter)vii. The study gives the following reason for this: “The extent of
resources made available clearly poses a major constraint at various points in the implementation of
the Directive. By way of comparison, staffing levels in the USA are in the region of 10 times the
number of desk officers in DG ENER in the Commission. Even in China which has developed its
regulatory framework more recently, there are about 70 staff and more than 40 product regulations.
There is a similar disparity in terms of resources devoted to the necessary studies.”

BESNL11688 6
2 Economic impact of Ecodesign
2.1 Introduction In this chapter, we explore to what extent energy savings triggered by the implementation of the
Ecodesign Directive are beneficial to the economies of European member states. We focus on three
main macroeconomic impacts:
1. Net economic savings associated to energy savings
1. Positive job effects of re-investing these economic savings elsewhere in the economy
2. Reduced dependency on energy imports
Other positive impacts are:
3. Reduced need to buy GHG (Greenhouse Gas) allowances in order to meet Kyoto targets
4. Reduced exposure to volatility of energy prices
5. Increased competitiveness of the European appliances industry
We will briefly discuss these impacts at the end of this chapter.
2.2 Ecodesign energy savings In order to determine any positive economic benefits, first the expected yearly energy savings need
to be determined. In Ecodesign methodology these savings are determined for the year 2020.
Currently, 12 implementing measures are in placeviii. In order to gain a more complete picture of
expected savings of all products from the 1st Ecodesign Working Plan until 2020, we summarise the
results from a few sources below.
Table 3.I Overview of Ecodesign yearly savings from different sources.
Source Yearly savings in 2020 (TWhfin) Comments
EU 2011viii 376 1st 12 IMs, electricity
Wuppertal Inst. 2010ix 277 – 297
500-600
321 – 593
1st 12 IMs, electricity
Electricity
Heat / fuel
The total savings of the first twelve implementing measures are estimated by the EU to be 376 TWh
per year by 2020. This concerns electrical appliances and comprises the sum of the twelve individual
measures.
By order of DG Environment the Wuppertal Institute made a report analysing all product groups of
the first Ecodesign Work Plan, including measures that were not in place by then. For the first twelve
groups that are now in place significantly lower savings were calculated compared to the total sum of
the first twelve measures. The difference can be explained as follows: in the Wuppertal study
• Double counting is removed (e.g. for refrigerators and motors)
• Delays in adoption of implementing measures, resulting in lower savings in 2020, are taken
into account

BESNL11688 7
• Rebound effects are taking into account: 10% for electricity and 30% for heat4.
The range of savings given stems from uncertainty in measures that have not been finalised yet.
As the Wuppertal study is the most complete study on savings of all measures, is publicly available
and has carefully considered any issues affecting total savings, we have chosen to use these savings
for calculating the economic benefits. In the table below the numbers used are summarised. As the
goal of this document is to show the potential savings of Ecodesign, this study uses the upper range
of energy savings from the Wuppertal report.
Table 3.II. Overview of maximum projected Ecodesign savings in 2020.
Ecodesign savings (final) Ecodesign savings (primary)
TWh Mtoe TWh Mtoe
Electricity 600 52 1500 129
Heat 593 51 593 51
Total 1193 103 2093 180
When comparing these savings with the total energy demand of households, the tertiary sector and
industry together projected for 2020, 10% of heat can be saved with respect to a business as usual
scenario and 17% of electricityx.
2.3 Ecodesign net economic savings The savings given in the previous paragraph result in gross economic savings for businesses and
consumers. These are determined in the paragraph below. The question is what the net economic
savings are, taking into account any higher upfront investment cost of appliances. This will be
discussed in paragraph 2.3.2.
2.3.1 Gross economic savings
We start out calculating yearly gross economic savings that are determined by the yearly energy
savings multiplied by the cost of energy.
Energy prices for 2008 and 2020 for electricity and heat used for calculation of total monetary
savings are shown in table 3.III. A 1% price increase was assumed for the period of 2008 to 2020.
Gas prices were assumed to be representative of prices for low temperature heat in general.
Next, the energy savings of the individual groups were divided into the category household, service,
industry or a combination of the three, as shown in Annex A. Savings were determined using
household prices for the households category and industry prices for the services sector and industry
categories.
4 Examples of rebound effects are: (1) because the new appliance (lightbulb, heating system) is so efficient people
have the tendency to leave it on longer or heat their house at a higher temperature, (2) with the money saved
other purchases are done that cause energy consumption.

BESNL11688 8
Table 3.III Average EU energy prices in 2008 and expected energy prices in 2020
Sector 2008 (€/MWh)xi 2020 (€/MWh)
Natural gas households 54 61
Natural gas industry 39 44
Electricity households 167 188
Electricity industry 103 116
This results in total gross monetary savings of €120 billion per year in 2020 for Europe.
2.3.2 Net economic savings
Next, we examine to what extent Ecodesign savings will outweigh extra investments to be made by
businesses and consumers. These extra investments need to be made if the costs of more efficient
appliances are higher. There is more than one way to examine potentially higher investment costs.
One can examine extra costs of more efficient appliances at a given point in time, but one can also
consider the development of this extra cost over the years. We will discuss cost development in the
next chapter. In order to determine net economic savings we consider extra costs of more efficient
appliances at a given point in time. These extra costs vary per appliance group. For example,
currently, efficient televisions usually do not cost anything more than less efficient ones. The most
efficient type of dryer on the other hand, heat pump dryers, are substantially more expensive than
less efficient ones.
Unfortunately, we cannot estimate increased investment costs for all appliance groups as this
information is not available. Instead, we determine the percentage of increased investment costs
over the savings by examining some product groups where this information is available: from an
earlier study (which was largely based on findings from the Ecodesign preparatory studies) we used
data for four electrical household appliance groups:
• Televisions
• Washing machines
• Refrigerators
• Lighting
and one natural gas based household appliance: a boilerxii.
In table 3.IV we show the savings, the additional costs for these appliance groups and the ratio
between them. It should be noted that the numbers refer to data from some years ago and to costs
and savings from the ‘cost-effective’ levels estimated at that time, where life cycle costs are at a
minimum. This should also ideally be where Ecodesign standards are set. We discuss this topic in
more detail in §4.1.
Table 3.IV shows that for the four electrical appliances groups yearly upfront investment costs
amount to 20% of the yearly savings. For the boiler this is 29%. Using the numbers in table 3.IV as
support, we consider a percentage of 25% to be realistic as an average of all product groups. It
should be noted that this is an extrapolation and that in some cases energy efficiency improvements

BESNL11688 9
can come at no or limited cost. Also this extrapolation does not take into account mass production
effects and reduction of costs over time (i.e. when a certain efficiency level becomes the standard for
everyone by law, the extra investment for reaching this level can decrease substantially). We will
discuss this in further detail in Chapter 3.
If we subtract 25% additional investment costs from the gross savings found, it would result in total
net economic savings of €90 billion per year in 2020 for European consumers and
businesses.
Taking only the measures for households as shown in Annex A, one would arrive at €280 net
savings per household, using our modest price increase assumptions until 2020.
Table 3.IV. Percentage of additional yearly costs for a household in Europe for four electrical household appliance
groups (washing machines, refrigerators, televisions, lighting) and for a gas based boiler and water heater.
Electricity, 4 products Heat, 2 products
Savings per household (kWh / year) 344 4576
Electricity / heat cost (€/kWh) 0.19 0.06
Total savings (€ / year) 65 279
Additional costs over product lifetime (€ / year) 13 82
Additional yearly costs / yearly savings 20% 29%
2.4 Job effects In 2011 the ACEEE (American Council for an Energy Efficient Economy) published a study “Appliance
and equipment efficiency standards: a moneymaker and job creator”xiii. This study estimated net
employment and wage impacts of U.S. appliance, equipment and lighting efficiency standards. Using
their DEEPER input-output modelling system, they calculated job effects for standards already in
place in the year 2010 combined with a round of standards revision to be completed by 2013. For the
year 2020, they calculated that annual energy bill savings would amount to $64 bln and that this
would imply creation of 387,000 jobs. This job creation was found to be driven, in large part, by the
energy saved when less efficient appliances are replaced with more efficient appliances, providing
energy and dollar savings for consumers. Consumers then have additional money to spend in more
labour-intensive but equally productive sectors of the economy, creating a net increase in jobs and
wages.
In this study it was out of scope to perform such a modelling study for Europe. However, because the
main argument used for job creation also holds for Europe, we estimated job effects through
Ecodesign savings in two ways:
1. Assuming the relationship between energy bill savings and jobs created in 2020 to be the
same in Europe and the US, and using the energy bill savings through Ecodesign to calculate
the number of jobs created in Europe.
2. Examining labour-intensities for the power sector and other sectors in Europe, calculating
jobs created in other sectors through achieved energy saved minus jobs destroyed in the
power sector because of the savings.

BESNL11688 10
The first method arrives at 1 million jobs created in 2020, based on the €120 bln saved on energy
bills through Ecodesign measures.
To determine job effects with the second method we first show labour-intensities for difference
sectors in Europe in figure 2.3. If 7 jobs in the power sector are destroyed per million Euro saved on
energy consumption and ~20 jobs created in other sectors, this results in a net creation of 13 jobs
per million Euro saved. Based on 120 bln € savings, this would result in 1.7 million jobs created in
20205.
0
10
20
30
40
50
60
Ele
ctr
icit
y,
ga
s,
ste
am
an
d h
ot
wa
ter
sup
ply
Min
ing
an
d
qu
arr
yin
g
Ma
nu
fac
turi
ng
Co
nst
ruc
tio
n
Wh
ole
sale
an
d
reta
il;
rep
air
Ho
tels
an
d
rest
au
ran
ts
Tra
nsp
ort
,
sto
rag
e.
co
mm
un
ica
tio
n
Re
al
est
ate
,
ren
tin
g
La
bo
ur
inte
nsi
ty (
FT
E/
mln
.Eu
ro)
Figure 2.3 Labour intensities in different sectors in Europe (2007). Source: Eurostat.
The ACEEE study was done by detailed modelling of the economy and takes into account indirect
effects such as the influence of reduced turnover in the electricity sector on jobs in other sectors of
the economy. We therefore base our results on the first method. We consider the estimate based on
European labour-intensities to be supportive of this result. Nonetheless it should be noted that it is an
estimate. A more accurate number would require detailed economic modelling specific for the
European situation.
5 One could argue that net savings (gross savings minus extra appliance cost) should have been taken. However,
these extra appliance costs are part of the investment in other sectors and therefore included.

BESNL11688 11
2.5 Reduced dependency on energy imports The EU is currently highly dependent on imports for its energy supply: 53% of all energy is
importedxiv. This may increase to 66% in 2020xv. High energy dependency is unwanted for political
and economical reasons and it is therefore a goal of the EU to reduce this dependency. Strong
Ecodesign legislation has the ability to reduce the EU energy demand and through this the EU
dependency on imports.
Table 3.V gives an overview of EU importsxv.
Table 3.V: EU energy imports in 2020
The Ecodesign savings from paragraph 3.2 allow us to estimate the reduction of energy dependency
of the EU. We used the same percentage of solid fuels, oil and gas of the total fossil fuel consumption
in 2007 as in 2020, even though the total amount of fossil fuels changed due to changing demand
and increased incorporation of renewables. In figure 2.4 the primary energy sources for heat and
electricity production in 2007 are depicted.
10%
72%
16%
2%
Solids Gas Oil Other
a)
29%
28%
23%
16%
3%
1%
Solids Nuclear Gas Renewables Oil Other
b)
Figure 2.4 Primary energy sources used for a) heatxvi and b) electricity productionxiii
If we assume that all energy consumption avoided by the implementation of the Ecodesign Directive
will be subtracted from the EU imports we can calculate the import reduction. To do so we used a
primary energy factor of 2.5 for electricity production. The results are given in figure 2.5. We see that
Ecodesign has most effect on the import of gas and solids, reducing them by 17% and 28%
respectively. Overall Ecodesign can achieve an EU import reduction of 10%. Currently the EU is
highly dependent on Russia (41%) and Norway (27%) for gas imports. Imports of solid fuels
(predominantly coal) come mainly from Russia (25%) and South-Africa (22%). Oil imports, which are
(Mtoe) Solid fuels Natural gas Oil EU total
Import 2020 200 390 707 1297
Gross inland consumption 2020 342 505 702 1968
Import dependency 58% 77% 100% 66%
BESNL11688 12
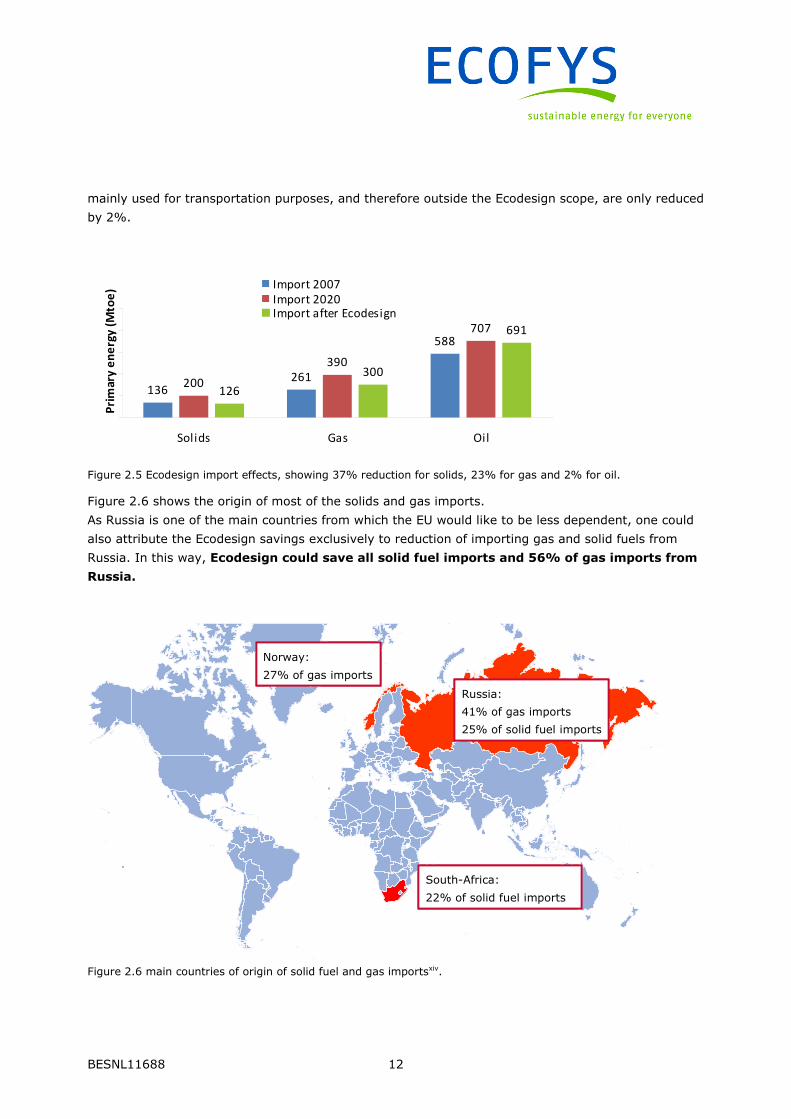
mainly used for transportation purposes, and therefore outside the Ecodesign scope, are only reduced
by 2%.
136261
588
200
390
707
126
300
691
Solids Gas Oil
Pri
ma
ry e
ne
rgy
(M
toe
) Import 2007
Import 2020Import after Ecodesign
Figure 2.5 Ecodesign import effects, showing 37% reduction for solids, 23% for gas and 2% for oil.
Figure 2.6 shows the origin of most of the solids and gas imports.
As Russia is one of the main countries from which the EU would like to be less dependent, one could
also attribute the Ecodesign savings exclusively to reduction of importing gas and solid fuels from
Russia. In this way, Ecodesign could save all solid fuel imports and 56% of gas imports from
Russia.
Russia:
41% of gas imports
25% of solid fuel imports
South-Africa:
22% of solid fuel imports
Norway:
27% of gas imports
Russia:
41% of gas imports
25% of solid fuel imports
South-Africa:
22% of solid fuel imports
Norway:
27% of gas imports
Russia:
41% of gas imports
25% of solid fuel imports
South-Africa:
22% of solid fuel imports
Norway:
27% of gas imports
Figure 2.6 main countries of origin of solid fuel and gas importsxiv.
BESNL11688 13
2.6 Other benefits
A reduced need to buy GHG allowances
As part of the Kyoto Protocol, that runs out in 2012, countries have targets for CO2 reduction. If they
have not met their targets by 2012, they are obliged to buy GHG allowances (AAU’s) on the CO2-
market. Spain is an example of a country where this might happen. A similar mechanism is likely to
be in place after 2012, even though this is not exactly known at this point. With increased energy
savings, countries are less likely to incur such costs.
Reduced exposure to the volatility of energy prices
For businesses where the energy bill is a large part of their operational costs it is important to have
some security on short and medium term energy prices. Especially for those companies reducing
their energy bills, this means a lower risk and therefore lower costs. We expect that this effect is
mostly relevant for steel production, refineries and other very large energy consumers. In addition,
when such companies save energy in their processes this is mostly not related to the Ecodesign
Directive. It is highly likely that Ecodesign benefits are relatively small. It was therefore not explored
in further detail in this study.
An energy price risk for companies that has been explored before in a McKinsey study is the risk of
economic instability due to volatile oil pricesxvii. Saving oil will reduce this risk.
However, it should be noted that these price shocks concern the oil prices rather than natural gas and
coal prices. Ecodesign is more effective in reducing gas and coal imports than it is in reducing oil
imports (~2% in 2020). Therefore Ecodesign will not be the most effective tool to reduce this price
volatility risk.
Competitiveness of the European appliances industry
The effect of job creation through spending of energy savings in other sectors was already discussed
and was shown to be a dominant effect in job creation by an ACEEE study.
The effect of Ecodesign on the competitiveness of the European appliances industry in particular is
also very relevant, as they are important stakeholders in the Ecodesign process. Even though it was
beyond the scope of this study to carry out a detailed analysis on this topic, some points can be
made in support of the statement that ambitious Ecodesign standards will be beneficial to the
European appliances industry in the long run.
In the short term, whether stronger standards are an advantage for a particular company will depend
on the kind of company. A front runner company with the majority of their models complying with
upcoming regulation at an early stage will have an advantage over the companies who have to stop
producing non-compliant models. Therefore, depending on the company, Ecodesign could affect sales
of appliances and employment of a given company both ways. For companies exporting to countries
outside the EU, stronger EU measures could, in the short term, be advantageous as well as
disadvantageous.

BESNL11688 14
In considering effects for industry in the longer term, we need to realise that climate change,
volatility of energy prices and the need for security of supply will not go away overnight and will
remain drivers for efficiency in the future, in Europe as well as the rest of the world. Therefore, more
and more governments are stepping up their efficiency policies and more and more companies see
being able to offer efficient products as a way to sustain their business in the long term. Such
companies welcome instruments like Ecodesign that provide a level playing field. If Ecodesign is at
the forefront of countries in establishing ambitious efficiency standards, European companies with a
home market in Europe will be at the forefront of being able to deliver complying and cost-effective
products.
In the standards setting process it is important for companies that future targets for efficiency are set
ahead of time. It could provide considerable incentives to manufacturers to step-up the development
of new technologies able to meet future requirementsxviii. If done in this way, Ecodesign can be a
driver for innovation. In addition, feedback from industry indicates that these lead times enable the
market to minimise any cost implications from increased efficiency regulations by integrated design
and manufacturing changes into normal industrial cyclesxviii. The CSES Ecodesign evaluation has the
following comments specific for Ecodesign: “in general industry does not seem to consider that
Ecodesign has introduced excessive additional costs. The significant lead time provided before the
introduction of the demanding Tier 2 requirements allows industry to integrate production changes
into the product design cycle of most firms”vii.
BESNL11688 15
3 Does Ecodesign deliver? With such a large savings potential and potential for economic benefits, it is of utmost importance to
ensure that Ecodesign delivers its promises: maximised cost-effective savings, in a timely fashion. In
the paragraphs that follow however, data are presented that indicate that the full benefits of
Ecodesign are not being reaped. In §3.1 we discuss the time it takes to go from a preparatory study
to an implementing measure going into effect. In §3.2 we illustrate how such a lead time from study
to final measure leads to less stringent measures than intended by Ecodesign, thereby putting
savings at risk.
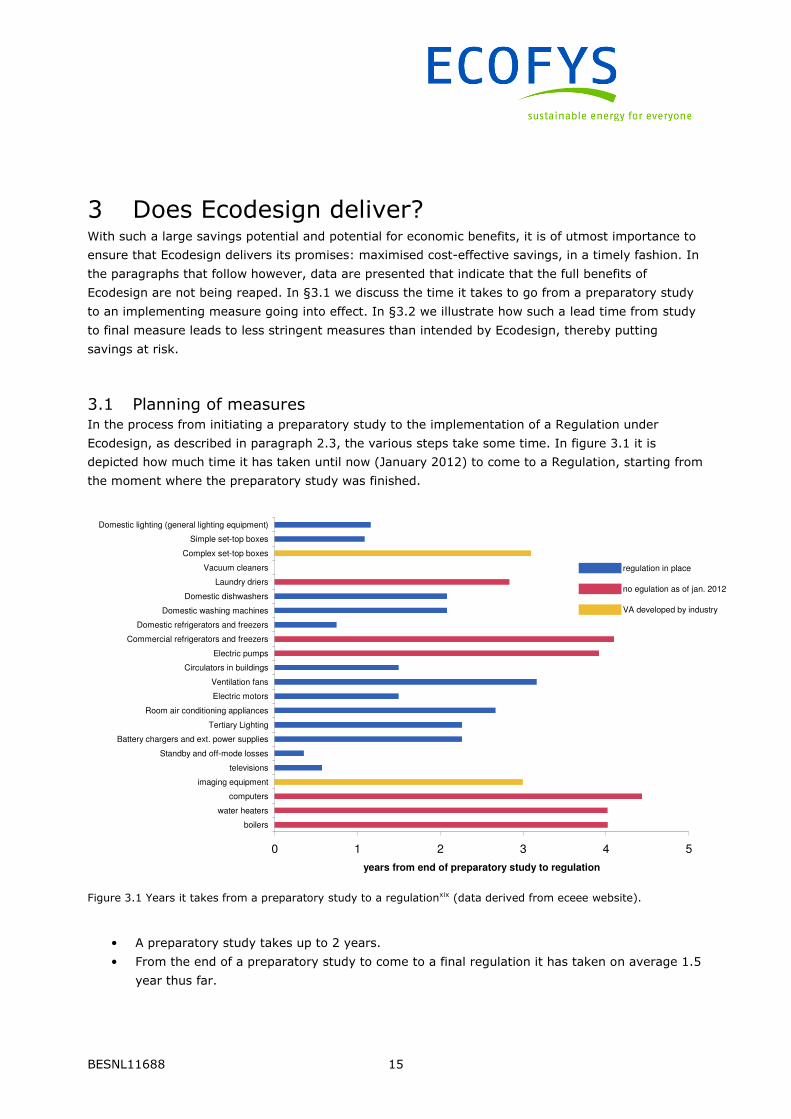
3.1 Planning of measures In the process from initiating a preparatory study to the implementation of a Regulation under
Ecodesign, as described in paragraph 2.3, the various steps take some time. In figure 3.1 it is
depicted how much time it has taken until now (January 2012) to come to a Regulation, starting from
the moment where the preparatory study was finished.
0 1 2 3 4 5
boilers
water heaters
computers
imaging equipment
televisions
Standby and off-mode losses
Battery chargers and ext. power supplies
Tertiary Lighting
Room air conditioning appliances
Electric motors
Ventilation fans
Circulators in buildings
Electric pumps
Commercial refrigerators and freezers
Domestic refrigerators and freezers
Domestic washing machines
Domestic dishwashers
Laundry driers
Vacuum cleaners
Complex set-top boxes
Simple set-top boxes
Domestic lighting (general lighting equipment)
years from end of preparatory study to regulation
Figure 3.1 Years it takes from a preparatory study to a regulationxix (data derived from eceee website).
• A preparatory study takes up to 2 years.
• From the end of a preparatory study to come to a final regulation it has taken on average 1.5
year thus far.
regulation in place
no egulation as of jan. 2012
VA developed by industry
BESNL11688 16
• There is one year in between the Regulation becoming final and the first standard coming into
effect.
• This implies that for the 12 Regulations in place to date, the time for initiating a study to a
standard going into effect was 3.5-4.5 years on average.
Moreover, preparatory studies make use of efficiency data that are one or more years old. Data from
official statistical sources are at least 2-3 years oldvii. This means that efficiency measures going into
effect at a certain time are based on the situation of at least 5 years ago, but chances are that this is
6-7 years. Even if assumed that the measure is not watered down in the process, there is a real
chance that technology progress over these 5 years make the measure less effective. Moreover,
for most appliance groups, minimum energy performance levels are defined in several stages, or
tiers. Tier 1 is a transition phase, preparing the market for measures at lowest life cycle costs. Tier 2
enters into effect a few years later. Therefore, Tier 2 requirements are based on data that are at least
7 years old, if not 8-9 years old. We will illustrate this in the next paragraph.
But the story does not end here. The 12 measures in place are in fact the more successful ones.
For six measures, among which very important ones (boilers, water heaters), no regulation has been
made after on average four years of finishing the preparatory studies. This deadlock will dramatically
affect projected savings in 2020 for these products groups.
In fact, this observation was also made in an evaluative study on Ecodesign ordered by the European
Commission. The reason given in the study was already pointed out in §1.6: international comparison
points out understaffing for Ecodesign at the EU-levelvii.
3.2 Ecodesign ambition: lowest life cycle costs According to the Ecodesign Directive, “Concerning energy consumption in use, the level of energy
efficiency or consumption must be set aiming at the life cycle cost minimum to end-users for
representative product models”.
Life cycle costs of energy using products are determined by the investment costs and the energy
costs during its lifetime. Increasing efficiency with respect to a standard product decreases energy
costs during its lifetime and often (though not always) results in increased investments costs. Adding
these two effects causes a life cycle cost curve go through a minimum when increasing efficiency
from standard to most efficient products.
Below, we discuss how this ambition of lowest life cycle costs has worked out for four household
appliances, making use of data from an earlier study, where costs and efficiency data of four
electrical household appliance groups were examined and compared with Ecodesign minimum energy
performance standards Tier 1 and Tier 2.
In figure 3.2 the Life Cycle Costs (LCC) are shown for three efficiency categories of products:
standard (the reference level at 0 kWh savings per year), cost-effective (the minimum in each of the
curves) and most-efficient. These are the points on the curves that are drawn to guide the eye. In

BESNL11688 17
case of lighting, the cost-effective and most-efficient categories coincide: this was the CFL (Compact
Fluorescent Lighting)-technology.
0
200
400
600
800
1000
1200
1400
1600
0 50 100 150 200
kWh savings /year
LCC
(E
uro
)
Television
Refrigerator
Washing machine
Lighting
T1 T2
T1 T2
T1T2
T2
Figure 3.2 Life cycle costs of 4 appliances groups and Ecodesign requirements. Points on the curve indicate the
standard level, cost-effective level at the minimum of the LCC curve and most-efficient level. Tier 1 and Tier 2 of
the Ecodesign requirements of the various products groups are denoted with T1 and T2.
T1 and T2 in the figure designate the savings level for Tier 1 and Tier 2 for each of the appliance
groups. In the case of lighting, Tier 2 is the stage where incandescent light bulbs are completely
banned (in 2012), but halogen lighting is still allowed.
Figure 3.2 shows that in all four cases, the cost-effective level is not reached in Tier 1, but this is not
surprising as Tier 1 is mostly used as a transition measure to prepare the market for Tier 2
requirements. For washing machines, refrigerators and televisions it looks like cost-effective levels
will be reached in Tier 2. However, as discussed in the previous paragraph, it should be realised that
the data on which these graphs are based date at least 5 years back at the time the first Tier comes
into effect and at least 7 years back by the time the second Tier comes into effect. In the mean time,
the market has evolved:
1. efficiency in all efficiency categories will show some improvement without policy intervention,
through incremental efficiency improvement and through introduction of new technology.
2. prices tend to go down over time, due to volume increases, technology development and
improved design.
It would be interesting to compare the LCC-curves of figure 3.2 with updated LCC-curves by the time
Tier 2 goes into effect, about 7 years later. Unfortunately these data are not readily available. In the
CSES Ecodesign Evaluation this lack of data is discussed in detail. For example, it is mentioned that
BESNL11688 18
“it is not possible to assess progress against these estimated energy savings and consequently the
2020 policy targets at this stage due to data unavailability”vii.
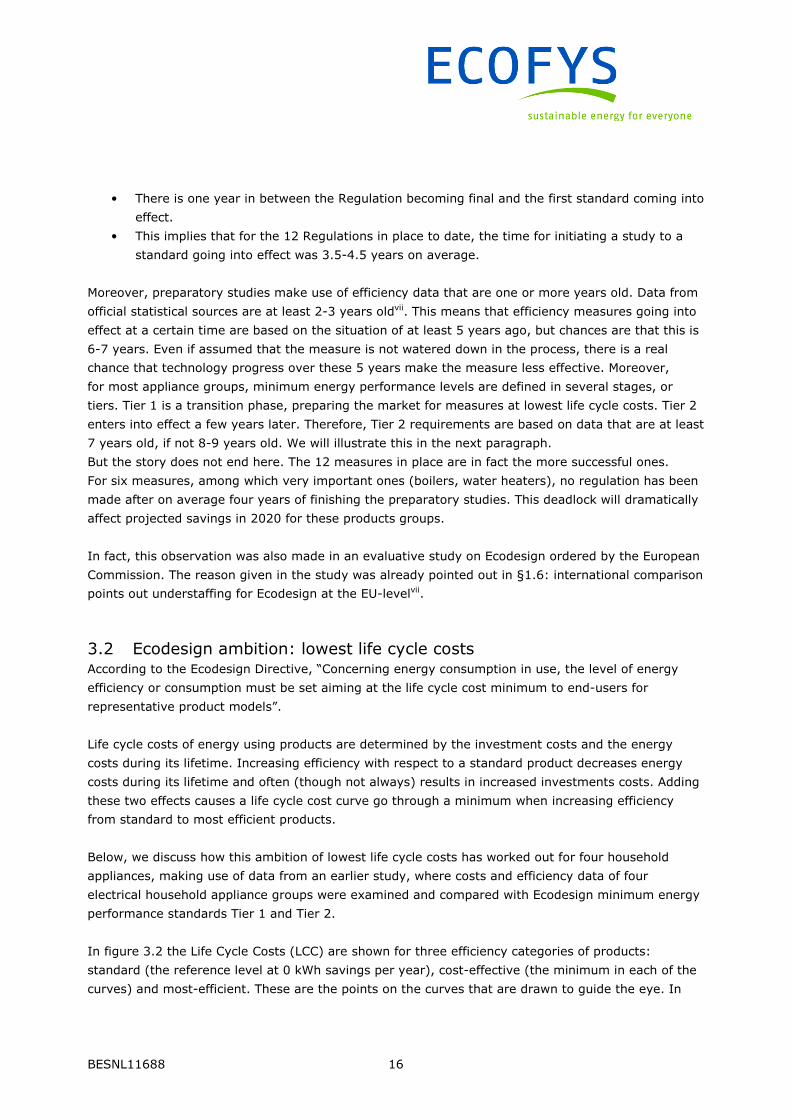
In this scoping study, to get an idea of what it could look like, we made some realistic assumptions
and examined the effects, for the television and the refrigerator. We assumed a 22% price decrease
in 7 years, resulting in 11% lower life cycle costs for the most-efficient categoryxx. Furthermore an
efficiency improvement of 2% per year was assumed, resulting in higher savings and further lowering
of life cycle costs. This is depicted in figure 3.3 for the curves in lighter colours.
0
200
400
600
800
1000
1200
1400
0 50 100 150 200
kWh savings /year
LCC
(E
uro
)
Television
Refrigerator
T1
T1T2
T2
Figure 3.3 life cycle costs for the television and refrigerator, together with how the life cycle cost curve could look
like 7 years later (lighter colours used). Tier 1 and 2 levels are at the same efficiency level as in figure 3.2.
From the figure, a shift of the minimum of the curve shifts to higher efficiency levels can be
observed. In addition, the whole curve shifts to lower costs and higher efficiency. Depicted this way,
the observations are, that 7 years later
• T1 requirements will be less efficient than minimum levels of efficiency without policy
intervention. In other words, T1 requirements have had no stimulating effect for efficiency
over business as usual.
• T2 requirements are significantly less stringent than the LCC level by the time they go into
effect.
• The whole life cycle costs curve is below the life cycle costs for standard technology 7 years
earlier.
This last observation is perfectly in line with what numerous studies have shown earlier: over the
years, efficiency improvement and price decrease go hand in hand. For example, analysis of MEPS
programmes in Europe, United Kingdom, United States, Australia and Japan shows that all products
examined have experienced a decline in real prices of between 10% to 45%, while energy efficiency

BESNL11688 19
increased by 10% to 60% over the periods when the data was collectedxviii. Moreover, numerous
studies have found that policy interventions have accelerated the rate of improvement of energy
efficiency without affecting the long term downward trend in pricesxxi.
The above shows that, due to the lead time between original study and a measure going into effect,
Ecodesign standards run the risk of being set at too modest levels of efficiency. More ambitious
standards can easily be set without burdening consumers with excessive life cycle costs. Even extra
investments costs are quite moderate: using the original data from fig. 3.2 a household would spend
on average €13 per year more on investment costs on the four appliance groups when buying cost-
effective appliances instead of standard appliances. These extra investment costs would be earned
back though, as life cycle costs are lower: simple payback times range from 0 (for the TV) to 2 (for
lighting) to 4 (for the washing machine) to 8 years (for the refrigerator) for the cost-effective cases.
If buying only the most-efficient appliances, a household would spend €57 per year extra on
investment costs compared to the standard case.
In the CSES Ecodesign evaluation it was also noted that the „Least Life Cycle criterion should be
applied more flexibly and on occasions when there is not an excessive initial impact on prices, equal
life cycle costs (i.e. no additional costs to consumers over the life cycle) could be used“vii. In fact, our
figure 3.3 shows that using equal life cycle cost as criterion at the time of study results in being close
to the lowest life cycle cost-point 7 years down the road.
It should also be noted that having a lead time in between the commencement of a study and a
standard going into effect is in itself not a bad thing. It is even desirable, as these lead times enable
the industry to minimise any cost implications, as was already noted in §2.6.
3.2.1 Televisions
It was already shown in the previous paragraph that for televisions Ecodesign standards set thus far
do not reach the intended goals of the cost-effective level. In this paragraph we show that the
market for televisions is in fact already way ahead of the standards and that the standards as they
are likely not to give any additional savings.

BESNL11688 20
0%
5%
10%
15%
20%
25%
30%
35%
A+ A B C D E F G
Efficiency class
Ecodesign MEPS Tier 2, in effect April 2012
Ecodesign MEPS Tier 2, in effect Aug. 2010
Figure 3.4 Distribution of label classes of TV’s found in stores in Germany, november 2011.
In figure 3.4 the distribution of energy labels of TV’s found in stores in Germany is shownxxii.
If Tier 2 of televisions would be a driver for efficiency one would expect that the D-label class would
be highly populated as the Tier 2 deadline is approaching. Instead, the overwhelming majority of TV’s
on the market are A, B and C televisions.
It is well known that the Ecodesign standards are set based on information from manufacturers that
did not include LED-backlit TV’s yet. They appeared on the market shortly after the Ecodesign
implementing measure was set. It is also well known that efficient televisions do not cost anything
more than less efficient televisions. In other words, the disparity between the 2 LCC-curves for
televisions is likely to be even bigger than what was depicted in figure 3.2.
Better monitoring of the market, before and after setting of standards, would enable legislators to
react more quickly to the market and set better standards in the first place. This observation was also
made in the official evaluation of the Ecodesing Directive: “introduction of a requirement for on-line
registration of all new models, as is the case in the corresponding US and Australian energy efficiency
programmes should be seriously considered for future Implementing Measures and revisions. It can
contribute to improving market surveillance, market monitoring and the review of the effectiveness of
the Implementing Measures.”vii.
BESNL11688 21
4 Conclusions and recommendations In this report we have shown that the Ecodesign Directive can create huge benefits for the European
economy:
• €90 billion net savings per year for business and consumers by 2020
• Investment of saved energy costs creates 1 million jobs by 2020
• The reduced need for heat and electricity can reduce gas imports by 23% in 2020 and coal
imports by 37%. Import of gas from Russia could be reduced by 56% and import of coal from
Russia could be stopped altogether.
However, it has been observed that there are problems with the implementation of Regulations for
specific groups that put these economic benefits at risk.
First, there is a large lead time between the initiation of an appliance standard and a standard coming
into effect. For the 12 measures in place the timeframe was reasonable and to be expected.
However, 6 more appliance groups have failed to result in measures up until now, years after the
preparatory study was finished. Product groups with huge savings potentials such as boilers and
water heaters are among the delayed groups. The delays are due to the complexity of the products
and the lack of sufficient manpower at the European Commission to handle this complexity.
Second, for the product groups that did result in standards in a reasonable time frame there is a risk
that standards do not go far beyond business as usual and do not reach the Ecodesign ambition of
lowest life cycle costs. This is because standards are based on information on efficiency and cost that
is outdated by the time the standard takes effect.
Example of insufficient ambition: televisions
For televisions it was observed that the Ecodesign measures do not have any effect on the market, as
the bulk of the appliances sold was already more efficient that the imposed standards before the
standard went into effect.
The figure below shows the distribution of label classes of TVs found in stores in Germany in
November 2011. The Ecodesign standards Tier 1 and 2, that went into effect in August 2010 and April
2012, respectively, are also shown. It is clear from the figure that the market for televisions is ahead
of the standards.
The current Ecodesign standards are set based on information from manufacturers that did not
include LED-backlit TVs yet. They appeared on the market shortly after the Ecodesign implementing
measure was set.

BESNL11688 22
0%
5%
10%
15%
20%
25%
30%
35%
A+ A B C D E F G
Efficiency class
Ecodesign MEPS Tier 2, in effect April 2012
Ecodesign MEPS Tier 2, in effect Aug. 2010
Figure 4.1 Distribution of label classes of TV’s found in stores in Germany, november 2011.
Delays in standards and weak standards put the economic benefits described above at risk.
4.1 Recommendations In order to reap the full fruit of this piece of legislation we recommend to step up efforts for effective
and timely Regulations.
We recommend:
1. To raise awareness among decision makers on the full power of the Ecodesign Directive to
reduce energy dependency of member states and diminish energy bills of companies and
citizens. In contrast to some other EU policies, strengthening the minimum energy
requirements of appliances would not deteriorate the competitive position of European
manufacturers. This is because non-EU manufacturers should also comply with these
requirements when entering the EU-market.
2. To devote more manpower from EC and/or Member States to ensure that measures are put
in place in time and with sufficient ambition.
3. To ensure that the methodology of making Implementing Measures takes into account the
dynamics of the market, by anticipating lower prices of energy efficient technology. In this
way, minimum energy performance standards will really be at the lowest life cycle cost by the
time they go into effect.
4. To improve monitoring of market development and ongoing collection of efficiency and cost
data. This could be facilitated by requiring manufacturers to at least supply efficiency data, as
is done for example in Australia and the USA.

BESNL11688 23
Annex A Ecodesign savings per appliance group
Source of savings: Wuppertal reportxiii.
Last column: is appliance group related to households (hh), services sector (s) or industry (ind) or a
combination thereof?
Heat/Fuel savings Electricity savings
Minimum Maxi-mum
Minimum Maxi-mum
hh / s / ind?
TWh final TWh final TWh final TWh final
Simple set top boxes 0 0 7.2 7.2 hh
Boilers 184 323 12.4 21.9 hh s
Water heaters 82 161 4.9 9.5 hh
Computers and monitors 0 0 5.5 7.6 hh s
Imaging equipment 0 0 2.3 2.3 hh s
Consumer electronics: TV's 0 0 22.3 22.3 hh
Standby and off-mode power losses 0 0 27.9 27.9 hh s
External power supplies and battery charges
0 0 7.2 7.2 hh s
Office lighting 0 0 32.1 32.1 s
Street lighting Part of office lighting number
s
Comfort fans 0 0 1.1 1.8 hh
Residential ventilation 0 0 0.4 1.2 hh
Room air-conditioners 0 0 10.1 24.7 hh
Electric motors 0 0 83.4 83.4 ind
Fans 0 0 34.7 47.7 s ind
Circulators 0 0 18.2 18.3 hh s
Pumps 0 0 2.3 5.2 s ind
Commercial refrigerators and freezers 0 0 12.3 16.6 s
Domestic refrigerators and freezers 0 0 3.6 3.6 hh
Domestic washing machines, dishwashers
0 0 15.1 15.1 hh
Solid fuel small combustion installations
6 18 0 0.1 hh
Laudry dryers 0 0 0.3 1.3 hh
Vacuum cleaners 0 0 25.1 25.1 hh
Complex set top boxes 0 0 2.6 4.6 hh
Domestic lighting part 1 0 0 25.6 31.7 hh
Domestic lighting part 2 0 0 78.9 81.5 hh
Local room heating products 49 90 6.6 12.1 hh
Central heating products Merged with local room heating products

BESNL11688 24
Domestic and commercial ovens Merged with local room heating products
Domestic and commercial hobs and grills
0 0 2.7 8 hh s
Professional wet appliances and dryers 0 0 0.1 0.4 s
Non-tertiary coffe machines 0 0 0.9 2.6 hh
Networked standby losses 0 0 3.1 3.1 hh s
Refrigerating and freezing equipment 0 0 15.3 15.3
Transformers 0 0 3.6 6.8 ind
Sound and immaging equipment 0 0 8.3 8.3 hh s
Industrial ovens 0 0 0.4 1 ind
Machine tools 0 0 15 22.5 ind
Tertiary air conditioning 0 0 8.7 20.2 s
Medical imaging equipment 0 0 0 0 s
TOTAL 321.3 592.9 500.2 600.2

ECOFYS Netherlands B.V. | Kanaalweg 15G | 3526 KL Utrecht| T +31 (0)30 662 33 00 | F +31 (0)30 662 33 01 | E [email protected] | I www.ecofys.com
References i See http://www.eceee.org/Ecodesign/products for a full overview. ii From the overview on the website of DG Enterprise, Sustainable and responsible business
- products, http://ec.europa.eu/enterprise/policies/sustainable-
business/ecodesign/product-groups/index_en.htm. iii Energy related products are products that do not use energy directly but influence the
energy consumption by other products. Examples of this are windows or shower heads (see
also Ecodesign Directive 2009/125/EC, p. 10). iv Derived from M. van Elburg et al, Study on Amended Working Plan under the Ecodesign
Directive, Van Holsteijn en Kemna B.V. (2011). v Presentation Paul Hodson Introduction to Ecodesign, 13 April 2011. vi For ETS reduction potential: B. Wesselink, R. Harmsen, W. Eichhammer (2010). Energy
savings 2020, how to triple the impact of energy saving policies in Europe, Ecofys and
Fraunhofer ISI. Ecodesign CO2 reduction potential derived from total savings in this study,
with an emission factor for electricity of 460 g CO2/kWh and heat (actually natural gas) 202
g CO2/kWh. vii Evaluation of the Ecodesign Directive (2009/125/EC) Draft Final Report, CSES and
Oxford Research (Dec. 2011). viii See the Sustainable and Responsible Business - Products section of DG Enterprise and
Industry (http://ec.europa.eu/enterprise/policies/sustainable-business/ecodesign/product-
groups/index_en.htm). ix W. Irrek et al., Task 3 Report: Outlook on the estimated GHG emissions reductions
Analysis of impact of efficiency standards on EU GHG emission (Ecodesign Directive),
European Commission, Contract 070307/2008/506876/SER/C5, Wuppertal Institute for
Climate Environment and Energy, Ökopol, RPA (2010). x Reference IX, p. 47. There is an error in figure 3 on p. 47, indicating 14.4% electricity
savings, while using the numbers (3447 TWh BAU in 2020, 600 TWh savings) results in
17% savings. xi EU Energy Statistics 2008. xii M. Ballu, E. Toulouse, Energy savings in practice, potential and delivery of EU Ecodesign
measures. Brussels, Coolproducts for a cool planet campaign (2010). xiii R. Gold, S. Nadel, J.A. Laitner, A. deLaski, Appliance and equipment efficiency
standards: a moneymaker and job creator, American Council for an Energy-Efficient
Economy (2011). xiv Europe’s energy position - markets and supply. European Commission’s Market
Observatory for Energy (2009). xv P. Capros et al, EU energy trends to 2030 — UPDATE 2007, EUROPEAN COMMISSION
Directorate-General for Energy in collaboration with Climate Action DG and Mobility and
Transport DG (2009). The 2007 update was used in order to use numbers where Ecodesign
savings have not been incorporated yet.
xvi Derived from M. van Elburg et al, Study on Amended Working Plan under the Ecodesign
Directive, Van Holsteijn en Kemna B.V. (2011). xvii T. Janssens, S. Nyquist, O. Roelofsen, Another oil shock? McKinsy Quarterly, McKinsey
(Nov. 2011). xviii Ellis, M. (2007). Experience with energy efficiency regulations for electrical equipment. IEA
Information paper, OECD/IEA. xix Data derived from ECEEE, www.eceee.org. xx A 14% price decrease in 5 years can be achieved with 20% per year market growth of
the higher efficiency segment in combination with a progress ratio of 90%. Such progress
ratio’s have been found for large household appliances (e.g.: M. Ellis, N. J., L. Harrington,
A. Meier, “Do energy efficient appliances cost more?”, ECEEE summer study (2007). The
15% price decrease results in ~8% lower life cycle costs. xxi R. Salmons, R. Vanner, S. Mudgal, A. Tan, F. Cohen and F. Cachia, Impacts of
innovation on the regulatory costs of energy-using product policy, Policy Studies Institute &
BIO Intelligence, by order of Defra (2011). xxii BUND (Friends of the Earth Germany), november 2011.