economic challenges of small-scale vegetable production and retailing in...
TRANSCRIPT

Economic Challenges of Small-Scale Vegetable Production and Retailing in Rural Communities: An Example from Rural OklahomaJon Biermacher, Steve Upson, David Miller, and Dusty Pittman
Information regarding the economic potential of producing and retailing vegetables in rural communities is limited. This study determined the actual net return from producing and on-site retailing a mix of produce in a rural Oklahoma community and determined if consumers in the region were willing to pay differentiated prices for the locally grown vegetables. Although the project did not generate a profit, a wealth of insightful information was gained. Results show that a substantial number of consumers were willing to pay premiums for certain types of produce; however, there were not enough such consumers to overcome the production and harvesting expenses.
Biermacher, is a research economist, Upson is a horticultural specialist, Miller is a research associate, and Pittman is a research assistant, The Samuel Roberts Noble Foundation, Inc., Ardmore, OK. The authors wish to extend gratitude to Albert J. Allen and three anonymous reviewers of the Journal for their useful comments and insights.
Currently, the bulk of our nation’s produce is pro-duced in specific growing regions in California, Florida, Washington, Idaho, and Arizona where certain comparative economic advantages exists, including growing conditions, labor markets, processing facilities, and operating capital (NASS 2002). In addition, a large percentage of our nation’s produce is imported during the off-production sea-son from Latin American countries such as Mexico and Chile who have similar comparative advantages in production. As a result of these comparative ad-vantages, farms producing in these regions often exhibit constant returns to scale.
Recently, though, consumer trends appear to be moving in favor of the more highly publicized locally grown produce. As an example, the cover of the March 13, 2007 issue of Time magazine featured a caption that read “Forget Organic; Eat Local” (Cloud 2007). Many other studies report that consumer demand for higher quality, locally grown fruits and vegetables have increased substantially (AMS-USDA 2002; Wolf, Spittler, and Ahern 2005; Estes 2003; Eastwood, Brooker, and Gray 1998). This increase in preference has been driven primar-ily by increases in household income and exposure to higher levels of education. This rise in demand has been most noticeable in urban communities with the development of numerous economically successful fresh produce markets.
At the same time the nation has been shifting its preferences towards locally grown produce, myriad health-awareness organizations working closely with state and local governments and school administrators are stepping up their battle against the national child-obesity crisis with the creation of many national and state farm-to-school programs. These programs seek to educate children about food nutrition and to better inform children about where and how food is produced. An additional goal of the programs is to infuse locally grown vegetables into schools in an attempt to provide students with meals that include a better selection of high-quality fruits and vegetables. Some have hypothesized that these “farm-to-school” programs will further stimulate demand for locally grown fruits and vegetables. With this anticipated expansion in demand for lo-cally grown produce, many producers in the rural agrarian regions of the United States are interested in knowing if they have additional opportunity to supplement their farm income by producing and retailing fresh produce.
A better question for these producers to ask would be if opportunity exists to engage in eco-nomically viable small-scale fruit and vegetable production and retailing enterprises. Identifying answers to this question better serves the majority of producers as most of them lack the comparative (economic) advantages necessary for large-scale efficient production of most types of produce, especially those types that are labor-intensive and perish quickly. Much of the research regarding lo-cally grown produce has focused on urban demand, including numerous willingness-to-pay studies that seek to determine the premiums that consumers are willing to pay for locally grown produce (Darby et

Journal of Food Distribution Research 38(3)2 November 2007 Biermacher et al. Economic Challenges of Small-Scale Vegetable Production and Retailing 3
al. 2006; Loureiro and Hine 2002; Govindasamy and Italia 1998; Yen et al. 2004). However, little research focuses on the connection between cost of production and willingness-to-pay for locally grown produce by rural consumers.
In response to these issues, agricultural pro-duction scientists at the Samuel Roberts Noble Foundation (a non-profit agricultural-research institution located in south-central Oklahoma) established a small-scale fresh produce production and retailing pilot program in 2005. The two-year program, known as the Noble Produce Garden and Market, was designed to engage in the small-scale production and on-site retailing of a mix of fresh vegetables, fruits, and various flowers to citizens living in or near the rural community of Ardmore, which is located in south-central Oklahoma. The primary goals of the first year of the project were to select and produce a mix of fruits, vegetables, and cut flowers; to establish the produce market; and to make the community aware of Noble Produce Garden and Market by adopting an effective public-awareness campaign. As a result, economic infor-mation for the first year of the program is limited. In an effort to expand the production and economic body of knowledge from the project, the goals set for the second year of the project were expanded to include determining the actual costs and net returns of producing the mix of fruits, vegetables, and flowers and determining if consumers in this rural community are willing to pay a differentiated price above the price charged by local supermarket chains. Production information gathered from the project would be useful to producers who are in-terested in growing produce. Retailing information could be useful to local producers and marketers because it would help them make better decisions regarding the best way to apply their marketing resources. This information would also help state and local food-procurement officials determine how much they will have to pay producers for locally grown produce for rural schools.
Information gathered in the second year (2006) of the project will be our primary focus of discus-sion in the remainder of the paper; however, infor-mation obtained in the first year of the project will also be used to provide additional insight. In the next section we provide a detailed description of the production activities, including a description of the crop mix and production technologies used in the
garden project. Next, we discuss the management protocol for the retailing operation. We then report our findings of both the production and retailing activities, and comment on their implications for farm producers and policy makers. We conclude with an outline of the limitations of the study and discuss our plans for future research.
Crop Mix and Production Technologies
In the spring of 2005 and 2006, horticulturalists initiated production activities for 24 various types of fresh vegetables, fruits, and assorted flowers. Production activity for each crop type was divided into four primary stages of production: preplant, planting, harvesting, and cleanup stages. Vegetables produced included eight varieties of pepper, (green bell, Italian long, banana, jalapeño, Anaheim, and pablano [Capsicum annuum]), and red and yellow habanera (Capsicum chinense); three varieties of squash, (yellow squash, gold zucchini squash, and green zucchini squash [Cucurbita pepo]); eggplant (Solanum melongena); snap bean (Phaseolus vul-garis); southern pea (Vigna unguiculata); cucum-ber (Cucumis sativus); sweet corn (Zea mays); and okra (Abelmoschus esculentus). Fruit enterprises included seeded and seedless watermelon (Citrul-lus lanatus), cantaloupe (Cucumis melo), and field tomato (Lycopersicon esculentum). Three types of cut flowers were produced: gladiola (Gladiolus grandiflorus), sunflower (Helianthus annuus), and zinnia (Zinnia elegans).
The mix of produce was chosen based on past experience of production scientists located at research institutions throughout the region to reflect the expected product suitability regarding the region’s growing conditions and expected de-mand by local consumers. Production technologies used for each crop type reflect best management practices developed by production scientists at USDA-ARS, Oklahoma State University, Texas A&M University, University of Arkansas, and the Noble Foundation.
All production occurred on one of two prop-erties owned by the Noble Foundation. The Dupy Research Farm (DRF), located approximately ten miles northeast of the south-central Oklahoma com-munity of Ardmore, was used to produce all summer squash, okra, sweet corn, cantaloupe, southern pea, and snap bean. Soil preparation for these enterprises

Journal of Food Distribution Research 38(3)2 November 2007 Biermacher et al. Economic Challenges of Small-Scale Vegetable Production and Retailing 3
was performed on a Dale silt loam soil using con-ventional tillage practices. Crops produced at the DRF were produced using conventional tillage practices (CTP) and irrigated using an overhead linear irrigation system. Irrigation needs were determined using a “feel and appearance method” (NRCS-USDA 2006).
All other produce was produced at the Headquar-ters Research Farm (HRF), located on the eastern boundary of Ardmore. All varieties of pepper and eggplant and field tomato were produced using conventional tillage practices and non-permanent raised growing beds with plastic mulch (RBPM) in a Weatherford fine sandy loam soil. Both seeded and seedless watermelon enterprises were also produced on a Wilson silt loam soil using conventional tillage methods and non-permanent raised growing beds with plastic mulch (RBPM). Cucumber, zinnia, and sunflower were produced outside in permanent raised growing beds (PRGB) in a loam soil amended with peat moss.
Hoop houses have been shown to be a useful technology for early-season production and season extension of certain horticultural crops (Lamont et al. 2003; Wells 1996; Wells 2000; Wells and Loy 1993). As a result, early-season field tomato, yel-low squash, cucumber, and zinnia were grown in hoop houses equipped with permanent growing beds (HHPB). Similar to the PRGB technology, the HHPB technology used a loam soil amended with peat moss. All crops grown at the HRF (in-cluding crops grown using HHPB technology) were irrigated using a drip-type system. Irrigation was initiated when a soil water-tension reading between 30 and 40 centibars (approximately 50 percent of available water depletion) was indicated using a tensiometer. Irrigation was terminated when the soil moisture level reached filled capacity as indicated by the tensiometer.
Although a direct comparison of costs and re-turns of crop enterprises, including crops grown using the HHPB technology, could not be made due to differences in scale of production, the actual costs and returns were computed as separate activities.
Due to excessive rainfall and weed problems in 2006, several preplant activities had to be repeated prior to planting. In addition, several crops such as field tomato and sweet corn required several plant-ing dates to ensure a continual supply of product throughout the summer. Production activities for
the project started in the first week of March and lasted through the latter part of August, accounting for approximately six full months of production. In 2005, weather patterns were more stable, and as a result fewer complications existed for the produc-tion activities.
Nine full-time summer workers (high school stu-dents) were employed throughout the four stages of production. College interns were used to retail the produce and collect a variety of marketing data. Summer workers were paid an average of $7.15 per hour, and on average worked 40 hours per week. Noteworthy is the reality that throughout the grow-ing season, worker absences due to various planned reasons were common. As a result, many days there were only five or six summer workers working on the project. Summer workers and interns recorded hours they spent working on each enterprise. In addition, two salaried horticultural technicians managed each stage of production, and the hired labor. Their time was also recorded, and as a result the project yielded accurate work hours for each crop in each stage of production.
We note here that in many cases farm producers may be willing to provide their own farm family labor at a lower reservation wage, which will likely influence the expected profitability of the small-scale enterprise. As a result of this possibility, we also calculate expected profitability to unpaid fam-ily labor assuming an efficient family workforce.
Several types of farm machinery, equipment, and other fixed resources were used in this proj-ect. Specific records were kept to account for the actual hours each piece of machinery (and labor) was used for each stage of production for each type of produce. Procedures published by the Society of Agricultural and Biological Engineers (2006) were used to compute costs associated with using all machinery, equipment, and buildings.
Rural Community and Retailing Activities
The city of Ardmore was assumed to represent a center for commerce for residents living in the rural region of south-central Oklahoma. Located in Carter County, Ardmore and the surrounding rural communities of Dixon, Lone Grove, and Gene Autry have approximately 47,000 residents (U.S. Census Bureau 2007). In addition, Ardmore is located adjacent to Interstate 35 and is centrally
Journal of Food Distribution Research 38(3)4 November 2007 Biermacher et al. Economic Challenges of Small-Scale Vegetable Production and Retailing 5
located about 100 miles from both the Dallas/Fort Worth metropolitan area in Texas and the Oklahoma City metropolitan region in Oklahoma.
Median household income in Carter County, Oklahoma in 2006 was approximately $32,000, about 80 percent of the median household income for the state of Oklahoma and only about 67 percent of the median income for the U.S. (U.S. Census Bu-reau 2007). Based on these statistics, a reasonable argument could be made that citizens living in Carter County would likely be quite sensitive to prices for many of the products they consume. Furthermore, retail gasoline prices have increased by 98 percent between 2002 and 2007 (U.S. Energy Information Agency 2007). This increase has certainly affected consumers spending patterns in rural communi-ties, which will likely continue to influence their wiliness to pay for many high-value products that carry premiums, including higher-valued fruits and vegetables. It will also affect consumers’ willing-ness to drive additional miles to purchase products they can acquire at a single location.
The decision regarding the best way to market our fresh produce was given much thought and consideration. Initially, several possibilities were considered, including a pick-your-own system, the use of road-side stands, using a farmers’ market, on-site retailing, or some combination of each of these options. However, given our financial, labor, and liability constraints we decided to use an on-site retailing operation. We note here that we did not conduct any economic analysis to help us determine if this was the most economic retailing choice.
In 2006, the Noble Produce Market was first open to the public on June 15th and remained open until August 11th. Public access to the market was similar in 2005. In both years, fresh produce was retailed out of a commercial-sized distribution warehouse located on the site of the Noble Foundation’s Head-quarters Research Farm. The Noble Produce Market was conveniently located on the eastern edge of Ardmore on Oklahoma State Highway 199, which is a well traveled thoroughfare that links Ardmore with neighboring communities of Dixon and Gene Autry. Also, the location of Noble Produce Market was well marked and highly visible to travelers passing by in either direction on the highway and was easily accessible by potential customers.
Fresh produce was made available to the public at the time it was harvested for a total of 54 days.
All produce items were clean-washed and weighed prior to being made available to consumers. Blem-ished and quasi-perished produce was routinely culled from the sale tables to insure only the fresh-est and highest-quality produce was available for consumption. Surplus produce was placed in a cold-storage facility to lengthen its shelf life. In addition, substantial resources, such as high-qual-ity lighting, clean and colorful product tables, and conveniently located price and produce-description displays, were made available in order to provide consumers with a friendly and pleasant environment conducive for making clear purchasing decisions.
In its first year of operation, Noble Produce Mar-ket was advertised to the public using a variety of sources, including radio, television, and newspaper media sources. In addition, the Noble Foundation offered the public educational events and tours of the Noble Produce Garden and Market project. A similar advertising campaign was employed in the second year in an effort to make the public aware of Noble Produce Market activity. In addition, a special web site was created in 2006 that provided information about Noble Produce Market business hours, produce availability (updated weekly), and driving directions (including a map) to the market. The web site was made available to the public for free. Furthermore, it is important to note that the Noble Foundation offered tours of and educational programs regarding the Noble Produce Market to other interested parties, including farmers, ranch-ers, academic and extension educators, and other production scientists throughout the region. These events were also open to the public. Word-of-mouth was also a large factor for public awareness of the Noble Produce Market. When queried about how our customers learned about Noble Produce Market over 30 percent responded that they learned of its existence from their neighbors and friends. Public awareness regarding ongoing projects at the Noble Foundation is traditionally quite high.
Noble Produce Market was open each day of the week (except Sunday) to the public for a total of 35 hours per week. Store hours varied depending on the day. A variety of data was collected each day, including quantity and price for each type of produce sold, gender of customer for each sale, and day and time of sale. Prices charged by local super-markets were used to determine an initial price floor for produce produced in the project. Supermarket
Journal of Food Distribution Research 38(3)4 November 2007 Biermacher et al. Economic Challenges of Small-Scale Vegetable Production and Retailing 5
prices were collected twice a week beginning two weeks before our market opened until the closing of the market in August.
The project provided the opportunity to deter-mine the actual revenue and costs associated with production and retailing activities for each produce type. As a result, a detailed set of revenue-cost ac-counts were developed and used to describe the financial performance of Noble Produce Garden and Market. Cumulative gross revenue for each type of produce was taken from market data collected at the produce market each day. Cost of production was partitioned into two primary components: variable cash expenses and fixed capital expenses associated with the use of machinery, buildings, and equip-ment. Net return was calculated as the difference in gross receipts and total cost of production for each crop. Breakeven price for each crop type was calculated by dividing marketable yield for each crop into total cost of production for each crop.
Results and Implications
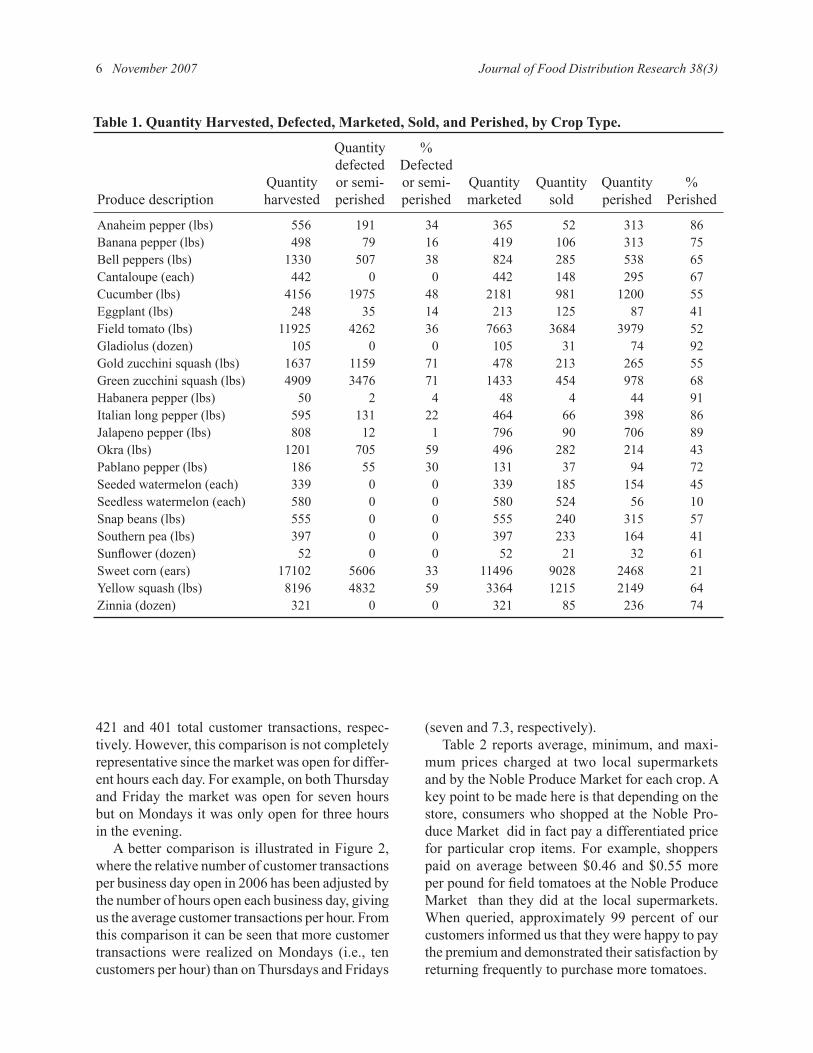
The quantity of each crop harvested, quantity defec-tive, quantity made available for sale, quantity sold, and the quantity made available to the Noble Pro-duce Market that could not be sold for each crop for the 2006 season are reported in Table 1. Some crops experienced substantial disparity between what was harvested and what was made available for sale at the market. For example, of the 11,925 pounds of field tomato that were harvested, 7,663 pounds (64 percent) were made available to consumers.1 By comparison, large-scale market-quality tomato producers operating in the San Joaquin Valley in California would expect to harvest and sell between 60 and 75 percent of their crop (Le Strange et al. 2000). Similarly, a large proportion of each type of squash (especially the zucchini squash), cucumber, bell pepper, and okra could not be marketed due to poor quality or because it was too large for the market. In a large-scale production state such as California, much of the defected produce could be salvaged by frozen-food processors or possibly by a food cannery.
In addition to waste in the field, we also found that of the many crops produced in this project, a large portion of the quantity made available to consumers could not be sold before it perished. In the case of field tomato, for example, the percent-age of marketable produce that went to waste was greater than 50 percent. Also, a large portion of the peppers could not be sold and eventually went to waste. Of all the produce items produced, seedless watermelon suffered the least amount of perish-ability—only a ten-percent loss.
It is also important to note here that the amount actually harvested did not necessarily equal the amount actually grown. Due to unusually high summer temperature during the 2006 growing season, most of the southern pea crop burned in the field, making it pointless to harvest; as a result, an estimated 90 percent of the crop was not harvested. Okra provides another example of production loss due to extreme weather. Due to excessive rainfall, planting of okra was pushed back approximately three weeks, resulting in a three-week delay in production and harvesting. Demand for okra was strongest during the period when we had no supply. As a result of this circumstance we failed to harvest approximately 80 percent of the planted okra. These two crops also illustrate the damaging effects that unpredictable and highly variable growing condi-tions can have on both the production and retailing activities of locally grown fruits and vegetable in this part of the country.
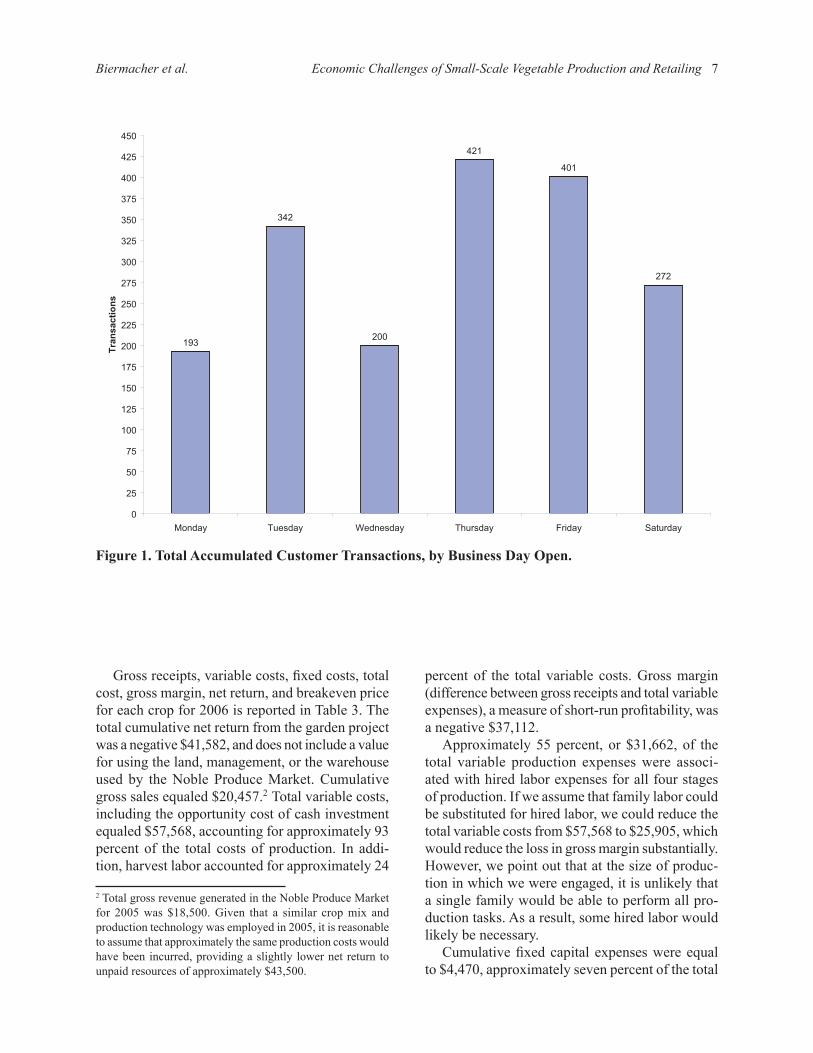
The Noble Produce Market realized a total of 1,988 customer transactions over the 54-day re-tailing period in 2006. The total daily transactions ranged from a low of eight transactions per day to a high of 149 transactions per day, with an average of 41 and an average value per transaction of approxi-mately $10.30. Not surprisingly, the peak of the retailing season in terms of customer transactions came during the week prior to the Fourth of July holiday. When the customer transactions related to the Fourth of July holiday were not considered, the average number of transactions per day was only about 30.
Customer transactions varied substantially across days of the week. Figure 1 indicates the total ac-cumulated customer transactions per business day open in 2006. In absolute terms, the Noble Produce Market realized the highest number of customer transactions on Thursdays and Fridays, incurring
1 Note that these data were not collected for 2005; however, weather conditions for all stages of production and harvesting were substantially less extreme in 2005. As a result, we feel that production losses in the field were much less in 2005 than what was recorded in 2006.
Journal of Food Distribution Research 38(3)6 November 2007 Biermacher et al. Economic Challenges of Small-Scale Vegetable Production and Retailing 7
421 and 401 total customer transactions, respec-tively. However, this comparison is not completely representative since the market was open for differ-ent hours each day. For example, on both Thursday and Friday the market was open for seven hours but on Mondays it was only open for three hours in the evening.
A better comparison is illustrated in Figure 2, where the relative number of customer transactions per business day open in 2006 has been adjusted by the number of hours open each business day, giving us the average customer transactions per hour. From this comparison it can be seen that more customer transactions were realized on Mondays (i.e., ten customers per hour) than on Thursdays and Fridays
(seven and 7.3, respectively).Table 2 reports average, minimum, and maxi-
mum prices charged at two local supermarkets and by the Noble Produce Market for each crop. A key point to be made here is that depending on the store, consumers who shopped at the Noble Pro-duce Market did in fact pay a differentiated price for particular crop items. For example, shoppers paid on average between $0.46 and $0.55 more per pound for field tomatoes at the Noble Produce Market than they did at the local supermarkets. When queried, approximately 99 percent of our customers informed us that they were happy to pay the premium and demonstrated their satisfaction by returning frequently to purchase more tomatoes.
Table 1. Quantity Harvested, Defected, Marketed, Sold, and Perished, by Crop Type.
Produce descriptionQuantityharvested
Quantitydefectedor semi-perished
%Defectedor semi-perished
Quantitymarketed
Quantitysold
Quantityperished
%Perished
Anaheim pepper (lbs) 556 191 34 365 52 313 86Banana pepper (lbs) 498 79 16 419 106 313 75Bell peppers (lbs) 1330 507 38 824 285 538 65Cantaloupe (each) 442 0 0 442 148 295 67Cucumber (lbs) 4156 1975 48 2181 981 1200 55Eggplant (lbs) 248 35 14 213 125 87 41Field tomato (lbs) 11925 4262 36 7663 3684 3979 52Gladiolus (dozen) 105 0 0 105 31 74 92Gold zucchini squash (lbs) 1637 1159 71 478 213 265 55Green zucchini squash (lbs) 4909 3476 71 1433 454 978 68Habanera pepper (lbs) 50 2 4 48 4 44 91Italian long pepper (lbs) 595 131 22 464 66 398 86Jalapeno pepper (lbs) 808 12 1 796 90 706 89Okra (lbs) 1201 705 59 496 282 214 43Pablano pepper (lbs) 186 55 30 131 37 94 72Seeded watermelon (each) 339 0 0 339 185 154 45Seedless watermelon (each) 580 0 0 580 524 56 10Snap beans (lbs) 555 0 0 555 240 315 57Southern pea (lbs) 397 0 0 397 233 164 41Sunflower (dozen) 52 0 0 52 21 32 61Sweet corn (ears) 17102 5606 33 11496 9028 2468 21Yellow squash (lbs) 8196 4832 59 3364 1215 2149 64Zinnia (dozen) 321 0 0 321 85 236 74
Journal of Food Distribution Research 38(3)6 November 2007 Biermacher et al. Economic Challenges of Small-Scale Vegetable Production and Retailing 7
Gross receipts, variable costs, fixed costs, total cost, gross margin, net return, and breakeven price for each crop for 2006 is reported in Table 3. The total cumulative net return from the garden project was a negative $41,582, and does not include a value for using the land, management, or the warehouse used by the Noble Produce Market. Cumulative gross sales equaled $20,457.2 Total variable costs, including the opportunity cost of cash investment equaled $57,568, accounting for approximately 93 percent of the total costs of production. In addi-tion, harvest labor accounted for approximately 24
percent of the total variable costs. Gross margin (difference between gross receipts and total variable expenses), a measure of short-run profitability, was a negative $37,112.
Approximately 55 percent, or $31,662, of the total variable production expenses were associ-ated with hired labor expenses for all four stages of production. If we assume that family labor could be substituted for hired labor, we could reduce the total variable costs from $57,568 to $25,905, which would reduce the loss in gross margin substantially. However, we point out that at the size of produc-tion in which we were engaged, it is unlikely that a single family would be able to perform all pro-duction tasks. As a result, some hired labor would likely be necessary.
Cumulative fixed capital expenses were equal to $4,470, approximately seven percent of the total
272
401
421
200
342
193
0
25
50
75
100
125
150
175
200
225
250
275
300
325
350
375
400
425
450
Monday Tuesday Wednesday Thursday Friday Saturday
Tran
sact
ions
Figure 1. Total Accumulated Customer Transactions, by Business Day Open.
2 Total gross revenue generated in the Noble Produce Market for 2005 was $18,500. Given that a similar crop mix and production technology was employed in 2005, it is reasonable to assume that approximately the same production costs would have been incurred, providing a slightly lower net return to unpaid resources of approximately $43,500.

Journal of Food Distribution Research 38(3)8 November 2007 Biermacher et al. Economic Challenges of Small-Scale Vegetable Production and Retailing 9
cost of production. The fixed costs were calculated assuming all machinery, equipment, and buildings were purchased new in 2006. Understanding that some producers would in fact use a mix of new and used equipment, we followed the approach used by Le Strange et al. (2000) of using only 50 percent of the total fixed cost to account for this possibility. Reducing total fixed costs by half ($2,235) has only a minimal effect on the final economic outcome of the project.
We also recognize that using an overhead lin-ear irrigation system is a questionable production practice, not just from an economic standpoint but also because it may have contributed to weed and pest problems. The cost of fuel associated with this system accounted for approximately 16 percent of the total variable expenses. Horticultural production scientists would likely argue that a drip irrigation
technology could have been used and would have reduced this expense tremendously. If we assume that drip irrigation would be only one-tenth the cost of the overhead linear system, we find that total variable expenses would be reduced by $8,368, a substantial cost savings. However, after accounting for the reduction in fixed costs associated with us-ing a drip system instead of the linear system, and assuming a mix of new and used equipment and machinery, the project still would have incurred a negative net return of approximately $31,000.
Noteworthy is the reality that some costs incurred with operating the produce market (i.e., electricity, website development, and data collection) have been excluded at this time. As a result, the total costs have been understated; however, these costs are not expected to contribute substantially to the lack of profitability of the project. Also noteworthy
9.9
6.7
5.1
7.07.3
7.8
0
1
2
3
4
5
6
7
8
9
10
11
Monday Tuesday Wednesday Thursday Friday Saturday
Tran
sact
ions
Figure 2. Average Daily Customer Transactions, Adjusted by Hours Open per Business Day.

Journal of Food Distribution Research 38(3)8 November 2007 Biermacher et al. Economic Challenges of Small-Scale Vegetable Production and Retailing 9
Tabl
e 2.
Ave
rage
, Min
imum
, and
Max
imum
Pri
ces C
harg
ed a
t Loc
al S
tore
and
the
Nob
le P
rodu
ce M
arke
t, by
Cro
p.
Prod
uce
desc
riptio
nSt
ore
1St
ore
2N
PMD
iffer
ence
Stor
e 1
Diff
eren
ceSt
ore
2Av
g.M
in.
Max
.Av
g.M
in.
Max
.Av
g.M
in.
Max
.
Ana
heim
($/lb
s)2.
571.
532.
641.
941.
191.
992.
681.
003.
000.
120.
74B
anan
a ($
/lbs)
NA
NA
NA
NA
NA
NA
2.81
1.00
3.05
NA
NA
Bel
l ($/
lbs)
1.48
0.78
1.95
1.16
0.56
1.78
1.99
1.00
2.15
0.51
0.83
Can
talo
upe
($/e
ach)
1.53
0.73
1.88
2.04
0.51
3.50
2.50
2.50
2.50
0.97
0.47
Cuc
umbe
r ($/
lbs)
0.78
0.58
1.05
0.82
0.33
1.15
1.02
0.80
2.00
0.24
0.20
Cut
flow
ers (
$/do
zen)
4.88
3.88
9.92
3.25
1.50
4.98
3.36
3.25
4.25
-1.5
30.
11Eg
gpla
nt ($
/lbs)
1.54
1.54
1.54
1.54
1.27
1.99
1.61
1.00
1.75
0.07
0.07
Hab
aner
a pe
pper
($/lb
s)N
AN
AN
AN
AN
AN
A4.
292.
505.
00N
AN
AIta
lian
long
pep
per (
$/lb
s)N
AN
AN
AN
AN
AN
A1.
491.
001.
55N
AN
AJa
lape
no p
eppe
r ($/
lbs)
0.68
0.68
0.68
1.19
1.19
1.19
1.26
1.00
1.30
0.58
0.07
Okr
a ($
/lbs)
NA
NA
NA
4.36
3.72
5.00
3.50
3.00
4.00
NA
-0.8
6Pa
blan
o pe
pper
($/lb
s)1.
471.
471.
475.
995.
995.
991.
621.
001.
700.
15-4
.37
Seed
ed w
ater
mel
on ($
/eac
h)2.
980.
204.
507.
093.
987.
996.
236.
008.
003.
25-0
.86
Seed
less
wat
erm
elon
($/e
ach)
2.89
0.19
4.50
4.12
0.32
6.99
2.73
2.50
4.00
-0.1
5-1
.39
Snap
bea
n ($
/lbs)
1.58
1.58
1.58
1.20
0.69
1.39
1.78
1.75
2.00
0.20
0.58
Sout
hern
pea
($/lb
s)N
AN
AN
AN
AN
AN
A2.
502.
502.
50N
AN
ASw
eet c
orn
($/e
ach)
0.26
0.25
0.33
0.36
0.17
0.59
0.27
0.10
0.30
0.02
-0.0
9Fi
eld
tom
ato
($/lb
s)1.
440.
831.
581.
520.
981.
791.
991.
752.
000.
550.
46Ye
llow
squa
sh ($
/lbs)
1.53
1.53
1.53
1.23
0.99
1.39
1.61
1.00
1.75
0.08
0.38
Zucc
hini
-gol
d ($
/lbs)
1.53
1.53
1.53
1.24
0.99
1.39
1.59
1.00
1.70
0.06
0.35
Zucc
hini
-gre
en ($
/lbs)
1.53
1.53
1.53
1.23
0.99
1.39
1.59
1.00
1.70
0.06
0.37
Aver
age
pric
e fo
r eac
h pr
oduc
e ite
m fo
r Sto
re 1
and
Sto
re 2
is c
alcu
late
d us
ing
pric
e in
form
atio
n co
llect
ed 1
7 tim
es b
etw
een
June
5th a
nd A
ugus
t 5th, 2
006.
Sto
re v
isits
wer
e m
ade
each
M
onda
y an
d Fr
iday
mor
ning
. In
addi
tion,
pric
e di
ffere
nce
betw
een
wha
t was
cha
rged
at t
he N
oble
Pro
duce
Mar
ket a
nd a
t Sto
re 1
or S
tore
2 re
flect
s ave
rage
pre
miu
m o
r dis
coun
t pai
d by
con
sum
ers f
or lo
cally
gro
wn
prod
uce
item
s.
Journal of Food Distribution Research 38(3)10 November 2007 Biermacher et al. Economic Challenges of Small-Scale Vegetable Production and Retailing 11
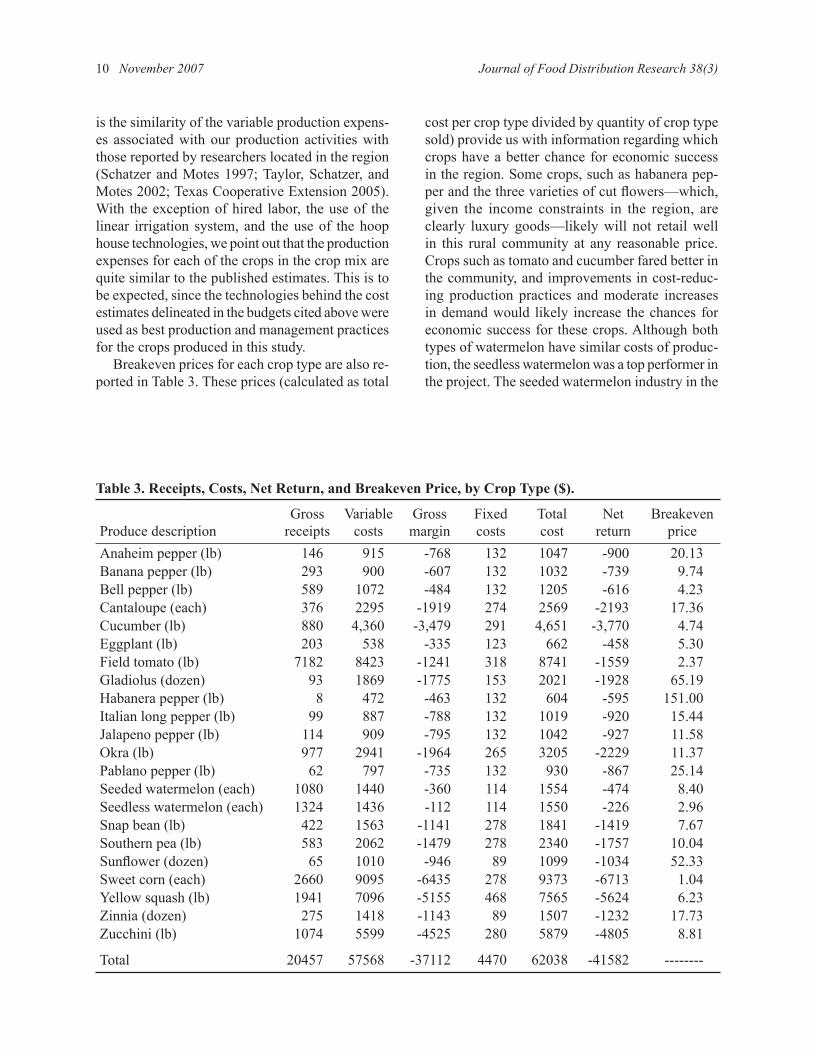
is the similarity of the variable production expens-es associated with our production activities with those reported by researchers located in the region (Schatzer and Motes 1997; Taylor, Schatzer, and Motes 2002; Texas Cooperative Extension 2005). With the exception of hired labor, the use of the linear irrigation system, and the use of the hoop house technologies, we point out that the production expenses for each of the crops in the crop mix are quite similar to the published estimates. This is to be expected, since the technologies behind the cost estimates delineated in the budgets cited above were used as best production and management practices for the crops produced in this study.
Breakeven prices for each crop type are also re-ported in Table 3. These prices (calculated as total
cost per crop type divided by quantity of crop type sold) provide us with information regarding which crops have a better chance for economic success in the region. Some crops, such as habanera pep-per and the three varieties of cut flowers—which, given the income constraints in the region, are clearly luxury goods—likely will not retail well in this rural community at any reasonable price. Crops such as tomato and cucumber fared better in the community, and improvements in cost-reduc-ing production practices and moderate increases in demand would likely increase the chances for economic success for these crops. Although both types of watermelon have similar costs of produc-tion, the seedless watermelon was a top performer in the project. The seeded watermelon industry in the
Table 3. Receipts, Costs, Net Return, and Breakeven Price, by Crop Type ($).
Produce descriptionGross
receiptsVariable
costsGrossmargin
Fixedcosts
Totalcost
Netreturn
Breakevenprice
Anaheim pepper (lb) 146 915 -768 132 1047 -900 20.13Banana pepper (lb) 293 900 -607 132 1032 -739 9.74Bell pepper (lb) 589 1072 -484 132 1205 -616 4.23Cantaloupe (each) 376 2295 -1919 274 2569 -2193 17.36Cucumber (lb) 880 4,360 -3,479 291 4,651 -3,770 4.74Eggplant (lb) 203 538 -335 123 662 -458 5.30Field tomato (lb) 7182 8423 -1241 318 8741 -1559 2.37Gladiolus (dozen) 93 1869 -1775 153 2021 -1928 65.19Habanera pepper (lb) 8 472 -463 132 604 -595 151.00Italian long pepper (lb) 99 887 -788 132 1019 -920 15.44Jalapeno pepper (lb) 114 909 -795 132 1042 -927 11.58Okra (lb) 977 2941 -1964 265 3205 -2229 11.37Pablano pepper (lb) 62 797 -735 132 930 -867 25.14Seeded watermelon (each) 1080 1440 -360 114 1554 -474 8.40Seedless watermelon (each) 1324 1436 -112 114 1550 -226 2.96Snap bean (lb) 422 1563 -1141 278 1841 -1419 7.67Southern pea (lb) 583 2062 -1479 278 2340 -1757 10.04Sunflower (dozen) 65 1010 -946 89 1099 -1034 52.33Sweet corn (each) 2660 9095 -6435 278 9373 -6713 1.04Yellow squash (lb) 1941 7096 -5155 468 7565 -5624 6.23Zinnia (dozen) 275 1418 -1143 89 1507 -1232 17.73Zucchini (lb) 1074 5599 -4525 280 5879 -4805 8.81
Total 20457 57568 -37112 4470 62038 -41582 --------

Journal of Food Distribution Research 38(3)10 November 2007 Biermacher et al. Economic Challenges of Small-Scale Vegetable Production and Retailing 11
region is well developed, and hence economies of farm-size exist, which results in an abundant local supply at low prices.
Noble Produce Market may have been better served to engage in arbitrage with a larger producer for seeded melons. This circumstance may actually provide an opportunity for small growers to pursue the production of seedless melons, which were pre-ferred by customers because they were smaller and (of course) seedless.
Extending the analysis further, we compared the daily average cost of harvesting, cleaning, and retailing our produce with the average daily value of produce sales. This is important, because the production expenses up to the point when a decision must be made regarding whether or not to harvest and open the market doors are sunken and considered irrelevant to the decision. We found that the average daily cost of harvesting, cleaning, and retailing was equal to approximately $405 but the average value of sales each day was approximately $379, a difference of a negative $26 per day. How-ever, this difference easily could have been negated with an additional three customers per day spending about $10 each, or by a reduction in the expenses associated with using hired labor.
Summary and Conclusions
The Noble Produce Garden and Market project was initially developed to provide farm producers with information regarding possible opportunities that might be available to them from small-scale pro-duction and retailing of fresh fruits and vegetables in the rural region of south-central Oklahoma. Actual costs of production, cost of sales, and gross receipts for each crop were determined for a mix of 27 crop enterprises produced on a total of 15.5 acres in south-central Oklahoma. Total net return to the project was a negative $41,582. Although premiums above prices charged by local supermarket prices for several types of produce were paid by consum-ers, the project did not yield a profit. However, an abundance of useful production and marketing information was collected from the project. This information helped us form several conclusions.
First, it was easy to see that in the 2006 grow-ing season excessive rainfall during preplanting and planting stages and extreme heat during the harvest period affected both yields and sales of cer-
tain crops. For example, excessive heat hindered production of southern pea and field tomato, both of which had a high demand. Excessive heat also may have hindered consumption by some consumers (especially the elderly). Excessive rainfall stalled production and harvesting of crops such as okra and corn, which created a disparity between the time of high demand and the time of market availability. In contrast, the severity of this problem did not exist for us in the 2005 growing season of the project, as weather was not as extreme during planting or harvesting phases of the production process.
Second, we found that in both years of the proj-ect the size of the customer base that frequented our market was smaller than desired. In 2006, the average number of paying customers each day was approximately 42 and the average expenditure per person was approximately $9. Customer numbers for the 2005 season were similar. Although our consumers were willing to pay differentiated prices for what they perceived as fresher, locally grown produce, there were simply not enough of them to cover the costs of production that we incurred in the project. This circumstance would likely dif-fer substantially if the costs of production could be reduced by using family farm labor instead of hired labor.
A third point of information shows that available labor in the region for hire is primarily high school students, who are available mostly in the summer. As such, younger student labor may not be as ef-ficient as organized labor to which larger, more-efficient farms in the large-scale producing states have access, nor as efficient as family farm labor. As a result, small-scale farms that depend on hired labor may realize higher labor costs for all stages of production and are subject to producing and harvest-ing crops that can be grown in the summer.
Fourth, more work needs to be done to help pro-ducers determine the best way to use their resources in order to be successful in small-scale fruit and vegetable production in the region. In many cases, small-scale producers in the area do not have ac-cess to a sufficient amount of family farm labor. For these types of operations, more-efficient production methods need to be developed in order to reduce production costs and risks, and efforts need to be made to provide producer access to professional, more efficient labor sources in order to help them reduce their harvest costs.

Journal of Food Distribution Research 38(3)12 November 2007 Biermacher et al. Economic Challenges of Small-Scale Vegetable Production and Retailing 13
Another conclusion we make is that we might have increased our revenues from retailing if we had engaged in alternative retailing activities. For instance, once our summer labor became unavail-able (due to the beginning of the fall school session), we might have benefited from allowing an indepen-dent entity to pay a lease payment or a crop-share payment to us for access to surplus okra left in the field. The use of road-side stands at other locations might have provided additional revenues beyond the cost of selling at the stand.
Finally, better information regarding the benefits of eating locally grown fruits and vegetables needs to be communicated to citizens living in the rural communities. If we are to expand the consumer demand in rural communities for locally grown produce, we will need to do a better job educating our citizens living in these areas about the benefits from healthier, more nutritious diets and the benefits to the community from purchasing locally grown fruits and vegetables.
Our plan for the future is to use production infor-mation gleaned from this project to develop math-ematical programming models that use alternative production technologies and those resources actu-ally available to producers in the region, including alternative assumptions about available labor. We can use information from these models to determine what (if any) produce items they should consider producing, and what quantities of each they should produce. We could also use this type of modeling approach to determine possible marketing strategies. Such strategies may including selling excess supply to urban markets and possibly to local schools that are interested in and have concerns about providing fresher and more flavorful foods to students residing in the community. School administrators have com-mented on their concerns and issues surrounding the feasibility of supplying schools with locally grown produce, including the ability of farm producers to time produce availability with the fall, winter, and spring school calendar; logistical constraints regarding the scale at which meals are prepared and served; and budgetary constraints facing school districts in the region (Carr 2007). Our modeling efforts would also help to address these types of issues and concerns facing school systems and their administrators.
We would like to conclude by noting that even though Noble Garden and Produce Market project
was not a profitable enterprise from an economic standpoint, it was in fact very valuable to our community, including its citizens, farm producers, production and marketing scientists, educators, and policy makers.
References
Agricultural Marketing Service (AMS-USDA). 2002. AMS Farmers’ Market Facts.
American Society of Agricultural and Biological Engineers. 2006. Agricultural Machinery Man-agement Data. ASAE D497.5. St. Joseph, MI.
Carr, R. A. 2007. Superintendent of Ardmore School District, Ardmore, Oklahoma. Personal conversion.
Cloud, J. 2007. “Eating Better than Organic.” Time March 13.
Darby, K, M. T. Batte, S. Ernst, and B. Roe. 2006. “Willingness to Pay for Locally Produced Foods: A Customer Intercept Study of Direct Market and Grocery Store Shoppers.” Selected Paper Prepared for Presentation at the American Agri-cultural Economics Association Annual Meeting, Long Beach, California, July 23–26.
Eastwood, D., J. Brooker, and M. Gray. 1998. “Consumer Attitudes, Perceptions, and Behav-iors about Locally Grown Fresh Produce: A Case Study of Six Locations in Tennessee.” University of Tennessee AES Res. Report 98-09.
Estes, E. A. 2003. “Tomato Wars: A Discussion of How International Trade, Structural Changes, and Competitiveness Affect the North American Produce Industry.” Journal of Agricultural and Applied Economics 35(2):313–319.
Govindasamy, R., and J. Italia. 1998 “A Willing-ness-to-Purchase Comparison of Integrated Pest Management and Conventional Produce.” Agri-business 14(5):403–14.
Lamont, W. J., M. D. Orzolek, E. J. Holcomb, K. Demchak, E. Burkhart, L. White, and B. Dye. 2003. “Production System for Horticultural Crops Grown in the Penn State High Tunnel.” HortTechnology 13(2):358–362.
Le Strange, M., J. G. Valencia, B. L. Weir, R. J. Mullen, K. M. Klonsky, R. L. De Moura, and S. Stoddard. 2000. “Sample Costs to Produce Fresh Market Tomatoes.” University of California Co-operative Extension, Sample Cost of Production Study TM-SJ-00.

Journal of Food Distribution Research 38(3)12 November 2007 Biermacher et al. Economic Challenges of Small-Scale Vegetable Production and Retailing 13
Loureiro, M. L. and S. Hine. 2002. “Discovering Niche Markets: A Comparison of Consumer Willingness to Pay for Local GMO-Free Prod-ucts.” Journal of Agricultural and Applied Econ. 34(3):477–487.
National Agricultural Statistics Service (NASS-USDA). 2002. “Market Value of Agricultural Products Sold Including Direct and Organic: 2002 and 1997.” Agricultural Census 2002. http://www.nass.usda.gov/census/census02/volume1/us/st99_2_002_002.pdf. Accessed October 15, 2006.
National Resource and Conservation Ser-vice (NRCS-USDA). Irrigation Water Management Technical Resources. http://www.wy.nrcs.usda.gov/technical/soilmoisture/soilmoisture.html. Accessed October 20, 2006.
Schatzer, R. J. and J. Motes. 1997. “Horticultural Crop Enterprise Budget Analysis.” Department of Agricultural Economics, Oklahoma State University, Stillwater.
Taylor, M. J., J. Schatzer, and J. Motes. 2002. Cu-curbit Integrated Crop Management. Oklahoma Cooperative Extension Service Publication E-853. P. Bolin and L. Brandenberger, eds.
Texas Cooperative Extension. 2005. “Texas Crop and Livestock Budgets Archive: Fruits and Vegetables, 1998–2006.” Extension Agricul-tural Economics. http://ageconext.tamu.edu/?id=1484.htm. Accessed June 2007.
US Census Bureau. 2007. “Population and House-hold Economic Topics.” http://www.census.gov/population/www/index.html. Accessed October 2007.
US Energy Information Agency. 2007. “U.S. Re-tail Gasoline Prices for all Grades and Formu-lations.” http://tonto.eia.doe.gov/dnav/pet/hist/mg_tt_usM.htm. Accessed October 2007.
Wells, O. S. 2000. “Season Extension Technology.” Proceedings of the 15th International Congress for Plastics in Agriculture and the 29th National Agricultural Plastics Congress (Appendix B):1–7.
Wells, O. S. 1996. “Rowcover and High Tunnel Growing Systems in the United States.” Hort-Technology 6(3):172–176.
Wells, O. S. and J. B. Loy. 1993. “Reowcovers and High Tunnels Enhance Crop Production in the Northeastern United States.” HortTechnology 3(1):92–95.
Wolf, M., A. Spittler, and J. Ahern. 2005. “A Profile of Farmers’ Market Consumers and the Perceived Advantages of Produce Sold at Farmers’ Mar-kets.” Journal of Food Distribution Research 36(1):192–201.
Yen, S. T., B. Lin, J. M. Harris, and N. Ballenger. 2004. “Demand for Differentiated Vegetables.” Selected Paper Prepared for Presentation at the American Agricultural Economics Association Annual Meeting, Denver, Colorado. August 1–4.