economic development and smart growth (pdf)€¦ · smart growth 8 case studies on the ... loss of...
TRANSCRIPT

Economic Development andSmart Growth
8 Case Studies on the Connections
between Smart Growth Development and Jobs, Wealth, and Quality of Life in Communities
1
Economic Development and Smart Growth 8 Case Studies on the Connections Between Smart Growth Development
and Jobs, Wealth, and Quality of Life in Communities
Editors:
Alex Iams Pearl Kaplan
August 2006
International Economic Development Council 734 15th St. NW, Suite 900
Washington, DC 20005 202.223.7800
www.iedconline.org
This report was developed under a cooperative agreement between IEDC and the US Environmental Protection Agency (PI-83224701-0). The opinions in this report do not
necessarily represent the views of the EPA.
2
ACKNOWLEDGEMENTS Editors Alex Iams Associate, Advisory Services & Research International Economic Development Council Washington, DC Pearl Kaplan Senior Associate, Advisory Services & Research International Economic Development Council Washington, DC Case Study Authors Alex Iams Pearl Kaplan Andrea Bauerfeind Jenifer Huestis Kathleen Quillinan Contributing authorsMary Kay Bailey Jessica Schaeffer Project Advisor Ed Gilliland, CEcD, AICP Vice President, Advisory Services & Research International Economic Development Council Washington, DC Cover Photo: Arena District in Columbus, Ohio. Courtesy of Nationwide Realty Investors.
3

TABLE OF CONTENTS 1
Introduction..................................................................................................................................... 5
Transit-Oriented Development ....................................................................................................... 8 The Brewery Blocks, Portland, OR .......................................................................................................... 8 Silver Spring Downtown Redevelopment, Silver Spring, MD............................................................... 14
Commercial Corridor Revitalization............................................................................................. 20 East Carson Street, Pittsburgh, PA ......................................................................................................... 20 Main Street Program, Burlington, IA ..................................................................................................... 24
Targeted Area Redevelopment ..................................................................................................... 29
Arena District, Columbus, OH ............................................................................................................... 29 Belmar, Lakewood, CO.......................................................................................................................... 34
Arts and Entertainment District .................................................................................................... 39 Fountain Square, Indianapolis, IN.......................................................................................................... 39 Artist Relocation Program, Paducah, KY .................................................................................................... 44
4

INTRODUCTION Why Smart Growth? Communities are facing new challenges in attaining economic growth, increasing wealth, and improving quality of life for residents. Economic development organizations (EDOs) strive to grow and improve the communities they serve by attracting and retaining development, residents, and jobs. However, growth and development, if managed improperly, can negatively affect a community’s quality of life, leading to automobile congestion, pollution, pedestrian-hostile neighborhoods, and sprawl. To accommodate an increasing population and demand for housing, services and infrastructure, local governments are seeking to sustain growth and increase their tax base without upsetting the qualities that make their communities pleasant places to live and work. Local governments seeking to create quality places are employing a range of asset-building techniques such as targeted area redevelopment, revitalization of commercial corridors with businesses, shops, and homes, and increasing transportation options. These strategies aim to provide more convenience and choice for residents and employees and emphasize quality of life. Increasingly, EDOs are recognizing that such land development practices are tied to economic success as well. For communities and businesses, attracting and retaining qualified employees is a major concern. To compete, many communities are employing innovative development strategies, often referred to as smart growth, that simultaneously support multiple economic and quality of life goals. Places that thrive in the new economy and attract an educated workforce are distinctive, attractive and rich in amenities.1 Existing infrastructure, proximity to employment, and access to transit are among factors that make communities attractive to developers, businesses and residents. Smart growth is based on mixing land uses, using land and infrastructure efficiently, creating walkable neighborhoods that are attractive and distinctive, providing transportation and housing choices, and
Principles of Smart Growth 1. Mix land uses 2. Use land efficiently 3. Create a range of safe, convenient, and
affordable housing opportunities and choices
4. Create walkable neighborhoods 5. Foster distinctive, attractive communities
with a strong sense of place 6. Preserve natural lands, farmland, and
critical environmental areas 7. Strengthen and direct development toward
existing communities 8. Provide a variety of transportation choices9. Make development decisions predictable,
fair, and cost-effective 10. Encourage community and stakeholder
collaboration in development decisions
encouraging community and stakeholder collaboration in development decisions. IEDC’s report demonstrates the connection between smart growth strategies and economic development. Eight case studies present communities that implemented projects that incorporate smart growth principles and have also experienced economic development success in the form of increased tax revenue, more jobs, higher income levels, downtown revitalization, business growth and other economic indicators. How Smart Growth Relates to Economic Development In their classic text on local economic development, authors Edward Blakely and Ted Bradshaw note that, “industry and business regard livability as an important locational factor.” They assert that local governments need to “identify their quality of life attributes, build on them and effectively promote them to the business community.”2 Failing to invest in these attributes can have negative consequences for a local, state or regional economy. In 2003, for example, the Brookings Institution found that Pennsylvania’s land development practices, which had the effect of decentralizing growth and weakening the state’s
5

established communities, contributed to the state’s loss of young people and its subsequent job and wage stagnation.3 The current economy values proximity and clustering. Placing jobs, homes, shops and recreation in proximity increases business opportunities, helps create a sense of place, and can draw in talented workers. When housing is a part of revitalization, the additional households can spur further business demand for nightlife, services and shopping. Creating places with round the clock activity, as opposed to a nine to five atmosphere, allows businesses to spread out their peaks in services. In suburbs and cities alike, the Urban Land Institute and Pricewaterhouse Cooper’s annual “Emerging Trends in Real Estate” favorably rated 24-hour markets for over a decade, recognizing the increasing attractiveness of these areas to young professionals and empty nesters.4 Clustering of firms also allows for interaction between employees, related businesses and even competitors. Proximity improves a firm’s access to ideas, suppliers and resources. The traditional office park model, with buildings surrounded by parking and landscaping is inward focused and does not easily create opportunities for spontaneous interaction. Many firms are finding that job sites integrated with other uses like restaurants, shops and homes provide employees with choices and amenities rarely found in office parks. The desirability for office space in mixed-use settings with access to transportation choices has been reflected in higher occupancy rates, property values and lease premiums.5 While most firms do not need to be located next to rivers or freight railways anymore, many communities realize that their traffic conditions can have an impact on their ability to attract companies and workers. Smart growth’s emphasis on providing transportation choices so that people can walk, drive, or take public transportation to homes, jobs, and shopping can help a community’s competitiveness as well as leverage significant public sector investments. In Arlington, VA, for example, a policy decision to run a subway line underground and target density around the corridor’s five stations has changed the economic fortune of the county. By using a
transit-oriented development model, over the past thirty years, 75 percent of the county’s roughly 30 million square feet of new development has been concentrated in this subway corridor. Although the corridor only makes up 7.6 percent of the county’s land area, it contributes 33 percent of the county’s real estate tax revenue.6 Economic developers can also improve a city or region’s tax base using smart growth practices by targeting development on idle or underutilized infill sites. These properties, rather than being a drain on the city’s economy, can be put back on the tax roles. The national Main Streets program, for instance, uses a combination of building rehabilitation and design along with promotional activities and volunteer committees to bring economic revitalization to less productive commercial corridors. According to a 2004 analysis, since the program’s inception in 1980, 67,000 new businesses have been established, 308,370 new jobs have been created and over $23.3 billion have been invested in the 1,800 or so Main Streets communities.7 In addition to the economic gains, each strategy presented in the IEDC case studies also encourages positive environmental outcomes. For instance, when economic development practices encourage the re-use of previously developed land, more pristine lands can be conserved, contaminated sites are restored, and regional impervious surface cover and its attendant water runoff can be reduced. Similarly, practices like transit-oriented development can help improve air quality by giving people the option to walk, bike, or take transit to destinations - reducing the amount of emissions from automobile trips.8 About the IEDC Case Studies As the IEDC cases illustrate, economic development activities pursued in tandem with smart growth strategies can create synergy that helps communities meet multiple goals. This report highlights the connections between smart growth and economic development though the application of four smart growth strategies in the following eight communities:
6
Transit-oriented development (Brewery Blocks, Portland, OR and Silver Spring Station, Silver Spring, MD) Revitalization of commercial corridors (East
Carson Street, Pittsburgh, PA and Main Street program, Burlington, IA) Targeted area redevelopment and infill (Arena
District, Columbus, OH and Belmar, Lakewood, CO) Creation of arts and entertainment districts
(Fountain Square, Indianapolis, IN and Lower Town, Paducah, KY)
In creating this report, IEDC set out to produce case-based research to serve as examples and a source of direction for local government officials, economic development professionals, and all readers concerned with the future of their communities. These case studies range from the use of transit-oriented development in Portland Oregon, where light rail has sparked $3 billion in new development, to commercial corridor revitalization in Pittsburgh, Pennsylvania where it has nearly doubled the per capita income in the south side of the city. IEDC drew on existing research and focused its efforts on the gaps in that research. The team relied on locally-supplied data and where possible measured job creation, property reuse and rehabilitation, changes in tax base, vacancy rates, income, business growth and the ratio of public to private investment. Given the limited amount and varying state of the data, these case studies are meant to be illustrative and demonstrate the direction and magnitude of change associated with the projects, rather than the projects’ exact impact. As results from long-term projects develop, the connections between smart growth and economic development have become more pronounced. Economic development organizations and local governments are realizing that by harmonizing these approaches they can create and retain jobs, enhance the tax base, and improve quality of life in the communities they serve.
7
TRANSIT-ORIENTED DEVELOPMENT The Brewery Blocks Portland, Oregon
Introduction d development in Portland, Oregon
eveloped on a former brewery site, Brewery
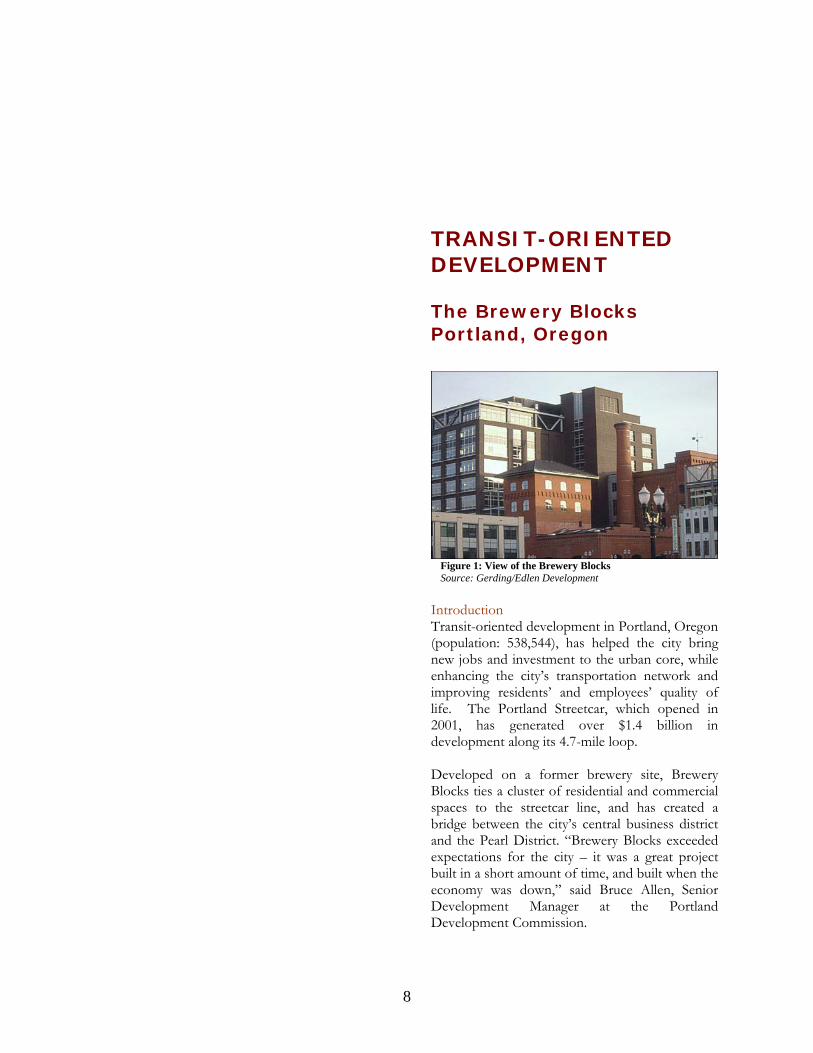
Figure 1: View of the Brewery Blocks Source: Gerding/Edlen Development
Transit-oriente(population: 538,544), has helped the city bring new jobs and investment to the urban core, while enhancing the city’s transportation network and improving residents’ and employees’ quality of life. The Portland Streetcar, which opened in 2001, has generated over $1.4 billion in development along its 4.7-mile loop. DBlocks ties a cluster of residential and commercial spaces to the streetcar line, and has created a bridge between the city’s central business district and the Pearl District. “Brewery Blocks exceeded expectations for the city – it was a great project built in a short amount of time, and built when the economy was down,” said Bruce Allen, Senior Development Manager at the Portland Development Commission.
8
City Context
cks covers five blocks on the
the 1980s and 90s, the area shed its industrial
rewery Blocks added to the district’s momentum,
u
a T
Brewery Blosouthern edge of Portland’s Pearl District, a former warehouse and light industrial area north of downtown. “Having five contiguous blocks of ownership is a unique real estate opportunity,” said Allen. “It’s the largest project we’ve seen in sometime.” Inheritage, welcoming art galleries, boutiques, trendy nightspots, and fashionable restaurants, and turning warehouses into loft apartments. Bbringing 1.7 million square feet of mixed-use development, including renovated office space, new Class A office space, high-end retail destinations, and luxury apartments and condominiums. The district received another boost in 2001 when the city installed the Portland Streetcar line, including stops accessible to Brewery Blocks.
As
ECONOMIC INDICATORS: 3-sq mile radius from Brewery Blocks
2000 2002 2007 (est.) Population 132,203 133,287 136,497Number of households
66,359 67,374 69,822
Median household income
$45,771 $50,395
Per capita income
$29,455 $34,482
Source: US Census Bureau
Project Development The project is located on the former site of the Blitz-Weinhard Brewery, which opened in 1856. The brewery operated until 1999, when its owners sold the Henry Weinhard brand to Miller Brewing Company. Miller transferred production offsite, and Portland-based Gerding/Edlen Development purchased the land in January 2000. GBD Architects designed the blocks to balance contemporary structures and amenities with an industrial past, reusing historic buildings and maintaining a pedestrian-scale streetscape.
ecowasigPoanBrculaccwoan FThredThmi1,3miThsouinvincrevthe
9
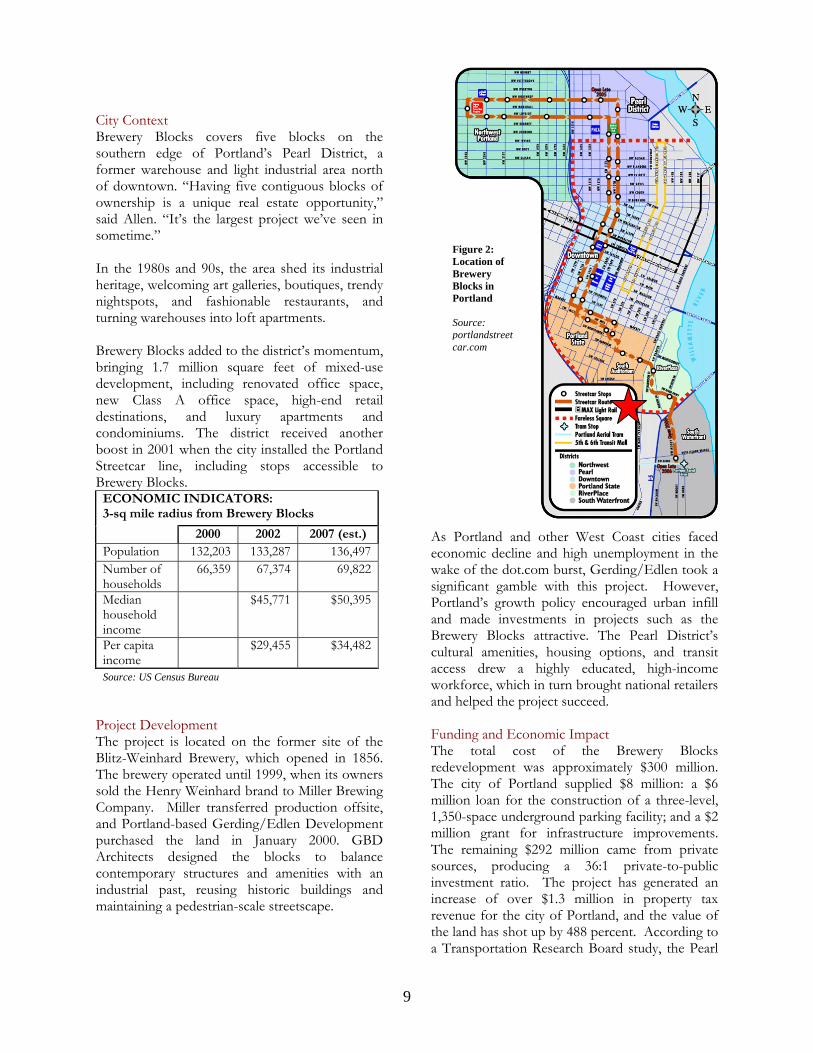
Figure 2:
f Location oBrewery Blocks in Portland
ource: Sportlandstreetcar.com
other West Coast cities faced
nding and Economic Impact Brewery Blocks
ransportation Research Board study, the Pearl
Portland andnomic decline and high unemployment in the
ke of the dot.com burst, Gerding/Edlen took a nificant gamble with this project. However, rtland’s growth policy encouraged urban infill d made investments in projects such as the ewery Blocks attractive. The Pearl District’s tural amenities, housing options, and transit ess drew a highly educated, high-income rkforce, which in turn brought national retailers
d helped the project succeed.
e total cost of the evelopment was approximately $300 million. e city of Portland supplied $8 million: a $6 llion loan for the construction of a three-level, 50-space underground parking facility; and a $2 llion grant for infrastructure improvements. e remaining $292 million came from private rces, producing a 36:1 private-to-public estment ratio. The project has generated an rease of over $1.3 million in property tax enue for the city of Portland, and the value of land has shot up by 488 percent. According to

District is the strongest urban retail market in Portland, in terms of high demand and low vacancy rates.9 Retailers look to position themselves in this area because of its expanding residential base, its relatively affluent population, its access to the Portland Streetcar, and its variety of historic structures coupled with new development. PROJECT FUNDING: SOURCES AND USES
SourcesCity loan $6 milCity grant $2 milCommerical bank land or construction loans $72 milUnion pension fund (direct investment) $52 milConstruction loans by Union pension funds $36 milPermanent loans (institutional lenders) $53 milPrivate equity/funding $79 milTOTAL $300 mil
UsesParking facility $6 milImprovements $2 milLand purchase $19.5 milNew construction $200 milRehab: brewhouse and cellar buildings $55 milRehab: Armory building $20 milTOTAL $300 mil
Investment Distribution Private $292 mil Public $8 mil RATIO 36 to 1
Source for tables: Gerding/Edlen Development
rtland Streetcar Source: Wikipedia.org
cludes a us network, three light rail lines, and the Portland
. The Portland Streetcar route bisects the Brewery Blocks along 10th and 11th Streets, helping
treetcar started running in 2001, Brewery Blocks as under construction and weekday ridership was
spring 2005, weekday ridership rose to 7,837.
uare feet of commercial space: 300,000 quare feet of retail and 500,000 square feet of
e “blocks”. The
Figure 3: Po
ransit TPortland’s public transportation system inbStreetcar
it become a transit-accessible, pedestrian-oriented retail and employment center. Introduced in 2001, the city-owned and operated streetcar circulates around a 4.7-mile loop, linking the city’s northwest neighborhoods with the south waterfront, via the Pearl District and downtown.
The streetcar has had a symbiotic relationship with the Brewery Blocks development. When the
ECONOMIC INDICATORS: New and Rehabilitated Space (sq ft) New Construction % New residential space 440,000 37.26 New office space 499,000 New retail space 242,000 Total new commercial space 741,000 62.74 Total new construction 1.18 mil 100 Rehabilitated Space % Rehabilitated office space 29,000 30.13 Rehabilitated retail space 67,260 69.87 Total rehabilitated space 96,260 100 SUM TOTAL 1.27 mil Breakdown of Uses % Office space 528,000 41.33 Retail space 309,260 24.21 Residential space 440,000 34.44 Total 1.27 mil 100
sw 4,982. Weekday ridership grew to 5,729 in 2003, and 6,899 in 2004, as sections of the Brewery Blocks opened. As the project neared completion inThe Streetcar has been credited with leveraging $1.4 billion in investment around the transit loop. Approximately 5,200 housing units and 3.6 million square feet of commercial development have been built in the Pearl District since the arrival of the Streetcar. Commercial Development The Brewery Blocks contains approximately 800,000 sqsoffice space, divided into fiv
10
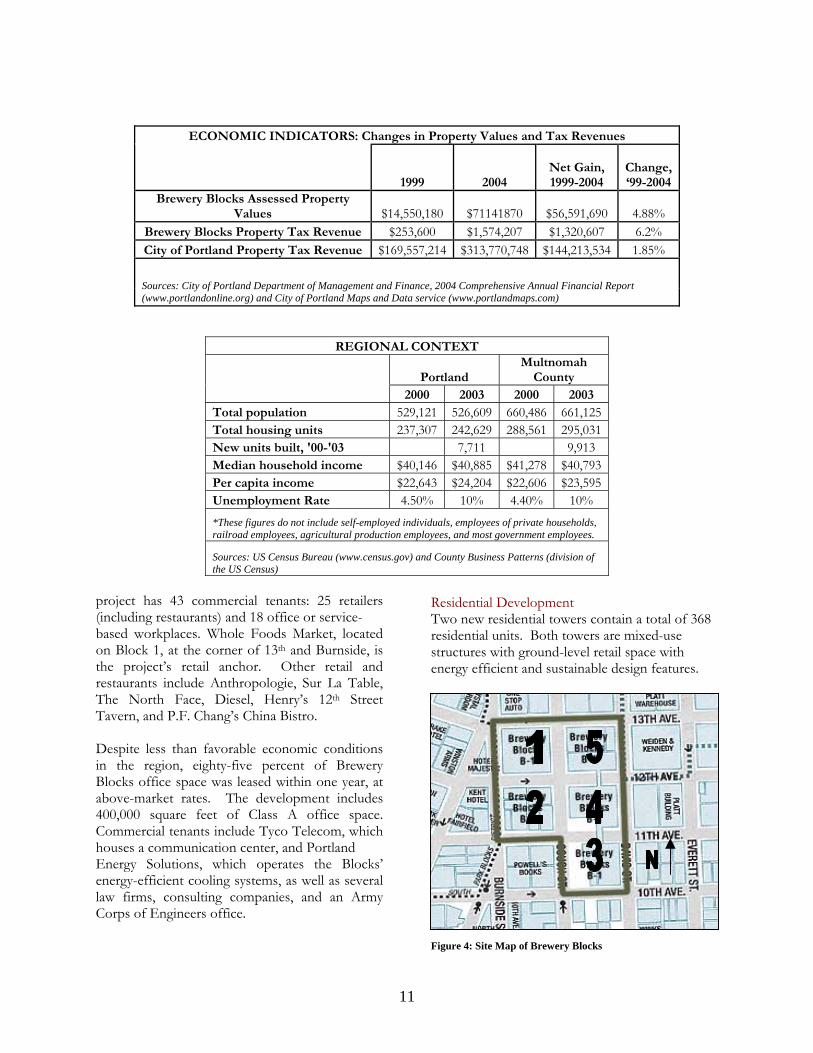
ECONOMIC INDICATORS: Chang
es in Property Values and Tax evenues R
1999 2004 Net Gain, 1999-2004
C‘99-2004
hange,
Brewery Blocks Assessed Property Values $14,550,180 $71141870 $56,591,690 4.88%
B e $253,600 $1,574,207 $1,320,607 6.2% rewery Blocks Property Tax Revenu
City of Portland Property Tax Revenue $$169,557,214 313,770,748 $144,213,534 1.85%
Sources: City of Portland Department of Management 4 n por(www.portlandonline.org) and City of Portland Maps and Data service (www.portlandmaps.com)
and Finance, 200 Comprehensive A nual Financial Re t
REGIONAL ONTEXT C
Multnomah
Portland County 2000 2003 2000 2003 Total population 529 09 660,4 125 ,121 526,6 86 661,Total housing units 237,307 242,629 288,561 295,031 New units built, '00-'03 7,711 9,913 Median household income $40,146 $40,885 $41,278 $40,793 Per capita income $22,643 $24,204 $22,606 $23,595 Unemployment Rate 4.50% 10% 4.40% 10% *These figures do not include self-employe ls
ral production es, a t gov mpld individua , employees of private households,
railroad employees, agricultu employe nd mos ernment e oyees.
Sources: US Census Bureau (www.census.gov) and County Business Patterns (division of the US Census)
project has 43 com
is
conditions the region, eighty-five percent of Brewery
ral
rs are mixed-use tructures with ground-level retail space with nergy efficient and sustainable design features.
mercial tenants: 25 retailers Residential Development
(including restaurants) and 18 office or service- based workplaces. Whole Foods Market, located on Block 1, at the corner of 13th and Burnside,the project’s retail anchor. Other retail and restaurants include Anthropologie, Sur La Table, The North Face, Diesel, Henry’s 12th Street Tavern, and P.F. Chang’s China Bistro. Despite less than favorable economic inBlocks office space was leased within one year, at above-market rates. The development includes 400,000 square feet of Class A office space. Commercial tenants include Tyco Telecom, which houses a communication center, and Portland Energy Solutions, which operates the Blocks’ energy-efficient cooling systems, as well as sevelaw firms, consulting companies, and an Army Corps of Engineers office.
Two new residential towers contain a total of 368 residential units. Both towese
Figure 4: Site Map of Brewery Blocks
11
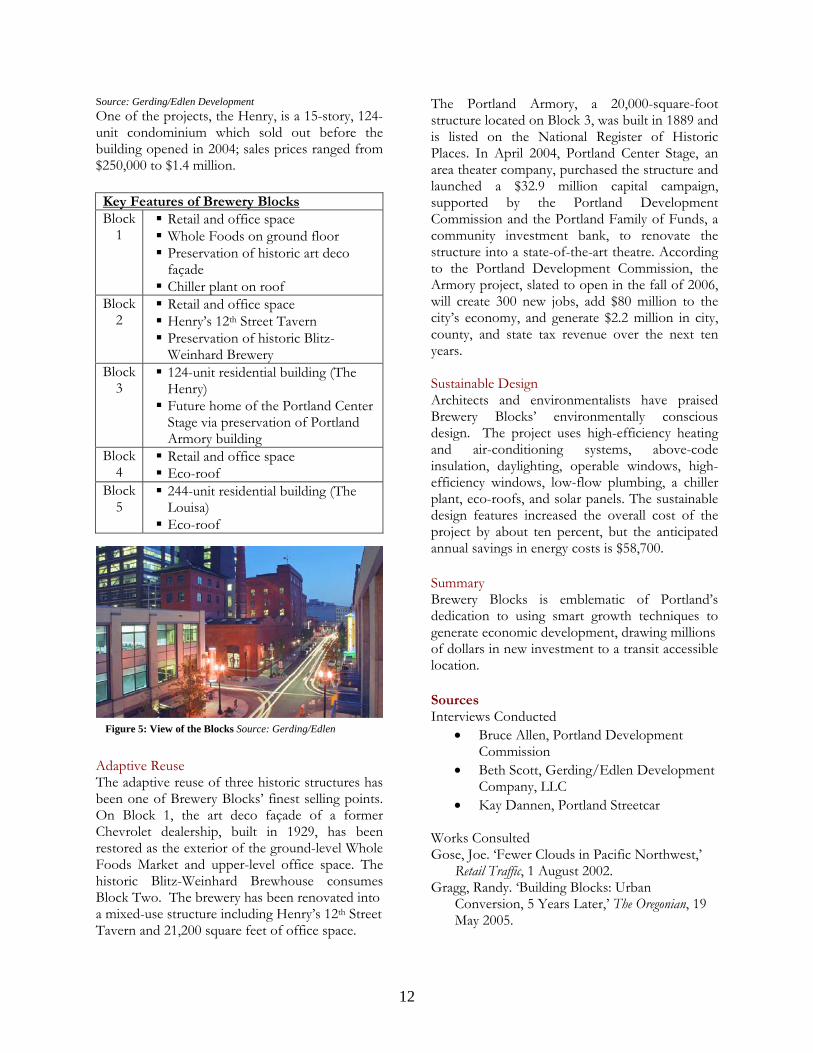
Source: Gerding/Edlen Development One of the projects, the Henry, is a 15-story, 124-
r
n,
on, daylighting, operable windows, high-, low-flow plumbing, a chiller
cks
unit condominium which sold out before thebuilding opened in 2004; sales prices ranged from$250,000 to $1.4 million.
ATbOC
FhBaT
The Portland Armory, a 20,000-square-foot structure located on Block 3, was built in 1889 and is listed on the National Register of Historic Places. In April 2004, Portland Center Stage, an area theater company, purchased the structure and launched a $32.9 million capital campaigsupported by the Portland Development Commission and the Portland Family of Funds, a community investment bank, to renovate the structure into a state-of-the-art theatre. According to the Portland Development Commission, the Armory project, slated to open in the fall of 2006, will create 300 new jobs, add $80 million to the city’s economy, and generate $2.2 million in city, county, and state tax revenue over the next ten years. Sustainable Design Architects and environmentalists have praised Brewery Blocks’ environmentally conscious design. The project uses high-efficiency heating and air-conditioning systems, above-code insulatiefficiency windowsplant, eco-roofs, and solar panels. The sustainable design features increased the overall cost of the project by about ten percent, but the anticipated annual savings in energy costs is $58,700. Summary Brewery Blocks is emblematic of Portland’s dedication to using smart growth techniques to generate economic development, drawing millions of dollars in new investment to a transit accessible location. Sources Interviews Conducted
Key Features of Brewery BloBlock
1 Retail and office space Whole Foods on ground floor Preservation of historic art deco façade Chiller plant on roof
Block 2
Retail and office space Henry’s 12th Street Tavern Preservation of historic Blitz-Weinhard Brewery
Block 3
rtland Center rtland
124-unit residential building (TheHenry) Future home of the PoStage via preservation of PoArmory building
Block 4
Retail and office space Eco-roof
Block 5
244-unit residential building (The Louisa) Eco-roof
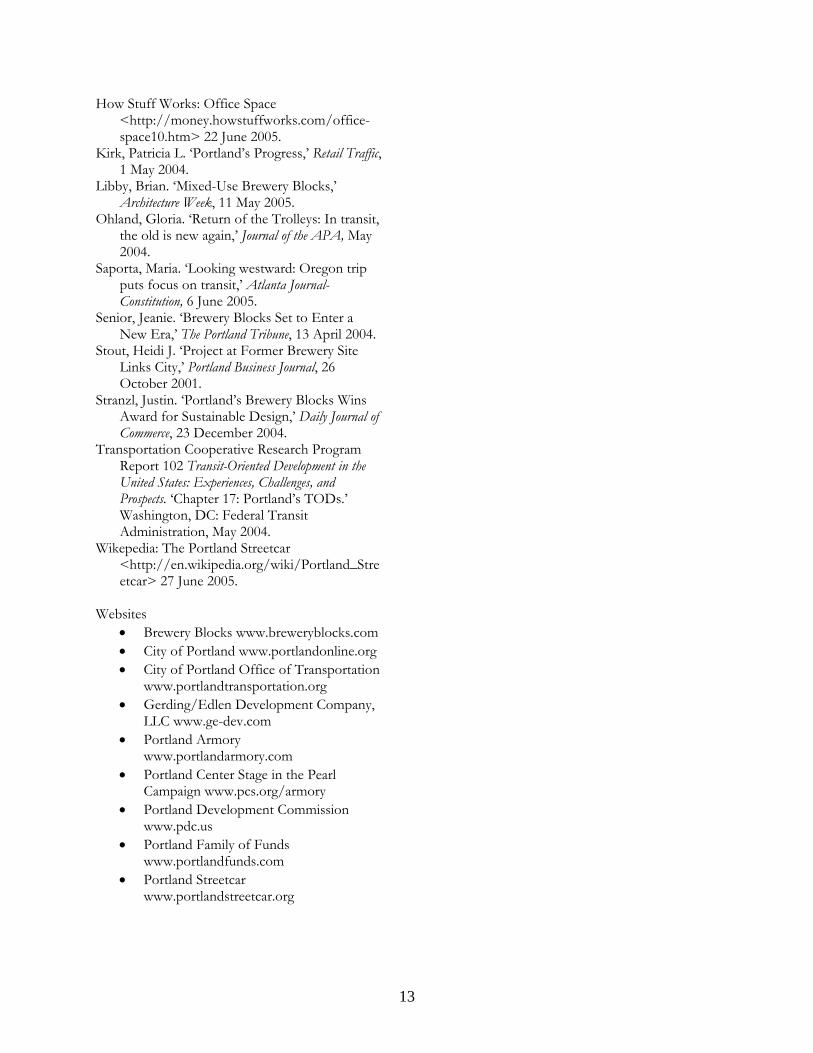
Figure 5: View of the Blocks Source: Gerding/Edlen
been estor oods Market and up vel office space. The
einhard Brewhouse consumes
pany, LLC ay Dannen, Portland Streetcar
Gose, Jo t,’ ta
Gragg, Rn n, 19
daptive Reuse he adaptive reuse of three historic structures has een one of Brewery Blocks’ finest selling points. n Block 1, the art deco façade of a former hevrolet dealership, built in 1929, has
ed as the exterior of the ground-level Wholeper-le
istoric Blitz-Wlock Two. The brewery has been renovated into mixed-use structure including Henry’s 12th Street avern and 21,200 square feet of office space.
• Bruce Allen, Portland Development Commission
• Beth Scott, Gerding/Edlen Development Com
• K Wor Cks onsulted
e. ‘Fewer Clouds in Pacific Northwesil Traffic, 1 AugRe ust 2002. andy. ‘Building Blocks: Urban version, 5 Years Co Later,’ The Oregonia
May 2005.
12
How Stuff Works: Office Space y.howstuffworks.com/office-
Kir ess,’ Retail Traffic,
Libeek, 11 May 2005.
olleys: In transit,
transit,’ Atlanta Journal-
Sen Enter a
Stoity,’ Portland Business Journal, 26
Stra Wins sign,’ Daily Journal of
Tra
er 17: Portland’s TODs.’
Wikre
We
locks.com landonline.org
evelopment Company, LC www.ge-dev.com
ds
<http://monespace10.htm> 22 June 2005.
k, Patricia L. ‘Portland’s Progr1 May 2004.
by, Brian. ‘Mixed-Use Brewery Blocks,’ Architecture W
Ohland, Gloria. ‘Return of the Trthe old is new again,’ Journal of the APA, May 2004.
Saporta, Maria. ‘Looking westward: Oregon trip puts focus onConstitution, 6 June 2005. ior, Jeanie. ‘Brewery Blocks Set toNew Era,’ The Portland Tribune, 13 April 2004.
ut, Heidi J. ‘Project at Former Brewery Site Links COctober 2001. nzl, Justin. ‘Portland’s Brewery BlocksAward for Sustainable DeCommerce, 23 December 2004.
nsportation Cooperative Research Program Report 102 Transit-Oriented Development in theUnited States: Experiences, Challenges, and Prospects. ‘ChaptWashington, DC: Federal Transit Administration, May 2004. epedia: The Portland Streetcar <http://en.wikipedia.org/wiki/Portland_Stetcar> 27 June 2005.
bsites • Brewery Blocks www.breweryb• City of Portland www.port• City of Portland Office of Transportation
www.portlandtransportation.org • Gerding/Edlen D
L• Portland Armory
www.portlandarmory.com • Portland Center Stage in the Pearl
Campaign www.pcs.org/armory Portland Development Commissi• on www.pdc.us Portland Family of Fun• www.portlandfunds.com
• Portland Streetcar www.portlandstreetcar.org
13

TRANSIT-ORIENTED DEVELOPMENT Silver Spring Downtown Redevelopment Silver Spring, Maryland
Figure 1: Map of Smart Growth Strategy Source: Montgomery County
Introduction Silver Spring (pop. 35,575), one of Washington, DC’s oldest suburbs, has used transit-oriented development to bring new life to its once-ailing downtown. Anchored by a station that is part of ‘Metro’— the DC region’s subway system — downtown Silver Spring has become a magnet for economic activity, linking new businesses and jobs
14

with a growing residential market. Residents have walking access to a cluster of shops, offices, parks, and the train station, which connects Silver Spring to Washington, DC and other regional destinations. In 1998, Montgomery County planners and private developers targeted four square blocks for downtown development, coordinating public and private funding for projects around the transit station. The initial project, a $400 million town center funded with public and private capital, stimulated a surge of new development: between 2000 and 2010, public ($423 million) and private investment ($1.37 billion) will reach $1.8 billion. “The development is performing way beyond expectations,” said Mel Tull, Incentives Manager, Silver Spring Regional Center. “The town center plan led to many new projects, which ultimately caught the attention of Discovery.” The arrival of Discovery Communications in 2003 was the driving force behind 1,554 new jobs in downtown Silver Spring between 2000 and 2005. Montgomery County forecasts 1,246 more new jobs in Silver Spring between 2005 and 2010. Throughout the late 1990s and 2000s, the DC region experienced significant growth, the effects of which were also felt in Silver Spring. The arrival of the new town center and its corporate anchors significantly contributed to this growth. Prosperity and Decline Silver Spring originally developed as a stop along the Baltimore & Ohio railroad. By 1950, it was one of the busiest retail markets between Richmond and Baltimore. Downtown decline began when the suburban Wheaton Mall opened in 1960. Silver Spring’s last retail anchor, Hecht’s, moved to Wheaton in the 1980s. Silver Spring tried to attract a new mall to stay competitive, finally landing the 400,000 square-foot City Place Mall in 1992. City Place, however, did not attract quality anchor stores, and ultimately failed to help stem the downtown exodus. Between 1988 and 1996 more than 220 businesses left Silver Spring. The city was a shell of its former self: vacancy rates increased, traffic sped through downtown along six-lane boulevards, and the
retail environment was limited to discount stores, tattoo parlors and pawnshops.
Silver Spring % Change
Economic Indicators
Pre-project Recent Office Space-Rentable Building Area
6,382,464 (1997)
7,185,464 (2005)
13%
Office Vacancy Rate
18.0% (1997)
9.8% (2005)
-8.20%
Industrial Vacancy Rate
6.2% (1997)
2.2% (2005)
-4%
Median Home Price
$194,250 (1997)
$450,000 (2004)
132%
Median Household Income
$48,910 (1996)
$61,940 (2003)
27%
At-place Employment10
20,425 (1997)
22,660 (2003)
11%
Property Tax Revenue
$2,792,580 (2000)
$3,619,828 (2004)
30%
Montgomery County Economic Indicators Pre-project
(1996-2000) Recent (2003-2005)
% Change
Office Space- Rentable Building Area
48,579,839 57,260,712 18%
Office Vacancy Rate 7.30% 9.60% 4.7%
Industrial Vacancy Rate 2.60% 7.30% 4.7%
Median Home Price $197,000 $395,000 100%
Per Capita Income $40,001 $53,546 34%
Median House-hold Income
$66,085 $79,115 20%
At-place Employment 427,080 489,360 15%
Property Tax Revenue $610,403,414 $733,215,259 20%
Source (both tables): MNCPPC, Montgomery Co., CB Richard Ellis
15

Initial Revival: Downtown Silver Spring Town Center In 1998, Montgomery County entered a partnership with Foulger-Pratt Development to build the 22-acre Downtown Silver Spring town center. The town center promised to bring new shops, theaters, a civic building, parking garages, a public square, and townhouses to downtown, with connections to the transit station and the existing pedestrian streets and sidewalks. Following six months of intensive community meetings, Foulger-Pratt attracted businesses that would best serve nearby resident needs – a grocery store, hardware store, and other small retail shops. The second stage concentrated on entertainment with the addition of an anchor bookstore, a theater, larger retailers, a hotel, and a 3,600-space parking garage. The project is located within three blocks of the Silver Spring Metro Station, and its retail facades are oriented toward the street to encourage pedestrian traffic. Construction is in progress on the third stage, a civic center and public plaza, and the fourth stage, 160 units of adjacent housing. Contracts, Incentives, and Investment Montgomery County assembled the 22 acres of land and negotiated a contract with Foulger-Pratt requiring a long-term commitment to the site. After 10 years the city will deed the property to the developer. Because the county assembled the land and retains ownership, the developer saved several years of holding costs typically endured during the design and approval processes. The proposal was designed to return public investment on the town center within 10 years. Investment in the town center totaled $367 million: the county dedicated $187 million to infrastructure improvements, including roads, streetscapes, utilities, and a parking garage; and Foulger-Pratt directed an estimated $180 million to build the retail structures. As part of the town center project, the county rehabilitated and modernized the American Film Institute’s (AFI) historic Silver Theater while preserving its 1938 appearance. The AFI Silver Theatre and Cultural Center is a state-of-the-art exhibition, education and cultural center, and is the country’s preeminent organization dedicated
to advancing and preserving the art of film, television, digital media and other forms of the moving image. The AFI involvement brought attention and investment to the project.
DTdMna7oio
16
Downtown Silver Spring Business Incentives • Access to Metro rail, Metro bus, Ride-
On buses, and taxi stand • CBD Enterprise Zone designation
provides tax credits on expansions, renovation, or improvements
• Green Tape Zone gives downtown projects priority reviews and inspections for permits
• Arts and Entertainment District within CBD provides tax credits for construction
• Live Near Your Work Program offers $3000 to downtown employees purchasing homes in Silver Spring or neighboring Takoma Park
• Montgomery County maintains streetscape, public interest activities, enhances safety of public areas
• County sponsored marketing seminars for local businesses
• Incubator Without Walls Program providing business owners with internet and marketing training
• County Regional Center advises businesses prior to approval to address anticipated difficulties
• Dept. of Housing and Community Affairs offers facade/canopy/streetscape improvement grants
owntown Growth: Effects of the Town Center he Town Center project helped stimulate private evelopment throughout downtown Silver Spring. ontgomery County estimates $1.37 billion in
ew private investment will arrive between 2000 nd 2010 – a private to public investment ratio of :1. Between 2000 and 2004 the CBD generated ver $3.6 million in property tax revenue (a 30%
ncrease), and 1,052,580 square feet of renovations f existing buildings.
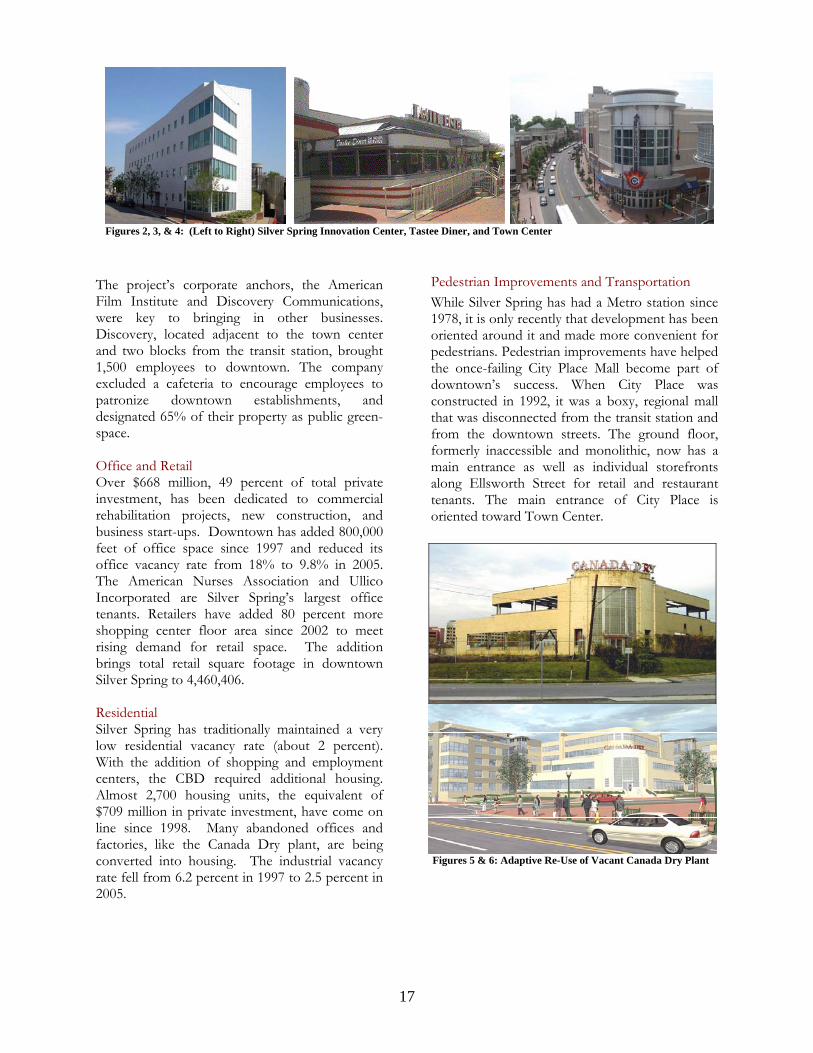
Figures 2, 3, & 4: (Left to Right) Silver Spring Innovation Center, Tastee Diner, and Town Center
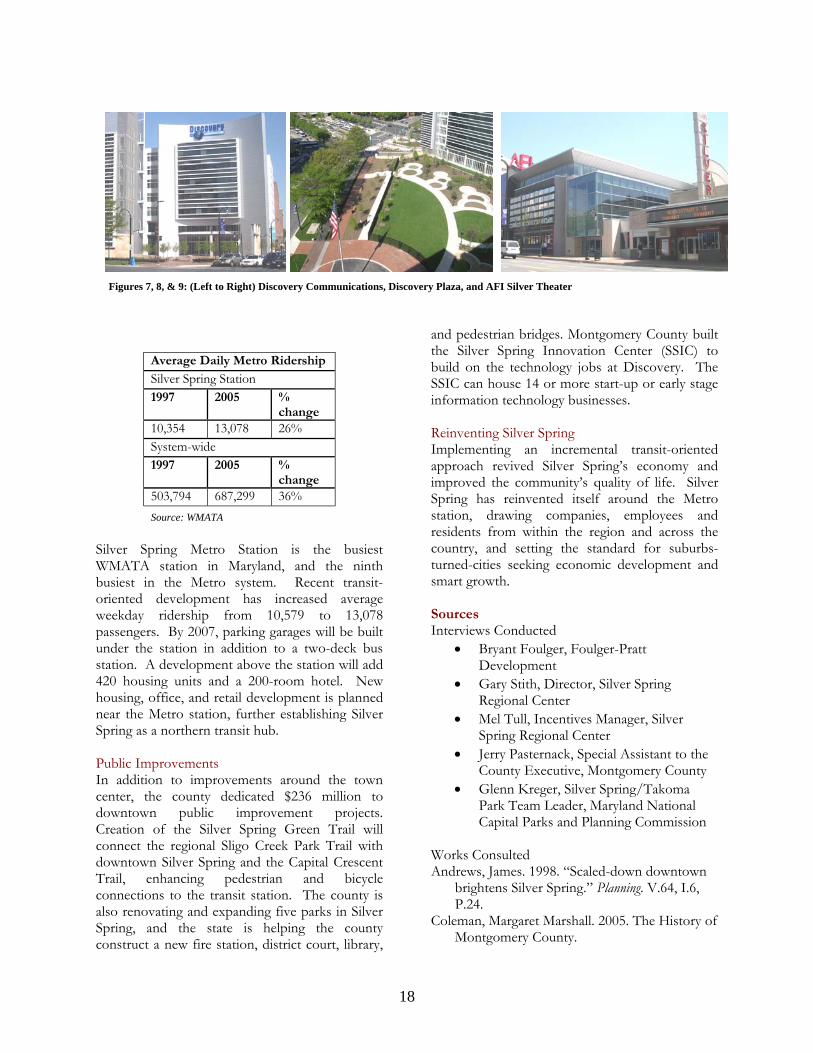
The project’s corporate anchors, the American Film Institute and Discovery Communications, were key to bringing in other businesses. Discovery, located adjacent to the town center and two blocks from the transit station, brought 1,500 employees to downtown. The company excluded a cafeteria to encourage employees to patronize downtown establishments, and designated 65% of their property as public green-space. Office and Retail Over $668 million, 49 percent of total private investment, has been dedicated to commercial rehabilitation projects, new construction, and business start-ups. Downtown has added 800,000 feet of office space since 1997 and reduced its office vacancy rate from 18% to 9.8% in 2005. The American Nurses Association and Ullico Incorporated are Silver Spring’s largest office tenants. Retailers have added 80 percent more shopping center floor area since 2002 to meet rising demand for retail space. The addition brings total retail square footage in downtown Silver Spring to 4,460,406. Residential Silver Spring has traditionally maintained a very low residential vacancy rate (about 2 percent). With the addition of shopping and employment centers, the CBD required additional housing. Almost 2,700 housing units, the equivalent of $709 million in private investment, have come on line since 1998. Many abandoned offices and factories, like the Canada Dry plant, are being converted into housing. The industrial vacancy rate fell from 6.2 percent in 1997 to 2.5 percent in 2005.
Pedestrian Improvements and Transportation While Silver Spring has had a Metro station since 1978, it is only recently that development has been oriented around it and made more convenient for pedestrians. Pedestrian improvements have helped the once-failing City Place Mall become part of downtown’s success. When City Place was constructed in 1992, it was a boxy, regional mall that was disconnected from the transit station and from the downtown streets. The ground floor, formerly inaccessible and monolithic, now has a main entrance as well as individual storefronts along Ellsworth Street for retail and restaurant tenants. The main entrance of City Place is oriented toward Town Center.
Figures 5 & 6: Adaptive Re-Use of Vacant Canada Dry Plant
17
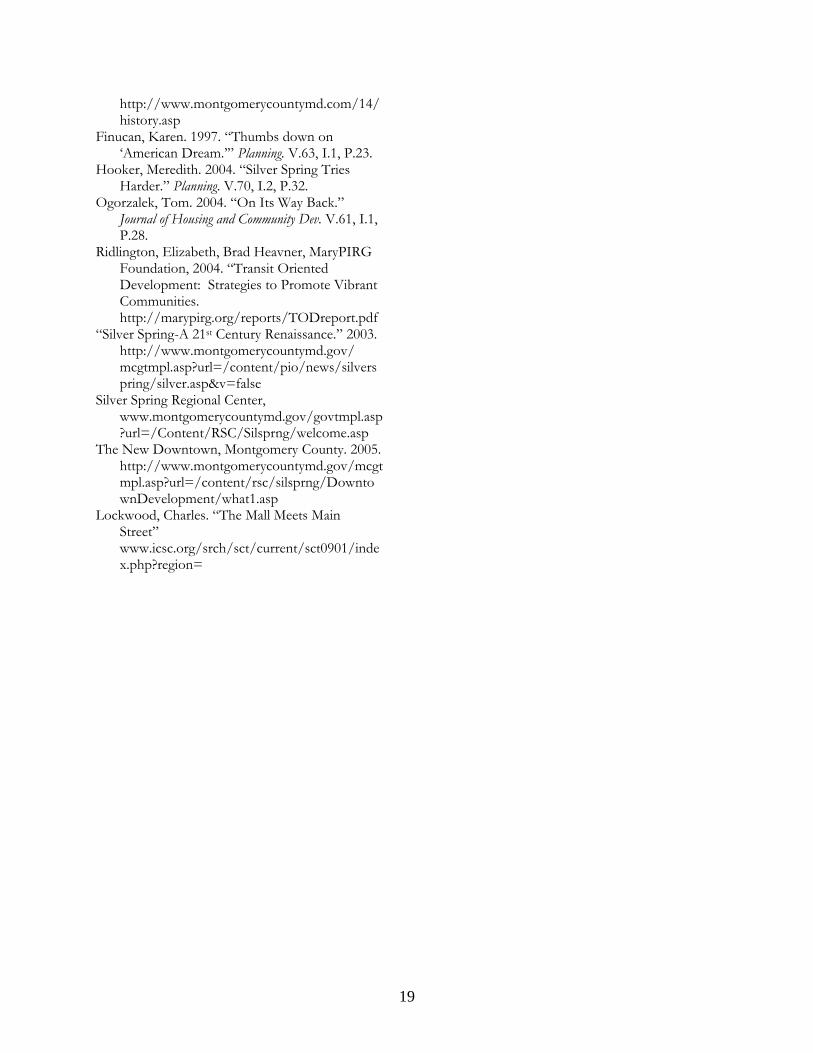
Figures 7, 8, & 9: (Left to Right) Discovery Communications, Discovery Plaza, and AFI Silver Theater
Average Daily Metro Ridership
Silver Spring Station 1997 2005 %
change 10,354 13,078 26% System-wide 1997 2005 %
change 503,794 687,299 36% Source: WMATA
Silver Spring Metro Station is the busiest WMATA station in Maryland, and the ninth busiest in the Metro system. Recent transit-oriented development has increased average weekday ridership from 10,579 to 13,078 passengers. By 2007, parking garages will be built under the station in addition to a two-deck bus station. A development above the station will add 420 housing units and a 200-room hotel. New housing, office, and retail development is planned near the Metro station, further establishing Silver Spring as a northern transit hub. Public Improvements In addition to improvements around the town center, the county dedicated $236 million to downtown public improvement projects. Creation of the Silver Spring Green Trail will connect the regional Sligo Creek Park Trail with downtown Silver Spring and the Capital Crescent Trail, enhancing pedestrian and bicycle connections to the transit station. The county is also renovating and expanding five parks in Silver Spring, and the state is helping the county construct a new fire station, district court, library,
and pedestrian bridges. Montgomery County built the Silver Spring Innovation Center (SSIC) to build on the technology jobs at Discovery. The SSIC can house 14 or more start-up or early stage information technology businesses. Reinventing Silver Spring Implementing an incremental transit-oriented approach revived Silver Spring’s economy and improved the community’s quality of life. Silver Spring has reinvented itself around the Metro station, drawing companies, employees and residents from within the region and across the country, and setting the standard for suburbs-turned-cities seeking economic development and smart growth. Sources Interviews Conducted
• Bryant Foulger, Foulger-Pratt Development
• Gary Stith, Director, Silver Spring Regional Center
• Mel Tull, Incentives Manager, Silver Spring Regional Center
• Jerry Pasternack, Special Assistant to the County Executive, Montgomery County
• Glenn Kreger, Silver Spring/Takoma Park Team Leader, Maryland National Capital Parks and Planning Commission
Works Consulted Andrews, James. 1998. “Scaled-down downtown
brightens Silver Spring.” Planning. V.64, I.6, P.24.
Coleman, Margaret Marshall. 2005. The History of Montgomery County.
18
http://www.montgomerycountymd.com/14/history.asp
Finucan, Karen. 1997. “Thumbs down on ‘American Dream.’” Planning. V.63, I.1, P.23.
Hooker, Meredith. 2004. “Silver Spring Tries Harder.” Planning. V.70, I.2, P.32.
Ogorzalek, Tom. 2004. “On Its Way Back.” Journal of Housing and Community Dev. V.61, I.1, P.28.
Ridlington, Elizabeth, Brad Heavner, MaryPIRG Foundation, 2004. “Transit Oriented Development: Strategies to Promote Vibrant Communities. http://marypirg.org/reports/TODreport.pdf
“Silver Spring-A 21st Century Renaissance.” 2003. http://www.montgomerycountymd.gov/ mcgtmpl.asp?url=/content/pio/news/silverspring/silver.asp&v=false
Silver Spring Regional Center, www.montgomerycountymd.gov/govtmpl.asp?url=/Content/RSC/Silsprng/welcome.asp
The New Downtown, Montgomery County. 2005. http://www.montgomerycountymd.gov/mcgtmpl.asp?url=/content/rsc/silsprng/DowntownDevelopment/what1.asp
Lockwood, Charles. “The Mall Meets Main Street” www.icsc.org/srch/sct/current/sct0901/index.php?region=
19
COMMERCIAL CORRIDOR REVITALIZATION East Carson Street Pittsburgh, Pennsylvania
20
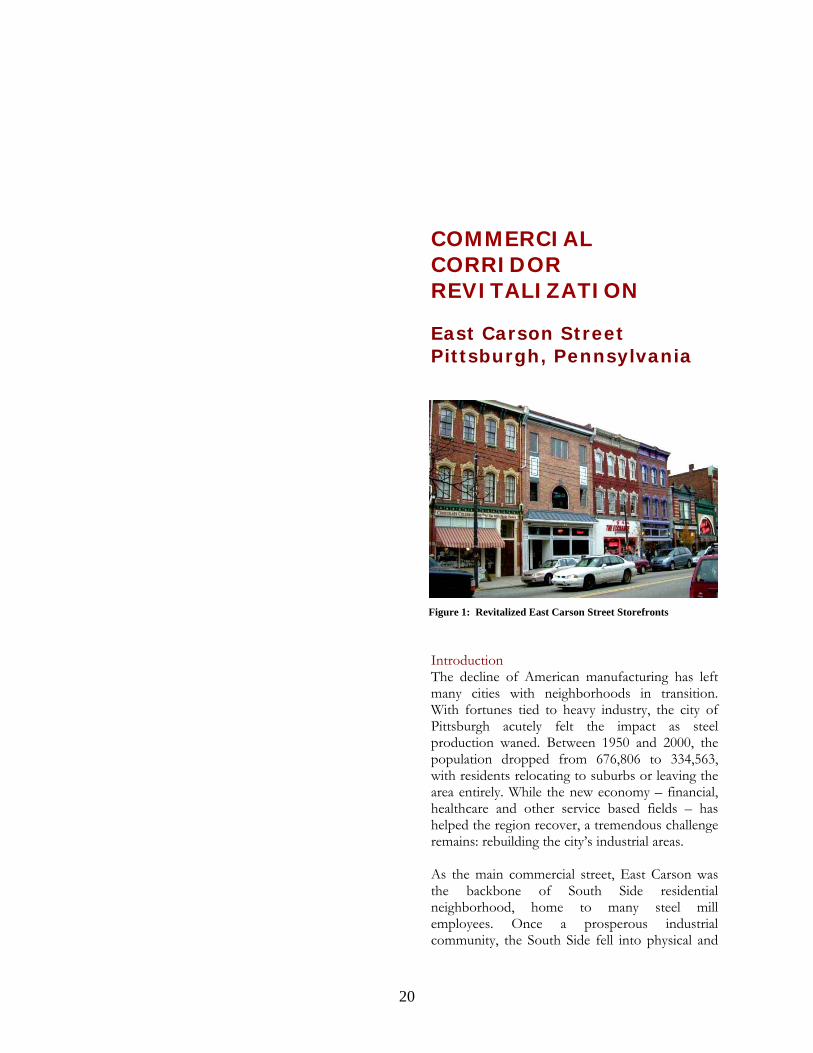
Figure 1: Revitalized East Carson Street Storefronts
Introduction The decline of American manufacturing has left many cities with neighborhoods in transition. With fortunes tied to heavy industry, the city of Pittsburgh acutely felt the impact as steel production waned. Between 1950 and 2000, the population dropped from 676,806 to 334,563, with residents relocating to suburbs or leaving the area entirely. While the new economy – financial, healthcare and other service based fields – has helped the region recover, a tremendous challenge remains: rebuilding the city’s industrial areas. As the main commercial street, East Carson was the backbone of South Side residential neighborhood, home to many steel mill employees. Once a prosperous industrial community, the South Side fell into physical and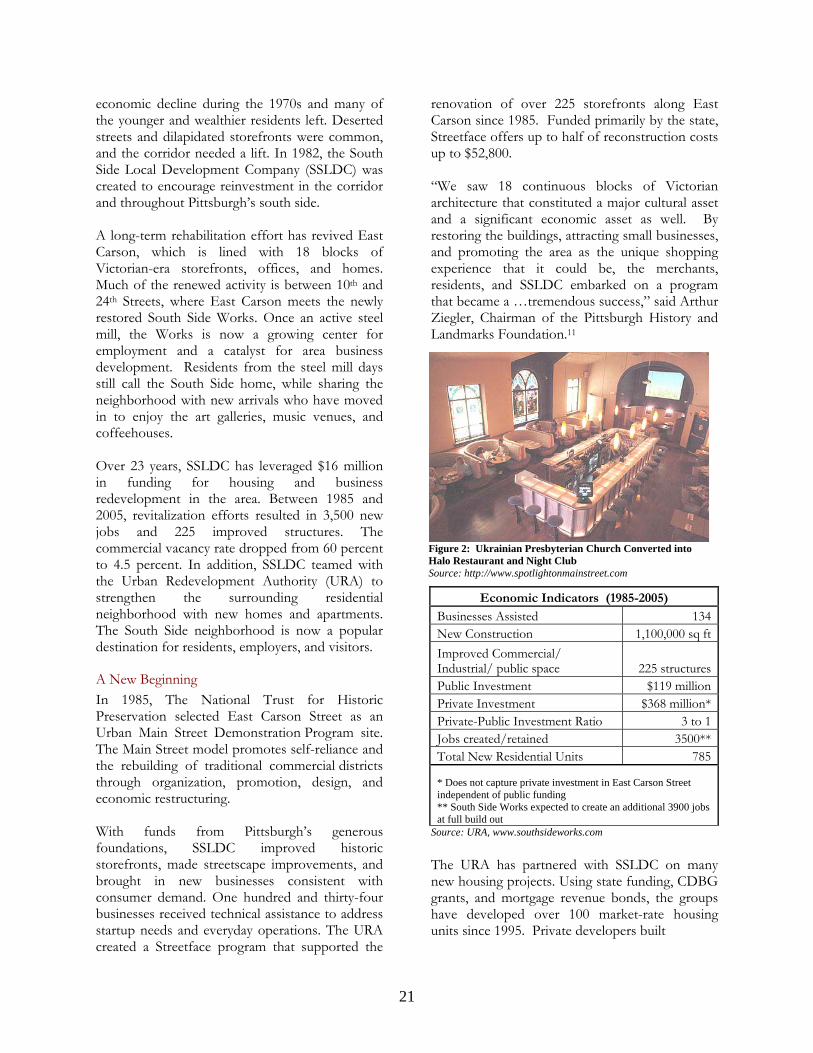
economic decline during the 1970s and many of the younger and wealthier residents left. Deserted streets and dilapidated storefronts were common, and the corridor needed a lift. In 1982, the South Side Local Development Company (SSLDC) was created to encourage reinvestment in the corridor and throughout Pittsburgh’s south side. A long-term rehabilitation effort has revived East Carson, which is lined with 18 blocks of Victorian-era storefronts, offices, and homes. Much of the renewed activity is between 10th and 24th Streets, where East Carson meets the newly restored South Side Works. Once an active steel mill, the Works is now a growing center for employment and a catalyst for area business development. Residents from the steel mill days still call the South Side home, while sharing the neighborhood with new arrivals who have moved in to enjoy the art galleries, music venues, and coffeehouses. Over 23 years, SSLDC has leveraged $16 million in funding for housing and business redevelopment in the area. Between 1985 and 2005, revitalization efforts resulted in 3,500 new jobs and 225 improved structures. The commercial vacancy rate dropped from 60 percent to 4.5 percent. In addition, SSLDC teamed with the Urban Redevelopment Authority (URA) to strengthen the surrounding residential neighborhood with new homes and apartments. The South Side neighborhood is now a popular destination for residents, employers, and visitors.
A New Beginning In 1985, The National Trust for Historic Preservation selected East Carson Street as an Urban Main Street Demonstration Program site. The Main Street model promotes self-reliance and the rebuilding of traditional commercial districts through organization, promotion, design, and economic restructuring. With funds from Pittsburgh’s generous foundations, SSLDC improved historic storefronts, made streetscape improvements, and brought in new businesses consistent with consumer demand. One hundred and thirty-four businesses received technical assistance to address startup needs and everyday operations. The URA created a Streetface program that supported the
renovation of over 225 storefronts along East Carson since 1985. Funded primarily by the state, Streetface offers up to half of reconstruction costs up to $52,800. “We saw 18 continuous blocks of Victorian architecture that constituted a major cultural asset and a significant economic asset as well. By restoring the buildings, attracting small businesses, and promoting the area as the unique shopping experience that it could be, the merchants, residents, and SSLDC embarked on a program that became a …tremendous success,” said Arthur Ziegler, Chairman of the Pittsburgh History and Landmarks Foundation.11
Figure 2: Ukrainian Presbyterian Church Converted into Halo Restaurant and Night Club Source: http://www.spotlightonmainstreet.com
Economic Indicators (1985-2005)
Businesses Assisted 134New Construction 1,100,000 sq ftImproved Commercial/ Industrial/ public space 225 structuresPublic Investment $119 millionPrivate Investment $368 million*Private-Public Investment Ratio 3 to 1Jobs created/retained 3500**Total New Residential Units 785
* Does not capture private investment in East Carson Street independent of public funding ** South Side Works expected to create an additional 3900 jobs at full build out
Source: URA, www.southsideworks.com The URA has partnered with SSLDC on many new housing projects. Using state funding, CDBG grants, and mortgage revenue bonds, the groups have developed over 100 market-rate housing units since 1995. Private developers built
21
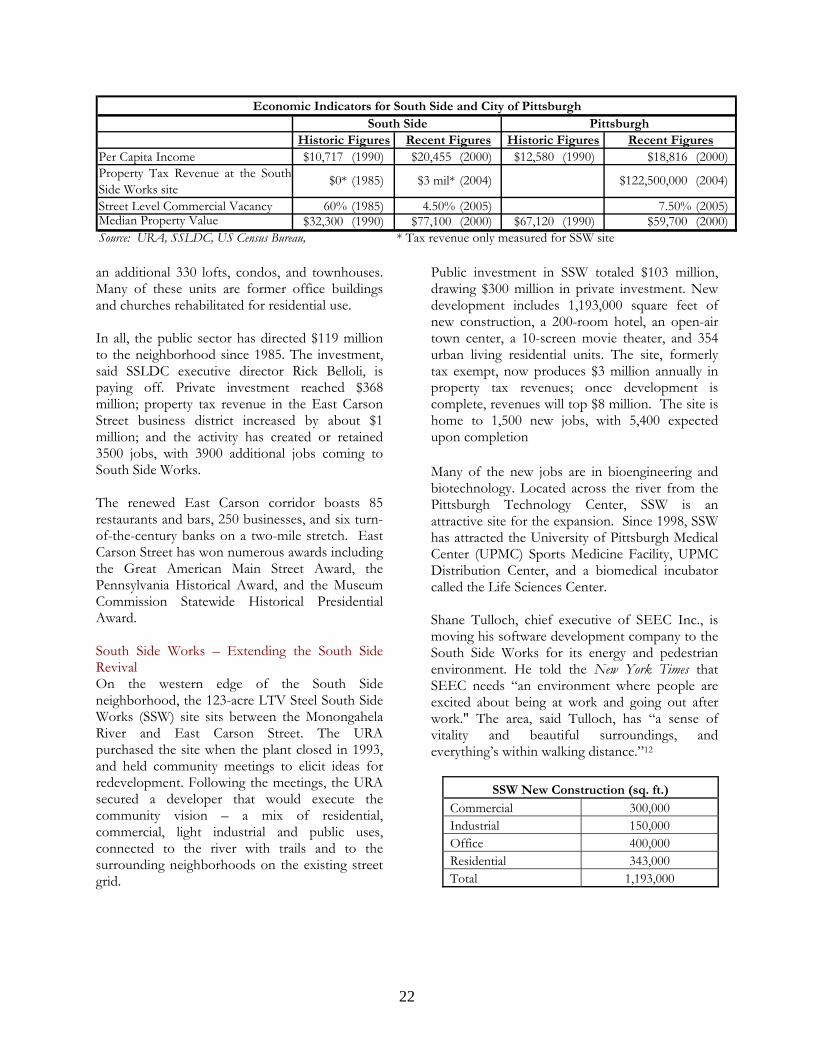
Per Capita Income $10,717 (1990) $20,455 (2000) $12,580 (1990) $18,816 (2000)
Street Level Commercial Vacancy 60% (1985) 4.50% (2005) 7.50% (2005)Median Property Value $32,300 (1990) $77,100 (2000) $67,120 (1990) $59,700 (2000)
PittsburghRecent Figures
(2004)Property Tax Revenue at the SouthSide Works site
$3 mil* $122,500,000
South SideHistoric Figures
Economic Indicators for South Side and City of Pittsburgh
Source: URA, SSLDC, US Census Bureau, * Tax revenue only measured for SSW site
$0*
Historic Figures
(1985)
Recent Figures
(2004)
an additional 330 lofts, condos, and townhouses. Many of these units are former office buildings and churches rehabilitated for residential use. In all, the public sector has directed $119 million to the neighborhood since 1985. The investment, said SSLDC executive director Rick Belloli, is paying off. Private investment reached $368 million; property tax revenue in the East Carson Street business district increased by about $1 million; and the activity has created or retained 3500 jobs, with 3900 additional jobs coming to South Side Works. The renewed East Carson corridor boasts 85 restaurants and bars, 250 businesses, and six turn-of-the-century banks on a two-mile stretch. East Carson Street has won numerous awards including the Great American Main Street Award, the Pennsylvania Historical Award, and the Museum Commission Statewide Historical Presidential Award. South Side Works – Extending the South Side Revival On the western edge of the South Side neighborhood, the 123-acre LTV Steel South Side Works (SSW) site sits between the Monongahela River and East Carson Street. The URA purchased the site when the plant closed in 1993, and held community meetings to elicit ideas for redevelopment. Following the meetings, the URA secured a developer that would execute the community vision – a mix of residential, commercial, light industrial and public uses, connected to the river with trails and to the surrounding neighborhoods on the existing street grid.
Public investment in SSW totaled $103 million, drawing $300 million in private investment. New development includes 1,193,000 square feet of new construction, a 200-room hotel, an open-air town center, a 10-screen movie theater, and 354 urban living residential units. The site, formerly tax exempt, now produces $3 million annually in property tax revenues; once development is complete, revenues will top $8 million. The site is home to 1,500 new jobs, with 5,400 expected upon completion Many of the new jobs are in bioengineering and biotechnology. Located across the river from the Pittsburgh Technology Center, SSW is an attractive site for the expansion. Since 1998, SSW has attracted the University of Pittsburgh Medical Center (UPMC) Sports Medicine Facility, UPMC Distribution Center, and a biomedical incubator called the Life Sciences Center. Shane Tulloch, chief executive of SEEC Inc., is moving his software development company to the South Side Works for its energy and pedestrian environment. He told the New York Times that SEEC needs “an environment where people are excited about being at work and going out after work." The area, said Tulloch, has “a sense of vitality and beautiful surroundings, and everything’s within walking distance.”12
SSW New Construction (sq. ft.)
Commercial 300,000 Industrial 150,000 Office 400,000 Residential 343,000 Total 1,193,000
22
BacThedesioveformexpneigtherbusiwanfrom
D
CoSSWPuCoSSWPri
TO
Sou
Sources Interviews Conducted: • Rick Belloli, Executive Director, South Side
Local Development Company • Beth Marcello, Former President of Board of
Directors, South Side Local Development Company
• Robert Rubinstein, Director Business Development Center, Urban Redevelopment Authority of Pittsburgh
Works Consulted: Fuoco, Michael A. 2002. “How the South Side got
its Groove Back.” Pittsburgh Post Gazette. 7/7. History of South Side-
http://www.southsidepittsburgh.com/about.asp?navid=2
Holland, Dan. 1998. “Historic Preservation of Pittsburgh’s Neighborhood Business Districts.” The National Main Street Center, www.danielholland.com/mainstreet.html
National Trust for Historic Preservation Main Street Program, www.mainstreet.org
O’Toole, Christine H. 2005. “Arts and Science Remake the Steel City” New York Times. 7/20. Pittsburgh Metropolitan Statistical Area Economy,
Incentives • South Side Local Development
Corporation Programs and Services • Neighborhood Assistance Program:
Ten-year $2.5 million state funded initiative designed to fund programs in education, human services, job development, drug and crime prevention, housing, and leadership development
• Technical assistance to business and property owners attempting to maintain historic and architectural integrity
• Streetface Program provides subsidies for business façade improvements
• Sign Grant Program offers a 50 percent matching grant up to $500 for signage
• Regional marketing of East Carson Street businesses
• Neighborhood design standards protect investments
• SSLDC advocates community issues (zoning, regional development, transportation, etc.)
k in Business South Side, capitalizing on its compact urban gn and charming Victorian features, has rcome economic hardship. As Beth Marcello,
er SSLDC Board of Directors President, lained “Carson Street was one of those hborhoods where there was no reason to be e…but now it has a wonderful walkable ness district with almost everything you could t, a high rate of ownership, and a lot of pride the past.”
istribution of Public and Private Investment (1985-2005)
mmercial Corridor $16mil $103mil
blic Total $119 mil mmercial Corridor $68 mil
$300 mil vate Total $368 mil
TAL $487 mil
rce: URA
http://www.artsnet.org/aaco/economics_pdfs/Chapter%20Three%20Pittsburgh%20MSA%20Economy.pdf
South Side Local Development Company, www.southsidepgh.com/SSLDC/index.htm
Schooley, Tim. 2002. “URA’s façade program, ‘Streetface’, helps neighborhoods maintain character.” Biz Journals, June 14.
Streetface Program Summary, Urban Redevelopment Authority of Pittsburgh, www.ura.org/pdfs/mainstreets/Streetface.pdf
Urban Redevelopment Authority of Pittsburgh, About the URA Showcase Projects: South Side Works, ura.org/showcaseProjects_ssWorks3.html
23

COMMERCIAL CORRIDOR REVITALIZATION Main Street Program Burlington, Iowa
Figure 1: Revitalized business district Source: burlingtoniowa.com Introduction Traditional Main Street commercial corridors, where a variety of daily needs are close at hand, are a hallmark of smart growth in small and large towns alike. These corridors were originally designed with a mix of shops, restaurants, offices, and housing, allowing people to walk, take transit, ride their bikes, or drive to reach their destinations. As the movement toward more auto-oriented, regional retail centers grew, many of these commercial corridors suffered. However, towns and cities are seeing the value in having a strong and vibrant Main Street. Revitalization of
24

ECONOMIC INDICATORS: Downtown Burlington, 1986 – 2005* Net gain in business starts, relocations, and expansions 212 Net gain in new jobs 500 Building rehabilitations 396 Buildings sold 145 Total private investments in rehabilitation $28,849,151 Total private investments in downtown property acquisition $8,335,573 Increase in property values (1986-2004) $117,807,005 Percent increase in property values (1986-2004) 23.7% Increase in property tax revenues (1986-2004) $1,930,487 Percent increase in property tax revenues (1986-2004) 33.9% Source: Main Street Iowa
these areas is reaffirming community identity and delivering investment, jobs, and tourism dollars. Over the past 20 years, Burlington, Iowa has reestablished its downtown as the city’s primary activity center. Since the Main Street program began in 1986, the central business district has attracted scores of new businesses and 500 new jobs. The private sector has invested $33 million in downtown projects, including the restoration of 396 historic buildings. Burlington’s progress has drawn national acclaim. In 2004, Burlington earned the National Trust for Historic Preservation’s Great American Main Street Award, an honor given to five communities each year for excellence in preservation-based revitalization.
Source: DPI Burlington in Context Founded in 1833, Burlington (pop: 26,839) was once a prosperous transportation and manufacturing hub. Its location on the Mississippi River and major railroad routes made the city a ‘Gateway to the West,’ rivaling St Louis
during the nineteenth century. Burlington maintained a healthy economy into the twentieth century, but faltered after World War II. Downtown businesses could not compete with suburban shopping centers, and highway construction led to the demolition of nearly one hundred businesses and historic homes. Attempts at urban renewal in the 1960s and 1970s, including a pedestrian mall on Jefferson Street, were ineffective. By the 1980s, many downtown facades were covered by aluminum siding; storefront vacancy rates exceeded 80 percent. Downtown Partners, Inc. The Iowa Department of Economic Development and the National Trust for Historic Preservation designated downtown Burlington as a National Main Street Community in 1986. The Main Street program, adopted in communities across the country, is designed to gradually – over 10 to 20 years, for instance – bring economic development and community activity back to downtown.
Source AmountSelf-supporting municipal improvement district contribution $64,000City of Burlington $15,000Sponsorship, fundraising, private donations $121,000TOTAL $200,000
Downtown Partners, Inc. Annual Budget
Downtown Partners, Inc. (DPI), a non-profit
Figure 2: View of downtown Burlington Photo courtesy of DPI
25

organization, operates the Main Street program in Burlington. It promotes the downtown as a place to do business and hold events; provides design, regulatory and networking services for existing businesses; markets downtown properties; and recruits new businesses.
igure 3: This map outlines the 32-block municipal r, at right.
PI is a small organization, operating with several
conomic Growth ram has facilitated significant
he city and DPI have collaborated on a number
daptive Reuse historic buildings has been a key
1, Hotel Burlington was once among
iverPark Place is a mixed-use development in a
Fimprovement district. It borders the Mississippi RiveMap courtesy of DPI Dstaff, strong volunteer participation, and a $200,000 annual budget. It is funded in part by a 32-block municipal improvement district established by the city. Property owners within the district contribute three dollars per one $1,000 of taxable valuation. In return, DPI advocates for downtown investment, provides training and resources, and organizes events that bring customers to local businesses. EThe Main Street Progchanges during its nearly 20 years in operation. The private sector has invested $33 million in downtown since 1986, including $29 million toward rehabilitation projects. The city’s property tax revenue has increased 33.9 percent, with much of the increase generated from properties previously vacant, abandoned or otherwise off the tax rolls. Two hundred and twelve business starts,
relocations, or expansions and 500 new jobs have come to downtown. Tof physical improvements over the years, creating a more business and people-friendly environment downtown. The pedestrian mall was removed in favor of upgraded street features, including sidewalk renovations, historic light post installation and on-street parking in front of merchant entryways.
Figure 4: Newly renovated Hotel Burlington Photo: DPI ARehabilitation ofdriver for revitalization, accounting for 87 percent of all private investment going into downtown. Historic landmarks have become new businesses, residential spaces, and retail and restaurant locations.
uilt in 191Bthe Midwest’s top hotels. The hotel was closed by the time the Main Street program arrived in the 1980s. Supported by $1.2 million in funds from the city’s tax increment financing program, the ten-story structure has been restored as a residential development, including 75 units of mixed-income housing for older residents. Prior to redevelopment, the city collected $7,480 (1998) in property taxes on the hotel property. After redevelopment, the tax collection jumped to $115,296 (2003). Rformer hospital building overlooking the riverfront. The structure, completed in 2003 with the help of a $1 million Chamber of Commerce
26

ECONOMIC INDICATORS: Burlington Before and After Historic Figures Recent Figures City per capita income* 1980 $10,117 2000 $19,450 Downtown commercial vacancy rate 1986 16.8% 2004 7.0% Downtown taxable property value 1986 $497.12 million 2004 $614.93 millionDowntown property tax revenue 1986 $5.69 million 2004 $7.62 million City retail sales 1988 $157.44 million 2003 $262.30 millionCity unemployment rate* 1986 9.0% 2004 6.5% Source: City of Burlington, US Census *Income and unemployment figures cannot be directly attributed to the Main Street program. These figures are more likely linked to regional trends and macroeconomic conditions grant, houses local businesses, condominiums, and an upscale restaurant. RiverPark generated approximately $60,000 to $65,000 in property tax revenues during its years as a hospital building. With the new project online, the city estimates that it will collect between $80,000 and $90,000 each year. Schramm’s Corner is located in the historic Schramm’s Department Store, the former retail anchor of downtown Burlington; the company closed in 1997. The building is now a $2 million mixed-use development that contains retail establishments, upscale condominiums and apartments, and Burlington’s business incubation center. In 1998, the city collected $4,494 in taxes from the three properties at Jefferson and Second Street. Redeveloped as Schramm’s Corner, the properties account for $16,792 (2003) in annual property taxes.
Figure 5: Snake Alley map Source: www.snakealley.com
Special Events and Attractions A regular series of special events has helped bring people downtown and encouraged support for local businesses. DPI promotes a spring open house in March, customer appreciation days in April, sidewalk sales in July, extended opening hours in the fall, Trick-or-Treating on Halloween, and a holiday open house in November. The Riverfront Farmers Market takes place on the waterfront on Thursday evenings in summer, and draws up to 1,500 customers on its busiest nights. The Annual Living Windows event, in which retailers open up their storefront window space for local non-profits, families, or other businesses to decorate, draws visitors from all over southeast Iowa each December. Permanent attractions, such as the historic Snake Alley, bring in additional
retail and tourism dollars. Snake Alley is a winding stretch of North Sixth Street, marketed as ‘the most crookedest street in the world.’ It is one of Burlington’s most famous landmarks. With the Main Street program as a guiding force, downtown Burlington has steadily turned around. Its historic features, pedestrian-scale and community gathering places have made downtown an attractive location for business. New projects are returning old buildings to productive use, while returning thousands of dollars to the tax rolls. Sources Interviews Conducted:
• Janine Clover, Director, Small Business Development Center
• Val Giannettino, Executive Director, Downtown Partners, Inc.
• Dennis Hinkle, Vice-President of Economic Development, Grow Greater Burlington
27
• Janet McCannon, Former Executive Director of Main Street Burlington
• Jane Seaton, Main Street Iowa • Doug Worden, City of Burlington
Finance Officer • Des Moines County Treasurer’s Office
Works Consulted: Fields, Ron. ‘Downtown Partners Faces Staff
Cuts,’ The Burlington Hawk Eye, 25 March 2005 Fields, Ron. ‘Farmers Market a Big Hit with Area
Producers,’ The Burlington Hawk Eye, 6 March 2005.
Fields, Ron. ‘Main Street Gets Expected Nod,’ The Burlington Hawk Eye, 30 January 2005.
Fields, Ron. ‘Main Street Honors Breuck,’ The Burlington Hawk Eye, 9 May 2005.
Miller, Randy. ‘Housing Funds Coming,’ The Burlington Hawk Eye, 2 March 2005.
Quirk, James Jr. ‘Boat Boosts Project,’ The Burlington Hawk Eye, 15 May 2004.
Quirk, James Jr. ‘Developer Says Complex Will Work Only if it Offers Something Different,’ The Burlington Hawk Eye, 23 October 2003.
Troute, Rex L. ‘Giannettino’s Energy Spurs DPI Success,’ The Burlington Hawk Eye, 20 February 2005. Websites: • Burlington Convention and Tourism Bureau
www.visit.burlington.ia.us • Burlington-West Burlington Area Chamber of
Commerce www.growburlington.com • City of Burlington website
www.burlingtoniowa.org • Downtown Partners, Inc.
www.downtownpartnersinc.com • The Hawk Eye Newspaper
www.thehawkeye.com • Iowa Department of Economic Development
www.iowalifechanging.com • Iowa Small Business Development Centers
www.iowasbdc.org • National Main Street Center
www.mainstreet.org • Snake Alley Website www.snakealley.com • Southeastern Iowa Regional Planning
Commission www.seirpc.com • U.S. Census Bureau www.census.gov
28

TARGETED AREA REDEVELOPMENT Arena District Columbus, OH
Introduction Parcel-by-parcel redevelopment can be a slow process and a tough sell. Assembling contiguous parcels of underutilized, vacant, or blighted property for redevelopment as a district can accelerate and encourage investment in urban areas. Area redevelopment creates a marketable real estate opportunity, as well as an opportunity for smart growth. Existing infrastructure, proximity to employment, and access to transit are factors that make urban land assembly projects attractive to developers, businesses and residents. In Columbus, an area redevelopment initiative produced the Arena District, a 75-acre, $500 million mixed-use district adjacent to downtown.
29

The district’s centerpiece is the 18,000-seat Nationwide Arena, which hosts the NHL’s Columbus Blue Jackets and other big-ticket events throughout the year. Designed on a conventional street grid, the district features wide sidewalks and cozy alleyways to encourage pedestrian traffic between residential, retail, and office spaces.
Figure 2: Nationwide Arena
Figure 1: View of the Arena District
“The Arena District has had a significant impact on the revitalization of downtown Columbus, bringing the first new multi-use projects to the central business district in many years,” said Brian J. Ellis, president of Nationwide Realty Investors (NRI). “Our goal has been to create a new and exciting place for people who want to be downtown. And we've accomplished that. Our entertainment venues draw large crowds, office space has filled up, and the residential component is a success.” Since its creation in 2000, the Arena District has introduced 3,600 jobs and 40 new or relocated businesses to the heart of Columbus. Once-barren real estate is now a center for round-the-clock activity. Project Development For years, surface parking lots and a crumbling state penitentiary dominated the project area. NRI initiated the revitalization process, targeting a 23-acre tract of city-owned land, a six-acre parcel owned by American Electric Power (AEP), and a handful of properties owned by surface parking lot operators. The city agreed to sell its property to NRI for $11.7 million, and AEP sold its site for
$11 million. The Franklin County Convention Facilities Authority used its condemnation powers to acquire the land being used for parking lots.
The authority subsequently leased the land to NRI provided that the company would construct an arena on the grounds. NRI financed construction of the arena with assurances that the National Hockey League would locate a franchise team in Columbus.
NRI retained MSI, a firm specializing in urban planning and design, to create a master plan for the district around the arena. Working with NRI, MSI laid out pedestrian ways and design elements that give the district its charm and identity. Bricked alleyways link the arena with nearby restaurants, offices, and residential uses, and the plan establishes seamless connections between the district and downtown. The Downtown Commission of the Columbus Department of Development approved the plan, which NRI used to guide project implementation. Costs, Funding, and Incentives NRI invested $450 million in construction costs and land acquisition, including $100 million for arena construction. The Dispatch Printing Company, owners of Columbus’ largest newspaper, contributed $10 million and private investors contributed $40 million (through the purchase of box seats and other forms of sponsorship) toward arena construction. The city put $16 million toward road improvements and infrastructure and utility development in the district, and an additional $19 million on roads, infrastructure, and utilities in adjacent areas. In total, the district has a private to public investment ratio of over 14 to one.
30

The city is using tax increment financing (TIF) to support the district’s capital improvements. The city sold over $30 million in bonds, which will be repaid by the property tax increment generated over 30 years. The district is running behind its bond repayment obligations because it is limited in the amount of increment it can capture. Under the TIF, only 27 percent of the increment goes to the district, while the remainder is directed to the city school district. NRI is covering the shortfall through annual payments of $1 million, which will be reimbursed as the district matures. The Arena District benefits from two downtown tax incentive programs. The first, introduced in 2002, allows a 10-year property tax break for new residential projects in the downtown. The second is the Downtown Office Incentive Program, which provides a yearly payment to employers who bring new office jobs downtown. The payment is equal to 50 percent of the income tax withholding from each new job for a period of between one and five years. Economic Impact Three thousand six hundred employees work in the Arena District’s 40 businesses, which include financial consultants, creative companies, law firms and legal services, restaurants, and government offices. Before development of the Arena District in 1998, the project area was generating nearly zero property tax revenue. Seven years later, property tax collection exceeds $4.4 million. Commercial Development The 685,000-square foot Nationwide Arena opened in September 2000. In its first year, 1.2 million visitors attended 203 events at the arena including music performances as well as hockey games. The Arena District also houses the PromoWest Pavilion, an indoor/outdoor concert venue that can hold up to 5,000 fans. NRI
estimates that 2.75 million people visit the district’s restaurants and entertainment venues each year.
Source: Nationwide Realty Investor
Economic Indicators (1998-2005)
Private investment $500 million
Public investment $35 million
Private-public investment ratio 14:1
Jobs created 3,600
New or relocated businesses 40
Increase in property tax revenue $4.4 million
NEW CONSTRUCTION
Office space 1.2 million sq ft
Retail space 300,000 sq ft
TOTAL COMMERCIAL SPACE 1.5 million sq ft
TOTAL RESIDENTIAL SPACE 350 units
NRI has leased approximately 85 percent of the 1.5 million square feet planned for commercial development. Ten office buildings have been completed; each includes Class A office space and ground floor retail. The district boasts a ‘restaurant row’, featuring a variety of restaurants and bars that are busy throughout the year. Other features include an 8-screen movie theatre, a state-of-the-art vision care center, a 10,000-square foot fitness facility, two parking garages (1,000 and 1,400 spaces), and a 1,500-space expansion to an existing parking garage. A three-acre park, McFerson Commons, provides a public gathering space, while bicycle trails connect the Arena District with other green spaces in the Columbus area. The district is within walking distance of other downtown Columbus attractions, including the Columbus Convention Center; the Short North, an arts and entertainment district; the North Market, an historic public market; and North Bank Park, a 12-acre green space along the Scioto River.
Sources Uses Nationwide Realty $450 million Land acquisition (purchase of 23 acres owned by city) $11.7 million
Dispatch Printing Co. $10 million Land acquisition (purchase of 6 acres owned by AEP) $11 million Private Investors $40 million Arena construction $150 million All other construction $327.3 million TOTAL $500 million TOTAL $500 million
Source: Nationwide Realty Investors
31

Residential Development NRI has opened a 252-unit, $35 million apartment project called Arena Crossing. It is a two-building complex with 16,000 square feet of ground-level retail and a three-level, 400-space parking facility. Burnham Square, a 98-unit condominium project opened in December 2005. NRI plans to add 200 more residential units to the district in the future.
Figure 3: Residential Units at Arena Crossing Summary The Arena District turned formerly underutilized, abandoned real estate into Columbus’ most popular sports and entertainment district. Shoppers, office workers, and restaurant-goers provide a daily stream of pedestrian activity, while big crowds pour in for hockey games and rock concerts. The district, now downtown’s northern anchor, is a magnet for community events and economic growth.
DEMOGRAPHIC AND ECONOMIC PROFILE
Northwest Quadrant Trends* 1990 1998 2003
Population 223,531 235,301 242,546
Median Household Income $22,976 $30,139 $34,132
Per Capita Income $13,479 $17,607 $20,305
Planning Area 18: Downtown Area ** 1990 1998 2003
Median Household Income $10,604 $15,636 $18,279
Per Capita Income $9,000 $12,094 $13,984
City of Columbus 1990 1998 2003
Median Household Income $26,651 $34,791 $40,042
Per Capita Income $13,151 $17,397 $21,550 Source: Columbus INFObase, a community information resource maintained by the Neighborhood Planning Section, Columbus Planning Division (www.columbusinfobase.org). * It divides the city into four sections using the major highways I-70 and I-71. The Arena District is located in the northwest quadrant. ** The city is further divided into 30 planning areas; the Arena District is located in planning area 18, the downtown area.
s courtesy of Nationwide Realty vestors
Marketing, NRI Chris Hermann, MSI
.cityofcolumbus.org •
• evelopment
• ent INFObase:
U.S. Census Bureau: www.census.gov
“The Jackets, www.bluejackets.com, 17
‘Naustry Association,
Car t for he Columbus
Sources All photoIn Interviews Conducted • Michelle Chippas, Director of • Websites • Arena District: www.arena-district.com • City of Columbus: www
Downtown Columbus http://downtowncolumbus.com/ Ohio Department of Dwww.odod.state.oh.us Columbus Planning Departmwww.columbusinfobase.org
• Works Consulted
e Arena District Then, Now, and Beyond,’ Columbus BluJune 2005. tionwide Arena District: A New Brick-Paved Urban Village,’ The Brick Indwww.gobrick.com/pavers.
uso, Doug. ‘Arena District Seen as CatalysDowntown Development,’ TDispatch, 3 September 2000.
32
Pramik, Mike. ‘Arena-Area Condos PlanColumbus Dispatch, 19 February 2004. arin, Randall. ‘Mixed-Use Project in Downtown Col
ned,’ The
Sheumbus, Ohio, to Reduce Car
2005. the
2001.
Wri s – real estate market; Columbus, Ohio,’ Primedia Business Magazine, 1 October 2002.
Dependency,’ Heartland Real Estate Business, October 2003.
Stammen, Ken. ‘Nationwide Offered Incentives by State,’ the Columbus Dispatch, 28 June
Weiker, Jim. ‘Nationwide Arena: Year One,’Columbus Dispatch, 10 September
Wolf, Barnet D. ‘150 Downtown Jobs,’ the Columbus Dispatch, 12 July 2003. ght, Steve. ‘Hello, Columbu
33
LAND ASSEMBLY and TARGETED AREA REDEVELOPMENT Belmar Lakewood, Colorado
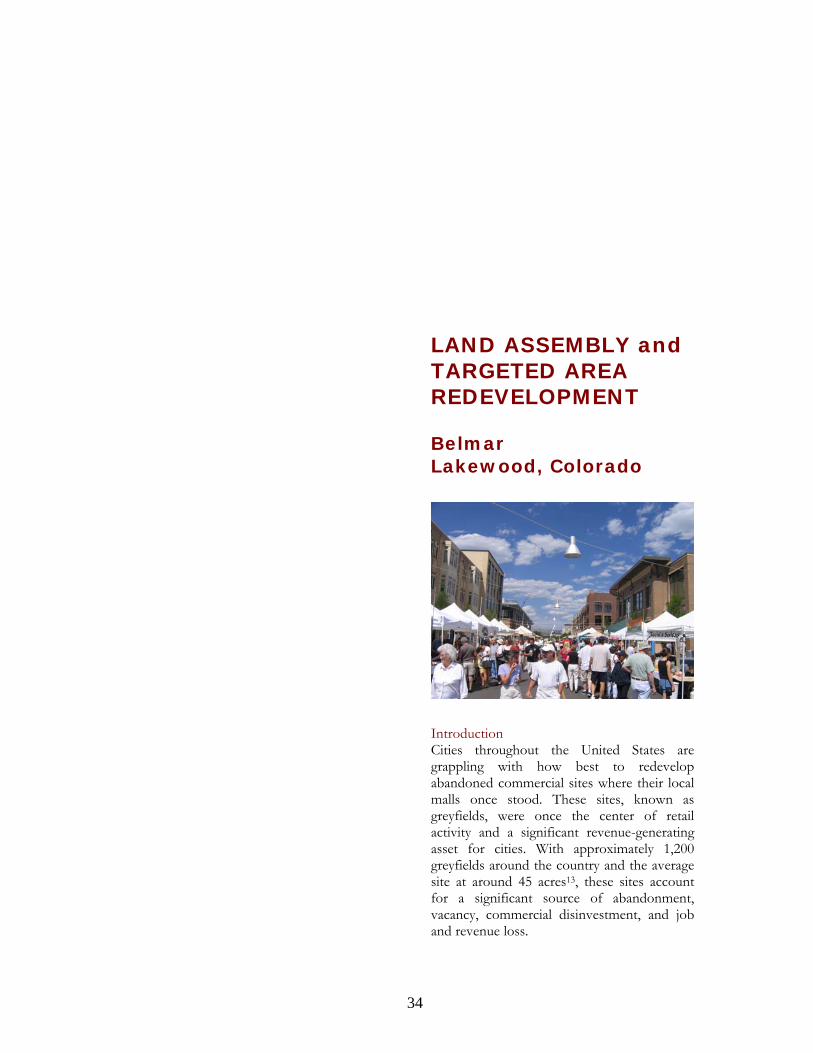
Introduction Cities throughout the United States are grappling with how best to redevelop abandoned commercial sites where their local malls once stood. These sites, known as greyfields, were once the center of retail activity and a significant revenue-generating asset for cities. With approximately 1,200 greyfields around the country and the average site at around 45 acres13, these sites account for a significant source of abandonment, vacancy, commercial disinvestment, and job and revenue loss.
34
In the Denver, Colorado suburb of Lakewood, a greyfield site gave the city the opportunity to create a downtown it never had. In the late 1990s, the Lakewood Reinvestment Authority and developer Continuum Partners, LLC began redeveloping the declining Villa Italia Mall into Belmar, a mixed-use district of 22 city blocks with stores, entertainment, office space, and homes. With the $243 million first phase completed in 2004, Belmar has emerged as a vibrant pedestrian-oriented new city center.
Figure 2: Intersection of Alaska and Teller Streets
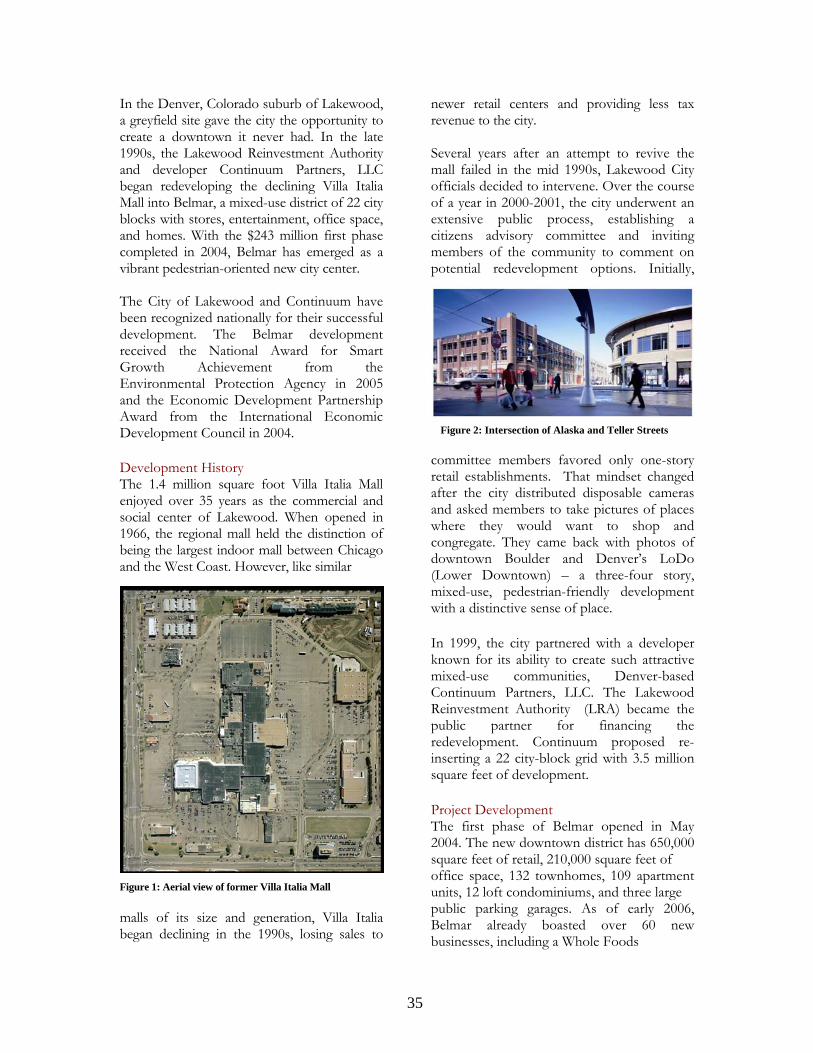
The City of Lakewood and Continuum have been recognized nationally for their successful development. The Belmar development received the National Award for Smart Growth Achievement from the Environmental Protection Agency in 2005 and the Economic Development Partnership Award from the International Economic Development Council in 2004. Development History The 1.4 million square foot Villa Italia Mall enjoyed over 35 years as the commercial and social center of Lakewood. When opened in 1966, the regional mall held the distinction of being the largest indoor mall between Chicago and the West Coast. However, like similar
Figure 1: Aerial view of former Villa Italia Mall malls of its size and generation, Villa Italia began declining in the 1990s, losing sales to
newer retail centers and providing less tax revenue to the city. Several years after an attempt to revive the mall failed in the mid 1990s, Lakewood City officials decided to intervene. Over the course of a year in 2000-2001, the city underwent an extensive public process, establishing a citizens advisory committee and inviting members of the community to comment on potential redevelopment options. Initially,
committee members favored only one-story retail establishments. That mindset changed after the city distributed disposable cameras and asked members to take pictures of places where they would want to shop and congregate. They came back with photos of downtown Boulder and Denver’s LoDo (Lower Downtown) – a three-four story, mixed-use, pedestrian-friendly development with a distinctive sense of place.
In 1999, the city partnered with a developer known for its ability to create such attractive mixed-use communities, Denver-based Continuum Partners, LLC. The Lakewood Reinvestment Authority (LRA) became the public partner for financing the redevelopment. Continuum proposed re-inserting a 22 city-block grid with 3.5 million square feet of development.
Project Development The first phase of Belmar opened in May 2004. The new downtown district has 650,000 square feet of retail, 210,000 square feet of office space, 132 townhomes, 109 apartment units, 12 loft condominiums, and three large public parking garages. As of early 2006, Belmar already boasted over 60 new businesses, including a Whole Foods
35
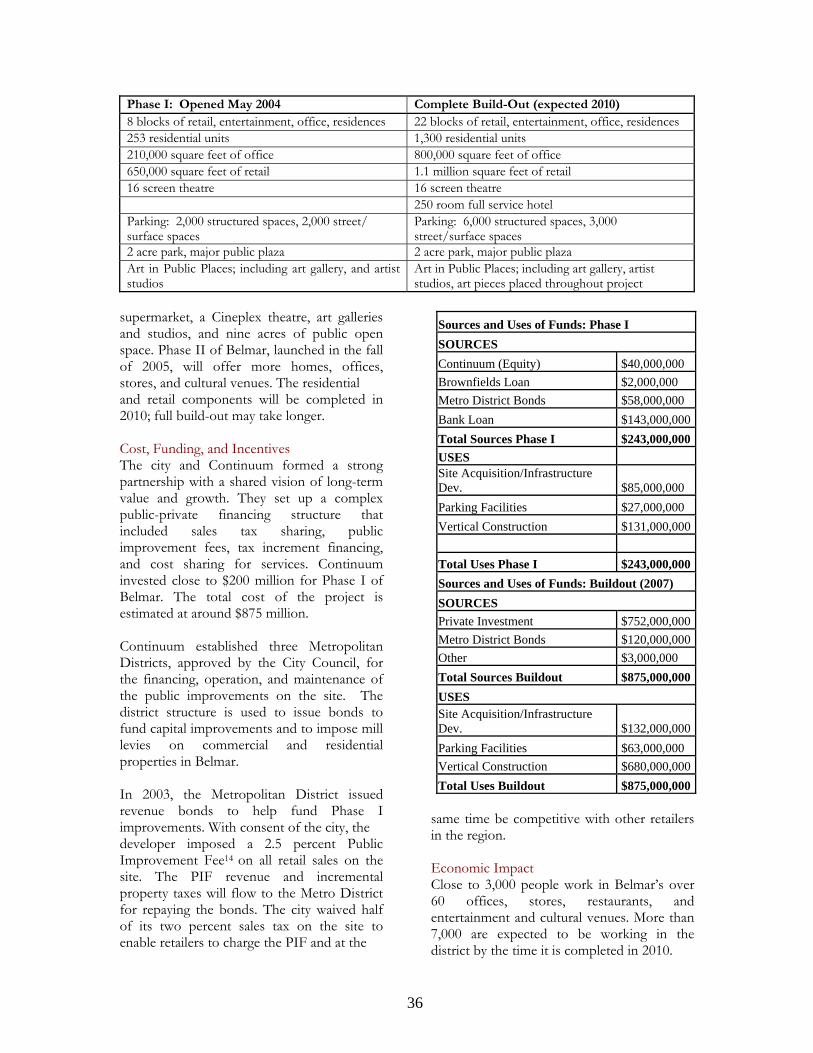
Phase I: Opened May 2004 Complete Build-Out (expected 2010) 8 blocks of retail, entertainment, office, residences 22 blocks of retail, entertainment, office, residences 253 residential units 1,300 residential units 210,000 square feet of office 800,000 square feet of office 650,000 square feet of retail 1.1 million square feet of retail 16 screen theatre 16 screen theatre 250 room full service hotel Parking: 2,000 structured spaces, 2,000 street/ surface spaces
Parking: 6,000 structured spaces, 3,000 street/surface spaces
2 acre park, major public plaza 2 acre park, major public plaza Art in Public Places; including art gallery, and artist studios
Art in Public Places; including art gallery, artist studios, art pieces placed throughout project
supermarket, a Cineplex theatre, art galleries and studios, and nine acres of public open space. Phase II of Belmar, launched in the fall of 2005, will offer more homes, offices, stores, and cultural venues. The residential and retail components will be completed in 2010; full build-out may take longer. Cost, Funding, and Incentives The city and Continuum formed a strong partnership with a shared vision of long-term value and growth. They set up a complex public-private financing structure that included sales tax sharing, public improvement fees, tax increment financing, and cost sharing for services. Continuum invested close to $200 million for Phase I of Belmar. The total cost of the project is estimated at around $875 million. Continuum established three Metropolitan Districts, approved by the City Council, for the financing, operation, and maintenance of the public improvements on the site. The district structure is used to issue bonds to fund capital improvements and to impose mill levies on commercial and residential properties in Belmar. In 2003, the Metropolitan District issued revenue bonds to help fund Phase I improvements. With consent of the city, the developer imposed a 2.5 percent Public Improvement Fee14 on all retail sales on the site. The PIF revenue and incremental property taxes will flow to the Metro District for repaying the bonds. The city waived half of its two percent sales tax on the site to enable retailers to charge the PIF and at the
Sources and Uses of Funds: Phase I SOURCES Continuum (Equity) $40,000,000 Brownfields Loan $2,000,000 Metro District Bonds $58,000,000 Bank Loan $143,000,000 Total Sources Phase I $243,000,000 USES Site Acquisition/Infrastructure Dev. $85,000,000 Parking Facilities $27,000,000 Vertical Construction $131,000,000 Total Uses Phase I $243,000,000 Sources and Uses of Funds: Buildout (2007) SOURCES Private Investment $752,000,000 Metro District Bonds $120,000,000 Other $3,000,000 Total Sources Buildout $875,000,000 USES Site Acquisition/Infrastructure Dev. $132,000,000 Parking Facilities $63,000,000 Vertical Construction $680,000,000 Total Uses Buildout $875,000,000
same time be competitive with other retailers in the region. Economic Impact Close to 3,000 people work in Belmar’s over 60 offices, stores, restaurants, and entertainment and cultural venues. More than 7,000 are expected to be working in the district by the time it is completed in 2010.
36
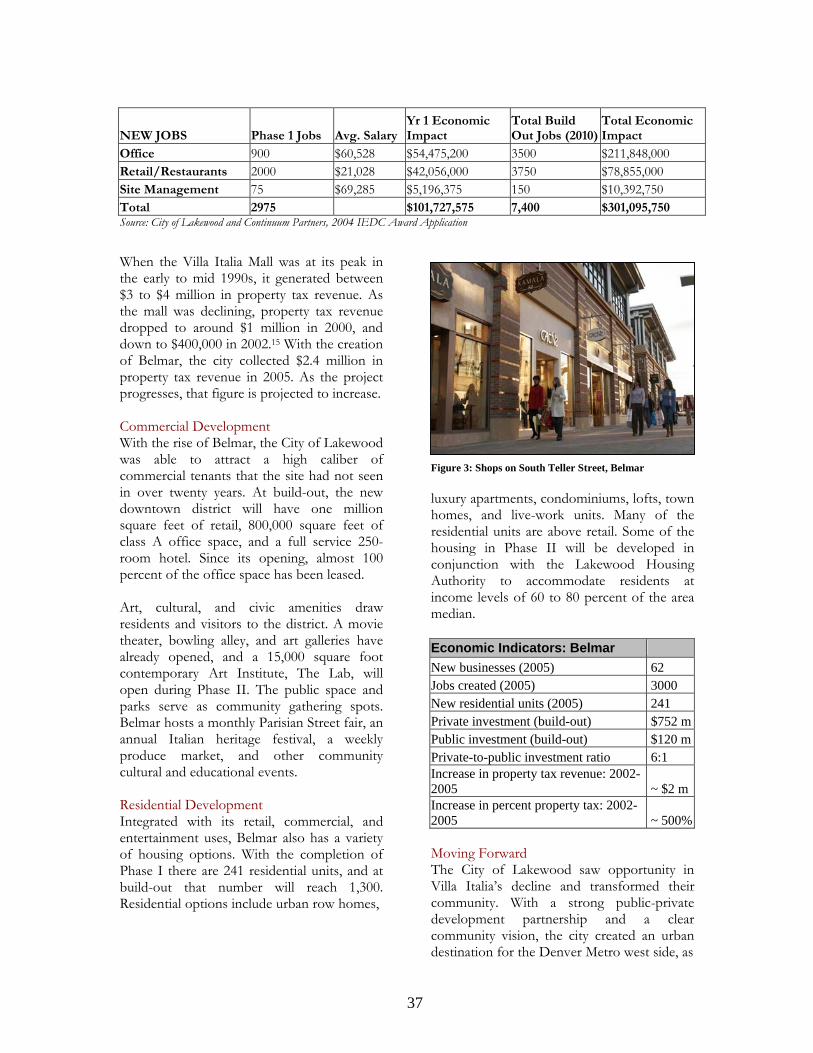
Source: City of Lakewood and Continuum Partners, 2004 IEDC Award Application
NEW JOBS Phase 1 Jobs Avg. SalaryYr 1 Economic Impact
Total Build Out Jobs (2010)
Total Economic Impact
Office 900 $60,528 $54,475,200 3500 $211,848,000 Retail/Restaurants 2000 $21,028 $42,056,000 3750 $78,855,000 Site Management 75 $69,285 $5,196,375 150 $10,392,750 Total 2975 $101,727,575 7,400 $301,095,750
When the Villa Italia Mall was at its peak in the early to mid 1990s, it generated between $3 to $4 million in property tax revenue. As the mall was declining, property tax revenue dropped to around $1 million in 2000, and down to $400,000 in 2002.15 With the creation of Belmar, the city collected $2.4 million in property tax revenue in 2005. As the project progresses, that figure is projected to increase. Commercial Development With the rise of Belmar, the City of Lakewood was able to attract a high caliber of commercial tenants that the site had not seen in over twenty years. At build-out, the new downtown district will have one million square feet of retail, 800,000 square feet of class A office space, and a full service 250-room hotel. Since its opening, almost 100 percent of the office space has been leased. Art, cultural, and civic amenities draw residents and visitors to the district. A movie theater, bowling alley, and art galleries have already opened, and a 15,000 square foot contemporary Art Institute, The Lab, will open during Phase II. The public space and parks serve as community gathering spots. Belmar hosts a monthly Parisian Street fair, an annual Italian heritage festival, a weekly produce market, and other community cultural and educational events. Residential Development Integrated with its retail, commercial, and entertainment uses, Belmar also has a variety of housing options. With the completion of Phase I there are 241 residential units, and at build-out that number will reach 1,300. Residential options include urban row homes,
Figure 3: Shops on South Teller Street, Belmar luxury apartments, condominiums, lofts, town homes, and live-work units. Many of the residential units are above retail. Some of the housing in Phase II will be developed in conjunction with the Lakewood Housing Authority to accommodate residents at income levels of 60 to 80 percent of the area median. Economic Indicators: Belmar New businesses (2005) 62 Jobs created (2005) 3000 New residential units (2005) 241 Private investment (build-out) $752 mPublic investment (build-out) $120 mPrivate-to-public investment ratio 6:1 Increase in property tax revenue: 2002-2005 ~ $2 mIncrease in percent property tax: 2002-2005 ~ 500% Moving Forward The City of Lakewood saw opportunity in Villa Italia’s decline and transformed their community. With a strong public-private development partnership and a clear community vision, the city created an urban destination for the Denver Metro west side, as
37

Figure 4: Holiday Season in Belmar 2004-2005
well as a new model for successful greyfields redevelopment. With new stores, businesses, entertainment venues, public spaces, art and culture, Belmar is becoming the economic engine and community center the city envisioned. Sources Photos courtesy of Continuum Partners LLC Interviews Conducted:
• Erica Adshead, Redevelopment Specialist, Lakewood Reinvestment Authority
• Larry Dorr, Finance Director, City of Lakewood
• Tom Gougon, Principal, Continuum Partners LLC
Works Consulted: EPA National Award for Smart Growth
Achievement, 2005 Entry Package Built Projects (Belmar Application)
2004 IEDC Economic Development Awards Application, submitted by City of Lakewood
Hazel, Debra. “Belmar Helps Revive Center of Lakewood, Colorado,” Shopping Centers Today, International Council of Shopping Centers, September, 2004
Able, Charley. “Lakewood Unveils New Downtown,” Rocky Mountain News. May 15, 2004.
Chamberland, Teresa. “Residents Optimistic About Belmar,” Bear Creek Sentinel. May 19, 2004
Chilton, Kenneth M. Greyfields: The New Horizon for Infill and Higher Density
Regeneration. Center for Environmental Policy and Management. University of Louisville, Kentucky.
Couch, Mark P. Lakewood, Colorado, Mall Demolition to Begin. Denver Post. 1/11/02
MacMillan, Kyle. “Art Scene Takes Quantum Leap with The Lab,” Denver Post. 5/16/04
Websites: City of Lakewood: www.lakewood.org Belmar Redevelopment Website:
www.belmarcolorado.com Continuum Partners LLC:
www.continuumpartners.com Jefferson County Assessor’s Office:
http://jeffco.us/assessor/index.htm Lakewood Fiscal Fact, September 2005:
www.lwvjeffco.org/salestax.html
38
ARTS AND ENTERTAINMENT DISTRICT Fountain Square Indianapolis, Indiana
Figure 1: Fountain Square Cultural District logo Source: Indianapolis Cultural Development Commission Introduction Fountain Square, a historic commercial and residential neighborhood located southeast of downtown Indianapolis, was the city’s first theatre district. But suburban flight and disinvestment beginning in the 1950s turned the once vibrant neighborhood into an economically challenged community. Through community-based redevelopment and continued revitalization, the once distressed neighborhood is now a thriving live-work community for artists.
39

The Southeast Side Neighborhood Development (SEND), a non-profit community development corporation, is the lead organization for the Fountain Square Cultural District. It provides a unified approach to developing the commercial corridor that now comprises more than 300,000 square feet of commercial space and two arts centers. SEND has also worked to upgrade public infrastructure and amenities including a $5.5 million community center and a $2.5 million library. SEND’s effort, with substantial investment from the city, charitable organizations, corporate support, and individual donations, has fostered the revitalization of Fountain Square and its surrounding residential neighborhood. Increased investment in the commercial district has attracted investment in surrounding residential areas, with both long-time residents and new homeowners participating in improving the quality of area homes.16
Figure 2: Fountain Block and Fountain Square Theater Building from the roof of the Murphy Art Center Photo: Dale Bernstein Early Fountain Square From 1910 to 1960, Fountain Square was a neighborhood destination and the city’s downtown for the Southside. There were multiple movie and vaudeville theaters, independent banks, a wide range of retail, churches, and social centers serving a range of ethnicities. Economic hardship in the 1950s eclipsed Fountain Square's long-standing role as the Southside's commercial district. All of the neighborhood theaters closed, and there was a turnover in the type of businesses housed in the original commercial buildings. Many businesses closed and were replaced by lower quality ones.
In the 1970s, construction of I-65 cut the unified Southeast into isolated pockets and destroyed thousands of homes, hundreds of businesses, and many schools and churches. Suburban flight and disinvestment compounded the process.
Figure 3: Fountain Block Senior Citizen Housing and Fountain Square Branch Library Photo: Paul Baumgarten Recovery SEND worked incrementally on individual projects in the commercial district for more than 20 years. “If you look at where Fountain Square was twenty years ago, the improvement is remarkable. We’ve seen many successes as we steadily revitalize the neighborhood’s commercial center,” said SEND Project Manager Paul Baumgarten. Although the substantial success of the revitalization of downtown Indianapolis had some effect on Fountain Square, it was mostly SEND’s long-term commitment that encouraged confidence in program sponsors.
PROPERTY TAX VALUE, FOUNTAIN SQUARE*
Total Property Tax
Value
% Change in Property
Tax Value, 1995-2005
1995 $3,695,033.27
2005 $5,186,859.08 40.47%
*Tables prepared by IEDC include 136 out of 150 parcels for which 1995 and 2005 information was available from census tracts 3559 and 3571. These tracts include significant portions of the Fountain Square Cultural District. SEND is still working to diminish the past negative perceptions of people from outside of the neighborhood, but as more and more people have positive experiences in Fountain
40
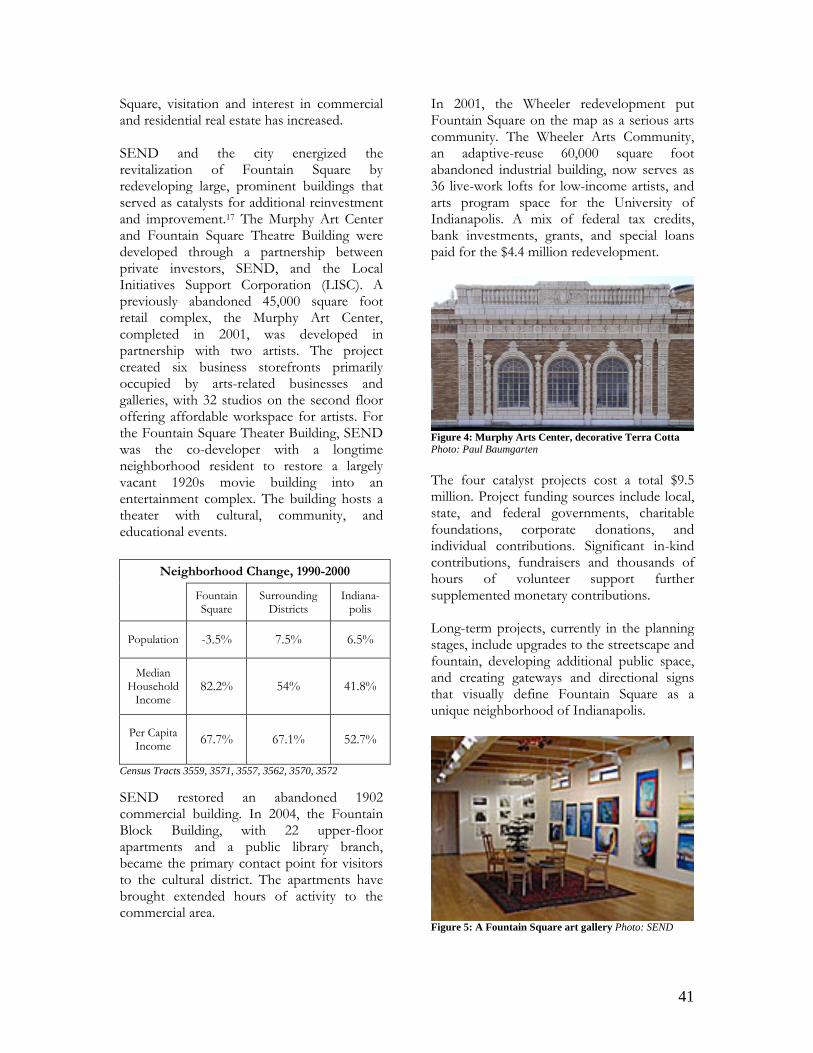
Square, visitation and interest in commercial and residential real estate has increased. SEND and the city energized the revitalization of Fountain Square by redeveloping large, prominent buildings that served as catalysts for additional reinvestment and improvement.17 The Murphy Art Center and Fountain Square Theatre Building were developed through a partnership between private investors, SEND, and the Local Initiatives Support Corporation (LISC). A previously abandoned 45,000 square foot retail complex, the Murphy Art Center, completed in 2001, was developed in partnership with two artists. The project created six business storefronts primarily occupied by arts-related businesses and galleries, with 32 studios on the second floor offering affordable workspace for artists. For the Fountain Square Theater Building, SEND was the co-developer with a longtime neighborhood resident to restore a largely vacant 1920s movie building into an entertainment complex. The building hosts a theater with cultural, community, and educational events.
Census Tracts 3559, 3571, 3557, 3562, 3570, 3572 SEND restored an abandoned 1902 commercial building. In 2004, the Fountain Block Building, with 22 upper-floor apartments and a public library branch, became the primary contact point for visitors to the cultural district. The apartments have brought extended hours of activity to the commercial area.
In 2001, the Wheeler redevelopment put Fountain Square on the map as a serious arts community. The Wheeler Arts Community, an adaptive-reuse 60,000 square foot abandoned industrial building, now serves as 36 live-work lofts for low-income artists, and arts program space for the University of Indianapolis. A mix of federal tax credits, bank investments, grants, and special loans paid for the $4.4 million redevelopment.
Figure 4: Murphy Arts Center, decorative Terra Cotta Photo: Paul Baumgarten The four catalyst projects cost a total $9.5 million. Project funding sources include local, state, and federal governments, charitable foundations, corporate donations, and individual contributions. Significant in-kind contributions, fundraisers and thousands of hours of volunteer support further supplemented monetary contributions.
Neighborhood Change, 1990-2000
Fountain Square
Surrounding Districts
Indiana-polis
Population -3.5% 7.5% 6.5%
Median Household
Income 82.2% 54% 41.8%
Per Capita Income 67.7% 67.1% 52.7%
Long-term projects, currently in the planning stages, include upgrades to the streetscape and fountain, developing additional public space, and creating gateways and directional signs that visually define Fountain Square as a unique neighborhood of Indianapolis.
igure 5: A Fountain Square art gallery Photo: SEND F
41

Economic Indicators and Funding
Economic Indicators, 2002-200518
Total jobs created in district (direct & indirect)19 77Number of businesses assisted (2004-2005)20 116Square footage developed or renovated21 177,200Number of new businesses recruited to district22 42Direct overall investment (2004-2005)23 $609,701
Although the population in the Fountain Square Commercial District decreased by 3.5 percent between 1990-2000, the surrounding areas experienced a population increase of 7.5 percent at that time. The commercial district’s median household income rose by 82 percent from $15,331 in 1989 to $27,936 in 1999. The neighboring census tracts experienced a 54 percent increase. Similar to the change in median household income, per capita income steadily rose over the same decade by 67 percent in Fountain Square and surrounding districts. Fountain Square outpaced the city’s increase in median household income (41.8 percent) and per capita income (52.7 percent).
Figure 6: Fountain Square Theatre Marquee. Photo: Dale Bernstein. Fountain Square’s residential occupancy rate was 6 percent less than the city’s in both 1990 and 2000. But while Indianapolis’s rate dropped by 2.3 percent from 1990 to 2000, the residential occupancy rate rose by 1.2 percent in the areas around Fountain Square. Property tax values increased by 40.5 percent in Fountain Square from 1995 to 2005. Private investment funds most of the current projects in Fountain Square. In 2004 there was a total of $176,000 in funding from private organizations and $5,000 from public organizations.
The following year there was $23,700 from public sources and $154,700 in private investment. Fountain Square is just beginning to see interest and investment from private developers. A boom in the condominium market in downtown Indianapolis is gradually working its way into the area. Streetscape and infrastructure improvements will potentially attract multiple new development opportunities on the commercial corridor. SEND is still the primary developer, but they are marketing the area to the commercial development and real estate community.
Project Project Cost Fountain Block $ 2.5 million Wheeler Arts Community $ 4.4 million Murphy Art Center $ 1 million Fountain Square Streetscape Improvements $ 1.6 million
Total $ 9.5 million
Future Outlook The development of the Fountain Square Commercial Corridor is an organic and slow process. Sustainability was a constant concern as the program was being developed. Currently, long-term funding for the Fountain Square Main Street program remains a primary concern. Challenges include improving cultural identity (artists are not integrated into the local community) and enhancing the architecture.
Figure 7: Wheeler Arts Community, Studio Residence Photo: Axis Architects The Fountain Square Cultural District is a young project. Taking the cultural district project under its wings only a few years ago, SEND has managed to finesse multiple programs and initiatives through careful oversight in a very short time. The success of the project is already visible in the revitalization of the neighborhood, but it will still take several more years to
42
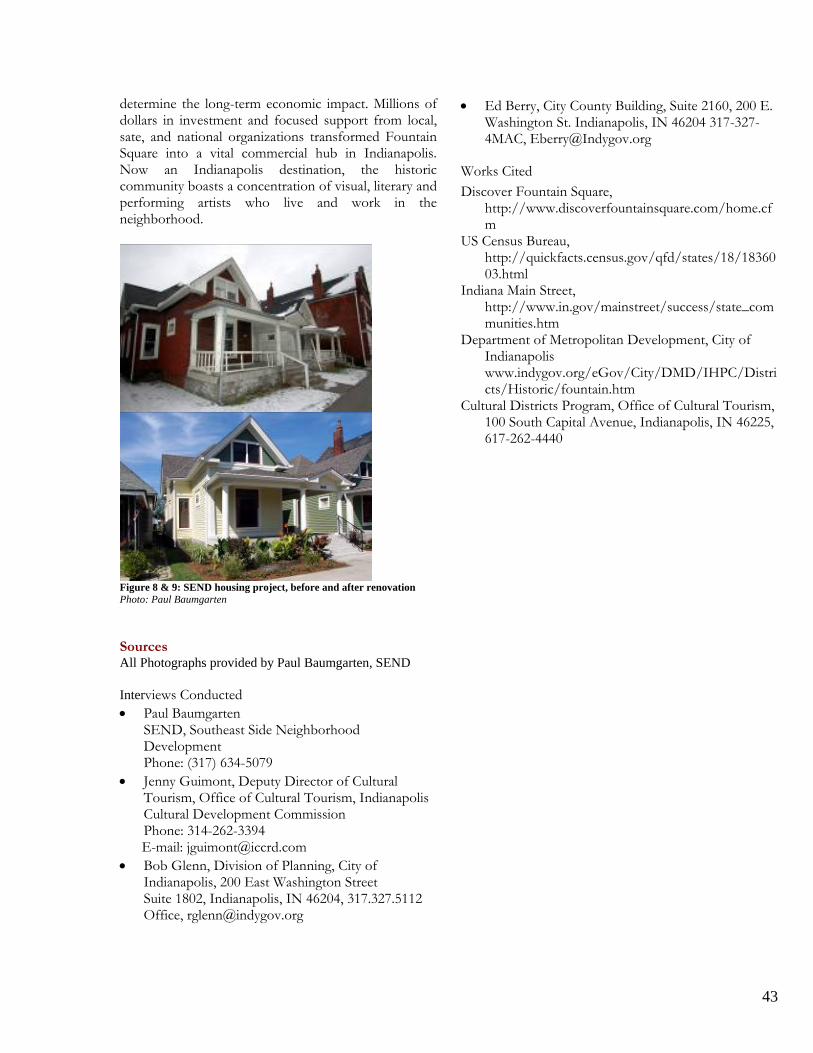
determine the long-term economic impact. Millions of dollars in investment and focused support from local, sate, and national organizations transformed Fountain Square into a vital commercial hub in Indianapolis. Now an Indianapolis destination, the historic community boasts a concentration of visual, literary and performing artists who live and work in the neighborhood.
Figure 8 & 9: SEND housing project, before and after renovation Photo: Paul Baumgarten Sources All Photographs provided by Paul Baumgarten, SEND Interviews Conducted • Paul Baumgarten
SEND, Southeast Side Neighborhood Development Phone: (317) 634-5079
• Jenny Guimont, Deputy Director of Cultural Tourism, Office of Cultural Tourism, Indianapolis Cultural Development Commission Phone: 314-262-3394
E-mail: [email protected] • Bob Glenn, Division of Planning, City of
Indianapolis, 200 East Washington Street Suite 1802, Indianapolis, IN 46204, 317.327.5112 Office, [email protected]
• Ed Berry, City County Building, Suite 2160, 200 E. Washington St. Indianapolis, IN 46204 317-327-4MAC, [email protected]
Works Cited Discover Fountain Square,
http://www.discoverfountainsquare.com/home.cfm
US Census Bureau, http://quickfacts.census.gov/qfd/states/18/1836003.html
Indiana Main Street, http://www.in.gov/mainstreet/success/state_communities.htm
Department of Metropolitan Development, City of Indianapolis www.indygov.org/eGov/City/DMD/IHPC/Districts/Historic/fountain.htm
Cultural Districts Program, Office of Cultural Tourism, 100 South Capital Avenue, Indianapolis, IN 46225, 617-262-4440
43

ARTS & ENTERTAINMENT DISTRICTS Artist Relocation Program Paducah, Kentucky
Figure 1: Promotional material for Paducah’s art district Introduction Art is often considered an expression, a measure of talent, or a guide to culture and history, but to residents of Paducah, Kentucky (pop. 26,307) art is economic development. A walk through the 22 square block Lower Town neighborhood illustrates how this community has embraced its history and attracted new creative enterprises. Located in western Kentucky along the Illinois border and Ohio River, the once distressed neighborhood boasts historic homes and storefronts now used as residences, galleries, cafes, and workshops. Lower Town owes much of its renewed energy to the Artist Relocation Program, an initiative designed to lure artists and associated economic benefits to Paducah. Adopted in 2000 with the Lower Town Neighborhood Plan, the program attracted 62
44

Figure 2 & 3: An abandoned Texaco Station (top) is now home to the Candle Station (bottom) artists and $15.5 million in private investment by 2005. The economic turnaround is grounded in smart growth principles. By strengthening existing neighborhoods, revitalizing abandoned buildings, and making it more convenient to get between homes and jobs, the program is creating benefits for residents throughout the city. Glory and Decline Developed between the 1850s and 1920s, Lower Town is the oldest part of Paducah. Following the Civil War, businessmen, wealthy from industrial development located on the river, built mansions in the neighborhood. Because of its age and grandeur, Lower Town was placed on the National Register of Historic Places in 1982.
Despite its historic character and proximity to downtown, Lower Town declined after World War II, leaving large Victorian homes, bungalows, and storefronts in decay. New construction ceased in the 1950s, and historic homes were carved into apartments. The neighborhood became increasingly transient – it was seventy percent rental by 2000 –and did not seem safe, due in part to increased drug activity. The Plan Begins Following persuasion from resident and artist Mark Barone in 2000, the city initiated the Lower Town Neighborhood Plan to reduce crime, increase safety and property ownership, and ultimately improve the quality of life in Lower Town. The city adopted business-licensing policies from Minneapolis and Kansas City, built an inventory of properties in Lower Town, and held visioning meetings with the community. These efforts brought 65 percent of code-violating properties into compliance.
Economic Indicators, 2000 - 2005
Total jobs created 97Number of relocated artists 62Number of new businesses 25Vacancy rate decline 46%Ratio of private to public investment
13:1
Private Investment $15.5 milPublic Investment $1.2 milTotal Area of New Construction 48,000 sq ftTotal area of renovation 138,000 sq ft With revitalization in progress, the city looked for ways to draw new residents and businesses. The artist attraction strategy was a natural fit: the city felt that artists would buy properties, start new businesses, and draw tourism to the area. Plus, Paducah already had plenty of arts and tourism assets – theaters, a performing arts center, a quilt museum, a symphony, and shopping.
45
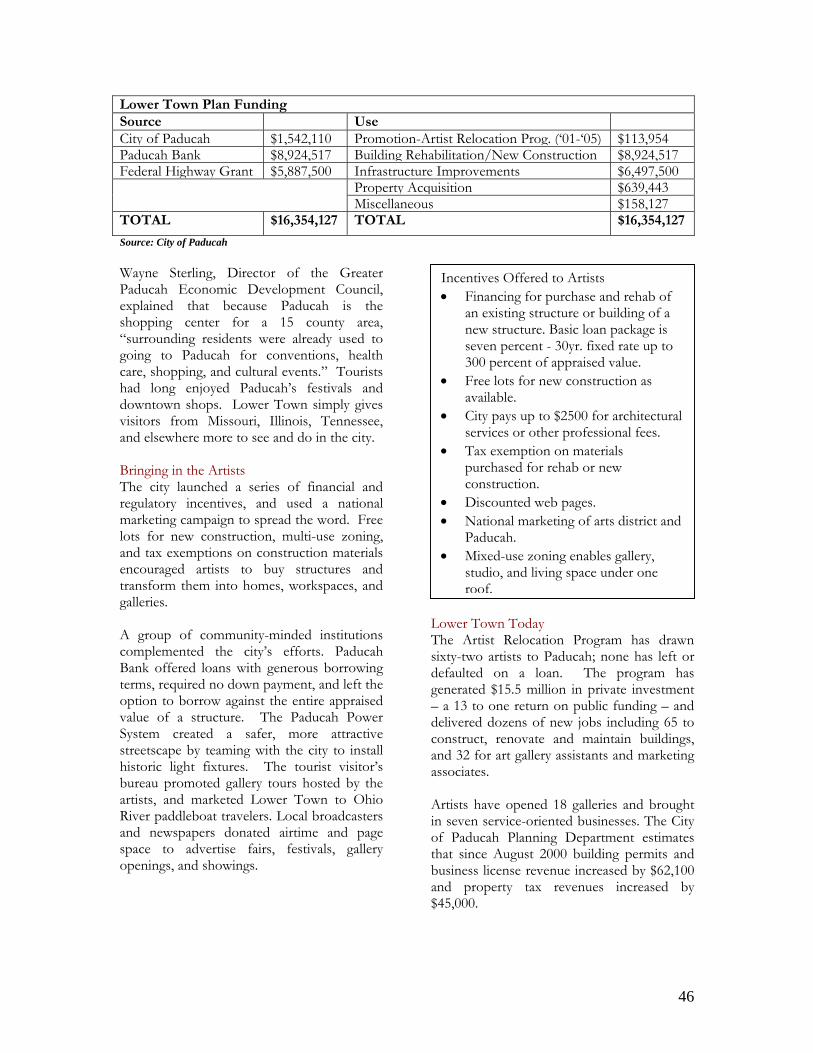
Lower Town Plan Funding Source Use City of Paducah $1,542,110 Promotion-Artist Relocation Prog. (‘01-‘05) $113,954Paducah Bank $8,924,517 Building Rehabilitation/New Construction $8,924,517Federal Highway Grant $5,887,500 Infrastructure Improvements $6,497,500
Property Acquisition $639,443 Miscellaneous $158,127
TOTAL $16,354,127 TOTAL $16,354,127
Source: City of Paducah Wayne Sterling, Director of the Greater Paducah Economic Development Council, explained that because Paducah is the shopping center for a 15 county area, “surrounding residents were already used to going to Paducah for conventions, health care, shopping, and cultural events.” Tourists had long enjoyed Paducah’s festivals and downtown shops. Lower Town simply gives visitors from Missouri, Illinois, Tennessee, and elsewhere more to see and do in the city. Bringing in the Artists The city launched a series of financial and regulatory incentives, and used a national marketing campaign to spread the word. Free lots for new construction, multi-use zoning, and tax exemptions on construction materials encouraged artists to buy structures and transform them into homes, workspaces, and galleries. A group of community-minded institutions complemented the city’s efforts. Paducah Bank offered loans with generous borrowing terms, required no down payment, and left the option to borrow against the entire appraised value of a structure. The Paducah Power System created a safer, more attractive streetscape by teaming with the city to install historic light fixtures. The tourist visitor’s bureau promoted gallery tours hosted by the artists, and marketed Lower Town to Ohio River paddleboat travelers. Local broadcasters and newspapers donated airtime and page space to advertise fairs, festivals, gallery openings, and showings.
LTsdg–dcaa Aiotba$
Incentives Offered to Artists • Financing for purchase and rehab of
an existing structure or building of a new structure. Basic loan package is seven percent - 30yr. fixed rate up to 300 percent of appraised value.
• Free lots for new construction as available.
• City pays up to $2500 for architectural services or other professional fees.
• Tax exemption on materials purchased for rehab or new construction.
• Discounted web pages. • National marketing of arts district and
Paducah. • Mixed-use zoning enables gallery,
studio, and living space under one roof.
ower Town Today he Artist Relocation Program has drawn ixty-two artists to Paducah; none has left or efaulted on a loan. The program has enerated $15.5 million in private investment a 13 to one return on public funding – and elivered dozens of new jobs including 65 to onstruct, renovate and maintain buildings, nd 32 for art gallery assistants and marketing ssociates.
rtists have opened 18 galleries and brought n seven service-oriented businesses. The City f Paducah Planning Department estimates hat since August 2000 building permits and usiness license revenue increased by $62,100 nd property tax revenues increased by 45,000.
46
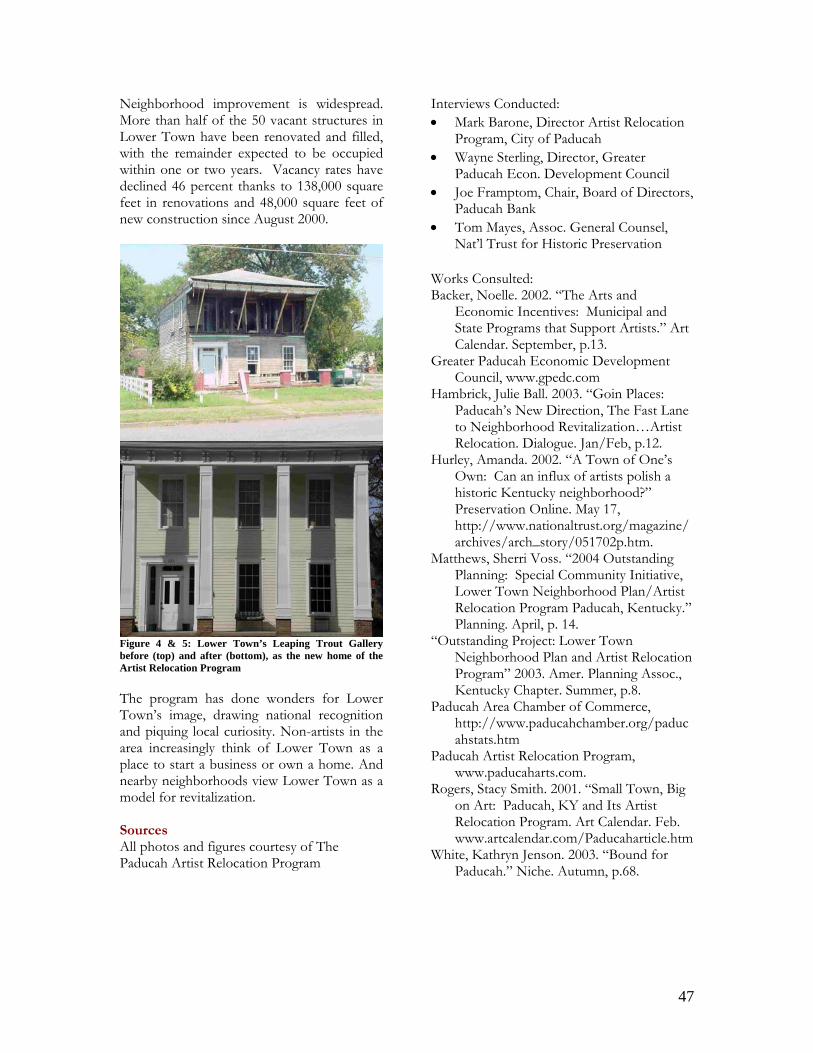
Neighborhood improvement is widespread. More than half of the 50 vacant structures in Lower Town have been renovated and filled, with the remainder expected to be occupied within one or two years. Vacancy rates have declined 46 percent thanks to 138,000 square feet in renovations and 48,000 square feet of new construction since August 2000.
Figure 4 & 5: Lower Town’s Leaping Trout Gallery before (top) and after (bottom), as the new home of the Artist Relocation Program The program has done wonders for Lower Town’s image, drawing national recognition and piquing local curiosity. Non-artists in the area increasingly think of Lower Town as a place to start a business or own a home. And nearby neighborhoods view Lower Town as a model for revitalization. Sources All photos and figures courtesy of The Paducah Artist Relocation Program
Interviews Conducted: • Mark Barone, Director Artist Relocation
Program, City of Paducah • Wayne Sterling, Director, Greater
Paducah Econ. Development Council • Joe Framptom, Chair, Board of Directors,
Paducah Bank • Tom Mayes, Assoc. General Counsel,
Nat’l Trust for Historic Preservation Works Consulted: Backer, Noelle. 2002. “The Arts and
Economic Incentives: Municipal and State Programs that Support Artists.” Art Calendar. September, p.13.
Greater Paducah Economic Development Council, www.gpedc.com
Hambrick, Julie Ball. 2003. “Goin Places: Paducah’s New Direction, The Fast Lane to Neighborhood Revitalization…Artist Relocation. Dialogue. Jan/Feb, p.12.
Hurley, Amanda. 2002. “A Town of One’s Own: Can an influx of artists polish a historic Kentucky neighborhood?” Preservation Online. May 17, http://www.nationaltrust.org/magazine/archives/arch_story/051702p.htm.
Matthews, Sherri Voss. “2004 Outstanding Planning: Special Community Initiative, Lower Town Neighborhood Plan/Artist Relocation Program Paducah, Kentucky.” Planning. April, p. 14.
“Outstanding Project: Lower Town Neighborhood Plan and Artist Relocation Program” 2003. Amer. Planning Assoc., Kentucky Chapter. Summer, p.8.
Paducah Area Chamber of Commerce, http://www.paducahchamber.org/paducahstats.htm
Paducah Artist Relocation Program, www.paducaharts.com.
Rogers, Stacy Smith. 2001. “Small Town, Big on Art: Paducah, KY and Its Artist Relocation Program. Art Calendar. Feb. www.artcalendar.com/Paducaharticle.htm
White, Kathryn Jenson. 2003. “Bound for Paducah.” Niche. Autumn, p.68.
47
END NOTES 1 Florida, Richard. “Competing in the Age of
Talent: Quality of Place and the New Economy.” January 2000.
2 Blakely, Edward and Ted Bradshaw. Planning Local Economic Development: Theory and Practice. Sage Publications: Thousand Oaks, CA. 2002. pp81.
3 Brookings Institution. “Back to Prosperity: A Competitive Agenda for Renewing Pennsylvania.” December 2003. Available at: www.brook.edu/metro/publications/pa.htm
4 Urban Land Institute and PricewaterhouseCoopers. “Emerging Trends in Real Estate.” ULI: Washington, DC. 2006.
5 See for example: Carroll, Brendan. “Greater Boston Office Market. Summer 2005.” Richards Barry Joyce and partners. Boston, MA. pp.7.
Hochstein, Marc. “Planned Communities at Middle Age.” Grid Magazine. June 2001. pp.66-71.
Weinstein, Bernard L. and Terry L. Clower. “The Estimated Value of New Investments Adjacent to DART LRT Stations: 1999-2005.” September 27, 2005. Available at: http://www.valleymetro.org.
6 Leach, Dennis. “Transit Oriented Development in Arlington County, Virginia: Thirty Years of Results.” 2003. Available at www.reconnecting america.org/html/TOD/case_studies.htm.
7 National Trust for Historic Preservation. “Economic Statistics: The Main Street Program’s Success: Historic Preservation Equals Economic Development.” 2004. Available at: http://www.mainstreet.org/content.aspx?page=7966§ion=2.
8 See for example: U.S. EPA. Our Built and Natural Environments: A Technical Review of the Interactions between Land Use, Transportation, and Environmental Quality. January 2001. Available at: http://epa.gov/smartgrowth/pdf/built.pdf.
9 Transportation Cooperation Research Program Report 102 Transit Oriented Development in the United States: Experiences, Challenges, and Prospects. ‘Chapter 17: Portland’s TODs.’ Washington, DC: Federal Transit Administration, May 2004.
10 This category of employment is defined as jobs held by employees working within the boundaries of a specific jurisdiction. It differs from “labor force” employment which
represents jobs held by residents within the jurisdiction working anywhere.
11 “Main Street Success Stories,” National Trust for Historic Preservation.” 1995. P 161.
12 O’Toole, Christine H. 2005. “Arts and Science Remake the Steel City.” NYT. July 20.
13 Estimate of the International Council of Shopping Centers, cited in Chilton (see Works Cited)
14 A Public Improvement Fee (PIF) is a fee that developers may require their retail tenants collect on sales transactions to pay for public improvements on the site.
15 The historical property tax revenue figures are based on developer estimates.
16 www.discoverfountainsquare.com/userctl.cfm ?PageContentTypeID=1&PageContentID=9
17 The city of Indianapolis supported SEND in housing rehab and home repair through HOME and CDGB funding. It also provided limited CDGB funding to the LISC Commercial Façade Rebate Program. They have not provided direct financial support to commercial development projects.
18 2005 figures reflect calculations through 3rd quarter.
19 List of businesses, plus justified guess of additional jobs based on number of new jobs, businesses created and expanded.
20 Staff or program volunteers provide direct technical assistance; TA is defined as helping businesses with intervention services, partnerships, contracts, networking, workforce development, interfacing with the City, marketing, financing, training, inventory expansion, providing information, getting membership into the merchant association.
21 Direct and indirect; square footage developed or renovated as a result of the program; includes façade improvements and frontage improved by signage or greenspace; with and without direct assistance by SEND prior to opening.
22 Businesses recruited to Fountain Square commercial district through staff’s or program volunteer’s direct contact and assistance.
23 Façade and signage grant awards (direct façade grant or subsidy amount), façade and signage program leverage (matched by any private, for profit; or façades done without grants), Brownfield grant, cash dollars raised, in-kind dollars raised, TA voucher grants, TA grant leverage.
48
International Economic Development Council
734 15th St. NW, Suite 900 Washington, DC 20005
202.223.7800
www.IEDConline.org
