economic evaluation of outcomes: long term primary and surrogate endpoints dr. giampiero favato...
Post on 21-Dec-2015
213 views
TRANSCRIPT
Economic evaluation of outcomes: long term primary and surrogate endpointsDr. Giampiero Favatopresented at the University Program in Health EconomicsRagusa, 26-28 June 2008

2
Measuring health and disease
Many measures are used to assess health outcomes, ranging from:– Those trying to capture the effect of an intervention on people’s general health
(e.g. quality of life, Short Form36 (SF36) or days off work).
To:– Measures of a specific dimension relevant to a particular disease (e.g. peak flow
rate).
People do not have the experience or knowledge of these conditions and the interventions to make accurate judgements as to the likely benefits.
Health care policy makers also need evidence on the likely benefits from health care spending (clinical evaluation) and whether these benefits justify the costs (economic evaluation).
Primary endpoints
Surrogate endpoints

3
Continuous vs. discrete outcomes measures
When the outcomes of a study are continuous (e.g. temperature, blood pressure, or cholesterol concentrations), the researchers are usually interested in the extent to which these values change after exposure to an intervention.
Instead of measuring health outcomes on a continuous scale, studies often focus on health events, such as cases of disease, death, or hospital discharge. What these outcomes have in common is that the event either occurs or it does not; they are discrete measures.
Surrogate endpoints
Primary endpoints

4
Components of economic evaluation
Source: M. Drummond et al., Methods for the economic evaluation of health care programmes. Second edition. OUP 1997

5
Extrapolating health benefits from the short to the long term For some health care interventions, such as antibiotic
treatment for an acute infection, all the relevant benefits (and costs) occur over a relatively short period of time.
Many interventions are for diseases (that progress over time), such as Alzheimer’s disease or rheumatoid arthritis. In such cases the relevant time period for the economic evaluation could be a number of years.
If clinical studies always followed patients for a lifetime, there would be no need for extrapolation. However, long-term follow-up is costly and often infeasible, so some method of extrapolation is required in order to estimate health benefits over the relevant time period for economic evaluation.

6
Methods of extrapolation
Linking short and long-term outcomes via an epidemiological risk factor model.
Statistical extrapolations of survival curves. State transition models, the most well-known of which is the
Markov model (Briggs and Sculpher, 1998).

7
Favato G. et al. Cost-effective analysis of anti-HPV vaccination programme in Italy: a multi-cohort Markov model. Henley discussion paper series. HCVI n° 13, February 2007
Example: cost-effective analysis of anti-HPV vaccination programme in Italy. Study objective: to evaluate the cost-effectiveness of a multi-
cohort vaccination strategy. Perspective: the provider (Italian SSN) Method: multi-cohort Markov model.

8
Parameters Inputs
Cohorts 4
Age 11, 12, 18, 25 years
Coverage 70-80% (IC95%: 60-90)
Immunization 90% (IC95%: 80-100)
Clinical efficacy 90% (IC95%: 85-100)
Doses (administered at 0, 2, 6 months)
3
Duration of protection Lifetime
Booster Not necessary
Individual cost Euro 312
The model
Favato G. et al. Cost-effective analysis of anti-HPV vaccination programme in Italy: a multi-cohort Markov model. Henley discussion paper series. HCVI n° 13, February 2007
9
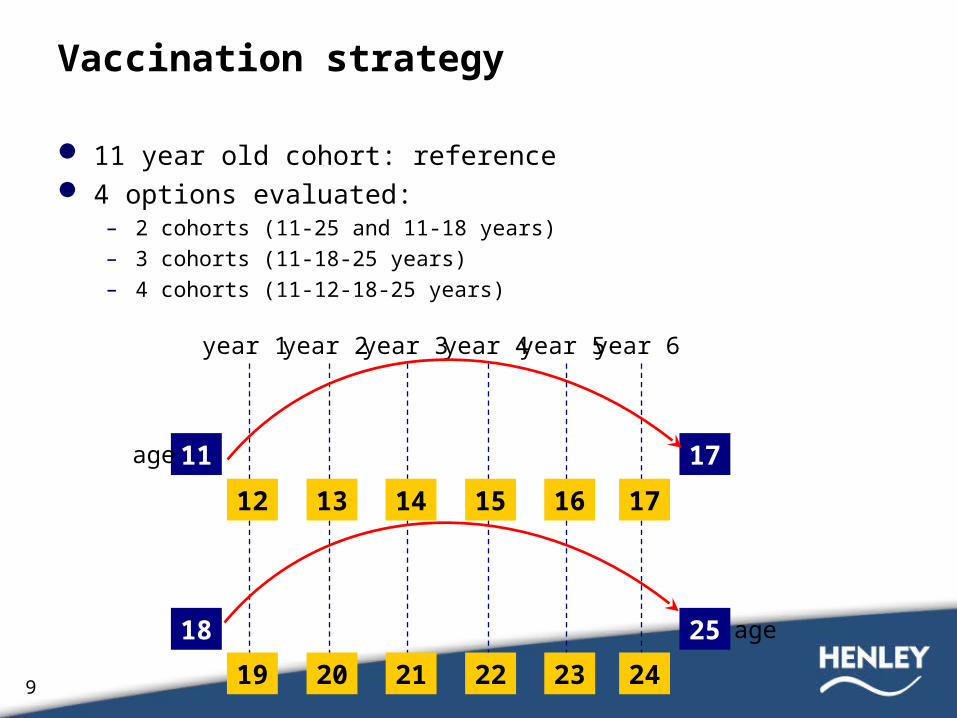
Vaccination strategy
11 year old cohort: reference 4 options evaluated:
– 2 cohorts (11-25 and 11-18 years)– 3 cohorts (11-18-25 years)– 4 cohorts (11-12-18-25 years)
year 1 year 2 year 3 year 4 year 5 year 6
11 17
18 25
1412 15 16 1713
2119 22 23 2420
age
age

10
0%
5%
10%
15%
20%
25%
15-19 20-24 25-29 30-34 35-39 40-44 45-49 50-54 55-59 60-64 >65
Pre
vale
nza
HP
V
HPV
Multi-cohort strategy
11-12 years: still not exposed to HPV virus
18 years: age immediately before HPV infection peak
25 years: reduction of pre-cancerous lesions (integration with screening programme)

11
Results: 3-4 cohorts to obtain high efficiency in short-medium time
90%
35%
66%
85%
0
0.1
0.2
0.3
0.4
0.5
0.6
0.7
0.8
0.9
1
0 1 2 3 4 5 6 7 8 9 10 11 12 13 14 15 16 17 18
Max
theo
retic
al re
duct
ion
ofH
PV 1
6/18
indu
ced
carc
inom
a (%
)
Co-horts
∆ = 5
∆ = 19
∆ = 31 Average reduction obtainablewith screening programme
12
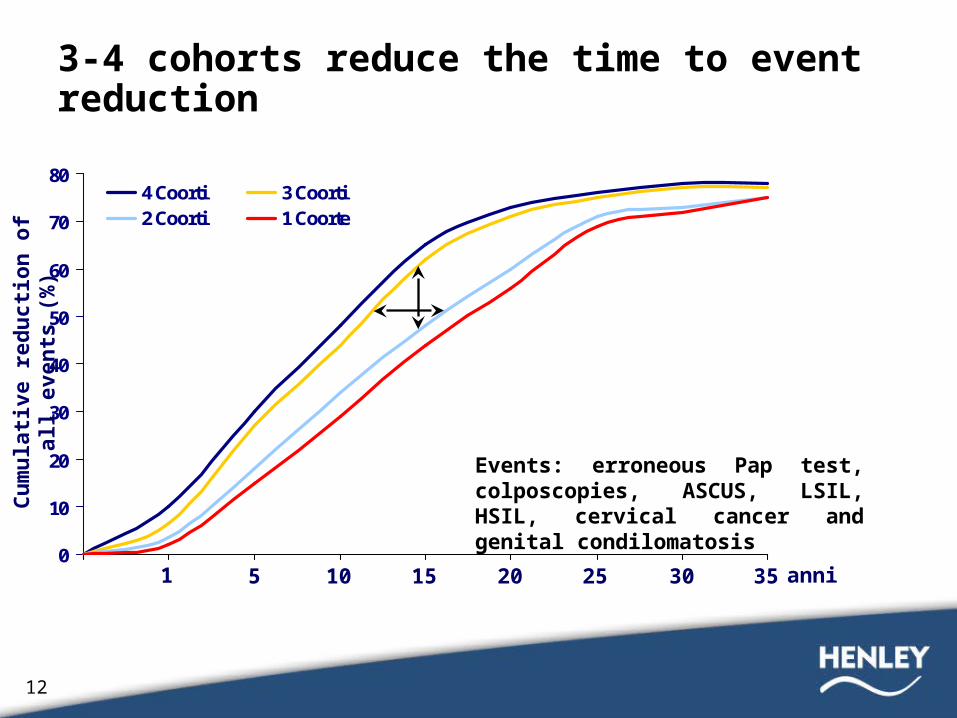
3-4 cohorts reduce the time to event reduction
0
10
20
30
40
50
60
70
80
1 2 3 4 5 6 7 8 9
4 Coorti 3 Coorti2 Coorti 1 Coorte
Cum
ulat
ive
redu
ctio
n of
all
even
ts
(%)
5 10 3015 20 251 35 anni
Events: erroneous Pap test, colposcopies, ASCUS, LSIL, HSIL, cervical cancer and genital condilomatosis

13
Outcome
0
20
40
60
80
100
120
140
0 5 10 15 20 25 30
Costi del vaccino
Riduzione di spesa
savings
incrementalcost
years
Euro (Mill)
Break-even reached after 8 yearsOverall cost reduction > 50%
Favato G. et al. Cost-effective analysis of anti-HPV vaccination programme in Italy: a multi-cohort Markov model. Henley discussion paper series. HCVI n° 13, February 2007

14
The cost reduction for SSN progressively exceeds 50%
1.4
16.4
46.7
79.1
93.8
109.6
98.2
59.3
24.1
2.6
0
10
20
30
40
50
60
70
80
90
100
110
120
130
0 5 10 15 20 25
Min reduction Max reduction Average reduction
15
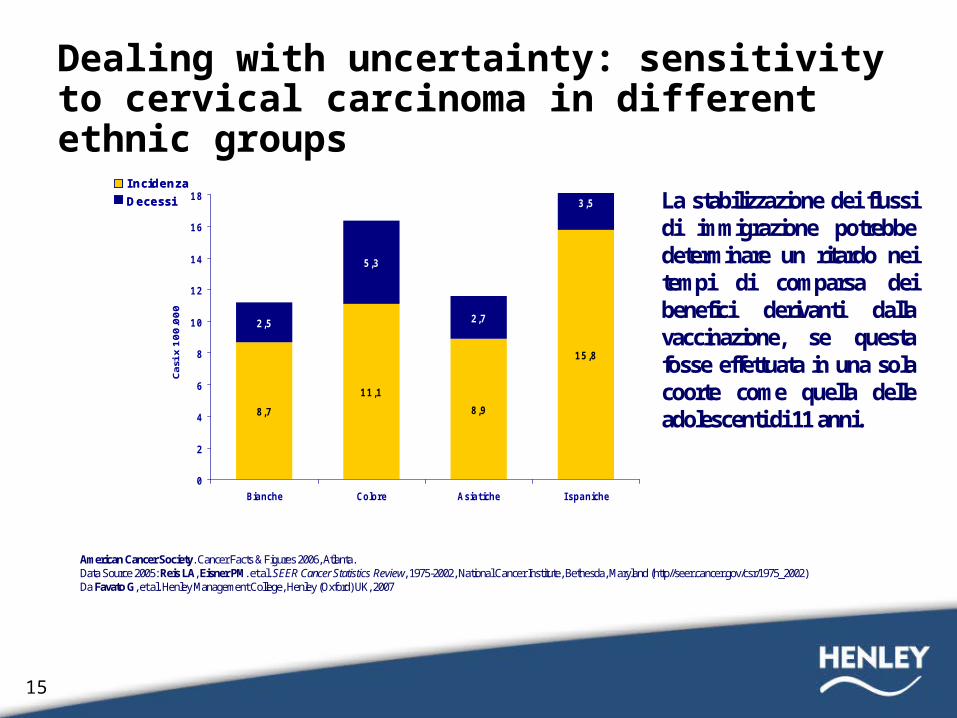
Dealing with uncertainty: sensitivity to cervical carcinoma in different ethnic groups
8,7
11,1
8,9
15,8
2,5
5,3
2,7
3,5
0
2
4
6
8
10
12
14
16
18
Bianche Colore Asiatiche Ispaniche
Cas
i x 1
00
.00
0
American Cancer Society. Cancer Facts & Figures 2006, Atlanta. Data Source 2005: Reis LA, Eisner PM. et al. SEER Cancer Statistics Review, 1975-2002, National Cancer Institute, Bethesda, Maryland (http//seer.cancer.gov/csr/1975_2002)Da Favato G, et al. Henley Management College, Henley (Oxford) UK, 2007
I ncidenza
Decessi
Incidenza
Decessi La stabilizzazione dei flussi di immigrazione potrebbe determinare un ritardo nei tempi di comparsa dei benefici derivanti dalla vaccinazione, se questa fosse effettuata in una sola coorte come quella delle adolescenti di 11 anni.