economic freedom and human capital investment · economic freedom and human capital investment 423...
TRANSCRIPT

Journal of Institutional Economics (2017) 13 2 421ndash445Ccopy Millennium Economics Ltd 2016 doi101017S174413741600028XFirst published online 17 October 2016
Economic freedom and human capitalinvestment
H O R S T F E L D M A N N lowast
Department of Economics University of Bath Bath UK
Abstract Using data from 1972 to 2011 on 109 countries this paper empiricallystudies the impact of economic freedom on human capital investment Enrollmentin secondary education is used as a proxy for such investments Controlling for alarge number of other determinants of education it finds that over the sampleperiod economic freedom had a substantial positive effect This is probablybecause more economic freedom increases the return on investing in humancapital enables people to keep a larger share of the return and by facilitating theoperation of credit markets makes it easier for them to undertake suchinvestments in the first place
1 Introduction
In recent decades both the study of economic freedom and the study of humancapital investment have become important areas of research (for surveys seeBurton-Jones and Spender 2011 Hall and Lawson 2014) However it hashardly been analyzed so far whether economic freedom affects human capitalinvestment Why might there be such an effect One possible reason wasadvanced by Schultz (1975) who argued that returns to human capital arehighest if government does not restrict the ability of firms and individuals toadapt to unexpected price productivity and technology shocks ndash ie if there isa high degree of economic freedom By contrast if government severely restrictseconomic freedom this would limit the degree to which firms and individualscan react to such shocks substantially reducing returns to human capital Whilein the latter scenario individuals and firms would be induced to invest less intheir human capital or in that of their employees in the former scenario theywould be induced to invest more
More generally one can expect economic freedom to affect human capitalinvestment for similar reasons as to why it usually affects investment in physicalcapital (on the latter see eg Besley 1995) There are three main reasons Firstas key elements of economic freedom include secure property rights a low levelof taxation and monetary stability it protects economic agents both from expro-
lowastEmail hfeldmannbathacuk
421
httpswwwcambridgeorgcoreterms httpsdoiorg101017S174413741600028XDownloaded from httpswwwcambridgeorgcore University of Bath on 30 Apr 2017 at 131945 subject to the Cambridge Core terms of use available at
422 HORST FELDMANN
priation and from dilution of their property rights through high taxation or highinflation Individuals and firms thus have an incentive to invest in both physicaland human capital because they can enjoy the fruits of their investments For thesame reason parents have an incentive to invest in their childrenrsquos human capital
A second reason as to why economic freedom is likely to stimulate investmentin human capital is that the former enhances the gains from economic exchangeKey elements of economic freedom relevant here are the rule of law and a lightregulatory burden especially on product and labor markets as well as low tariffand non-tariff barriers to international trade These elements as well as otherelements of economic freedom such as modest taxation incentivize individuals tomaximize the return on their human capital by engaging in economic exchangeAdditionally they enable firms to employ workers efficiently These effects inturn provide individuals (including parents) and firms with strong incentives toinvest in human capital
Third economic freedom is likely to stimulate investment in human capitalbecause it facilitates the operation of credit markets Key elements of economicfreedom relevant here are secure property rights (including an effective protectionof investors and the right to use property as collateral) and a pro-competitiveregulation of those markets Investment in human capital ndash schooling inparticular ndash entails a large upfront fixed cost while the return in form of higherwages accrues throughout working life Thus parents often need to take outloans to invest in their childrenrsquos education The easier it is to use property ascollateral and the more competitive credit markets are the easier and cheaper itis for them to do so Firmsrsquo training of workers ndash apprenticeships in particularndash also entails a substantial upfront investment in human capital with returnsaccruing over many subsequent years of employment Firmsrsquo costs to invest in thehuman capital of their employees are also lower the more secure property rightsand the more competitive credit markets are as firms usually fund investmentthrough loans Obviously this too is similar to investment in physical capital1
So far there are only three previous papers empirically studying the effectof economic freedom on human capital investment The first one by Dawson(1998) only briefly touches upon the issue as it is mainly concerned with thedeterminants of economic growth and physical investment However it alsoreports the results from a few regressions to explain the secondary schoolenrollment rate In these regressions which use cross-sectional data on 84countries from the period 1975 to 1990 Dawson (1998) finds a positiveassociation with change in economic freedom The second paper by Aixalaand Fabro (2009) also touches upon the issue only briefly it mainly studies theeffects of economic and political freedom on economic growth Using data on112 countries over 1976 to 2000 it finds that economic freedom Granger-causes
1 See eg Demirguc-Kunt and Maksimovic (1998) who find that firms invest more from externalfunds in physical capital in countries with secure property rights
httpswwwcambridgeorgcoreterms httpsdoiorg101017S174413741600028XDownloaded from httpswwwcambridgeorgcore University of Bath on 30 Apr 2017 at 131945 subject to the Cambridge Core terms of use available at
Economic freedom and human capital investment 423
primary school enrollment The third paper is by King et al (2012) who use dataon 86 developing countries from the period 1989 to 2007 They find returns toboth schooling and work experience to be substantially higher in economicallyfree countries According to their regression results those benefits go to men aswell as women
These three papers take important first steps Using data on more than 100countries we add to this nascent literature in three respects Most importantlyour paper is the first to put the impact of economic freedom on the extent ofhuman capital investment center stage By contrast both Dawson (1998) andAixala and Fabro (2009) deal with the issue only marginally and King et al(2012) study the effect on returns to rather than on the extent of human capitalinvestment Second we control for a much larger number of other determinantsof human capital investment While both Dawson (1998) and Aixala and Fabro(2009) use hardly any controls the number of controls in King et alrsquos (2012)paper is small Our third contribution is that we study the effect of economicfreedom on human capital investment not only among males and females jointlybut also separately for females While neither Dawson (1998) nor Aixala andFabro (2009) do this King et al (2012) who do look at females separatelystudy a slightly different research question
The remainder of the paper is organized as follows While section 2 describesour variables section 3 explains the methodology used Section 4 presents anddiscusses our regression results Section 5 concludes
2 Variables
We use the lsquoEconomic Freedom of the World (EFW)rsquo index (for definitionsdescriptive statistics and sources of all variables see Table A1) It is the mostwidely used index of economic freedom and is generally considered to be the bestbecause it covers all major aspects of economic freedom uses data from reputableexternal sources (such as the World Bank and the IMF) almost exclusively relieson hard data covers a large number of countries and is available since 19702
The EFW index comprises 42 distinct variables that are organized into five areassize of government legal system and property rights sound money freedomto trade internationally and regulation The summary ratings of the index arethe arithmetic means of the area ratings We use these summary ratings ratherthan the area ratings because as explained in the previous section the variouscomponents of economic freedom are interrelated and likely to affect humancapital investment jointly3 The summary ratings used are chain-linked which
2 By contrast the lsquoIndex of Economic Freedomrsquo published by the Heritage Foundation and the WallStreet Journal partly relies on subjective assessments of in-house experts and is available since 1995 only(Miller and Kim 2016)
3 Results from regressions using the area ratings are available upon request
httpswwwcambridgeorgcoreterms httpsdoiorg101017S174413741600028XDownloaded from httpswwwcambridgeorgcore University of Bath on 30 Apr 2017 at 131945 subject to the Cambridge Core terms of use available at
424 HORST FELDMANN
accounts for the fact that the number and composition of the components haschanged over time as the index has become more comprehensive and availabledata more complete The chain-linked ratings are consistent both across countriesand through time
Our main human capital investment variable is the secondary schoolenrollment rate Education is widely regarded as the most important formof human capital investment We use the secondary rather than the primaryenrollment rate because in most countries primary education has beencompulsory for many years In addition to the secondary enrollment rate whichcovers boys and girls jointly we also use the female secondary enrollment rateThis is because the education of girls has traditionally been neglected in manycountries Using the female secondary enrollment rate as an alternative dependentvariable enables us to gauge whether and to what extent economic freedom hasbenefited this demographic group in particular
Although it is common in the literature to use secondary school enrollmentas a proxy for human capital investment (eg Crespo Cuaresma 2010 Fluget al 1998 Papagapitos and Riley 2009) our dependent variables have thedownside of being narrow measures of such investments Apart from secondaryeducation there is primary and tertiary education Furthermore our measurescapture neither training of workers nor investment in health both of whichare important forms of human capital investment too Studying the effects ofeconomic freedom on these types of human capital formation is an importantarea for future research
We include a large number of variables to control for the impact of factorsthat according to the relevant literature are potentially important determinantsof education Our first control is lsquopolitical freedomrsquo which is constructed asthe average of the political rights and civil liberties ratings produced annuallyby Freedom House In one robustness checks we replace lsquopolitical freedomrsquoby lsquodemocracyrsquo4 This index measures the degree of autocracydemocracy andis constructed as part of the Polity IV project We use lsquopolitical freedomrsquoor alternatively lsquodemocracyrsquo for two reasons First to ensure that lsquoeconomicfreedomrsquo does not proxy for either of them And second to check whetherpolitical freedom or democracy exert an influence of their own on human capitalinvestment Indeed several studies find political freedom or democracy to havea positive impact on enrollment rates (eg Eterovic and Sweet 2014 Lake andBaum 2001 Rudra and Haggard 2005) By contrast Glaeser et al (2004) areunable to find any effect of political institutions
We also control for public spending on education Higher spending shouldfoster human capital formation A couple of previous empirical studies do findsuch a positive effect (Castello-Climent and Hidalgo-Cabrillana 2012 Heylen
4 We do not use both variables jointly because they are highly correlated By contrast lsquoeconomicfreedomrsquo is not highly correlated with either of them
httpswwwcambridgeorgcoreterms httpsdoiorg101017S174413741600028XDownloaded from httpswwwcambridgeorgcore University of Bath on 30 Apr 2017 at 131945 subject to the Cambridge Core terms of use available at
Economic freedom and human capital investment 425
and Pozzi 2007) By contrast neither Flug et al (1998) nor Papagapitos andRiley (2009) are able to find a statistically significant effect on the secondaryenrollment rate
We also use several demographic variables For example we include thepopulation growth rate Lower population growth could lead to a highersecondary enrollment rate This is because both parents and societies face atrade-off between child quantity and quality The lower the number of childrenthe more they are usually able to invest into each of them (eg Becker and Lewis1973 Hanushek 1992)
A large theoretical literature argues that improvements in life expectancy ormortality should increase investment in human capital (eg Cervellati and Sunde2005 Kalemli-Ozcan et al 2000 Soares 2005) Indeed many empirical papersfind life expectancy to have a positive effect and mortality including parentaldeath to have a negative effect on schooling (eg Boikos et al 2013 Forston2011 Stoler and Meltzer 2013) Therefore we use both lsquolife expectancyrsquo andlsquodeath ratersquo
Additionally we control for urbanization because access to school is usuallybetter in urban areas than in rural ones Castello-Climent and Hidalgo-Cabrillana (2012) find that a higher urbanization rate is related to higher levelsof secondary education By contrast the relevant coefficient is insignificant inPapagapitos and Rileyrsquos (2009) regressions
We control for all major religions Protestantism Catholicism Islam andEastern religions Protestantism has always stressed the importance of education(eg Becker and Woessmann 2009) The effects of Catholicism in previousempirical studies is mixed (eg Neal 1997 Sherkat 2011) By contrast a largenumber of empirical studies consistently find Islam to have a negative impacton education particularly among females (eg Cooray and Potrafke 2011Feldmann 2016a Norton and Tomal 2009) The effects of Eastern religionshave been little researched so far with inconclusive results (eg Bessey 2013Feldmann 2016a Norton and Tomal 2009) This is despite the fact that two ofthem Buddhism and Confucianism have traditionally highly valued educationIn one robustness check we additionally control for religious pluralism becauseAlesina et al (2003) and Gruber (2005) suggest that it might favorably affecteducation
We also control for relevant economic characteristics For example we includeGDP per capita ndash not only because many previous papers find a positive effect onschooling (eg Mincer 1996) but also to ensure that economic freedom does notproxy for GDP per capita given that most richer countries have more economicfreedom5 Furthermore we control for GDP growth because results for the USsuggest that schooling is countercyclical (eg Mendez and Sepulveda 2012)
5 Although GDP per capita is positively correlated with economic freedom the size of the correlationis moderate
httpswwwcambridgeorgcoreterms httpsdoiorg101017S174413741600028XDownloaded from httpswwwcambridgeorgcore University of Bath on 30 Apr 2017 at 131945 subject to the Cambridge Core terms of use available at
426 HORST FELDMANN
Additionally we use lsquoprivate creditrsquo as a proxy for borrowing constraintsDe Gregorio (1996) among others theoretically argues and empirically showsthat such constraints can have a negative effect on the secondary enrollmentrate We also include lsquophysical capital stockrsquo and in one robustness checklsquophysical investmentrsquo The intention here is to capture the complementarityor substitutability of physical and human capital similar to Griliches (1969)Furthermore we control for trade openness because several theoretical papersargue that it might affect human capital accumulation either positively ornegatively (eg Ranjan 2001)
In one robustness check we additionally control for income inequalityAccording to the relevant theoretical papers the effect of income inequalitycan also be either positive or negative depending on the circumstances (egChiu 1998 Grossmann 2008) The results from previous empirical researchare mixed (eg Flug et al 1998 Papagapitos and Riley 2009) In our final fourrobustness checks we additionally control for economic instability and differenttypes of crises As several papers show theoretically andor empirically theytoo can positively or negatively affect investment in human capital (eg CrespoCuaresma 2010 Heylen and Pozzi 2007 Skidmore and Toya 2002)
3 Sample and methodology
Our sample covers 109 countries over the period from 1972 to 2011 (for a listof countries see Appendix B) With respect to both countries and years the sizeof our sample is determined by data availability only Using data from as large asample as possible leads to the most general results
We constructed our dataset in three steps First we collected panel data atannual frequency covering as many countries and years as possible In a secondstep we filled gaps in the data Specifically because prior to 2000 the EFW indexis available at 5-year intervals only we filled the gaps by linear interpolationThis is justifiable because the EFW ratings usually change only gradually overtime For our other variables we also filled any gaps in the data by linearinterpolation As in the case of lsquoeconomic freedomrsquo the data for most of thesevariables ndash eg the enrollment and the religion variables ndash also change onlygradually over time Those that display swings from year to year such as theGDP growth rate did not have any gaps at all In the third step of constructingour dataset we averaged the annual data over non-overlapping 5-year periodsThis eliminates noise reduces measurement error and because in our regressionswe lag our explanatory variables by one period (see below) makes it more likelythat our estimates capture the effect of economic freedom on human capitalinvestment
There is substantial variation in both the economic freedom measure and thetwo enrollment variables Specifically on a 0-to-1 scale lsquoeconomic freedomrsquoranges from 029 to 086 (Table A1) The secondary enrollment rate ranges
httpswwwcambridgeorgcoreterms httpsdoiorg101017S174413741600028XDownloaded from httpswwwcambridgeorgcore University of Bath on 30 Apr 2017 at 131945 subject to the Cambridge Core terms of use available at
Economic freedom and human capital investment 427
Figure 1 Economic freedom and secondary enrollment rate
ALAR
AT
AU
BB
BD
BE
BG BH
BI
BJ
BO
BS
BW
BZ
CA
CD
CF
CG
CH
CICM
CN
CO CR
CY
CZDE
DK
DOEC
EE
EG
ES
FI
FJ
FR
GA
GB
GH
GR
GT
GW
HN
HRHU
ID
IE
IL
IN
IR
IS
ITJM
JO
JP
KE
KRKW
LK
LT
LU
LV
MA
MGML
MT
MU
MW
MX MYNA
NE
NG
NLNO
NP
NZ
OMPA
PE PH
PK
PL
PT
PY
RO RU
RW
SE
SISK
SN
SVSY
TD
TG
THTN
TR
TT
TZ
UA
UG
USUYZA
ZMZW
050
100
150
Sec
onda
ry e
nrol
lmen
t rat
e (
)
04 05 06 07 08Economic freedom (0-1)
Notes 109 countries Data from the period 1972 to 2011 The regression represented by the fittedline yields a coefficient on lsquoeconomic freedomrsquo of 23102 (robust standard error = 2024) N = 109R2 = 051
from 34 to 1548 while the female secondary enrollment rate ranges from23 to 1674 For all three measures the variation is not only large betweencountries (Figures 1 and 2) it is also large (though slightly smaller) within themSpecifically the within-panel variation ranges from 041 to 084 for lsquoeconomicfreedomrsquo from 383 to 1106 for the secondary enrollment rate and from371 to 1206 for the female secondary enrollment rate
We estimate the following model
Sit = γEitminus1 +qsum
k=1
βkXkitminus1 + αi + λt + εit (1)
Sit is a secondary enrollment rate variable of country i in 5-year period t eithercovering both genders jointly or girls only Eit-1 denotes the lsquoeconomic freedomrsquovariable and Xkit-1 represents a vector of q control variables While αi and λt
are country and period fixed effects respectively εit is the error term Countryfixed effects are included to control for the impact of unobserved country-specificcharacteristics They are also useful in removing omitted factors that influenceboth secondary enrollment and economic freedom in the long run Period fixedeffects are included to control for the impact of shocks that are common acrosscountries Additionally they ensure that our estimates do not reflect over-time
httpswwwcambridgeorgcoreterms httpsdoiorg101017S174413741600028XDownloaded from httpswwwcambridgeorgcore University of Bath on 30 Apr 2017 at 131945 subject to the Cambridge Core terms of use available at
428 HORST FELDMANN
Figure 2 Economic freedom and female secondary enrollment rate
ALAR
AT
AU
BB
BD
BE
BG BH
BI
BJ
BO
BS
BW
BZ
CA
CD
CF
CG
CH
CI
CM
CN
CO CR
CY
CZDE
DK
DO
EC
EE
EG
ES
FI
FJ
FR
GA
GB
GH
GR
GT
HN
HRHU
ID
IE
IL
IN
IR
IS
ITJMJO
JP
KE
KRKW
LK
LT
LU
LV
MA
MG
ML
MT
MU
MW
MX MYNA
NE
NG
NLNO
NP
NZ
OMPAPE
PH
PK
PL
PT
PY
RO RU
RW
SE
SISK
SN
SVSY
TD
TG
THTN
TR
TT
TZ
UA
UG
USUYZA
ZMZW
050
100
150
Fem
ale
seco
ndar
y en
rollm
ent r
ate
()
04 05 06 07 08Economic freedom (0-1)
Notes 108 countries Data from the period 1972 to 2011 The regression represented by the fittedline yields a coefficient on lsquoeconomic freedomrsquo of 25169 (robust standard error = 2220) N = 108R2 = 052
trends in secondary enrollment or economic freedom at the world level over thesample period More generally by using both country and period fixed effectsplus a large number of control variables we intend to ensure that our regressionanalysis accounts for other factors than economic freedom that affect secondaryenrollment some of which may be correlated with economic freedom
If applicable a random effects estimator would be more efficient because itexploits both the cross-country and the time-series variation included in thesample By contrast fixed effects models only use the time-series variationHowever we cannot use a random effects estimator here because the results fromthe Hausman (1978) test indicate that in most cases such an estimator yieldsbiased estimates (results not reported here) In any case fixed effects regressionsare likely to provide more convincing and relevant conditional correlations asthey focus on whether enrollment rates changed following changes in economicfreedom
Causality may not only run from economic freedom to education but also viceversa As people become more educated they may well demand more economicfreedom This reasoning is akin to Lipset (1960) who believed that educatedpeople are more likely to resolve their differences through courts negotiationsand voting rather than through violence They would thus build lsquogoodrsquo legal andpolitical institutions However whereas there is considerable empirical support
httpswwwcambridgeorgcoreterms httpsdoiorg101017S174413741600028XDownloaded from httpswwwcambridgeorgcore University of Bath on 30 Apr 2017 at 131945 subject to the Cambridge Core terms of use available at
Economic freedom and human capital investment 429
for Lipsetrsquos hypothesis (eg Barro 1999) only one empirical study indicates thateducation might cause economic freedom Specifically Aixala and Fabro (2009)find bidirectional Granger causality between economic freedom and primaryschool enrollment In their data not only does economic freedom Granger-causeprimary school enrollment but also vice versa As mentioned in section 1 theyuse hardly any controls though
In any case endogeneity of lsquoeconomic freedomrsquo cannot be ruled out Someor all of our control variables may be endogenous too Unfortunately thereare no valid instruments For example we tried GMM However the resultsfrom the Hansen (1982) test of overidentifying restrictions produced highp values throughout suggesting that GMM would be inappropriate in ourcase The problem is probably one of instrument proliferation ie the factthat the number of instruments in GMM tends to explode with the numberof time periods Instrument proliferation can overfit endogenous variablesand fail to expunge their endogenous components a telltale sign being highHansen test p values (Roodman 2009a 2009b) We experimented with variousways of reducing the instrument count such as limiting the lags in GMM-style instruments and collapsing instruments but none of them solved theproblem
We also tried two stage least squares (2SLS) estimation As instruments foreconomic freedom we used variables that have been suggested (for economicfreedom or something similar) in the previous literature Specifically in thisexercise we used the variables lsquoEnglish languagersquo lsquoWestern European languagesrsquo(defined as fraction of the population speaking one of these languages as a mothertongue) and legal origins (Hall and Jones 1999 La Porta et al 1999) Fariaand Montesinos (2009) who focus on instrumenting for economic freedomadditionally use ethnolinguistic fractionalization latitude and European settlermortality We used neither of these three variables According to other researchboth ethnic fractionalization and latitude have a direct effect on education(Alesina et al 2003 Feldmann 2016b) Data on European settler mortalityare available for comparatively few countries (Acemoglu et al 2001) Thesame is true for lsquopronoun droprsquo yet another potential instrument (Davis andAbdurazokzoda 2016) As the language and legal origins data we used aretime-invariant (as are the other potential instruments mentioned) we employedcross-country rather than panel data in our 2SLS exercise To calculate countryaverages we selected only data from years for which EFW data are availableAs part of the exercise we performed various tests of instrument validitySpecifically to test for underidentification we used the Kleibergen and Paap(2006) rk LM test To test for instrument relevance we calculated Shearsquos (1997)partial R2 statistic and performed an F test of excluded instruments (Staigerand Stock 1997) Finally we applied Hansenrsquos (1982) test of overidentifyingrestrictions These tests revealed that the instruments are weak and in mostcases not exogenous Thus they are invalid Furthermore the instruments we
httpswwwcambridgeorgcoreterms httpsdoiorg101017S174413741600028XDownloaded from httpswwwcambridgeorgcore University of Bath on 30 Apr 2017 at 131945 subject to the Cambridge Core terms of use available at
430 HORST FELDMANN
tried as well as the other potential instruments mentioned above have twoconceptual problems First they are not specific enough to economic freedomExcluded instruments need to be specific to the instrumented variable (Acemoglu2005) Second previous studies have used them as instruments for various othervariables6 A variable can be a valid instrument in at most one such study (Bazziand Clemens 2013)
Using our panel dataset we also tried Hausman and Taylorrsquos (1981)instrumental variables estimator However the resulting estimates do not passthe Hausman (1978) test suggesting that they are biased and the instrumentsinvalid As instrumental variable estimation is not applicable we lag allexplanatory variables by one period It is very well possible that current economicfreedom affects secondary school enrollment in the following 5-year period Bycontrast it is hard to imagine future enrollment to affect current freedom Thususing a lag increases the likelihood that our estimates reflect the influence ofeconomic freedom on secondary enrollment rather than the other way aroundThe same considerations apply to our control variables
To further examine the possibility of reverse causality we run additionalregressions in which we swap the respective enrollment variable and our variableof interest Thus in these regressions we use lsquoeconomic freedomrsquo as dependentvariable and the respective enrollment variable lagged by one period as anexplanatory variable The control variables also lagged by one period andthe estimation method are the same as in the respective regressions to explainthe secondary (or female secondary) enrollment rate The p values of thecoefficients on the enrollment variables from this reverse causality test arereported in Table 1 As they indicate the coefficients are statistically insignificantthroughout This test therefore does not provide any evidence of causalityrunning from secondary schooling to economic freedom
Although there is no evidence of reverse causality the regressions presentedin Table 1 do not prove that causality runs from economic freedom tosecondary schooling because there are no valid instruments to addresspotential endogeneity Instead these regressions are used to measure conditionalcorrelations ie to assess whether lsquoeconomic freedomrsquo is statistically significantafter controlling for other relevant factors Still the estimates for our variableof interest are likely to be causal for five reasons First we control for mostmajor determinants of school enrollment that have been found in the previousliterature Second we also control for unobserved country and period effectsThird we ensure that lsquoeconomic freedomrsquo does not proxy for factors such aspolitical freedom or GDP per capita Fourth all explanatory variables enter the
6 For example while the language variables we used have previously been employed as instruments forlsquosocial infrastructurersquo (Hall and Jones 1999) legal origins have previously been employed as instrumentsfor a host of institutions and policy outcomes (Bazzi and Clemens 2013)
httpswwwcambridgeorgcoreterms httpsdoiorg101017S174413741600028XDownloaded from httpswwwcambridgeorgcore University of Bath on 30 Apr 2017 at 131945 subject to the Cambridge Core terms of use available at
Econom
icfreedom
andhum
ancapitalinvestm
ent431
Table 1 Fixed effects regressions of secondary school enrollment
(1) (2) (3) (4) (5) (6) (7) (8) (9)Democracy Religious Physical Income Inflation Systemic Natural
Baseline substituted for pluralism investment inequality rate banking crises disasters Warsspecification political freedom added added added added added added added
Panel A Dependent variable secondary enrollment rateEconomic freedom 3348lowastlowast 3174lowastlowast 3420lowastlowastlowast 3189lowastlowast 3798lowastlowastlowast 3384lowastlowast 3350lowastlowast 3371lowastlowastlowast 3302lowastlowast
(1275) (1295) (1292) (1218) (1292) (1290) (1278) (1269) (1281)Political freedom minus 275 minus 269 minus 271 minus 307 minus 278 minus 274 minus 299 minus 292
(333) (331) (334) (374) (333) (333) (335) (335)Public spending on education minus 1076 minus 907 minus 1416 minus 1233 minus 583 minus 1074 minus 1088 minus 1103 minus 1133
(2914) (2912) (3101) (2998) (3306) (2926) (2930) (2927) (2923)Population growth rate minus 1923 minus 2821 minus 1665 minus 2044 3197 minus 1990 minus 1923 minus 1511 minus 1692
(7131) (7121) (7224) (7261) (7626) (7134) (7137) (7289) (7189)Life expectancy 068 070 066 067 056 067 068 069 067
(053) (055) (053) (053) (058) (053) (053) (055) (053)Death rate 125lowast 127 126lowast 129lowast 123 125lowast 125lowast 128lowast 125lowast
(074) (077) (074) (075) (078) (074) (074) (077) (074)Urbanization rate 3470 3027 3359 3289 3130 3482 3472 3563 3439
(2300) (2473) (2278) (2332) (2393) (2300) (2299) (2272) (2305)Protestant population 136 339 minus 1031 072 338 129 126 128 138
(1790) (1856) (2076) (1760) (1823) (1788) (1783) (1806) (1793)Roman Catholic population minus 210 minus 090 minus 1216 minus 236 333 minus 258 minus 205 minus 248 minus 163
(2005) (2026) (2163) (1985) (2145) (2016) (2019) (2007) (2005)Muslim population minus 6704lowastlowast minus 6872lowastlowast minus 6901lowastlowast minus 6700lowastlowast minus 4856 minus 6691lowastlowast minus 6720lowastlowast minus 6737lowastlowast minus 6734lowastlowast
(3112) (3094) (3165) (3166) (3737) (3116) (3128) (3098) (3102)Eastern religions population 2155 2546 1503 2152 1057 2129 2166 2006 2088
(4690) (4487) (4753) (4653) (5626) (4688) (4694) (4731) (4717)GDP per capita minus 155 minus 145 minus 138 minus 149 minus 454 minus 156 minus 153 minus 154 minus 163
(268) (270) (262) (267) (304) (268) (268) (268) (268)
httpsww
wcam
bridgeorgcoreterms httpsdoiorg101017S174413741600028X
Dow
nloaded from httpsw
ww
cambridgeorgcore U
niversity of Bath on 30 Apr 2017 at 131945 subject to the Cambridge Core term
s of use available at
432H
OR
ST
FE
LD
MA
NN
Table 1 (Continued)
(1) (2) (3) (4) (5) (6) (7) (8) (9)Democracy Religious Physical Income Inflation Systemic Natural
Baseline substituted for pluralism investment inequality rate banking crises disasters Warsspecification political freedom added added added added added added added
GDP growth rate 125 306 081 minus 202 minus 2130 204 170 111 105(1702) (1732) (1754) (1804) (1745) (1701) (1749) (1716) (1692)
Private credit minus 034 090 minus 003 minus 058 minus 090 minus 033 minus 037 minus 040 minus 037(356) (383) (361) (363) (379) (357) (354) (354) (355)
Physical capital stock minus 107lowastlowast minus 116lowastlowast minus 113lowastlowast minus 108lowastlowast minus 093lowastlowast minus 106lowastlowast minus 107lowastlowast minus 107lowastlowast minus 107lowastlowast
(044) (045) (045) (043) (044) (044) (044) (044) (044)Openness minus 249 minus 290 minus 246 minus 343 080 minus 250 minus 251 minus 241 minus 236
(455) (474) (452) (467) (505) (455) (456) (457) (455)Democracy 018
(290)Religious pluralism minus 1321
(1675)Physical investment 1154
(1183)Income inequality 1133
(977)Inflation rate 004
(005)Systemic banking crises 025
(215)Natural disasters 911
(1869)Wars minus 635lowast
(345)Number of observations 540 520 540 539 486 539 540 540 540Number of countries 109 104 109 108 106 109 109 109 109
httpsww
wcam
bridgeorgcoreterms httpsdoiorg101017S174413741600028X
Dow
nloaded from httpsw
ww
cambridgeorgcore U
niversity of Bath on 30 Apr 2017 at 131945 subject to the Cambridge Core term
s of use available at
Econom
icfreedom
andhum
ancapitalinvestm
ent433
Table 1 (Continued)
(1) (2) (3) (4) (5) (6) (7) (8) (9)Democracy Religious Physical Income Inflation Systemic Natural
Baseline substituted for pluralism investment inequality rate banking crises disasters Warsspecification political freedom added added added added added added added
R2 within 065 065 065 065 067 065 065 065 065F statistic 2517lowastlowastlowast 2528lowastlowastlowast 2291lowastlowastlowast 2562lowastlowastlowast 2355lowastlowastlowast 2321lowastlowastlowast 2486lowastlowastlowast 2459lowastlowastlowast 2402lowastlowastlowast
Standard error of regression 651 660 651 651 636 652 652 651 651Reverse causality testa 024 028 023 025 012 024 024 023 023
Panel B Dependent variable female secondary enrollment rateEconomic freedom 2672lowastlowast 2536lowastlowast 2730lowastlowast 2488lowastlowast 3164lowastlowast 2722lowastlowast 2675lowastlowast 2699lowastlowast 2618lowastlowast
(1196) (1221) (1211) (1149) (1205) (1208) (1198) (1192) (1204)Control variablesb Yes Yes Yes Yes Yes Yes Yes Yes YesNumber of observations 533 513 533 532 480 532 533 533 533Number of countries 108 103 108 107 105 108 108 108 108R2 within 065 065 065 065 066 065 065 065 065F statistic 2313lowastlowastlowast 2315lowastlowastlowast 2175lowastlowastlowast 2260lowastlowastlowast 2110lowastlowastlowast 2128lowastlowastlowast 2247lowastlowastlowast 2289lowastlowastlowast 2209lowastlowastlowast
Standard error of regression 689 698 689 689 682 690 689 689 689Reverse causality testa 022 027 022 023 016 022 022 022 022
Notes Pooled least squares regressions with country-specific fixed effects The data are non-overlapping 5-year averages spanning 1972 to 2011 All explanatoryvariables are lagged by one 5-year period All regressions also contain period dummies and a constant term Robust standard errors adjusted for clustering at thecountry level are reported in parentheses lowastlowastlowast(lowastlowastlowast) denotes statistically significant at the 1(510) levelap value of coefficient on the respective enrollment variable from a regression in which the dependent variable and the variable of interest are swapped ielsquoeconomic freedomrsquo is used as dependent variable and the respective enrollment variable lagged by one 5-year period as an explanatory variable In each of thesetests the control variables lagged by one 5-year period and the estimation method are the same as in the corresponding regression presented in the same columnin panel AbEach regression of lsquofemale secondary enrollment ratersquo uses the same control variables as the regression of lsquosecondary enrollment ratersquo presented in the samecolumn in panel A For brevity the estimates for the control variables from the former regressions are omitted
httpsww
wcam
bridgeorgcoreterms httpsdoiorg101017S174413741600028X
Dow
nloaded from httpsw
ww
cambridgeorgcore U
niversity of Bath on 30 Apr 2017 at 131945 subject to the Cambridge Core term
s of use available at
434 HORST FELDMANN
equation with a lag of one 5-year period Fifth our reverse causality test doesnot provide any evidence of causality running in the opposite direction
4 Results
Before we discuss the results from our multivariate regressions let us brieflytake a look at the bivariate associations between lsquoeconomic freedomrsquo on theone hand and the two enrollment variables on the other (Figures 1 and 2)Both figures use country averages and show a positive relationship By and largeover the sample period countries that enjoyed more economic freedom had ahigher secondary enrollment rate both among boys and girls combined as wellas among girls only
Table 1 reports the results from our multivariate regressions While column1 presents the results from our baseline specification columns 2 to 9 present theresults from our robustness checks While panel A reports the results from theregressions to explain the secondary enrollment rate panel B reports the resultsfrom the regressions to explain the female secondary enrollment rate To savespace panel B presents only the estimates for the lsquoeconomic freedomrsquo variableand the test statistic the estimates for the control variables are omitted Eachregression to explain the female secondary enrollment rate uses the same controlvariables as the corresponding regression to explain the secondary enrollmentrate presented in the same column of panel A
In each regression the coefficient on lsquoeconomic freedomrsquo is positive andstatistically significant suggesting that over the sample period economicfreedom probably had a favorable effect on both the secondary and the femalesecondary enrollment rate In most robustness checks the size of the coefficientis similar to the estimate from the respective baseline regression7
According to our regression results the effect of economic freedom onsecondary schooling is likely to have been substantial Turkey is a case in pointOn the 0-to-1 scale its EFW score increased from 0378 on average over the years1972ndash76 to 0654 on average over the years 2007ndash11 Over the same periodTurkeyrsquos secondary school enrollment rose substantially both among boys andgirls combined as well as among girls only Specifically while the secondaryenrollment rate increased from 298 on average over 1972ndash76 to 863 onaverage over 2009ndash11 the female secondary enrollment rate rose from 178 to814 Our estimates suggest that Turkeyrsquos increase in economic freedom mighthave caused its secondary enrollment rate to rise by 92 percentage points and itsfemale secondary enrollment rate by 74 percentage points ceteris paribus These
7 In an additional robustness check we excluded from the sample three randomly drawn countries ata time and re-run both baseline regressions at each step We repeated this exercise until each country hadbeen excluded once This test did not materially affect the estimate for lsquoeconomic freedomrsquo either (resultsnot reported here)
httpswwwcambridgeorgcoreterms httpsdoiorg101017S174413741600028XDownloaded from httpswwwcambridgeorgcore University of Bath on 30 Apr 2017 at 131945 subject to the Cambridge Core terms of use available at
Economic freedom and human capital investment 435
figures have been calculated using the estimates from the baseline regressionspresented in column 1 of Table 1 Of course they should be taken with a grainof salt Still they illustrate that the magnitude of the effect is likely to have beensubstantial
Our regression results corroborate the hypothesis that economic freedom islikely to favorably affect human capital investment As explained in section 1economic freedom probably stimulates investment in human capital because itboth increases the payoffs from these investments and enables people to keep alarger share of them Additionally by facilitating the operation of credit marketseconomic freedom is likely to make it easier for people to undertake suchinvestments As also explained in section 1 in its positive effect on human capitalinvestment the various dimensions of economic freedom ndash secure property rightsmodest taxation monetary stability open markets and light regulation ndash arelikely to complement each other
Our results are in line with the three previous relevant papers (section 1) Inparticular they accord with Dawson (1998) who finds that change in economicfreedom has a positive effect on the secondary enrollment rate Our paper alsoaccords with Aixala and Fabro (2009) who report that economic freedomGranger-causes primary school enrollment And finally our results are in linewith King et alrsquos (2012) who find that returns to human capital investmentare higher in economically free countries Although our results accord with thesestudies our paper adds to this literature in several respects ndash most importantly byusing a much larger number of controls and by estimating the effect of economicfreedom on human capital formation not only among males and females jointlybut also separately for females
Finally a brief comment on the estimates for the control variables (Table 1)Interestingly few of them are statistically significant One of the most robustresults among the controls is that during our sample period a larger share ofMuslims in the population was associated with a lower secondary enrollmentrate This is in line with the previous literature (section 2) Another robust findingis that a larger physical capital stock is negatively correlated with the secondaryenrollment rate suggesting that investment in human capital might have beenprimarily a substitute for rather than a complement to physical capital Thisinterpretation is tentative though not least because the coefficient on lsquophysicalinvestmentrsquo is insignificant Furthermore we find some albeit weak evidencethat wars might have had a negative impact on secondary schooling lendingsupport to some of the papers on the link between crises and human capitalaccumulation The insignificant results for some of the other variables are also inline with some of the previous literature For example various previous papersfind political freedom public spending on education and urbanization to have nosignificant effect on the secondary enrollment rate (section 2) In addition to thesepapers we find several other demographic religious and economic variables tohave no significant effect either However what is decisive here is that including
httpswwwcambridgeorgcoreterms httpsdoiorg101017S174413741600028XDownloaded from httpswwwcambridgeorgcore University of Bath on 30 Apr 2017 at 131945 subject to the Cambridge Core terms of use available at
436 HORST FELDMANN
any of those variables does not alter our main result ndash namely that over theperiod 1972 to 2011 economic freedom was positively correlated with humancapital investment
5 Conclusion
There is a large literature studying which factors foster investment in humancapital Our paper contributes to this literature by analyzing a factor that so farhas been almost completely overlooked ndash economic freedom As explained insection 1 the reasoning as to why economic freedom is likely to be an importantdeterminant of human capital investment is similar to the case of investmentin physical capital For both types of capital more economic freedom increasesthe return on investing in it lets investors keep a larger share of the return andmakes it easier for them to undertake such investments in the first place Inthis paper we report robust evidence that economic freedom is indeed likelyto have increased human capital investment over the period 1972 to 2011 Themagnitude of the estimated effect is substantial Our regressions control for allother major determinants of human capital investment
As mentioned in section 3 the evidence provided in this paper corresponds toconditional correlations in the data It does not establish causality Still the factthat more economic freedom is consistently correlated with higher human capitalinvestment in the following 5-year period even after controlling for a myriad offactors and the fact that there is no such reverse association is intriguing andsuggests that the effect is likely to be causal
Although our regressions control for many factors and the results are robustmore research is needed Most importantly the endogeneity issue needs tobe tackled in a better way so that the causal effect of economic freedom onhuman capital investment can be identified more convincingly8 Furthermorethe transmission channels from economic freedom to human capital investmentneed to be studied in more in detail both theoretically and empirically Forexample how does an increase in economic freedom affect parentsrsquo decisionsabout their childrenrsquos education Additionally the effect of economic freedomon other forms of human capital accumulation need to be studied as well Forexample does an increase in economic freedom induce firms to improve thetraining of their workforce As education and training are essential for economicdevelopment a better understanding of the role played by economic freedom isan important issue for future research
8 One way to establish the causal effect of economic freedom on human capital investment might beto perform comparative case studies using the Synthetic Control Method (Abadie et al 2010 2015) Thismethod would be applicable in cases where an individual country has implemented a substantial changein economic freedom Using this method subsequent human capital investment in the reformer countrycould be compared with a weighted average set of similar countries ndash the synthetic control group Such acontrol group could constitute a good counterfactual enabling causal inference
httpswwwcambridgeorgcoreterms httpsdoiorg101017S174413741600028XDownloaded from httpswwwcambridgeorgcore University of Bath on 30 Apr 2017 at 131945 subject to the Cambridge Core terms of use available at
Economic freedom and human capital investment 437
References
Abadie A A Diamond and J Hainmueller (2010) lsquoSynthetic Control Methods forComparative Case Studies Estimating the Effect of Californiarsquos Tobacco ControlProgramrsquo Journal of the American Statistical Association 105(490) 493ndash505
Abadie A A Diamond and J Hainmueller (2015) lsquoComparative Politics and the SyntheticControl Methodrsquo American Journal of Political Science 59(2) 495ndash510
Acemoglu D (2005) lsquoConstitutions Politics and Economics A Review Essay on Persson andTabellinirsquos The Economic Effects of Constitutionsrsquo Journal of Economic Literature43(4) 1025ndash1048
Acemoglu D S Johnson and J A Robinson (2001) lsquoThe Colonial Origins of ComparativeDevelopment An Empirical Investigationrsquo American Economic Review 91(5) 1369ndash1401
Aixala J and G Fabro (2009) lsquoEconomic Freedom Civil Liberties Political Rights andGrowth A Causality Analysisrsquo Spanish Economic Review 11(3) 165ndash178
Alesina A A Devleeschauwer W Easterly S Kurlat and R Wacziarg (2003)lsquoFractionalizationrsquo Journal of Economic Growth 8(2) 155ndash194
Barro R J (1999) lsquoDeterminants of Democracyrsquo Journal of Political Economy 107(6 2)S158ndashS183
Bazzi S and M A Clemens (2013) lsquoBlunt Instruments Avoiding Common Pitfallsin Identifying the Causes of Economic Growthrsquo American Economic JournalMacroeconomics 5(2) 152ndash186
Becker G S and H G Lewis (1973) lsquoOn the Interaction between the Quantity and Qualityof Childrenrsquo Journal of Political Economy 81(2 2) S279ndashS288
Becker S O and L Woessmann (2009) lsquoWas Weber Wrong A Human Capital Theory ofProtestant Economic Historyrsquo Quarterly Journal of Economics 124(2) 531ndash596
Besley T (1995) lsquoProperty Rights and Investment Incentives Theory and Evidence fromGhanarsquo Journal of Political Economy 103(5) 903ndash937
Bessey D (2013) lsquoReligion and Educational Attainment in East Asia First Evidence from theEast Asian Social Surveyrsquo Global Economic Review 42(3) 238ndash250
Boikos S A Bucci and T Stengos (2013) lsquoNon-Monotonicity of Fertility in Human CapitalAccumulation and Economic Growthrsquo Journal of Macroeconomics 38(A) 44ndash59
Burton-Jones A and J-C Spender (eds) (2011) The Oxford Handbook of Human CapitalOxford Oxford University Press
Castello-Climent A and A Hidalgo-Cabrillana (2012) lsquoThe Role of Educational Quality andQuantity in the Process of Economic Developmentrsquo Economics of Education Review31(4) 391ndash409
Centre for Research on the Epidemiology of Disasters - CRED (2014) lsquoInternational DisastersDatabase (EM-DAT)rsquo httpwwwemdatbe (accessed 20 June 2014)
Cervellati M and U Sunde (2005) lsquoHuman Capital Formation Life Expectancy and theProcess of Developmentrsquo American Economic Review 95(5) 1653ndash1672
Chiu W H (1998) lsquoIncome Inequality Human Capital Accumulation and EconomicPerformancersquo Economic Journal 108(446) 44ndash59
Cooray A and N Potrafke (2011) lsquoGender Inequality in Education Political Institutions orCulture and Religionrsquo European Journal of Political Economy 27(2) 268ndash280
Crespo Cuaresma J (2010) lsquoNatural Disasters and Human Capital Accumulationrsquo WorldBank Economic Review 24(2) 280ndash302
Davis L S and F Abdurazokzoda (2016) lsquoLanguage Culture and Institutions Evidencefrom a New Linguistic Datasetrsquo Journal of Comparative Economics 44(3) 541ndash561
httpswwwcambridgeorgcoreterms httpsdoiorg101017S174413741600028XDownloaded from httpswwwcambridgeorgcore University of Bath on 30 Apr 2017 at 131945 subject to the Cambridge Core terms of use available at
438 HORST FELDMANN
Dawson J W (1998) lsquoInstitutions Investment and Growth New Cross-Country and PanelData Evidencersquo Economic Inquiry 36(4) 603ndash619
De Gregorio J (1996) lsquoBorrowing Constraints Human Capital Accumulation and GrowthrsquoJournal of Monetary Economics 37(1) 49ndash71
Demirguc-Kunt A and V Maksimovic (1998) lsquoLaw Finance and Firm Growthrsquo Journal ofFinance 53(6) 2107ndash2137
Eterovic D S and C M Sweet (2014) lsquoDemocracy and Education in Twentieth-CenturyLatin Americarsquo Economics and Politics 26(2) 237ndash262
Faria H J and H M Montesinos (2009) lsquoDoes Economic Freedom Cause Prosperity AnIV Approachrsquo Public Choice 141(1ndash2) 103ndash127
Feenstra R C R Inklaar and M P Timmer (2013) lsquoPenn World Table 80rsquohttpwwwrugnlresearchggdcdatapenn-world-table (accessed 23 July 2013)
Feldmann H (2016a) lsquoWhich Religions Still Affect Schooling A Study of 143 CountriesrsquoComparative Sociology 15(4) 439ndash484
Feldmann H (2016b) lsquoThe Long Shadows of Spanish and French Colonial EducationrsquoKyklos 69(1) 32ndash64
Flug K A Spilimbergo and E Wachtenheim (1998) lsquoInvestment in Education Do EconomicVolatility and Credit Constraints Matterrsquo Journal of Development Economics 55(2)465ndash481
Forston J G (2011) lsquoMortality Risk and Human Capital Investment The Impact ofHIVAIDS in Sub-Saharan Africarsquo Review of Economics and Statistics 93(1)1ndash15
Freedom House (2014) Freedom in the World 2014 httpsfreedomhouseorg (accessed 20April 2014)
Glaeser E L R La Porta F Lopez-de-Silanes and A Shleifer (2004) lsquoDo Institutions CauseGrowthrsquo Journal of Economic Growth 9(3) 271ndash303
Griliches Z (1969) lsquoCapital-Skill Complementarityrsquo Review of Economics and Statistics51(4) 465ndash468
Grossmann V (2008) lsquoRisky Human Capital Investment Income Distribution andMacroeconomic Dynamicsrsquo Journal of Macroeconomics 30(1) 19ndash42
Gruber J H (2005) lsquoReligious Market Structure Religious Participation and Outcomes IsReligion Good for Yoursquo Advances in Economic Analysis and Policy 5(1) 1ndash30
Gwartney J D R A Lawson and J C Hall (2013) Economic Freedom of the World 2013Annual Report Vancouver BC Fraser Institute
Hall J C and R A Lawson (2014) lsquoEconomic Freedom of the World An Accounting of theLiteraturersquo Contemporary Economic Policy 32(1) 1ndash19
Hall R E and C I Jones (1999) lsquoWhy Do Some Countries Produce So Much More Outputper Worker than Othersrsquo Quarterly Journal of Economics 114(1) 83ndash116
Hansen L P (1982) lsquoLarge Sample Properties of Generalized Method of MomentsEstimatorsrsquo Econometrica 50(4) 1029ndash1054
Hanushek E A (1992) lsquoThe Trade-off between Child Quantity and Qualityrsquo Journal ofPolitical Economy 100(1) 84ndash117
Hausman J A (1978) lsquoSpecification Tests in Econometricsrsquo Econometrica 46(6) 1251ndash1271
Hausman J A and W E Taylor (1981) lsquoPanel Data and Unobservable Individual EffectsrsquoEconometrica 49(6) 1377ndash1398
Heylen F and L Pozzi (2007) lsquoCrises and Human Capital Accumulationrsquo Canadian Journalof Economics 40(4) 1261ndash1285
httpswwwcambridgeorgcoreterms httpsdoiorg101017S174413741600028XDownloaded from httpswwwcambridgeorgcore University of Bath on 30 Apr 2017 at 131945 subject to the Cambridge Core terms of use available at
Economic freedom and human capital investment 439
IMF (2014) lsquoWorld Economic Outlook Database April 2014 Editionrsquo httpwwwimforg(accessed 9 May 2014)
Kalemli-Ozcan S H E Ryder and D N Weil (2000) lsquoMortality Decline Human CapitalInvestment and Economic Growthrsquo Journal of Development Economics 62(1) 1ndash23
King E M C E Montenegro and P F Orazem (2012) lsquoEconomic Freedom Human Rightsand the Returns to Human Capital An Evaluation of the Schultz Hypothesisrsquo EconomicDevelopment and Cultural Change 61(1) 39ndash72
Kleibergen F and R Paap (2006) lsquoGeneralized Reduced Rank Tests Using the Singular ValueDecompositionrsquo Journal of Econometrics 133(1) 97ndash126
Laeven L and F Valencia (2013) lsquoSystemic Banking Crises Databasersquo IMF EconomicReview 61(2) 225ndash270
Lake D A and M A Baum (2001) lsquoThe Invisible Hand of Democracy Political Controland the Provision of Public Servicesrsquo Comparative Political Studies 34(6) 587ndash621
La Porta R F Lopez-de-Silanes A Shleifer and R Vishny (1999) lsquoThe Quality ofGovernmentrsquo Journal of Law Economics and Organization 15(1) 222ndash279
Lipset S M (1960) Political Man The Social Bases of Politics Garden City NY DoubledayMaoz Z and E A Henderson (2013) lsquoThe World Religion Dataset Version 11rsquo
httpwwwcorrelatesofwarorg (accessed 11 February 2014)Marshall M G T R Gurr and K Jaggers (2014) lsquoPolity IV Project Political Regime Char-
acteristics and Transitions 1800-2013 Version 2013rsquo httpwwwsystemicpeaceorg(accessed 4 June 2014)
Mendez F and F Sepulveda (2012) lsquoThe Cyclicality of Skill Acquisition Evidence from PanelDatarsquo American Economic Journal Macroeconomics 4(3) 128ndash152
Miller T and A B Kim (2016) 2016 Index of Economic Freedom Washington DC HeritageFoundation New York Wall Street Journal
Mincer J (1996) lsquoEconomic Development Growth of Human Capital and the Dynamics ofthe Wage Structurersquo Journal of Economic Growth 1(1) 29ndash48
Neal D (1997) lsquoThe Effects of Catholic Secondary Schooling on Educational AchievementrsquoJournal of Labor Economics 15(1 1) 98ndash123
Norton S W and A Tomal (2009) lsquoReligion and Female Educational Attainmentrsquo Journalof Money Credit and Banking 41(5) 961ndash986
Papagapitos A and R Riley (2009) lsquoSocial Trust and Human Capital Formationrsquo EconomicsLetters 102(3) 158ndash160
Ranjan P (2001) lsquoDynamic Evolution of Income Distribution and Credit-ConstrainedHuman Capital Investment in Open Economiesrsquo Journal of International Economics55(2) 329ndash358
Roodman D (2009a) lsquoA Note on the Theme of Too Many Instrumentsrsquo Oxford Bulletin ofEconomics and Statistics 71(1) 135ndash158
Roodman D (2009b) lsquoHow to Do xtabond2 An Introduction to Difference and SystemGMM in Statarsquo Stata Journal 9(1) 86ndash136
Rudra N and S Haggard (2005) lsquoGlobalization Democracy and Effective Welfare Spendingin the Developing Worldrsquo Comparative Political Studies 38(9) 1015ndash1049
Schultz T W (1975) lsquoThe Value of the Ability to Deal with Disequilibriarsquo Journal ofEconomic Literature 13(3) 827ndash846
Shea J (1997) lsquoInstrument Relevance in Multivariate Linear Models A Simple MeasurersquoReview of Economics and Statistics 49(2) 348ndash352
Sherkat D E (2011) lsquoReligion and Scientific Literacy in the United Statesrsquo Social ScienceQuarterly 92(5) 1134ndash1150
httpswwwcambridgeorgcoreterms httpsdoiorg101017S174413741600028XDownloaded from httpswwwcambridgeorgcore University of Bath on 30 Apr 2017 at 131945 subject to the Cambridge Core terms of use available at
440 HORST FELDMANN
Skidmore M and H Toya (2002) lsquoDo Natural Disasters Promote Long-Run GrowthrsquoEconomic Inquiry 40(4) 664ndash687
Soares R R (2005) lsquoMortality Reductions Educational Attainment and Fertility ChoicersquoAmerican Economic Review 95(3) 580ndash601
Solt F (2013) lsquoStandardized World Income Inequality Database Version 4rsquohttpmywebuiowaedufsoltswiidswiidhtml (accessed 24 October 2013)
Staiger D and J H Stock (1997) lsquoInstrumental Variables Regression with WeakInstrumentsrsquo Econometrica 65(3) 557ndash586
Stoler A and D Meltzer (2013) lsquoMortality and Morbidity Risks and Economic BehaviorrsquoHealth Economics 22(2) 132ndash143
UNESCO Institute for Statistics (2015) lsquoEducation Statisticsrsquo httpwwwuisunescoorg(accessed 2 September 2015)
World Bank (2013) lsquoGlobal Financial Development Databasersquo httpdataworldbankorg(accessed 6 January 2014)
World Bank (2014) lsquoWorld Development Indicatorsrsquo httpdataworldbankorg (accessed 6June 2014)
httpswwwcambridgeorgcoreterms httpsdoiorg101017S174413741600028XDownloaded from httpswwwcambridgeorgcore University of Bath on 30 Apr 2017 at 131945 subject to the Cambridge Core terms of use available at
Econom
icfreedom
andhum
ancapitalinvestm
ent441
Appendix A
Table A1 List of variables
Definition Mean Std dev Min Max Source
Death rate Number of deaths per 1000 people 978 409 254 3548 World Bank (2014)Democracy lsquoPolity2rsquo index scaled to range from 0 (strongly autocratic) to
1 (strongly democratic) The index measures the degree ofautocracydemocracy based on the competitiveness andregulation of political participation the openness andcompetitiveness of executive recruitment and the constraintson the chief executive of the political regime
070 034 000 100 Marshall et al (2014)
Eastern religionspopulation
Decimal fraction of the population adhering to an Easternreligion (Buddhism Confucianism Hinduism JainismShinto Sikhism Taoism)
006 018 000 091 Maoz and Henderson(2013) authorrsquoscalculations
Economic freedom lsquoEconomic Freedom of the World (EFW)rsquo chain-linkedsummary index scaled to range from 0 (least free) to 1(most free) The index measures the degree of economicfreedom in the following five areas size of governmentlegal system and property rights sound money freedom totrade internationally regulation The summary ratings ofthe index are the arithmetic means of the area ratings
060 012 029 086 Gwartney et al (2013)authorrsquos calculations
Female secondaryenrollment rate
Girls enrolled in secondary education regardless of age as apercentage of girls in the age group that officiallycorresponds to this level of education
7031 3390 230 16737 UNESCO Institute forStatistics (2015)
GDP growth rate Annual growth rate of real GDP decimal fraction 004 003 minus 014 020 IMF (2014) World Bank(2014)
GDP per capita Expenditure side real GDP per capita at chained purchasingpower parity rates in tens of thousands of 2005 US dollars
106 102 002 560 Feenstra et al (2013)authorrsquos calculations
httpsww
wcam
bridgeorgcoreterms httpsdoiorg101017S174413741600028X
Dow
nloaded from httpsw
ww
cambridgeorgcore U
niversity of Bath on 30 Apr 2017 at 131945 subject to the Cambridge Core term
s of use available at
442H
OR
ST
FE
LD
MA
NN
Table A1 (Continued)
Definition Mean Std dev Min Max Source
Income inequality Standardized Gini coefficients of inequality in householdmarket (pre-tax pre-transfer) income scaled to take valuesbetween 0 (perfect equality) and 1 (perfect inequality)
044 009 021 075 Solt (2013)
Inflation rate Annual change in the consumer price index decimal fraction 036 299 minus 004 6185 IMF (2014) World Bank(2014)
Life expectancy Life expectancy at birth in years 6707 1008 2969 8192 World Bank (2014)Muslim population Decimal fraction of the population adhering to Islam 018 032 000 099 Maoz and Henderson
(2013)Natural disasters Total number of persons affected by natural disasters as a
decimal fraction of the population Natural disasters includeclimate-related disasters (eg storms floods and droughts)geological disasters (eg earthquakes volcanic eruptions)and biological disasters (eg epidemics insect infestations)For a disaster to be counted it needs to meet at least one ofthe following criteria 10 or more people reported killed100 or more people reported otherwise affected a state ofemergency was declared or a call for international assistancewas issued Total number of persons affected includes thosekilled injured homeless or requiring immediate assistance
001 003 000 023 Centre for Research on theEpidemiology ofDisasters - CRED (2014)World Bank (2014)authorrsquos calculations
Openness Sum of exports and imports of goods and services as a decimalfraction of GDP
071 037 013 253 World Bank (2014)
Physical capital stock Real physical capital stock at constant 2005 national prices intrillion 2005 US dollars
101 324 000 3664 Feenstra et al (2013)
Physical investment Gross capital formation as a decimal fraction of GDP Itconsists of outlays on additions to the fixed assets of theeconomy plus net changes in the level of inventories
022 006 002 041 World Bank (2014)
httpsww
wcam
bridgeorgcoreterms httpsdoiorg101017S174413741600028X
Dow
nloaded from httpsw
ww
cambridgeorgcore U
niversity of Bath on 30 Apr 2017 at 131945 subject to the Cambridge Core term
s of use available at
Econom
icfreedom
andhum
ancapitalinvestm
ent443
Table A1 (Continued)
Definition Mean Std dev Min Max Source
Political freedom Average of political rights and civil liberties ratings Politicalrights include the right to form political parties to competefor public office and to elect representatives who have adecisive vote on public policies Civil liberties includereligious ethnic economic linguistic gender and familyrights personal freedoms and freedom of the press beliefand association The index which is based on surveysamong analysts and academics is scaled to range from 0 to1 with higher values representing more political rights andcivil liberties (or more respect for or more protection ofpolitical rights and civil liberties)
066 030 000 100 Freedom House (2014)authorrsquos calculations
Population growth rate Annual growth rate of the population decimal fraction 002 001 minus 003 008 World Bank (2014)Private credit The financial resources provided to the private sector by
deposit money banks and other financial institutions as adecimal fraction of GDP Domestic money banks comprisecommercial banks and other financial institutions thataccept transferable deposits such as demand deposits
044 039 000 217 World Bank (2013)
Protestant population Decimal fraction of the population adhering to Protestantism 017 024 000 094 Maoz and Henderson(2013)
Public spending oneducation
Public spending on education as a decimal fraction of GDP Itconsists of current and capital public expenditure oneducation and includes government spending on educationalinstitutions (both public and private) educationadministration as well as subsidies for private entities(studentshouseholds and other private entities)
004 002 001 036 World Bank (2014)
httpsww
wcam
bridgeorgcoreterms httpsdoiorg101017S174413741600028X
Dow
nloaded from httpsw
ww
cambridgeorgcore U
niversity of Bath on 30 Apr 2017 at 131945 subject to the Cambridge Core term
s of use available at
444H
OR
ST
FE
LD
MA
NN
Table A1 (Continued)
Definition Mean Std dev Min Max Source
Religious pluralism One minus the Herfindahl index of religious group sharesreflecting the probability that two randomly selectedindividuals from a population belong to different groups
029 019 002 071 Maoz and Henderson(2013) authorrsquoscalculations
Roman Catholicpopulation
Decimal fraction of the population adhering to RomanCatholic religion
035 036 000 098 Maoz and Henderson(2013)
Secondary enrollmentrate
Children enrolled in secondary education regardless of age asa percentage of the age group that officially corresponds tothis level of education
7099 3175 342 15482 UNESCO Institute forStatistics (2015)
Systemic banking crises Dummy variable that takes the value 1 if in the respectiveyear the country experienced a systemic banking crisis Abanking crisis is defined as systemic if two conditions aremet first significant signs of financial distress in thebanking system (as indicated by significant bank runs lossesin the banking system or bank liquidations) and secondsignificant banking policy intervention measures in responseto significant losses in the banking system
008 021 000 100 Laeven and Valencia(2013)
Urbanization rate People living in urban areas as a decimal fraction of the totalpopulation
055 023 004 098 World Bank (2014)
Wars Military and civilian deaths in battle-related conflicts per1000 people
001 005 000 096 World Bank (2014)authorrsquos calculations
httpsww
wcam
bridgeorgcoreterms httpsdoiorg101017S174413741600028X
Dow
nloaded from httpsw
ww
cambridgeorgcore U
niversity of Bath on 30 Apr 2017 at 131945 subject to the Cambridge Core term
s of use available at
Economic freedom and human capital investment 445
Appendix B List of countries
Albania Argentina Australia Austria Bahamas Bahrain Bangladesh BarbadosBelgium Belize Benin Bolivia Botswana Bulgaria Burundi Cameroon CanadaCentral African Republic Chad China Colombia Costa Rica Cote drsquoIvoireCroatia Cyprus Czech Republic Democratic Republic of the Congo DenmarkDominican Republic Ecuador Egypt El Salvador Estonia Fiji Finland FranceGabon Germany Ghana Greece Guatemala Guinea Bissau Honduras HungaryIceland India Indonesia Iran Ireland Israel Italy Jamaica Japan JordanKenya Kuwait Latvia Lithuania Luxembourg Madagascar Malawi MalaysiaMali Malta Mauritius Mexico Morocco Namibia Nepal Netherlands NewZealand Niger Nigeria Norway Oman Pakistan Panama Paraguay PeruPhilippines Poland Portugal Republic of the Congo Romania Russia RwandaSenegal Slovakia Slovenia South Africa South Korea Spain Sri Lanka SwedenSwitzerland Syria Tanzania Thailand Togo Trinidad and Tobago TunisiaTurkey Uganda Ukraine United Kingdom United States Uruguay ZambiaZimbabwe
httpswwwcambridgeorgcoreterms httpsdoiorg101017S174413741600028XDownloaded from httpswwwcambridgeorgcore University of Bath on 30 Apr 2017 at 131945 subject to the Cambridge Core terms of use available at
- 1 Introduction
- 2 Variables
- 3 Sample and methodology
- 4 Results
- 5 Conclusion
- References
- Appendix B List of countries
-

Econom
icfreedom
andhum
ancapitalinvestm
ent431
Table 1 Fixed effects regressions of secondary school enrollment
(1) (2) (3) (4) (5) (6) (7) (8) (9)Democracy Religious Physical Income Inflation Systemic Natural
Baseline substituted for pluralism investment inequality rate banking crises disasters Warsspecification political freedom added added added added added added added
Panel A Dependent variable secondary enrollment rateEconomic freedom 3348lowastlowast 3174lowastlowast 3420lowastlowastlowast 3189lowastlowast 3798lowastlowastlowast 3384lowastlowast 3350lowastlowast 3371lowastlowastlowast 3302lowastlowast
(1275) (1295) (1292) (1218) (1292) (1290) (1278) (1269) (1281)Political freedom minus 275 minus 269 minus 271 minus 307 minus 278 minus 274 minus 299 minus 292
(333) (331) (334) (374) (333) (333) (335) (335)Public spending on education minus 1076 minus 907 minus 1416 minus 1233 minus 583 minus 1074 minus 1088 minus 1103 minus 1133
(2914) (2912) (3101) (2998) (3306) (2926) (2930) (2927) (2923)Population growth rate minus 1923 minus 2821 minus 1665 minus 2044 3197 minus 1990 minus 1923 minus 1511 minus 1692
(7131) (7121) (7224) (7261) (7626) (7134) (7137) (7289) (7189)Life expectancy 068 070 066 067 056 067 068 069 067
(053) (055) (053) (053) (058) (053) (053) (055) (053)Death rate 125lowast 127 126lowast 129lowast 123 125lowast 125lowast 128lowast 125lowast
(074) (077) (074) (075) (078) (074) (074) (077) (074)Urbanization rate 3470 3027 3359 3289 3130 3482 3472 3563 3439
(2300) (2473) (2278) (2332) (2393) (2300) (2299) (2272) (2305)Protestant population 136 339 minus 1031 072 338 129 126 128 138
(1790) (1856) (2076) (1760) (1823) (1788) (1783) (1806) (1793)Roman Catholic population minus 210 minus 090 minus 1216 minus 236 333 minus 258 minus 205 minus 248 minus 163
(2005) (2026) (2163) (1985) (2145) (2016) (2019) (2007) (2005)Muslim population minus 6704lowastlowast minus 6872lowastlowast minus 6901lowastlowast minus 6700lowastlowast minus 4856 minus 6691lowastlowast minus 6720lowastlowast minus 6737lowastlowast minus 6734lowastlowast
(3112) (3094) (3165) (3166) (3737) (3116) (3128) (3098) (3102)Eastern religions population 2155 2546 1503 2152 1057 2129 2166 2006 2088
(4690) (4487) (4753) (4653) (5626) (4688) (4694) (4731) (4717)GDP per capita minus 155 minus 145 minus 138 minus 149 minus 454 minus 156 minus 153 minus 154 minus 163
(268) (270) (262) (267) (304) (268) (268) (268) (268)
httpsww
wcam
bridgeorgcoreterms httpsdoiorg101017S174413741600028X
Dow
nloaded from httpsw
ww
cambridgeorgcore U
niversity of Bath on 30 Apr 2017 at 131945 subject to the Cambridge Core term
s of use available at
432H
OR
ST
FE
LD
MA
NN
Table 1 (Continued)
(1) (2) (3) (4) (5) (6) (7) (8) (9)Democracy Religious Physical Income Inflation Systemic Natural
Baseline substituted for pluralism investment inequality rate banking crises disasters Warsspecification political freedom added added added added added added added
GDP growth rate 125 306 081 minus 202 minus 2130 204 170 111 105(1702) (1732) (1754) (1804) (1745) (1701) (1749) (1716) (1692)
Private credit minus 034 090 minus 003 minus 058 minus 090 minus 033 minus 037 minus 040 minus 037(356) (383) (361) (363) (379) (357) (354) (354) (355)
Physical capital stock minus 107lowastlowast minus 116lowastlowast minus 113lowastlowast minus 108lowastlowast minus 093lowastlowast minus 106lowastlowast minus 107lowastlowast minus 107lowastlowast minus 107lowastlowast
(044) (045) (045) (043) (044) (044) (044) (044) (044)Openness minus 249 minus 290 minus 246 minus 343 080 minus 250 minus 251 minus 241 minus 236
(455) (474) (452) (467) (505) (455) (456) (457) (455)Democracy 018
(290)Religious pluralism minus 1321
(1675)Physical investment 1154
(1183)Income inequality 1133
(977)Inflation rate 004
(005)Systemic banking crises 025
(215)Natural disasters 911
(1869)Wars minus 635lowast
(345)Number of observations 540 520 540 539 486 539 540 540 540Number of countries 109 104 109 108 106 109 109 109 109
httpsww
wcam
bridgeorgcoreterms httpsdoiorg101017S174413741600028X
Dow
nloaded from httpsw
ww
cambridgeorgcore U
niversity of Bath on 30 Apr 2017 at 131945 subject to the Cambridge Core term
s of use available at
Econom
icfreedom
andhum
ancapitalinvestm
ent433
Table 1 (Continued)
(1) (2) (3) (4) (5) (6) (7) (8) (9)Democracy Religious Physical Income Inflation Systemic Natural
Baseline substituted for pluralism investment inequality rate banking crises disasters Warsspecification political freedom added added added added added added added
R2 within 065 065 065 065 067 065 065 065 065F statistic 2517lowastlowastlowast 2528lowastlowastlowast 2291lowastlowastlowast 2562lowastlowastlowast 2355lowastlowastlowast 2321lowastlowastlowast 2486lowastlowastlowast 2459lowastlowastlowast 2402lowastlowastlowast
Standard error of regression 651 660 651 651 636 652 652 651 651Reverse causality testa 024 028 023 025 012 024 024 023 023
Panel B Dependent variable female secondary enrollment rateEconomic freedom 2672lowastlowast 2536lowastlowast 2730lowastlowast 2488lowastlowast 3164lowastlowast 2722lowastlowast 2675lowastlowast 2699lowastlowast 2618lowastlowast
(1196) (1221) (1211) (1149) (1205) (1208) (1198) (1192) (1204)Control variablesb Yes Yes Yes Yes Yes Yes Yes Yes YesNumber of observations 533 513 533 532 480 532 533 533 533Number of countries 108 103 108 107 105 108 108 108 108R2 within 065 065 065 065 066 065 065 065 065F statistic 2313lowastlowastlowast 2315lowastlowastlowast 2175lowastlowastlowast 2260lowastlowastlowast 2110lowastlowastlowast 2128lowastlowastlowast 2247lowastlowastlowast 2289lowastlowastlowast 2209lowastlowastlowast
Standard error of regression 689 698 689 689 682 690 689 689 689Reverse causality testa 022 027 022 023 016 022 022 022 022
Notes Pooled least squares regressions with country-specific fixed effects The data are non-overlapping 5-year averages spanning 1972 to 2011 All explanatoryvariables are lagged by one 5-year period All regressions also contain period dummies and a constant term Robust standard errors adjusted for clustering at thecountry level are reported in parentheses lowastlowastlowast(lowastlowastlowast) denotes statistically significant at the 1(510) levelap value of coefficient on the respective enrollment variable from a regression in which the dependent variable and the variable of interest are swapped ielsquoeconomic freedomrsquo is used as dependent variable and the respective enrollment variable lagged by one 5-year period as an explanatory variable In each of thesetests the control variables lagged by one 5-year period and the estimation method are the same as in the corresponding regression presented in the same columnin panel AbEach regression of lsquofemale secondary enrollment ratersquo uses the same control variables as the regression of lsquosecondary enrollment ratersquo presented in the samecolumn in panel A For brevity the estimates for the control variables from the former regressions are omitted
httpsww
wcam
bridgeorgcoreterms httpsdoiorg101017S174413741600028X
Dow
nloaded from httpsw
ww
cambridgeorgcore U
niversity of Bath on 30 Apr 2017 at 131945 subject to the Cambridge Core term
s of use available at
434 HORST FELDMANN
equation with a lag of one 5-year period Fifth our reverse causality test doesnot provide any evidence of causality running in the opposite direction
4 Results
Before we discuss the results from our multivariate regressions let us brieflytake a look at the bivariate associations between lsquoeconomic freedomrsquo on theone hand and the two enrollment variables on the other (Figures 1 and 2)Both figures use country averages and show a positive relationship By and largeover the sample period countries that enjoyed more economic freedom had ahigher secondary enrollment rate both among boys and girls combined as wellas among girls only
Table 1 reports the results from our multivariate regressions While column1 presents the results from our baseline specification columns 2 to 9 present theresults from our robustness checks While panel A reports the results from theregressions to explain the secondary enrollment rate panel B reports the resultsfrom the regressions to explain the female secondary enrollment rate To savespace panel B presents only the estimates for the lsquoeconomic freedomrsquo variableand the test statistic the estimates for the control variables are omitted Eachregression to explain the female secondary enrollment rate uses the same controlvariables as the corresponding regression to explain the secondary enrollmentrate presented in the same column of panel A
In each regression the coefficient on lsquoeconomic freedomrsquo is positive andstatistically significant suggesting that over the sample period economicfreedom probably had a favorable effect on both the secondary and the femalesecondary enrollment rate In most robustness checks the size of the coefficientis similar to the estimate from the respective baseline regression7
According to our regression results the effect of economic freedom onsecondary schooling is likely to have been substantial Turkey is a case in pointOn the 0-to-1 scale its EFW score increased from 0378 on average over the years1972ndash76 to 0654 on average over the years 2007ndash11 Over the same periodTurkeyrsquos secondary school enrollment rose substantially both among boys andgirls combined as well as among girls only Specifically while the secondaryenrollment rate increased from 298 on average over 1972ndash76 to 863 onaverage over 2009ndash11 the female secondary enrollment rate rose from 178 to814 Our estimates suggest that Turkeyrsquos increase in economic freedom mighthave caused its secondary enrollment rate to rise by 92 percentage points and itsfemale secondary enrollment rate by 74 percentage points ceteris paribus These
7 In an additional robustness check we excluded from the sample three randomly drawn countries ata time and re-run both baseline regressions at each step We repeated this exercise until each country hadbeen excluded once This test did not materially affect the estimate for lsquoeconomic freedomrsquo either (resultsnot reported here)
httpswwwcambridgeorgcoreterms httpsdoiorg101017S174413741600028XDownloaded from httpswwwcambridgeorgcore University of Bath on 30 Apr 2017 at 131945 subject to the Cambridge Core terms of use available at
Economic freedom and human capital investment 435
figures have been calculated using the estimates from the baseline regressionspresented in column 1 of Table 1 Of course they should be taken with a grainof salt Still they illustrate that the magnitude of the effect is likely to have beensubstantial
Our regression results corroborate the hypothesis that economic freedom islikely to favorably affect human capital investment As explained in section 1economic freedom probably stimulates investment in human capital because itboth increases the payoffs from these investments and enables people to keep alarger share of them Additionally by facilitating the operation of credit marketseconomic freedom is likely to make it easier for people to undertake suchinvestments As also explained in section 1 in its positive effect on human capitalinvestment the various dimensions of economic freedom ndash secure property rightsmodest taxation monetary stability open markets and light regulation ndash arelikely to complement each other
Our results are in line with the three previous relevant papers (section 1) Inparticular they accord with Dawson (1998) who finds that change in economicfreedom has a positive effect on the secondary enrollment rate Our paper alsoaccords with Aixala and Fabro (2009) who report that economic freedomGranger-causes primary school enrollment And finally our results are in linewith King et alrsquos (2012) who find that returns to human capital investmentare higher in economically free countries Although our results accord with thesestudies our paper adds to this literature in several respects ndash most importantly byusing a much larger number of controls and by estimating the effect of economicfreedom on human capital formation not only among males and females jointlybut also separately for females
Finally a brief comment on the estimates for the control variables (Table 1)Interestingly few of them are statistically significant One of the most robustresults among the controls is that during our sample period a larger share ofMuslims in the population was associated with a lower secondary enrollmentrate This is in line with the previous literature (section 2) Another robust findingis that a larger physical capital stock is negatively correlated with the secondaryenrollment rate suggesting that investment in human capital might have beenprimarily a substitute for rather than a complement to physical capital Thisinterpretation is tentative though not least because the coefficient on lsquophysicalinvestmentrsquo is insignificant Furthermore we find some albeit weak evidencethat wars might have had a negative impact on secondary schooling lendingsupport to some of the papers on the link between crises and human capitalaccumulation The insignificant results for some of the other variables are also inline with some of the previous literature For example various previous papersfind political freedom public spending on education and urbanization to have nosignificant effect on the secondary enrollment rate (section 2) In addition to thesepapers we find several other demographic religious and economic variables tohave no significant effect either However what is decisive here is that including
httpswwwcambridgeorgcoreterms httpsdoiorg101017S174413741600028XDownloaded from httpswwwcambridgeorgcore University of Bath on 30 Apr 2017 at 131945 subject to the Cambridge Core terms of use available at
436 HORST FELDMANN
any of those variables does not alter our main result ndash namely that over theperiod 1972 to 2011 economic freedom was positively correlated with humancapital investment
5 Conclusion
There is a large literature studying which factors foster investment in humancapital Our paper contributes to this literature by analyzing a factor that so farhas been almost completely overlooked ndash economic freedom As explained insection 1 the reasoning as to why economic freedom is likely to be an importantdeterminant of human capital investment is similar to the case of investmentin physical capital For both types of capital more economic freedom increasesthe return on investing in it lets investors keep a larger share of the return andmakes it easier for them to undertake such investments in the first place Inthis paper we report robust evidence that economic freedom is indeed likelyto have increased human capital investment over the period 1972 to 2011 Themagnitude of the estimated effect is substantial Our regressions control for allother major determinants of human capital investment
As mentioned in section 3 the evidence provided in this paper corresponds toconditional correlations in the data It does not establish causality Still the factthat more economic freedom is consistently correlated with higher human capitalinvestment in the following 5-year period even after controlling for a myriad offactors and the fact that there is no such reverse association is intriguing andsuggests that the effect is likely to be causal
Although our regressions control for many factors and the results are robustmore research is needed Most importantly the endogeneity issue needs tobe tackled in a better way so that the causal effect of economic freedom onhuman capital investment can be identified more convincingly8 Furthermorethe transmission channels from economic freedom to human capital investmentneed to be studied in more in detail both theoretically and empirically Forexample how does an increase in economic freedom affect parentsrsquo decisionsabout their childrenrsquos education Additionally the effect of economic freedomon other forms of human capital accumulation need to be studied as well Forexample does an increase in economic freedom induce firms to improve thetraining of their workforce As education and training are essential for economicdevelopment a better understanding of the role played by economic freedom isan important issue for future research
8 One way to establish the causal effect of economic freedom on human capital investment might beto perform comparative case studies using the Synthetic Control Method (Abadie et al 2010 2015) Thismethod would be applicable in cases where an individual country has implemented a substantial changein economic freedom Using this method subsequent human capital investment in the reformer countrycould be compared with a weighted average set of similar countries ndash the synthetic control group Such acontrol group could constitute a good counterfactual enabling causal inference
httpswwwcambridgeorgcoreterms httpsdoiorg101017S174413741600028XDownloaded from httpswwwcambridgeorgcore University of Bath on 30 Apr 2017 at 131945 subject to the Cambridge Core terms of use available at
Economic freedom and human capital investment 437
References
Abadie A A Diamond and J Hainmueller (2010) lsquoSynthetic Control Methods forComparative Case Studies Estimating the Effect of Californiarsquos Tobacco ControlProgramrsquo Journal of the American Statistical Association 105(490) 493ndash505
Abadie A A Diamond and J Hainmueller (2015) lsquoComparative Politics and the SyntheticControl Methodrsquo American Journal of Political Science 59(2) 495ndash510
Acemoglu D (2005) lsquoConstitutions Politics and Economics A Review Essay on Persson andTabellinirsquos The Economic Effects of Constitutionsrsquo Journal of Economic Literature43(4) 1025ndash1048
Acemoglu D S Johnson and J A Robinson (2001) lsquoThe Colonial Origins of ComparativeDevelopment An Empirical Investigationrsquo American Economic Review 91(5) 1369ndash1401
Aixala J and G Fabro (2009) lsquoEconomic Freedom Civil Liberties Political Rights andGrowth A Causality Analysisrsquo Spanish Economic Review 11(3) 165ndash178
Alesina A A Devleeschauwer W Easterly S Kurlat and R Wacziarg (2003)lsquoFractionalizationrsquo Journal of Economic Growth 8(2) 155ndash194
Barro R J (1999) lsquoDeterminants of Democracyrsquo Journal of Political Economy 107(6 2)S158ndashS183
Bazzi S and M A Clemens (2013) lsquoBlunt Instruments Avoiding Common Pitfallsin Identifying the Causes of Economic Growthrsquo American Economic JournalMacroeconomics 5(2) 152ndash186
Becker G S and H G Lewis (1973) lsquoOn the Interaction between the Quantity and Qualityof Childrenrsquo Journal of Political Economy 81(2 2) S279ndashS288
Becker S O and L Woessmann (2009) lsquoWas Weber Wrong A Human Capital Theory ofProtestant Economic Historyrsquo Quarterly Journal of Economics 124(2) 531ndash596
Besley T (1995) lsquoProperty Rights and Investment Incentives Theory and Evidence fromGhanarsquo Journal of Political Economy 103(5) 903ndash937
Bessey D (2013) lsquoReligion and Educational Attainment in East Asia First Evidence from theEast Asian Social Surveyrsquo Global Economic Review 42(3) 238ndash250
Boikos S A Bucci and T Stengos (2013) lsquoNon-Monotonicity of Fertility in Human CapitalAccumulation and Economic Growthrsquo Journal of Macroeconomics 38(A) 44ndash59
Burton-Jones A and J-C Spender (eds) (2011) The Oxford Handbook of Human CapitalOxford Oxford University Press
Castello-Climent A and A Hidalgo-Cabrillana (2012) lsquoThe Role of Educational Quality andQuantity in the Process of Economic Developmentrsquo Economics of Education Review31(4) 391ndash409
Centre for Research on the Epidemiology of Disasters - CRED (2014) lsquoInternational DisastersDatabase (EM-DAT)rsquo httpwwwemdatbe (accessed 20 June 2014)
Cervellati M and U Sunde (2005) lsquoHuman Capital Formation Life Expectancy and theProcess of Developmentrsquo American Economic Review 95(5) 1653ndash1672
Chiu W H (1998) lsquoIncome Inequality Human Capital Accumulation and EconomicPerformancersquo Economic Journal 108(446) 44ndash59
Cooray A and N Potrafke (2011) lsquoGender Inequality in Education Political Institutions orCulture and Religionrsquo European Journal of Political Economy 27(2) 268ndash280
Crespo Cuaresma J (2010) lsquoNatural Disasters and Human Capital Accumulationrsquo WorldBank Economic Review 24(2) 280ndash302
Davis L S and F Abdurazokzoda (2016) lsquoLanguage Culture and Institutions Evidencefrom a New Linguistic Datasetrsquo Journal of Comparative Economics 44(3) 541ndash561
httpswwwcambridgeorgcoreterms httpsdoiorg101017S174413741600028XDownloaded from httpswwwcambridgeorgcore University of Bath on 30 Apr 2017 at 131945 subject to the Cambridge Core terms of use available at
438 HORST FELDMANN
Dawson J W (1998) lsquoInstitutions Investment and Growth New Cross-Country and PanelData Evidencersquo Economic Inquiry 36(4) 603ndash619
De Gregorio J (1996) lsquoBorrowing Constraints Human Capital Accumulation and GrowthrsquoJournal of Monetary Economics 37(1) 49ndash71
Demirguc-Kunt A and V Maksimovic (1998) lsquoLaw Finance and Firm Growthrsquo Journal ofFinance 53(6) 2107ndash2137
Eterovic D S and C M Sweet (2014) lsquoDemocracy and Education in Twentieth-CenturyLatin Americarsquo Economics and Politics 26(2) 237ndash262
Faria H J and H M Montesinos (2009) lsquoDoes Economic Freedom Cause Prosperity AnIV Approachrsquo Public Choice 141(1ndash2) 103ndash127
Feenstra R C R Inklaar and M P Timmer (2013) lsquoPenn World Table 80rsquohttpwwwrugnlresearchggdcdatapenn-world-table (accessed 23 July 2013)
Feldmann H (2016a) lsquoWhich Religions Still Affect Schooling A Study of 143 CountriesrsquoComparative Sociology 15(4) 439ndash484
Feldmann H (2016b) lsquoThe Long Shadows of Spanish and French Colonial EducationrsquoKyklos 69(1) 32ndash64
Flug K A Spilimbergo and E Wachtenheim (1998) lsquoInvestment in Education Do EconomicVolatility and Credit Constraints Matterrsquo Journal of Development Economics 55(2)465ndash481
Forston J G (2011) lsquoMortality Risk and Human Capital Investment The Impact ofHIVAIDS in Sub-Saharan Africarsquo Review of Economics and Statistics 93(1)1ndash15
Freedom House (2014) Freedom in the World 2014 httpsfreedomhouseorg (accessed 20April 2014)
Glaeser E L R La Porta F Lopez-de-Silanes and A Shleifer (2004) lsquoDo Institutions CauseGrowthrsquo Journal of Economic Growth 9(3) 271ndash303
Griliches Z (1969) lsquoCapital-Skill Complementarityrsquo Review of Economics and Statistics51(4) 465ndash468
Grossmann V (2008) lsquoRisky Human Capital Investment Income Distribution andMacroeconomic Dynamicsrsquo Journal of Macroeconomics 30(1) 19ndash42
Gruber J H (2005) lsquoReligious Market Structure Religious Participation and Outcomes IsReligion Good for Yoursquo Advances in Economic Analysis and Policy 5(1) 1ndash30
Gwartney J D R A Lawson and J C Hall (2013) Economic Freedom of the World 2013Annual Report Vancouver BC Fraser Institute
Hall J C and R A Lawson (2014) lsquoEconomic Freedom of the World An Accounting of theLiteraturersquo Contemporary Economic Policy 32(1) 1ndash19
Hall R E and C I Jones (1999) lsquoWhy Do Some Countries Produce So Much More Outputper Worker than Othersrsquo Quarterly Journal of Economics 114(1) 83ndash116
Hansen L P (1982) lsquoLarge Sample Properties of Generalized Method of MomentsEstimatorsrsquo Econometrica 50(4) 1029ndash1054
Hanushek E A (1992) lsquoThe Trade-off between Child Quantity and Qualityrsquo Journal ofPolitical Economy 100(1) 84ndash117
Hausman J A (1978) lsquoSpecification Tests in Econometricsrsquo Econometrica 46(6) 1251ndash1271
Hausman J A and W E Taylor (1981) lsquoPanel Data and Unobservable Individual EffectsrsquoEconometrica 49(6) 1377ndash1398
Heylen F and L Pozzi (2007) lsquoCrises and Human Capital Accumulationrsquo Canadian Journalof Economics 40(4) 1261ndash1285
httpswwwcambridgeorgcoreterms httpsdoiorg101017S174413741600028XDownloaded from httpswwwcambridgeorgcore University of Bath on 30 Apr 2017 at 131945 subject to the Cambridge Core terms of use available at
Economic freedom and human capital investment 439
IMF (2014) lsquoWorld Economic Outlook Database April 2014 Editionrsquo httpwwwimforg(accessed 9 May 2014)
Kalemli-Ozcan S H E Ryder and D N Weil (2000) lsquoMortality Decline Human CapitalInvestment and Economic Growthrsquo Journal of Development Economics 62(1) 1ndash23
King E M C E Montenegro and P F Orazem (2012) lsquoEconomic Freedom Human Rightsand the Returns to Human Capital An Evaluation of the Schultz Hypothesisrsquo EconomicDevelopment and Cultural Change 61(1) 39ndash72
Kleibergen F and R Paap (2006) lsquoGeneralized Reduced Rank Tests Using the Singular ValueDecompositionrsquo Journal of Econometrics 133(1) 97ndash126
Laeven L and F Valencia (2013) lsquoSystemic Banking Crises Databasersquo IMF EconomicReview 61(2) 225ndash270
Lake D A and M A Baum (2001) lsquoThe Invisible Hand of Democracy Political Controland the Provision of Public Servicesrsquo Comparative Political Studies 34(6) 587ndash621
La Porta R F Lopez-de-Silanes A Shleifer and R Vishny (1999) lsquoThe Quality ofGovernmentrsquo Journal of Law Economics and Organization 15(1) 222ndash279
Lipset S M (1960) Political Man The Social Bases of Politics Garden City NY DoubledayMaoz Z and E A Henderson (2013) lsquoThe World Religion Dataset Version 11rsquo
httpwwwcorrelatesofwarorg (accessed 11 February 2014)Marshall M G T R Gurr and K Jaggers (2014) lsquoPolity IV Project Political Regime Char-
acteristics and Transitions 1800-2013 Version 2013rsquo httpwwwsystemicpeaceorg(accessed 4 June 2014)
Mendez F and F Sepulveda (2012) lsquoThe Cyclicality of Skill Acquisition Evidence from PanelDatarsquo American Economic Journal Macroeconomics 4(3) 128ndash152
Miller T and A B Kim (2016) 2016 Index of Economic Freedom Washington DC HeritageFoundation New York Wall Street Journal
Mincer J (1996) lsquoEconomic Development Growth of Human Capital and the Dynamics ofthe Wage Structurersquo Journal of Economic Growth 1(1) 29ndash48
Neal D (1997) lsquoThe Effects of Catholic Secondary Schooling on Educational AchievementrsquoJournal of Labor Economics 15(1 1) 98ndash123
Norton S W and A Tomal (2009) lsquoReligion and Female Educational Attainmentrsquo Journalof Money Credit and Banking 41(5) 961ndash986
Papagapitos A and R Riley (2009) lsquoSocial Trust and Human Capital Formationrsquo EconomicsLetters 102(3) 158ndash160
Ranjan P (2001) lsquoDynamic Evolution of Income Distribution and Credit-ConstrainedHuman Capital Investment in Open Economiesrsquo Journal of International Economics55(2) 329ndash358
Roodman D (2009a) lsquoA Note on the Theme of Too Many Instrumentsrsquo Oxford Bulletin ofEconomics and Statistics 71(1) 135ndash158
Roodman D (2009b) lsquoHow to Do xtabond2 An Introduction to Difference and SystemGMM in Statarsquo Stata Journal 9(1) 86ndash136
Rudra N and S Haggard (2005) lsquoGlobalization Democracy and Effective Welfare Spendingin the Developing Worldrsquo Comparative Political Studies 38(9) 1015ndash1049
Schultz T W (1975) lsquoThe Value of the Ability to Deal with Disequilibriarsquo Journal ofEconomic Literature 13(3) 827ndash846
Shea J (1997) lsquoInstrument Relevance in Multivariate Linear Models A Simple MeasurersquoReview of Economics and Statistics 49(2) 348ndash352
Sherkat D E (2011) lsquoReligion and Scientific Literacy in the United Statesrsquo Social ScienceQuarterly 92(5) 1134ndash1150
httpswwwcambridgeorgcoreterms httpsdoiorg101017S174413741600028XDownloaded from httpswwwcambridgeorgcore University of Bath on 30 Apr 2017 at 131945 subject to the Cambridge Core terms of use available at
440 HORST FELDMANN
Skidmore M and H Toya (2002) lsquoDo Natural Disasters Promote Long-Run GrowthrsquoEconomic Inquiry 40(4) 664ndash687
Soares R R (2005) lsquoMortality Reductions Educational Attainment and Fertility ChoicersquoAmerican Economic Review 95(3) 580ndash601
Solt F (2013) lsquoStandardized World Income Inequality Database Version 4rsquohttpmywebuiowaedufsoltswiidswiidhtml (accessed 24 October 2013)
Staiger D and J H Stock (1997) lsquoInstrumental Variables Regression with WeakInstrumentsrsquo Econometrica 65(3) 557ndash586
Stoler A and D Meltzer (2013) lsquoMortality and Morbidity Risks and Economic BehaviorrsquoHealth Economics 22(2) 132ndash143
UNESCO Institute for Statistics (2015) lsquoEducation Statisticsrsquo httpwwwuisunescoorg(accessed 2 September 2015)
World Bank (2013) lsquoGlobal Financial Development Databasersquo httpdataworldbankorg(accessed 6 January 2014)
World Bank (2014) lsquoWorld Development Indicatorsrsquo httpdataworldbankorg (accessed 6June 2014)
httpswwwcambridgeorgcoreterms httpsdoiorg101017S174413741600028XDownloaded from httpswwwcambridgeorgcore University of Bath on 30 Apr 2017 at 131945 subject to the Cambridge Core terms of use available at
Econom
icfreedom
andhum
ancapitalinvestm
ent441
Appendix A
Table A1 List of variables
Definition Mean Std dev Min Max Source
Death rate Number of deaths per 1000 people 978 409 254 3548 World Bank (2014)Democracy lsquoPolity2rsquo index scaled to range from 0 (strongly autocratic) to
1 (strongly democratic) The index measures the degree ofautocracydemocracy based on the competitiveness andregulation of political participation the openness andcompetitiveness of executive recruitment and the constraintson the chief executive of the political regime
070 034 000 100 Marshall et al (2014)
Eastern religionspopulation
Decimal fraction of the population adhering to an Easternreligion (Buddhism Confucianism Hinduism JainismShinto Sikhism Taoism)
006 018 000 091 Maoz and Henderson(2013) authorrsquoscalculations
Economic freedom lsquoEconomic Freedom of the World (EFW)rsquo chain-linkedsummary index scaled to range from 0 (least free) to 1(most free) The index measures the degree of economicfreedom in the following five areas size of governmentlegal system and property rights sound money freedom totrade internationally regulation The summary ratings ofthe index are the arithmetic means of the area ratings
060 012 029 086 Gwartney et al (2013)authorrsquos calculations
Female secondaryenrollment rate
Girls enrolled in secondary education regardless of age as apercentage of girls in the age group that officiallycorresponds to this level of education
7031 3390 230 16737 UNESCO Institute forStatistics (2015)
GDP growth rate Annual growth rate of real GDP decimal fraction 004 003 minus 014 020 IMF (2014) World Bank(2014)
GDP per capita Expenditure side real GDP per capita at chained purchasingpower parity rates in tens of thousands of 2005 US dollars
106 102 002 560 Feenstra et al (2013)authorrsquos calculations
httpsww
wcam
bridgeorgcoreterms httpsdoiorg101017S174413741600028X
Dow
nloaded from httpsw
ww
cambridgeorgcore U
niversity of Bath on 30 Apr 2017 at 131945 subject to the Cambridge Core term
s of use available at
442H
OR
ST
FE
LD
MA
NN
Table A1 (Continued)
Definition Mean Std dev Min Max Source
Income inequality Standardized Gini coefficients of inequality in householdmarket (pre-tax pre-transfer) income scaled to take valuesbetween 0 (perfect equality) and 1 (perfect inequality)
044 009 021 075 Solt (2013)
Inflation rate Annual change in the consumer price index decimal fraction 036 299 minus 004 6185 IMF (2014) World Bank(2014)
Life expectancy Life expectancy at birth in years 6707 1008 2969 8192 World Bank (2014)Muslim population Decimal fraction of the population adhering to Islam 018 032 000 099 Maoz and Henderson
(2013)Natural disasters Total number of persons affected by natural disasters as a
decimal fraction of the population Natural disasters includeclimate-related disasters (eg storms floods and droughts)geological disasters (eg earthquakes volcanic eruptions)and biological disasters (eg epidemics insect infestations)For a disaster to be counted it needs to meet at least one ofthe following criteria 10 or more people reported killed100 or more people reported otherwise affected a state ofemergency was declared or a call for international assistancewas issued Total number of persons affected includes thosekilled injured homeless or requiring immediate assistance
001 003 000 023 Centre for Research on theEpidemiology ofDisasters - CRED (2014)World Bank (2014)authorrsquos calculations
Openness Sum of exports and imports of goods and services as a decimalfraction of GDP
071 037 013 253 World Bank (2014)
Physical capital stock Real physical capital stock at constant 2005 national prices intrillion 2005 US dollars
101 324 000 3664 Feenstra et al (2013)
Physical investment Gross capital formation as a decimal fraction of GDP Itconsists of outlays on additions to the fixed assets of theeconomy plus net changes in the level of inventories
022 006 002 041 World Bank (2014)
httpsww
wcam
bridgeorgcoreterms httpsdoiorg101017S174413741600028X
Dow
nloaded from httpsw
ww
cambridgeorgcore U
niversity of Bath on 30 Apr 2017 at 131945 subject to the Cambridge Core term
s of use available at
Econom
icfreedom
andhum
ancapitalinvestm
ent443
Table A1 (Continued)
Definition Mean Std dev Min Max Source
Political freedom Average of political rights and civil liberties ratings Politicalrights include the right to form political parties to competefor public office and to elect representatives who have adecisive vote on public policies Civil liberties includereligious ethnic economic linguistic gender and familyrights personal freedoms and freedom of the press beliefand association The index which is based on surveysamong analysts and academics is scaled to range from 0 to1 with higher values representing more political rights andcivil liberties (or more respect for or more protection ofpolitical rights and civil liberties)
066 030 000 100 Freedom House (2014)authorrsquos calculations
Population growth rate Annual growth rate of the population decimal fraction 002 001 minus 003 008 World Bank (2014)Private credit The financial resources provided to the private sector by
deposit money banks and other financial institutions as adecimal fraction of GDP Domestic money banks comprisecommercial banks and other financial institutions thataccept transferable deposits such as demand deposits
044 039 000 217 World Bank (2013)
Protestant population Decimal fraction of the population adhering to Protestantism 017 024 000 094 Maoz and Henderson(2013)
Public spending oneducation
Public spending on education as a decimal fraction of GDP Itconsists of current and capital public expenditure oneducation and includes government spending on educationalinstitutions (both public and private) educationadministration as well as subsidies for private entities(studentshouseholds and other private entities)
004 002 001 036 World Bank (2014)
httpsww
wcam
bridgeorgcoreterms httpsdoiorg101017S174413741600028X
Dow
nloaded from httpsw
ww
cambridgeorgcore U
niversity of Bath on 30 Apr 2017 at 131945 subject to the Cambridge Core term
s of use available at
444H
OR
ST
FE
LD
MA
NN
Table A1 (Continued)
Definition Mean Std dev Min Max Source
Religious pluralism One minus the Herfindahl index of religious group sharesreflecting the probability that two randomly selectedindividuals from a population belong to different groups
029 019 002 071 Maoz and Henderson(2013) authorrsquoscalculations
Roman Catholicpopulation
Decimal fraction of the population adhering to RomanCatholic religion
035 036 000 098 Maoz and Henderson(2013)
Secondary enrollmentrate
Children enrolled in secondary education regardless of age asa percentage of the age group that officially corresponds tothis level of education
7099 3175 342 15482 UNESCO Institute forStatistics (2015)
Systemic banking crises Dummy variable that takes the value 1 if in the respectiveyear the country experienced a systemic banking crisis Abanking crisis is defined as systemic if two conditions aremet first significant signs of financial distress in thebanking system (as indicated by significant bank runs lossesin the banking system or bank liquidations) and secondsignificant banking policy intervention measures in responseto significant losses in the banking system
008 021 000 100 Laeven and Valencia(2013)
Urbanization rate People living in urban areas as a decimal fraction of the totalpopulation
055 023 004 098 World Bank (2014)
Wars Military and civilian deaths in battle-related conflicts per1000 people
001 005 000 096 World Bank (2014)authorrsquos calculations
httpsww
wcam
bridgeorgcoreterms httpsdoiorg101017S174413741600028X
Dow
nloaded from httpsw
ww
cambridgeorgcore U
niversity of Bath on 30 Apr 2017 at 131945 subject to the Cambridge Core term
s of use available at
Economic freedom and human capital investment 445
Appendix B List of countries
Albania Argentina Australia Austria Bahamas Bahrain Bangladesh BarbadosBelgium Belize Benin Bolivia Botswana Bulgaria Burundi Cameroon CanadaCentral African Republic Chad China Colombia Costa Rica Cote drsquoIvoireCroatia Cyprus Czech Republic Democratic Republic of the Congo DenmarkDominican Republic Ecuador Egypt El Salvador Estonia Fiji Finland FranceGabon Germany Ghana Greece Guatemala Guinea Bissau Honduras HungaryIceland India Indonesia Iran Ireland Israel Italy Jamaica Japan JordanKenya Kuwait Latvia Lithuania Luxembourg Madagascar Malawi MalaysiaMali Malta Mauritius Mexico Morocco Namibia Nepal Netherlands NewZealand Niger Nigeria Norway Oman Pakistan Panama Paraguay PeruPhilippines Poland Portugal Republic of the Congo Romania Russia RwandaSenegal Slovakia Slovenia South Africa South Korea Spain Sri Lanka SwedenSwitzerland Syria Tanzania Thailand Togo Trinidad and Tobago TunisiaTurkey Uganda Ukraine United Kingdom United States Uruguay ZambiaZimbabwe
httpswwwcambridgeorgcoreterms httpsdoiorg101017S174413741600028XDownloaded from httpswwwcambridgeorgcore University of Bath on 30 Apr 2017 at 131945 subject to the Cambridge Core terms of use available at
- 1 Introduction
- 2 Variables
- 3 Sample and methodology
- 4 Results
- 5 Conclusion
- References
- Appendix B List of countries
-
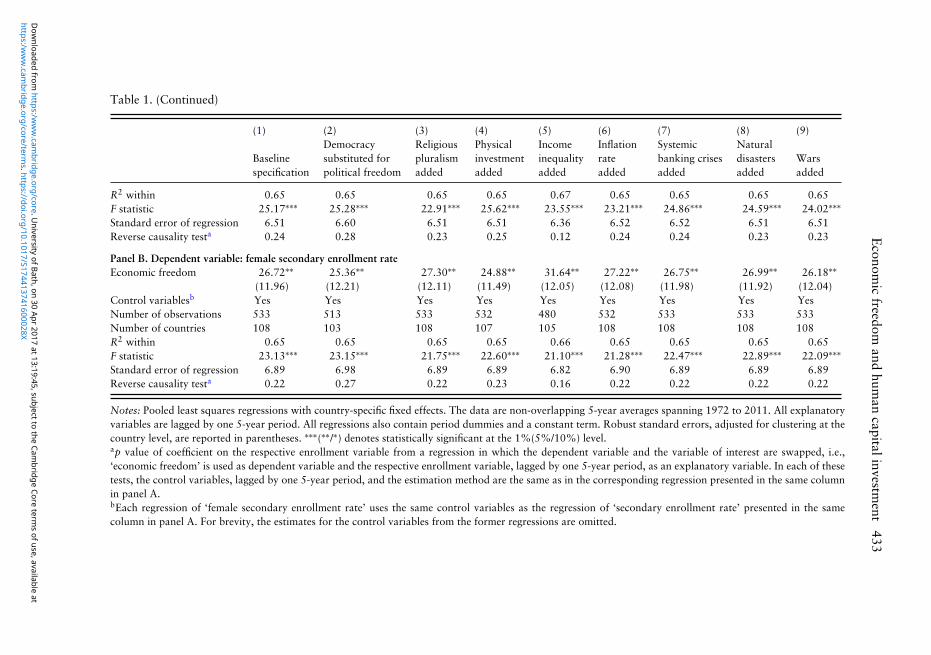
Econom
icfreedom
andhum
ancapitalinvestm
ent433
Table 1 (Continued)
(1) (2) (3) (4) (5) (6) (7) (8) (9)Democracy Religious Physical Income Inflation Systemic Natural
Baseline substituted for pluralism investment inequality rate banking crises disasters Warsspecification political freedom added added added added added added added
R2 within 065 065 065 065 067 065 065 065 065F statistic 2517lowastlowastlowast 2528lowastlowastlowast 2291lowastlowastlowast 2562lowastlowastlowast 2355lowastlowastlowast 2321lowastlowastlowast 2486lowastlowastlowast 2459lowastlowastlowast 2402lowastlowastlowast
Standard error of regression 651 660 651 651 636 652 652 651 651Reverse causality testa 024 028 023 025 012 024 024 023 023
Panel B Dependent variable female secondary enrollment rateEconomic freedom 2672lowastlowast 2536lowastlowast 2730lowastlowast 2488lowastlowast 3164lowastlowast 2722lowastlowast 2675lowastlowast 2699lowastlowast 2618lowastlowast
(1196) (1221) (1211) (1149) (1205) (1208) (1198) (1192) (1204)Control variablesb Yes Yes Yes Yes Yes Yes Yes Yes YesNumber of observations 533 513 533 532 480 532 533 533 533Number of countries 108 103 108 107 105 108 108 108 108R2 within 065 065 065 065 066 065 065 065 065F statistic 2313lowastlowastlowast 2315lowastlowastlowast 2175lowastlowastlowast 2260lowastlowastlowast 2110lowastlowastlowast 2128lowastlowastlowast 2247lowastlowastlowast 2289lowastlowastlowast 2209lowastlowastlowast
Standard error of regression 689 698 689 689 682 690 689 689 689Reverse causality testa 022 027 022 023 016 022 022 022 022
Notes Pooled least squares regressions with country-specific fixed effects The data are non-overlapping 5-year averages spanning 1972 to 2011 All explanatoryvariables are lagged by one 5-year period All regressions also contain period dummies and a constant term Robust standard errors adjusted for clustering at thecountry level are reported in parentheses lowastlowastlowast(lowastlowastlowast) denotes statistically significant at the 1(510) levelap value of coefficient on the respective enrollment variable from a regression in which the dependent variable and the variable of interest are swapped ielsquoeconomic freedomrsquo is used as dependent variable and the respective enrollment variable lagged by one 5-year period as an explanatory variable In each of thesetests the control variables lagged by one 5-year period and the estimation method are the same as in the corresponding regression presented in the same columnin panel AbEach regression of lsquofemale secondary enrollment ratersquo uses the same control variables as the regression of lsquosecondary enrollment ratersquo presented in the samecolumn in panel A For brevity the estimates for the control variables from the former regressions are omitted
httpsww
wcam
bridgeorgcoreterms httpsdoiorg101017S174413741600028X
Dow
nloaded from httpsw
ww
cambridgeorgcore U
niversity of Bath on 30 Apr 2017 at 131945 subject to the Cambridge Core term
s of use available at
434 HORST FELDMANN
equation with a lag of one 5-year period Fifth our reverse causality test doesnot provide any evidence of causality running in the opposite direction
4 Results
Before we discuss the results from our multivariate regressions let us brieflytake a look at the bivariate associations between lsquoeconomic freedomrsquo on theone hand and the two enrollment variables on the other (Figures 1 and 2)Both figures use country averages and show a positive relationship By and largeover the sample period countries that enjoyed more economic freedom had ahigher secondary enrollment rate both among boys and girls combined as wellas among girls only
Table 1 reports the results from our multivariate regressions While column1 presents the results from our baseline specification columns 2 to 9 present theresults from our robustness checks While panel A reports the results from theregressions to explain the secondary enrollment rate panel B reports the resultsfrom the regressions to explain the female secondary enrollment rate To savespace panel B presents only the estimates for the lsquoeconomic freedomrsquo variableand the test statistic the estimates for the control variables are omitted Eachregression to explain the female secondary enrollment rate uses the same controlvariables as the corresponding regression to explain the secondary enrollmentrate presented in the same column of panel A
In each regression the coefficient on lsquoeconomic freedomrsquo is positive andstatistically significant suggesting that over the sample period economicfreedom probably had a favorable effect on both the secondary and the femalesecondary enrollment rate In most robustness checks the size of the coefficientis similar to the estimate from the respective baseline regression7
According to our regression results the effect of economic freedom onsecondary schooling is likely to have been substantial Turkey is a case in pointOn the 0-to-1 scale its EFW score increased from 0378 on average over the years1972ndash76 to 0654 on average over the years 2007ndash11 Over the same periodTurkeyrsquos secondary school enrollment rose substantially both among boys andgirls combined as well as among girls only Specifically while the secondaryenrollment rate increased from 298 on average over 1972ndash76 to 863 onaverage over 2009ndash11 the female secondary enrollment rate rose from 178 to814 Our estimates suggest that Turkeyrsquos increase in economic freedom mighthave caused its secondary enrollment rate to rise by 92 percentage points and itsfemale secondary enrollment rate by 74 percentage points ceteris paribus These
7 In an additional robustness check we excluded from the sample three randomly drawn countries ata time and re-run both baseline regressions at each step We repeated this exercise until each country hadbeen excluded once This test did not materially affect the estimate for lsquoeconomic freedomrsquo either (resultsnot reported here)
httpswwwcambridgeorgcoreterms httpsdoiorg101017S174413741600028XDownloaded from httpswwwcambridgeorgcore University of Bath on 30 Apr 2017 at 131945 subject to the Cambridge Core terms of use available at
Economic freedom and human capital investment 435
figures have been calculated using the estimates from the baseline regressionspresented in column 1 of Table 1 Of course they should be taken with a grainof salt Still they illustrate that the magnitude of the effect is likely to have beensubstantial
Our regression results corroborate the hypothesis that economic freedom islikely to favorably affect human capital investment As explained in section 1economic freedom probably stimulates investment in human capital because itboth increases the payoffs from these investments and enables people to keep alarger share of them Additionally by facilitating the operation of credit marketseconomic freedom is likely to make it easier for people to undertake suchinvestments As also explained in section 1 in its positive effect on human capitalinvestment the various dimensions of economic freedom ndash secure property rightsmodest taxation monetary stability open markets and light regulation ndash arelikely to complement each other
Our results are in line with the three previous relevant papers (section 1) Inparticular they accord with Dawson (1998) who finds that change in economicfreedom has a positive effect on the secondary enrollment rate Our paper alsoaccords with Aixala and Fabro (2009) who report that economic freedomGranger-causes primary school enrollment And finally our results are in linewith King et alrsquos (2012) who find that returns to human capital investmentare higher in economically free countries Although our results accord with thesestudies our paper adds to this literature in several respects ndash most importantly byusing a much larger number of controls and by estimating the effect of economicfreedom on human capital formation not only among males and females jointlybut also separately for females
Finally a brief comment on the estimates for the control variables (Table 1)Interestingly few of them are statistically significant One of the most robustresults among the controls is that during our sample period a larger share ofMuslims in the population was associated with a lower secondary enrollmentrate This is in line with the previous literature (section 2) Another robust findingis that a larger physical capital stock is negatively correlated with the secondaryenrollment rate suggesting that investment in human capital might have beenprimarily a substitute for rather than a complement to physical capital Thisinterpretation is tentative though not least because the coefficient on lsquophysicalinvestmentrsquo is insignificant Furthermore we find some albeit weak evidencethat wars might have had a negative impact on secondary schooling lendingsupport to some of the papers on the link between crises and human capitalaccumulation The insignificant results for some of the other variables are also inline with some of the previous literature For example various previous papersfind political freedom public spending on education and urbanization to have nosignificant effect on the secondary enrollment rate (section 2) In addition to thesepapers we find several other demographic religious and economic variables tohave no significant effect either However what is decisive here is that including
httpswwwcambridgeorgcoreterms httpsdoiorg101017S174413741600028XDownloaded from httpswwwcambridgeorgcore University of Bath on 30 Apr 2017 at 131945 subject to the Cambridge Core terms of use available at
436 HORST FELDMANN
any of those variables does not alter our main result ndash namely that over theperiod 1972 to 2011 economic freedom was positively correlated with humancapital investment
5 Conclusion
There is a large literature studying which factors foster investment in humancapital Our paper contributes to this literature by analyzing a factor that so farhas been almost completely overlooked ndash economic freedom As explained insection 1 the reasoning as to why economic freedom is likely to be an importantdeterminant of human capital investment is similar to the case of investmentin physical capital For both types of capital more economic freedom increasesthe return on investing in it lets investors keep a larger share of the return andmakes it easier for them to undertake such investments in the first place Inthis paper we report robust evidence that economic freedom is indeed likelyto have increased human capital investment over the period 1972 to 2011 Themagnitude of the estimated effect is substantial Our regressions control for allother major determinants of human capital investment
As mentioned in section 3 the evidence provided in this paper corresponds toconditional correlations in the data It does not establish causality Still the factthat more economic freedom is consistently correlated with higher human capitalinvestment in the following 5-year period even after controlling for a myriad offactors and the fact that there is no such reverse association is intriguing andsuggests that the effect is likely to be causal
Although our regressions control for many factors and the results are robustmore research is needed Most importantly the endogeneity issue needs tobe tackled in a better way so that the causal effect of economic freedom onhuman capital investment can be identified more convincingly8 Furthermorethe transmission channels from economic freedom to human capital investmentneed to be studied in more in detail both theoretically and empirically Forexample how does an increase in economic freedom affect parentsrsquo decisionsabout their childrenrsquos education Additionally the effect of economic freedomon other forms of human capital accumulation need to be studied as well Forexample does an increase in economic freedom induce firms to improve thetraining of their workforce As education and training are essential for economicdevelopment a better understanding of the role played by economic freedom isan important issue for future research
8 One way to establish the causal effect of economic freedom on human capital investment might beto perform comparative case studies using the Synthetic Control Method (Abadie et al 2010 2015) Thismethod would be applicable in cases where an individual country has implemented a substantial changein economic freedom Using this method subsequent human capital investment in the reformer countrycould be compared with a weighted average set of similar countries ndash the synthetic control group Such acontrol group could constitute a good counterfactual enabling causal inference
httpswwwcambridgeorgcoreterms httpsdoiorg101017S174413741600028XDownloaded from httpswwwcambridgeorgcore University of Bath on 30 Apr 2017 at 131945 subject to the Cambridge Core terms of use available at
Economic freedom and human capital investment 437
References
Abadie A A Diamond and J Hainmueller (2010) lsquoSynthetic Control Methods forComparative Case Studies Estimating the Effect of Californiarsquos Tobacco ControlProgramrsquo Journal of the American Statistical Association 105(490) 493ndash505
Abadie A A Diamond and J Hainmueller (2015) lsquoComparative Politics and the SyntheticControl Methodrsquo American Journal of Political Science 59(2) 495ndash510
Acemoglu D (2005) lsquoConstitutions Politics and Economics A Review Essay on Persson andTabellinirsquos The Economic Effects of Constitutionsrsquo Journal of Economic Literature43(4) 1025ndash1048
Acemoglu D S Johnson and J A Robinson (2001) lsquoThe Colonial Origins of ComparativeDevelopment An Empirical Investigationrsquo American Economic Review 91(5) 1369ndash1401
Aixala J and G Fabro (2009) lsquoEconomic Freedom Civil Liberties Political Rights andGrowth A Causality Analysisrsquo Spanish Economic Review 11(3) 165ndash178
Alesina A A Devleeschauwer W Easterly S Kurlat and R Wacziarg (2003)lsquoFractionalizationrsquo Journal of Economic Growth 8(2) 155ndash194
Barro R J (1999) lsquoDeterminants of Democracyrsquo Journal of Political Economy 107(6 2)S158ndashS183
Bazzi S and M A Clemens (2013) lsquoBlunt Instruments Avoiding Common Pitfallsin Identifying the Causes of Economic Growthrsquo American Economic JournalMacroeconomics 5(2) 152ndash186
Becker G S and H G Lewis (1973) lsquoOn the Interaction between the Quantity and Qualityof Childrenrsquo Journal of Political Economy 81(2 2) S279ndashS288
Becker S O and L Woessmann (2009) lsquoWas Weber Wrong A Human Capital Theory ofProtestant Economic Historyrsquo Quarterly Journal of Economics 124(2) 531ndash596
Besley T (1995) lsquoProperty Rights and Investment Incentives Theory and Evidence fromGhanarsquo Journal of Political Economy 103(5) 903ndash937
Bessey D (2013) lsquoReligion and Educational Attainment in East Asia First Evidence from theEast Asian Social Surveyrsquo Global Economic Review 42(3) 238ndash250
Boikos S A Bucci and T Stengos (2013) lsquoNon-Monotonicity of Fertility in Human CapitalAccumulation and Economic Growthrsquo Journal of Macroeconomics 38(A) 44ndash59
Burton-Jones A and J-C Spender (eds) (2011) The Oxford Handbook of Human CapitalOxford Oxford University Press
Castello-Climent A and A Hidalgo-Cabrillana (2012) lsquoThe Role of Educational Quality andQuantity in the Process of Economic Developmentrsquo Economics of Education Review31(4) 391ndash409
Centre for Research on the Epidemiology of Disasters - CRED (2014) lsquoInternational DisastersDatabase (EM-DAT)rsquo httpwwwemdatbe (accessed 20 June 2014)
Cervellati M and U Sunde (2005) lsquoHuman Capital Formation Life Expectancy and theProcess of Developmentrsquo American Economic Review 95(5) 1653ndash1672
Chiu W H (1998) lsquoIncome Inequality Human Capital Accumulation and EconomicPerformancersquo Economic Journal 108(446) 44ndash59
Cooray A and N Potrafke (2011) lsquoGender Inequality in Education Political Institutions orCulture and Religionrsquo European Journal of Political Economy 27(2) 268ndash280
Crespo Cuaresma J (2010) lsquoNatural Disasters and Human Capital Accumulationrsquo WorldBank Economic Review 24(2) 280ndash302
Davis L S and F Abdurazokzoda (2016) lsquoLanguage Culture and Institutions Evidencefrom a New Linguistic Datasetrsquo Journal of Comparative Economics 44(3) 541ndash561
httpswwwcambridgeorgcoreterms httpsdoiorg101017S174413741600028XDownloaded from httpswwwcambridgeorgcore University of Bath on 30 Apr 2017 at 131945 subject to the Cambridge Core terms of use available at
438 HORST FELDMANN
Dawson J W (1998) lsquoInstitutions Investment and Growth New Cross-Country and PanelData Evidencersquo Economic Inquiry 36(4) 603ndash619
De Gregorio J (1996) lsquoBorrowing Constraints Human Capital Accumulation and GrowthrsquoJournal of Monetary Economics 37(1) 49ndash71
Demirguc-Kunt A and V Maksimovic (1998) lsquoLaw Finance and Firm Growthrsquo Journal ofFinance 53(6) 2107ndash2137
Eterovic D S and C M Sweet (2014) lsquoDemocracy and Education in Twentieth-CenturyLatin Americarsquo Economics and Politics 26(2) 237ndash262
Faria H J and H M Montesinos (2009) lsquoDoes Economic Freedom Cause Prosperity AnIV Approachrsquo Public Choice 141(1ndash2) 103ndash127
Feenstra R C R Inklaar and M P Timmer (2013) lsquoPenn World Table 80rsquohttpwwwrugnlresearchggdcdatapenn-world-table (accessed 23 July 2013)
Feldmann H (2016a) lsquoWhich Religions Still Affect Schooling A Study of 143 CountriesrsquoComparative Sociology 15(4) 439ndash484
Feldmann H (2016b) lsquoThe Long Shadows of Spanish and French Colonial EducationrsquoKyklos 69(1) 32ndash64
Flug K A Spilimbergo and E Wachtenheim (1998) lsquoInvestment in Education Do EconomicVolatility and Credit Constraints Matterrsquo Journal of Development Economics 55(2)465ndash481
Forston J G (2011) lsquoMortality Risk and Human Capital Investment The Impact ofHIVAIDS in Sub-Saharan Africarsquo Review of Economics and Statistics 93(1)1ndash15
Freedom House (2014) Freedom in the World 2014 httpsfreedomhouseorg (accessed 20April 2014)
Glaeser E L R La Porta F Lopez-de-Silanes and A Shleifer (2004) lsquoDo Institutions CauseGrowthrsquo Journal of Economic Growth 9(3) 271ndash303
Griliches Z (1969) lsquoCapital-Skill Complementarityrsquo Review of Economics and Statistics51(4) 465ndash468
Grossmann V (2008) lsquoRisky Human Capital Investment Income Distribution andMacroeconomic Dynamicsrsquo Journal of Macroeconomics 30(1) 19ndash42
Gruber J H (2005) lsquoReligious Market Structure Religious Participation and Outcomes IsReligion Good for Yoursquo Advances in Economic Analysis and Policy 5(1) 1ndash30
Gwartney J D R A Lawson and J C Hall (2013) Economic Freedom of the World 2013Annual Report Vancouver BC Fraser Institute
Hall J C and R A Lawson (2014) lsquoEconomic Freedom of the World An Accounting of theLiteraturersquo Contemporary Economic Policy 32(1) 1ndash19
Hall R E and C I Jones (1999) lsquoWhy Do Some Countries Produce So Much More Outputper Worker than Othersrsquo Quarterly Journal of Economics 114(1) 83ndash116
Hansen L P (1982) lsquoLarge Sample Properties of Generalized Method of MomentsEstimatorsrsquo Econometrica 50(4) 1029ndash1054
Hanushek E A (1992) lsquoThe Trade-off between Child Quantity and Qualityrsquo Journal ofPolitical Economy 100(1) 84ndash117
Hausman J A (1978) lsquoSpecification Tests in Econometricsrsquo Econometrica 46(6) 1251ndash1271
Hausman J A and W E Taylor (1981) lsquoPanel Data and Unobservable Individual EffectsrsquoEconometrica 49(6) 1377ndash1398
Heylen F and L Pozzi (2007) lsquoCrises and Human Capital Accumulationrsquo Canadian Journalof Economics 40(4) 1261ndash1285
httpswwwcambridgeorgcoreterms httpsdoiorg101017S174413741600028XDownloaded from httpswwwcambridgeorgcore University of Bath on 30 Apr 2017 at 131945 subject to the Cambridge Core terms of use available at
Economic freedom and human capital investment 439
IMF (2014) lsquoWorld Economic Outlook Database April 2014 Editionrsquo httpwwwimforg(accessed 9 May 2014)
Kalemli-Ozcan S H E Ryder and D N Weil (2000) lsquoMortality Decline Human CapitalInvestment and Economic Growthrsquo Journal of Development Economics 62(1) 1ndash23
King E M C E Montenegro and P F Orazem (2012) lsquoEconomic Freedom Human Rightsand the Returns to Human Capital An Evaluation of the Schultz Hypothesisrsquo EconomicDevelopment and Cultural Change 61(1) 39ndash72
Kleibergen F and R Paap (2006) lsquoGeneralized Reduced Rank Tests Using the Singular ValueDecompositionrsquo Journal of Econometrics 133(1) 97ndash126
Laeven L and F Valencia (2013) lsquoSystemic Banking Crises Databasersquo IMF EconomicReview 61(2) 225ndash270
Lake D A and M A Baum (2001) lsquoThe Invisible Hand of Democracy Political Controland the Provision of Public Servicesrsquo Comparative Political Studies 34(6) 587ndash621
La Porta R F Lopez-de-Silanes A Shleifer and R Vishny (1999) lsquoThe Quality ofGovernmentrsquo Journal of Law Economics and Organization 15(1) 222ndash279
Lipset S M (1960) Political Man The Social Bases of Politics Garden City NY DoubledayMaoz Z and E A Henderson (2013) lsquoThe World Religion Dataset Version 11rsquo
httpwwwcorrelatesofwarorg (accessed 11 February 2014)Marshall M G T R Gurr and K Jaggers (2014) lsquoPolity IV Project Political Regime Char-
acteristics and Transitions 1800-2013 Version 2013rsquo httpwwwsystemicpeaceorg(accessed 4 June 2014)
Mendez F and F Sepulveda (2012) lsquoThe Cyclicality of Skill Acquisition Evidence from PanelDatarsquo American Economic Journal Macroeconomics 4(3) 128ndash152
Miller T and A B Kim (2016) 2016 Index of Economic Freedom Washington DC HeritageFoundation New York Wall Street Journal
Mincer J (1996) lsquoEconomic Development Growth of Human Capital and the Dynamics ofthe Wage Structurersquo Journal of Economic Growth 1(1) 29ndash48
Neal D (1997) lsquoThe Effects of Catholic Secondary Schooling on Educational AchievementrsquoJournal of Labor Economics 15(1 1) 98ndash123
Norton S W and A Tomal (2009) lsquoReligion and Female Educational Attainmentrsquo Journalof Money Credit and Banking 41(5) 961ndash986
Papagapitos A and R Riley (2009) lsquoSocial Trust and Human Capital Formationrsquo EconomicsLetters 102(3) 158ndash160
Ranjan P (2001) lsquoDynamic Evolution of Income Distribution and Credit-ConstrainedHuman Capital Investment in Open Economiesrsquo Journal of International Economics55(2) 329ndash358
Roodman D (2009a) lsquoA Note on the Theme of Too Many Instrumentsrsquo Oxford Bulletin ofEconomics and Statistics 71(1) 135ndash158
Roodman D (2009b) lsquoHow to Do xtabond2 An Introduction to Difference and SystemGMM in Statarsquo Stata Journal 9(1) 86ndash136
Rudra N and S Haggard (2005) lsquoGlobalization Democracy and Effective Welfare Spendingin the Developing Worldrsquo Comparative Political Studies 38(9) 1015ndash1049
Schultz T W (1975) lsquoThe Value of the Ability to Deal with Disequilibriarsquo Journal ofEconomic Literature 13(3) 827ndash846
Shea J (1997) lsquoInstrument Relevance in Multivariate Linear Models A Simple MeasurersquoReview of Economics and Statistics 49(2) 348ndash352
Sherkat D E (2011) lsquoReligion and Scientific Literacy in the United Statesrsquo Social ScienceQuarterly 92(5) 1134ndash1150
httpswwwcambridgeorgcoreterms httpsdoiorg101017S174413741600028XDownloaded from httpswwwcambridgeorgcore University of Bath on 30 Apr 2017 at 131945 subject to the Cambridge Core terms of use available at
440 HORST FELDMANN
Skidmore M and H Toya (2002) lsquoDo Natural Disasters Promote Long-Run GrowthrsquoEconomic Inquiry 40(4) 664ndash687
Soares R R (2005) lsquoMortality Reductions Educational Attainment and Fertility ChoicersquoAmerican Economic Review 95(3) 580ndash601
Solt F (2013) lsquoStandardized World Income Inequality Database Version 4rsquohttpmywebuiowaedufsoltswiidswiidhtml (accessed 24 October 2013)
Staiger D and J H Stock (1997) lsquoInstrumental Variables Regression with WeakInstrumentsrsquo Econometrica 65(3) 557ndash586
Stoler A and D Meltzer (2013) lsquoMortality and Morbidity Risks and Economic BehaviorrsquoHealth Economics 22(2) 132ndash143
UNESCO Institute for Statistics (2015) lsquoEducation Statisticsrsquo httpwwwuisunescoorg(accessed 2 September 2015)
World Bank (2013) lsquoGlobal Financial Development Databasersquo httpdataworldbankorg(accessed 6 January 2014)
World Bank (2014) lsquoWorld Development Indicatorsrsquo httpdataworldbankorg (accessed 6June 2014)
httpswwwcambridgeorgcoreterms httpsdoiorg101017S174413741600028XDownloaded from httpswwwcambridgeorgcore University of Bath on 30 Apr 2017 at 131945 subject to the Cambridge Core terms of use available at
Econom
icfreedom
andhum
ancapitalinvestm
ent441
Appendix A
Table A1 List of variables
Definition Mean Std dev Min Max Source
Death rate Number of deaths per 1000 people 978 409 254 3548 World Bank (2014)Democracy lsquoPolity2rsquo index scaled to range from 0 (strongly autocratic) to
1 (strongly democratic) The index measures the degree ofautocracydemocracy based on the competitiveness andregulation of political participation the openness andcompetitiveness of executive recruitment and the constraintson the chief executive of the political regime
070 034 000 100 Marshall et al (2014)
Eastern religionspopulation
Decimal fraction of the population adhering to an Easternreligion (Buddhism Confucianism Hinduism JainismShinto Sikhism Taoism)
006 018 000 091 Maoz and Henderson(2013) authorrsquoscalculations
Economic freedom lsquoEconomic Freedom of the World (EFW)rsquo chain-linkedsummary index scaled to range from 0 (least free) to 1(most free) The index measures the degree of economicfreedom in the following five areas size of governmentlegal system and property rights sound money freedom totrade internationally regulation The summary ratings ofthe index are the arithmetic means of the area ratings
060 012 029 086 Gwartney et al (2013)authorrsquos calculations
Female secondaryenrollment rate
Girls enrolled in secondary education regardless of age as apercentage of girls in the age group that officiallycorresponds to this level of education
7031 3390 230 16737 UNESCO Institute forStatistics (2015)
GDP growth rate Annual growth rate of real GDP decimal fraction 004 003 minus 014 020 IMF (2014) World Bank(2014)
GDP per capita Expenditure side real GDP per capita at chained purchasingpower parity rates in tens of thousands of 2005 US dollars
106 102 002 560 Feenstra et al (2013)authorrsquos calculations
httpsww
wcam
bridgeorgcoreterms httpsdoiorg101017S174413741600028X
Dow
nloaded from httpsw
ww
cambridgeorgcore U
niversity of Bath on 30 Apr 2017 at 131945 subject to the Cambridge Core term
s of use available at
442H
OR
ST
FE
LD
MA
NN
Table A1 (Continued)
Definition Mean Std dev Min Max Source
Income inequality Standardized Gini coefficients of inequality in householdmarket (pre-tax pre-transfer) income scaled to take valuesbetween 0 (perfect equality) and 1 (perfect inequality)
044 009 021 075 Solt (2013)
Inflation rate Annual change in the consumer price index decimal fraction 036 299 minus 004 6185 IMF (2014) World Bank(2014)
Life expectancy Life expectancy at birth in years 6707 1008 2969 8192 World Bank (2014)Muslim population Decimal fraction of the population adhering to Islam 018 032 000 099 Maoz and Henderson
(2013)Natural disasters Total number of persons affected by natural disasters as a
decimal fraction of the population Natural disasters includeclimate-related disasters (eg storms floods and droughts)geological disasters (eg earthquakes volcanic eruptions)and biological disasters (eg epidemics insect infestations)For a disaster to be counted it needs to meet at least one ofthe following criteria 10 or more people reported killed100 or more people reported otherwise affected a state ofemergency was declared or a call for international assistancewas issued Total number of persons affected includes thosekilled injured homeless or requiring immediate assistance
001 003 000 023 Centre for Research on theEpidemiology ofDisasters - CRED (2014)World Bank (2014)authorrsquos calculations
Openness Sum of exports and imports of goods and services as a decimalfraction of GDP
071 037 013 253 World Bank (2014)
Physical capital stock Real physical capital stock at constant 2005 national prices intrillion 2005 US dollars
101 324 000 3664 Feenstra et al (2013)
Physical investment Gross capital formation as a decimal fraction of GDP Itconsists of outlays on additions to the fixed assets of theeconomy plus net changes in the level of inventories
022 006 002 041 World Bank (2014)
httpsww
wcam
bridgeorgcoreterms httpsdoiorg101017S174413741600028X
Dow
nloaded from httpsw
ww
cambridgeorgcore U
niversity of Bath on 30 Apr 2017 at 131945 subject to the Cambridge Core term
s of use available at
Econom
icfreedom
andhum
ancapitalinvestm
ent443
Table A1 (Continued)
Definition Mean Std dev Min Max Source
Political freedom Average of political rights and civil liberties ratings Politicalrights include the right to form political parties to competefor public office and to elect representatives who have adecisive vote on public policies Civil liberties includereligious ethnic economic linguistic gender and familyrights personal freedoms and freedom of the press beliefand association The index which is based on surveysamong analysts and academics is scaled to range from 0 to1 with higher values representing more political rights andcivil liberties (or more respect for or more protection ofpolitical rights and civil liberties)
066 030 000 100 Freedom House (2014)authorrsquos calculations
Population growth rate Annual growth rate of the population decimal fraction 002 001 minus 003 008 World Bank (2014)Private credit The financial resources provided to the private sector by
deposit money banks and other financial institutions as adecimal fraction of GDP Domestic money banks comprisecommercial banks and other financial institutions thataccept transferable deposits such as demand deposits
044 039 000 217 World Bank (2013)
Protestant population Decimal fraction of the population adhering to Protestantism 017 024 000 094 Maoz and Henderson(2013)
Public spending oneducation
Public spending on education as a decimal fraction of GDP Itconsists of current and capital public expenditure oneducation and includes government spending on educationalinstitutions (both public and private) educationadministration as well as subsidies for private entities(studentshouseholds and other private entities)
004 002 001 036 World Bank (2014)
httpsww
wcam
bridgeorgcoreterms httpsdoiorg101017S174413741600028X
Dow
nloaded from httpsw
ww
cambridgeorgcore U
niversity of Bath on 30 Apr 2017 at 131945 subject to the Cambridge Core term
s of use available at
444H
OR
ST
FE
LD
MA
NN
Table A1 (Continued)
Definition Mean Std dev Min Max Source
Religious pluralism One minus the Herfindahl index of religious group sharesreflecting the probability that two randomly selectedindividuals from a population belong to different groups
029 019 002 071 Maoz and Henderson(2013) authorrsquoscalculations
Roman Catholicpopulation
Decimal fraction of the population adhering to RomanCatholic religion
035 036 000 098 Maoz and Henderson(2013)
Secondary enrollmentrate
Children enrolled in secondary education regardless of age asa percentage of the age group that officially corresponds tothis level of education
7099 3175 342 15482 UNESCO Institute forStatistics (2015)
Systemic banking crises Dummy variable that takes the value 1 if in the respectiveyear the country experienced a systemic banking crisis Abanking crisis is defined as systemic if two conditions aremet first significant signs of financial distress in thebanking system (as indicated by significant bank runs lossesin the banking system or bank liquidations) and secondsignificant banking policy intervention measures in responseto significant losses in the banking system
008 021 000 100 Laeven and Valencia(2013)
Urbanization rate People living in urban areas as a decimal fraction of the totalpopulation
055 023 004 098 World Bank (2014)
Wars Military and civilian deaths in battle-related conflicts per1000 people
001 005 000 096 World Bank (2014)authorrsquos calculations
httpsww
wcam
bridgeorgcoreterms httpsdoiorg101017S174413741600028X
Dow
nloaded from httpsw
ww
cambridgeorgcore U
niversity of Bath on 30 Apr 2017 at 131945 subject to the Cambridge Core term
s of use available at
Economic freedom and human capital investment 445
Appendix B List of countries
Albania Argentina Australia Austria Bahamas Bahrain Bangladesh BarbadosBelgium Belize Benin Bolivia Botswana Bulgaria Burundi Cameroon CanadaCentral African Republic Chad China Colombia Costa Rica Cote drsquoIvoireCroatia Cyprus Czech Republic Democratic Republic of the Congo DenmarkDominican Republic Ecuador Egypt El Salvador Estonia Fiji Finland FranceGabon Germany Ghana Greece Guatemala Guinea Bissau Honduras HungaryIceland India Indonesia Iran Ireland Israel Italy Jamaica Japan JordanKenya Kuwait Latvia Lithuania Luxembourg Madagascar Malawi MalaysiaMali Malta Mauritius Mexico Morocco Namibia Nepal Netherlands NewZealand Niger Nigeria Norway Oman Pakistan Panama Paraguay PeruPhilippines Poland Portugal Republic of the Congo Romania Russia RwandaSenegal Slovakia Slovenia South Africa South Korea Spain Sri Lanka SwedenSwitzerland Syria Tanzania Thailand Togo Trinidad and Tobago TunisiaTurkey Uganda Ukraine United Kingdom United States Uruguay ZambiaZimbabwe
httpswwwcambridgeorgcoreterms httpsdoiorg101017S174413741600028XDownloaded from httpswwwcambridgeorgcore University of Bath on 30 Apr 2017 at 131945 subject to the Cambridge Core terms of use available at
- 1 Introduction
- 2 Variables
- 3 Sample and methodology
- 4 Results
- 5 Conclusion
- References
- Appendix B List of countries
-
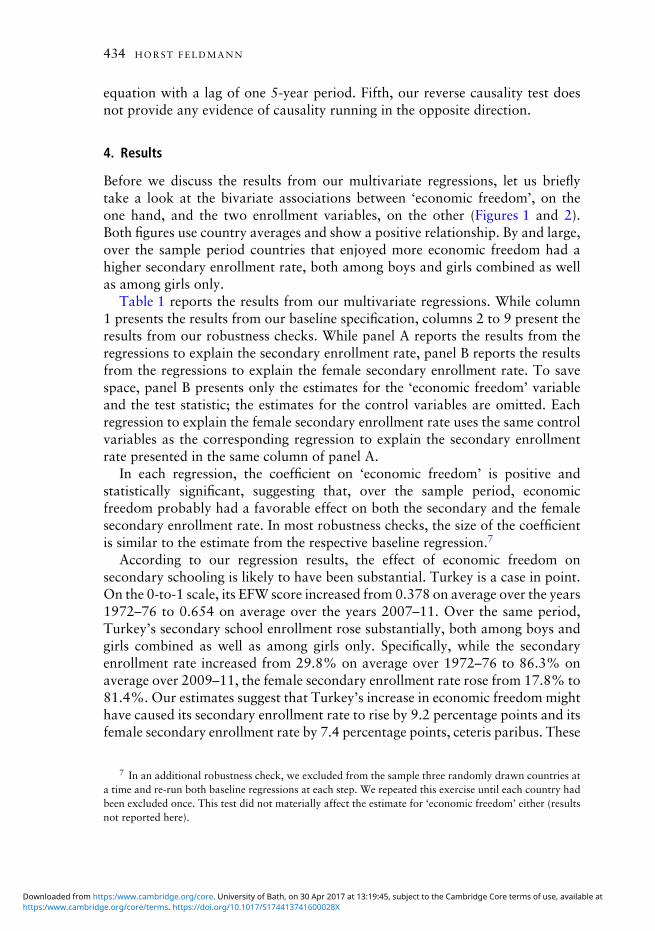
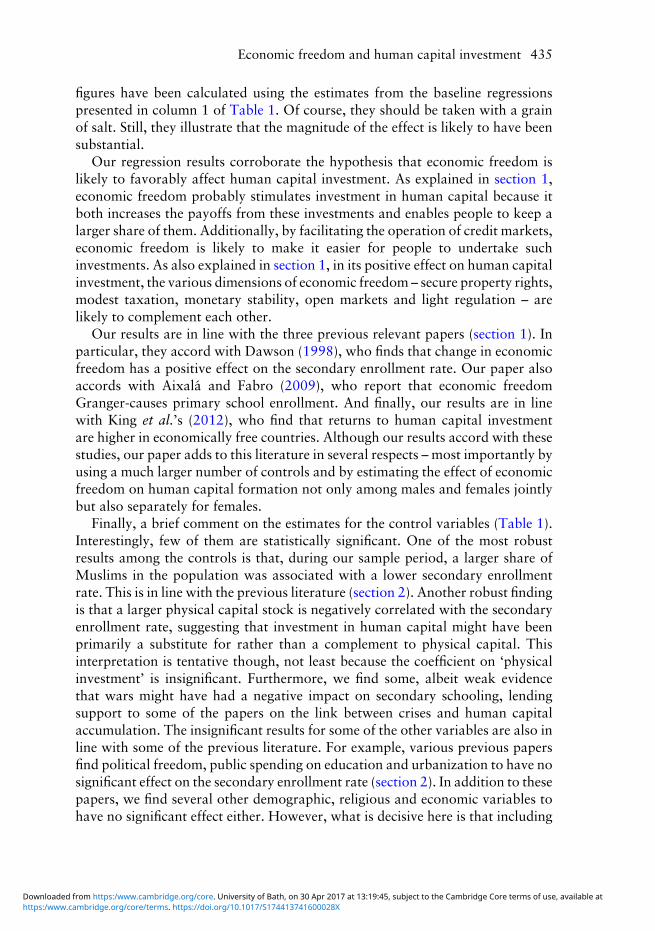

Econom
icfreedom
andhum
ancapitalinvestm
ent441
Appendix A
Table A1 List of variables
Definition Mean Std dev Min Max Source
Death rate Number of deaths per 1000 people 978 409 254 3548 World Bank (2014)Democracy lsquoPolity2rsquo index scaled to range from 0 (strongly autocratic) to
1 (strongly democratic) The index measures the degree ofautocracydemocracy based on the competitiveness andregulation of political participation the openness andcompetitiveness of executive recruitment and the constraintson the chief executive of the political regime
070 034 000 100 Marshall et al (2014)
Eastern religionspopulation
Decimal fraction of the population adhering to an Easternreligion (Buddhism Confucianism Hinduism JainismShinto Sikhism Taoism)
006 018 000 091 Maoz and Henderson(2013) authorrsquoscalculations
Economic freedom lsquoEconomic Freedom of the World (EFW)rsquo chain-linkedsummary index scaled to range from 0 (least free) to 1(most free) The index measures the degree of economicfreedom in the following five areas size of governmentlegal system and property rights sound money freedom totrade internationally regulation The summary ratings ofthe index are the arithmetic means of the area ratings
060 012 029 086 Gwartney et al (2013)authorrsquos calculations
Female secondaryenrollment rate
Girls enrolled in secondary education regardless of age as apercentage of girls in the age group that officiallycorresponds to this level of education
7031 3390 230 16737 UNESCO Institute forStatistics (2015)
GDP growth rate Annual growth rate of real GDP decimal fraction 004 003 minus 014 020 IMF (2014) World Bank(2014)
GDP per capita Expenditure side real GDP per capita at chained purchasingpower parity rates in tens of thousands of 2005 US dollars
106 102 002 560 Feenstra et al (2013)authorrsquos calculations
httpsww
wcam
bridgeorgcoreterms httpsdoiorg101017S174413741600028X
Dow
nloaded from httpsw
ww
cambridgeorgcore U
niversity of Bath on 30 Apr 2017 at 131945 subject to the Cambridge Core term
s of use available at
442H
OR
ST
FE
LD
MA
NN
Table A1 (Continued)
Definition Mean Std dev Min Max Source
Income inequality Standardized Gini coefficients of inequality in householdmarket (pre-tax pre-transfer) income scaled to take valuesbetween 0 (perfect equality) and 1 (perfect inequality)
044 009 021 075 Solt (2013)
Inflation rate Annual change in the consumer price index decimal fraction 036 299 minus 004 6185 IMF (2014) World Bank(2014)
Life expectancy Life expectancy at birth in years 6707 1008 2969 8192 World Bank (2014)Muslim population Decimal fraction of the population adhering to Islam 018 032 000 099 Maoz and Henderson
(2013)Natural disasters Total number of persons affected by natural disasters as a
decimal fraction of the population Natural disasters includeclimate-related disasters (eg storms floods and droughts)geological disasters (eg earthquakes volcanic eruptions)and biological disasters (eg epidemics insect infestations)For a disaster to be counted it needs to meet at least one ofthe following criteria 10 or more people reported killed100 or more people reported otherwise affected a state ofemergency was declared or a call for international assistancewas issued Total number of persons affected includes thosekilled injured homeless or requiring immediate assistance
001 003 000 023 Centre for Research on theEpidemiology ofDisasters - CRED (2014)World Bank (2014)authorrsquos calculations
Openness Sum of exports and imports of goods and services as a decimalfraction of GDP
071 037 013 253 World Bank (2014)
Physical capital stock Real physical capital stock at constant 2005 national prices intrillion 2005 US dollars
101 324 000 3664 Feenstra et al (2013)
Physical investment Gross capital formation as a decimal fraction of GDP Itconsists of outlays on additions to the fixed assets of theeconomy plus net changes in the level of inventories
022 006 002 041 World Bank (2014)
httpsww
wcam
bridgeorgcoreterms httpsdoiorg101017S174413741600028X
Dow
nloaded from httpsw
ww
cambridgeorgcore U
niversity of Bath on 30 Apr 2017 at 131945 subject to the Cambridge Core term
s of use available at
Econom
icfreedom
andhum
ancapitalinvestm
ent443
Table A1 (Continued)
Definition Mean Std dev Min Max Source
Political freedom Average of political rights and civil liberties ratings Politicalrights include the right to form political parties to competefor public office and to elect representatives who have adecisive vote on public policies Civil liberties includereligious ethnic economic linguistic gender and familyrights personal freedoms and freedom of the press beliefand association The index which is based on surveysamong analysts and academics is scaled to range from 0 to1 with higher values representing more political rights andcivil liberties (or more respect for or more protection ofpolitical rights and civil liberties)
066 030 000 100 Freedom House (2014)authorrsquos calculations
Population growth rate Annual growth rate of the population decimal fraction 002 001 minus 003 008 World Bank (2014)Private credit The financial resources provided to the private sector by
deposit money banks and other financial institutions as adecimal fraction of GDP Domestic money banks comprisecommercial banks and other financial institutions thataccept transferable deposits such as demand deposits
044 039 000 217 World Bank (2013)
Protestant population Decimal fraction of the population adhering to Protestantism 017 024 000 094 Maoz and Henderson(2013)
Public spending oneducation
Public spending on education as a decimal fraction of GDP Itconsists of current and capital public expenditure oneducation and includes government spending on educationalinstitutions (both public and private) educationadministration as well as subsidies for private entities(studentshouseholds and other private entities)
004 002 001 036 World Bank (2014)
httpsww
wcam
bridgeorgcoreterms httpsdoiorg101017S174413741600028X
Dow
nloaded from httpsw
ww
cambridgeorgcore U
niversity of Bath on 30 Apr 2017 at 131945 subject to the Cambridge Core term
s of use available at
444H
OR
ST
FE
LD
MA
NN
Table A1 (Continued)
Definition Mean Std dev Min Max Source
Religious pluralism One minus the Herfindahl index of religious group sharesreflecting the probability that two randomly selectedindividuals from a population belong to different groups
029 019 002 071 Maoz and Henderson(2013) authorrsquoscalculations
Roman Catholicpopulation
Decimal fraction of the population adhering to RomanCatholic religion
035 036 000 098 Maoz and Henderson(2013)
Secondary enrollmentrate
Children enrolled in secondary education regardless of age asa percentage of the age group that officially corresponds tothis level of education
7099 3175 342 15482 UNESCO Institute forStatistics (2015)
Systemic banking crises Dummy variable that takes the value 1 if in the respectiveyear the country experienced a systemic banking crisis Abanking crisis is defined as systemic if two conditions aremet first significant signs of financial distress in thebanking system (as indicated by significant bank runs lossesin the banking system or bank liquidations) and secondsignificant banking policy intervention measures in responseto significant losses in the banking system
008 021 000 100 Laeven and Valencia(2013)
Urbanization rate People living in urban areas as a decimal fraction of the totalpopulation
055 023 004 098 World Bank (2014)
Wars Military and civilian deaths in battle-related conflicts per1000 people
001 005 000 096 World Bank (2014)authorrsquos calculations
httpsww
wcam
bridgeorgcoreterms httpsdoiorg101017S174413741600028X
Dow
nloaded from httpsw
ww
cambridgeorgcore U
niversity of Bath on 30 Apr 2017 at 131945 subject to the Cambridge Core term
s of use available at
Economic freedom and human capital investment 445
Appendix B List of countries
Albania Argentina Australia Austria Bahamas Bahrain Bangladesh BarbadosBelgium Belize Benin Bolivia Botswana Bulgaria Burundi Cameroon CanadaCentral African Republic Chad China Colombia Costa Rica Cote drsquoIvoireCroatia Cyprus Czech Republic Democratic Republic of the Congo DenmarkDominican Republic Ecuador Egypt El Salvador Estonia Fiji Finland FranceGabon Germany Ghana Greece Guatemala Guinea Bissau Honduras HungaryIceland India Indonesia Iran Ireland Israel Italy Jamaica Japan JordanKenya Kuwait Latvia Lithuania Luxembourg Madagascar Malawi MalaysiaMali Malta Mauritius Mexico Morocco Namibia Nepal Netherlands NewZealand Niger Nigeria Norway Oman Pakistan Panama Paraguay PeruPhilippines Poland Portugal Republic of the Congo Romania Russia RwandaSenegal Slovakia Slovenia South Africa South Korea Spain Sri Lanka SwedenSwitzerland Syria Tanzania Thailand Togo Trinidad and Tobago TunisiaTurkey Uganda Ukraine United Kingdom United States Uruguay ZambiaZimbabwe
httpswwwcambridgeorgcoreterms httpsdoiorg101017S174413741600028XDownloaded from httpswwwcambridgeorgcore University of Bath on 30 Apr 2017 at 131945 subject to the Cambridge Core terms of use available at
- 1 Introduction
- 2 Variables
- 3 Sample and methodology
- 4 Results
- 5 Conclusion
- References
- Appendix B List of countries
-
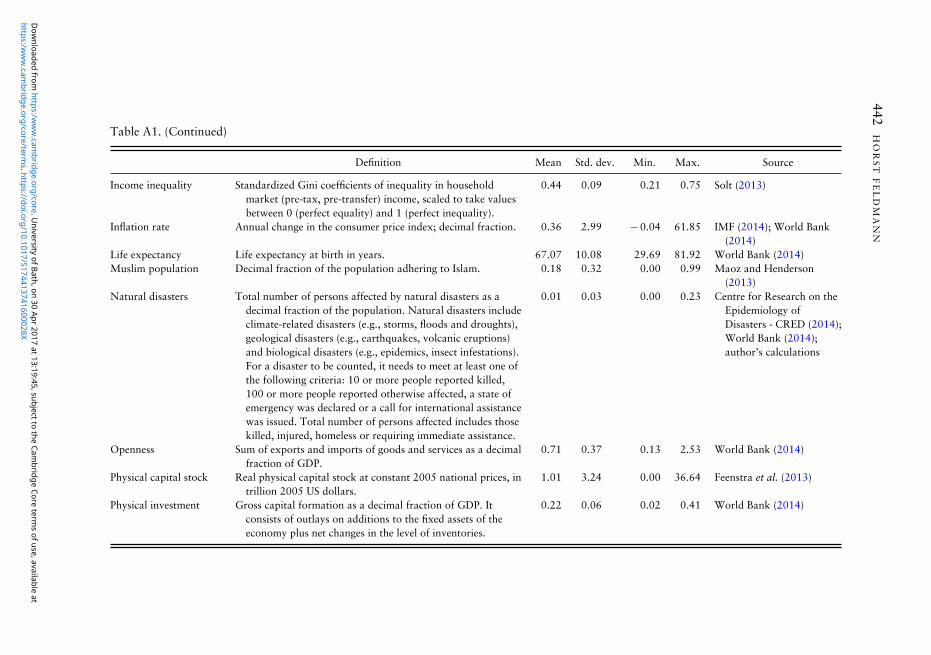
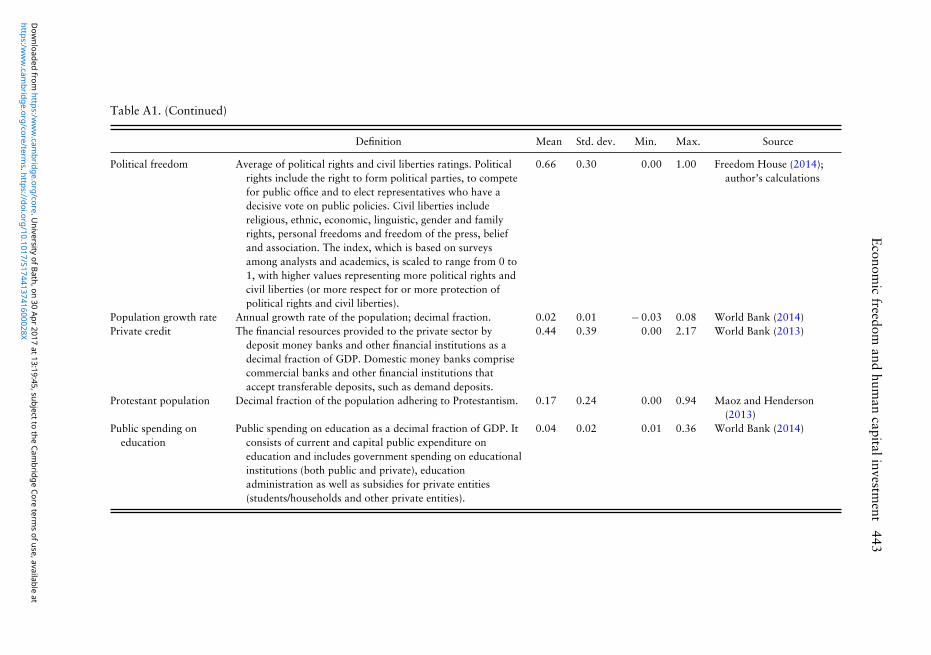
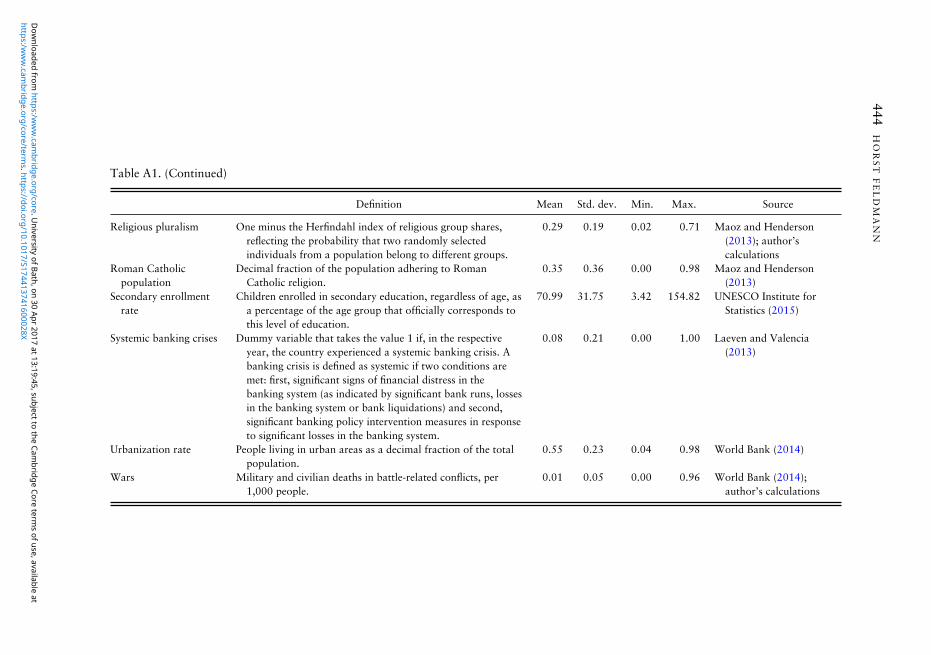
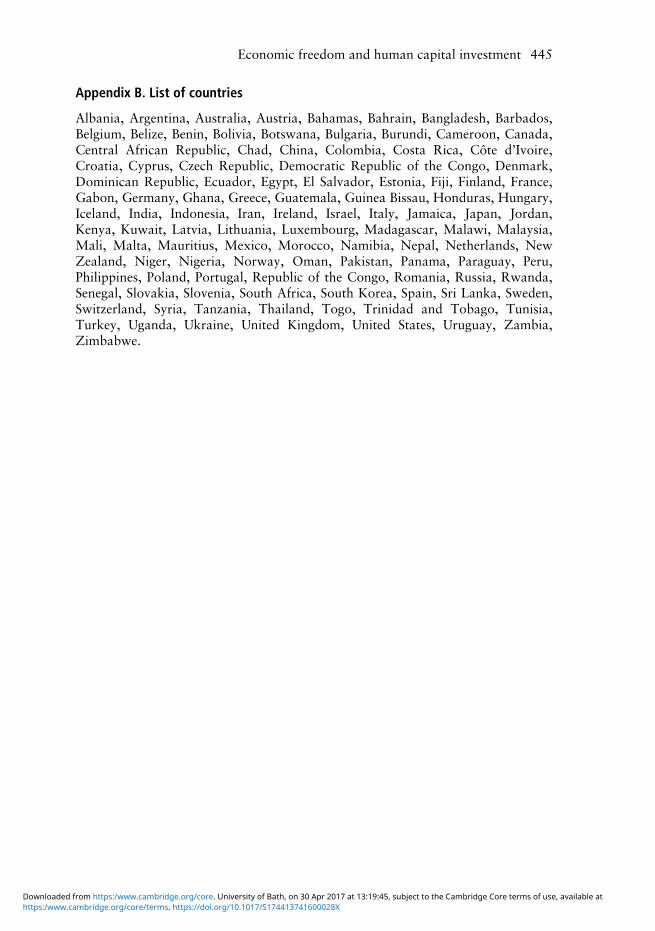