economic impact of craft breweries in temecula, ca 2019
TRANSCRIPT

1
Economic Impact of Craft Breweries in Temecula,
CA 2019
California State University San Marcos (CSUSM)
Office of Business Research and Analysis (OBRA)
333 S. Twin Oaks Valley Road
San Marcos, CA 92096
www.csusm.edu/coba
Temecula Valley Brewers Guild
41000 Main Street
Temecula, CA 92590
www.temecula.gov
City of Temecula
41000 Main Street
Temecula, CA 92590
www.temecula.gov
Copyright © 2019 by CSUSM
Printed in the United States of America
Publishers:
Miguel de Jesus, CSUSM
Dr. Ranjeeta Basu, CSUSM
Ann Fiegen, CSUSM
Roger Herzler, CSUSM
Craft Brewing Industry Advisor:
Todd Colburn, CSUSM, SDBG
Research Team Leaders:
Amanda Boudreault
Maddie Diaz
Research Team Members:

2
Samantha Hoover
Mert Kocyigit
Bert Salazar
Layout:
Amanda Boudreault
Maddie Diaz
For questions about this report, contact:
Miguel de Jesus
(760) 750-4266
Executive Summary
The craft beer industry has continued to remain a growing industry in the United States,
with revenue growth expected to increase into 2023. U.S. non-craft beer sales have
declined over the past several years while U.S. craft beer sales continue to increase.
In 2017, the U.S. Congress passed legislation that included a two-year provision of the
Craft Beverage Modernization and Tax Reform Act (CBMTRA), which lowered the
Federal Excise Tax (FET) for breweries for a period of two years and was set to expire
on December 31, 2019. In February 2019, the CBMTRA was reintroduced and, if
approved, will make the current federal excise rate language permanent.
In 2018, California had over 900 craft breweries, ranking number one in the United
States.
Temecula, California is home to ten craft breweries and had a total economic output of
approximately $37.3M in 2018. In comparison, the Temecula Valley Balloon and Wine
Festival had about $2.8M in economic output in 2018. Temecula craft brewers donated
over $80,000 to various local organizations in 2018.
Temecula craft brewers have a positive industry outlook over the next 12 months.
Based on surveys conducted, a confidence diffusion index of 71.36 was recorded,
indicating that the brewers are optimistic about the future growth and development of
their operations.
The Temecula Valley Brewers Guild was founded in 2017 and, therefore, has
opportunities within the industry to increase its visibility. To increase visibility, OBRA
recommends that the Temecula Valley Brewers Guild create a website highlighting the

3
brewers’ award-winning beer, philanthropic donations, and an interactive map showing
the craft brewery locations.
About This Report
This report analyzes the economic impact of craft brewers in Temecula, CA and was
produced by the Office of Business Research and Analysis (OBRA) at California State
University San Marcos, which is a joint effort between the College of Business
Administration, the department of Economics, and the University Library. This report
was published in conjunction with the Temecula Valley Brewers Guild and the City of
Temecula.
Data
The data supporting this report was collected from several sources during the first
quarter
of 2019. A combination of survey data and secondary sources were used. Each data
source has varying effective dates and every precaution has been taken to ensure
relative comparability.
IMPLAN
To measure and quantify the flow of dollars through the Temecula, CA economy, OBRA
used leading economic impact software, called IMPLAN®. IMPLAN® is advanced input-
output modeling software with regional data and economic multipliers built in. IMPLAN®
extracts and measures data from local sources, rather than extrapolating regional data
from national averages, to incorporate regional trade-flow assumptions and economic
multipliers into customizable models to view economic impacts.
InDesign
InDesign was used to design the layout of the report. This software creates posters,
brochures, newspapers, and ebooks through Adobe software. InDesign publishes
content in conjunction with Adobe Digital Publishing Suite and exports to multiple
platforms. Primary users of InDesign include graphic designers and production artists
for publications, print media, and posters.
ReferenceUSA
ReferenceUSA® is an Infogroup company that hosts an online database containing
information about businesses and consumers throughout the nation. Since its founding
in 1992, ReferenceUSA® has collected up-to-date revenue and employment data from
businesses through a combination of surveys and direct phone call verification. For

4
those businesses unable to provide complete data, ReferenceUSA® uses advanced
economic modeling techniques to ascribe figures based on aggregated data from the
U.S. Department of Commerce.
Qualtrics
Qualtrics is a survey tool used to distribute surveys and track results. Qualtrics was
used to collect and compile survey data from the breweries in Temecula, CA.
Photographs
The photographs were taken by Jimmy Fu of Jimmy Fu-tography at local craft breweries
in Temecula, including Stone Church Brewing, Aftershock Brewing Co., Black Market
Brewing Co., Garage Brewing Co., Ironfire Brewing Company, Karl Strauss Brewing
Company, Refuge Brewery, Relentless Brewing Co., Wiens Brewing Company, and
Craft Brewing Company.
The Craft Beer Industry
Craft brewers, as defined by the national Brewers Association (BA), are those that
produce 6 million barrels or less per year, are independently owned (25% or less
ownership by a non-craft beverage alcohol industry entity), and have a TTB Brewer's
Notice². In 2017, the craft beer industry provided more than 500,000 jobs and
contributed $76.2B to the U.S. economy².
To distinguish between craft and non-craft brewers, the Independent Craft Brewer Seal
is used. This seal is a national effort, spearheaded by the Brewers Association, to
provide consumers with an easy way to identify independent craft brewers. As of June
2019, over 4,000 independent craft brewers in the United States have adopted the
seal².
The craft beer industry has continued to remain a growing industry in the United States¹.
The industry has experienced revenue growth over the five years to 2018, increasing at
an annualized rate of 11.8% to reach an estimated $6.8 billion¹. As consumers demand
a greater variety of beers, craft brewers have captured consumers that had traditionally
purchased light and premium brand beers. The industry has also attracted these
consumers by using quality ingredients, providing a high degree of expertise, and
serving fresh craft beer¹.
The industry comprises of many small-sized players, but there has been increasing
consolidation and expansion activity among some of the industry’s largest brewers.
Brewers such as Magic Hat Brewing Company, Ballast Point Brewing Company

5
(Temecula location closed in 2019), Dogfish Head, and Lagunitas Brewing Company,
once significant craft brewers, have been acquired by major beer companies and are no
longer classified as craft brewers by the Brewers Association¹.
Although the revenue growth among the industry is plateauing due to market saturation,
consumer demand for craft beer remains robust¹. As a result of market saturation,
between 2018 and 2023, the industry is expected to grow at an annualized rate of 1.5%
to $7.3 billion¹.
U.S. non-craft beer sales volume has steadily decreased over the past several years,
while U.S. craft beer sales volume has steadily increased. In 2018, U.S. craft beer sales
volume was 13.2% of overall beer sales, representing a growth over 2017 of about
4.8%². Figure 1 represents a graph showing growth in U.S. craft beer sales volume over
the past several years compared to U.S. non-craft beer sales volume.
FIGURE 1: VOLUME SHARE OF BEER IN THE U.S.
In 2018, there were 25.9 million barrels of craft beer produced in the U.S., which
represents a growth rate over 2017 of about 4%². See Figure 2 for a graph showing
craft barrels produced in the U.S. since 2013 by contract brewers, regional brewers,
microbreweries, and brewpubs. Microbreweries have experienced significant growth
over the past several years, including a growth rate of about 47% over 2015². In

6
comparison, regional brewers have produced a steady amount of craft barrels over the
past several years, with a growth rate of about 2% over 2015².
FIGURE 2: CRAFT BARRELS PRODUCED IN THE U.S.
India Pale Ale (IPA) is the most popular beer among U.S. craft beer drinkers,
representing 25.2% of industry revenue in 2018¹. Belgian White is the second most
popular beer, representing 20.6% of industry revenue. Together, IPA and Belgian White
comprised of nearly half of industry revenue (45.8%) in 2018. See Figure 3 for a graph
showing a breakdown of industry product segmentation.
FIGURE 3: 2018 INDUSTRY PRODUCT SEGMENTATION

7
Source: IBISWorld
Size and Growth
The U.S. Department of Treasury’s Alcohol and Tobacco Tax and Trade Bureau (TTB)
grants states the authority to oversee alcohol and beverage control. The California
Department of Alcoholic Beverage Control (ABC) regulates manufacturers and
purveyors of alcohol via licensing within California. The three types of ABC licenses
discussed in this report are:
Type 1: Beer Manufacturer (Larger Brewer)
Type 23: Small Beer Manufacturer
Type 75: On Sale General (Brewpub)
Although the TTB count does not solely reflect active brewers in the marketplace, it is
still a strong indicator as to the size and relative growth of the industry in terms of firms
operating in the marketplace. According to the Brewers Association, there were over
7,000 active breweries in the United States in 2018². TTB license growth has
accelerated since 2011. In 2018, there were a total of 1,236 active California TTB
licenses, which represents an 11.8% growth rate over 2017. The number of TTB
licenses has more than tripled since 2011. Figure 4 shows the number of active
California TTB licenses over the past several years.
FIGURE 4: CA ACTIVE TTB LICENSES

8
Craft Beer Taxes
The Federal Excise Tax (FET) on alcoholic beverages is imposed at the manufacturer
and importer level, based on the per unit production or importation of alcoholic
beverages (e.g., distilled spirits, wine, and beer) for sale in the U.S. market. When
converted to standard drink measures, liquor drinks are generally subjected to a federal
excise tax of approximately 13 cents per 1.5 ounce shot, wine is taxed at 4 cents per 5
ounce glass, and beer is taxed at 5 cents per 12 ounce can or bottle.
At the end of 2017, the United States Congress passed legislation that included a two-
year provision of the Craft Beverage Modernization and Tax Reform Act (CBMTRA),
which lowered the Federal Excise Tax (FET) for breweries, wineries, and distilled spirits
producers for a period of two years and was set to expire on December 31, 2019.
According to the Brewers Association, in February 2019, the CBMTRA was
reintroduced to Congress and, if approved, would make the current federal excise rate
language permanent².
Since the enactment of CBMTRA, 99% of small brewers have realized a 50% reduction
of their federal excise tax (from $7/barrel to $3.50/barrel). This enables brewers to
increase investments, improve health care and benefit offerings, purchase new
equipment, and hire additional workers. The CBMTRA increased 2018 industry job
totals and has saved the industry nearly $80 million annually². If the CBMTRA becomes
9
permanent, owners will continue to have a greater amount of capital to invest in their
businesses and contribute to local and national economies.
California
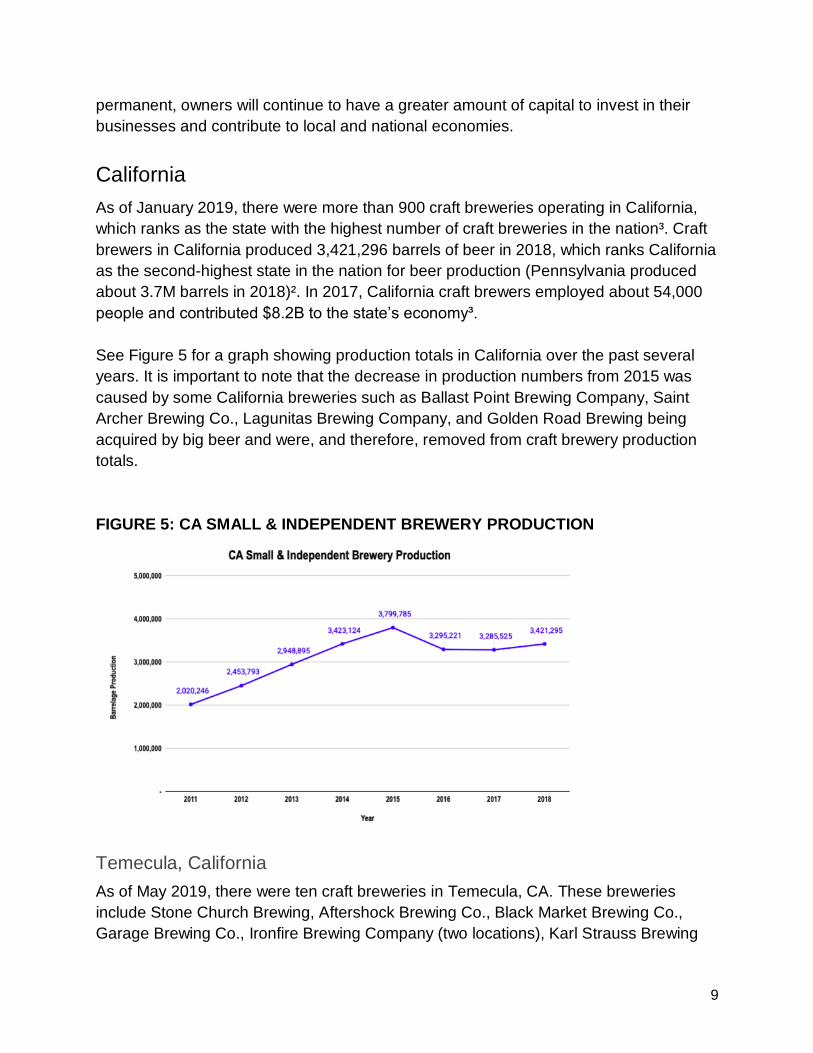
As of January 2019, there were more than 900 craft breweries operating in California,
which ranks as the state with the highest number of craft breweries in the nation³. Craft
brewers in California produced 3,421,296 barrels of beer in 2018, which ranks California
as the second-highest state in the nation for beer production (Pennsylvania produced
about 3.7M barrels in 2018)². In 2017, California craft brewers employed about 54,000
people and contributed $8.2B to the state’s economy³.
See Figure 5 for a graph showing production totals in California over the past several
years. It is important to note that the decrease in production numbers from 2015 was
caused by some California breweries such as Ballast Point Brewing Company, Saint
Archer Brewing Co., Lagunitas Brewing Company, and Golden Road Brewing being
acquired by big beer and were, and therefore, removed from craft brewery production
totals.
FIGURE 5: CA SMALL & INDEPENDENT BREWERY PRODUCTION
Temecula, California
As of May 2019, there were ten craft breweries in Temecula, CA. These breweries
include Stone Church Brewing, Aftershock Brewing Co., Black Market Brewing Co.,
Garage Brewing Co., Ironfire Brewing Company (two locations), Karl Strauss Brewing

10
Company, Refuge Brewery, Relentless Brewing Co., Wiens Brewing Company, and
Craft Brewing Company. Figure 6 represents the brewery locations in Temecula.
FIGURE 6: TEMECULA CRAFT BREWERY LOCATIONS
Temecula craft breweries produced about 33,000 barrels in 2018, representing a 55%
growth over the 21,200 barrels produced in 2016.
Economic Impact
Temecula is home to ten craft breweries that contribute to economic stimulation and job
growth for a region with over 114,000 residents. Temecula craft brewers employed over
130 people in 2018.
To measure the economic impact on Temecula, CA, data indicating industry changes
within an input and output model in IMPLAN® software was used, which provides
reproducible quantitative results displayed in three impact categories:

11
Direct impacts result from expenditures associated with constructing and operating a
brewery.
Indirect impacts result from the suppliers of the breweries purchasing goods and
services and hiring workers to meet demand. These secondary impacts would not occur
but for the original brewery operations.
Induced impacts result from the employees of the breweries purchasing goods and
services at the household level.
For the purposes of this report, indirect and induced impacts from the IMPLAN® model
were combined into a multiplier effect. A multiplier effect is a change in which an
increase in spending produces an increase in income and consumption greater than the
initial amount spent.
The total economic impact is composed of direct and multipliers effects. Value added
measures the economic impact of craft beer total activities in Temecula in the form of
employee salaries and compensations, taxes on production and imports (minus
subsidies), and gross operating surplus. The output is the total annual value of all
production activities generated by the craft beer industry in Temecula, CA.
Temecula Craft Beer Economic Impact
Figure 7 represents the economic impact of craft breweries in Temecula. Temecula’s
total economic output for craft beer in 2018 was $37,310,485.
FIGURE 7: 2018 TEMECULA CRAFT BEER ECONOMIC IMPACT
Temecula Craft Beer
Impact Type Employment
Labor Income ($)
Value Added ($)
Output ($)
Direct Effect
Multiplier Effect
Total Effect
To calculate industry revenue, the Brewery Operations Benchmarking Survey (BOBS)
from the Brewers Association (represented in Figure 8) was used. The total barrels
produced per craft brewery in 2018 was used to determine revenue per barrel for both
distribution sales and on-premise sales, and therefore, total industry revenue.

12
FIGURE 8: BOBS DISTRIBUTION VS. ON-PREMISE SALES
Percentage of Distribution vs. On-Premise Sales
Breweries Barrels Produced
Distribution Sales On-Premise Sales Weighted
Rev/bbl Percent (%)
Rev/bbl Percent (%)
Rev/bbl
>60,000 347.9 0.923 1200 0.077 413.53
30,001-60,000
294.69 0.897 1200 0.103 387.94
15,001-30,000
303.28 0.754 1200 0.246 523.87
10,001-15,000
317 0.818 1200 0.182 477.71
5,001-10,000 407 0.62 1200 0.38 708.34
2,501-5,000 432 0.603 1200 0.397 736.90
1,001-2,500 490 0.491 1200 0.509 851.39
1-1,000 743.56 0.218 1200 0.782 1100.50
Brewpubs >1,000 691.81 0.406 1200 0.594 993.67
1-1,000 871.09 0.072 1200 0.928 1176.32
Comparisons
The Temecula Valley Balloon and Wine Festival is a well-known, annual festival
featuring wine tasting, hot air balloon flights, entertainment, arts and crafts, commercial
exhibits, and food. It attracts visitors throughout Southern California, comprising of
Riverside County, San Diego County, Orange County, Los Angeles, and Palm Springs.
It celebrated its 36th year in May/June of 2019.

13
The Temecula Valley Balloon and Wine Festival had an economic output of about
$2.8M in 2018, represented in Figure 9. It is important to note that money spent on
restaurants, hotels, and other activities associated with the Temecula Valley Balloon
and Wine Festival were not included in its economic output calculation. Independent
craft breweries in Temecula, CA had an economic output of more than ten times that of
the Temecula Valley Balloon and Wine Festival in 2018.
FIGURE 9: 2018 TEMECULA VALLEY BALLOON AND WINE FESTIVAL ECONOMIC
IMPACT
Temecula Valley Balloon and Wine Festival
Impact Type Employment Labor Income ($)
Value Added ($)
Output ($)
Direct Effect 3 68,409 455,138 1,704,731
Multiplier Effect
15 361,619 560,339 1,075,622
Total Effect 18 430,027 1,015,477 2,780,353
In comparison to Temecula’s wine industry, Temecula craft breweries had
approximately $24.7M in revenue in 2018, while its wine industry had approximately
$65M in revenue in 2016⁴. The Temecula wine industry is more established than the
craft beer industry, as Temecula has around 40 wineries and saw its first winery in 1974
(Callaway Vineyard)⁵, and has 10 craft breweries and saw its first microbrewery in 1994
(Blind Pig Brewing). Much like the wine industry has done, as the Temecula craft beer
industry continues to grow and mature, so will its impact on the region’s economy.
Philanthropy
A survey was conducted among the craft brewers in Temecula with the goal of
gathering information regarding philanthropic donations to charities made by the
brewers in 2018. Based on this data, craft brewers donated over $80,000 to various
local organizations in 2018.
Looking Forward
Craft Brewer Confidence Index
A confidence diffusion index was used to measure and evaluate the industry confidence
level of craft brewers in Temecula. According to the Bureau of Labor Statistics, a
confidence diffusion index is a measure of the dispersion of change⁶. On a 100-point

14
scale, an index rating above 50 indicates a more optimistic industry outlook over the
next 12 months. An index rating below 50 indicates a more pessimistic industry outlook
over the next 12 months.
As of May 2019, the Temecula craft brewers recorded a confidence index of 71.36,
indicating a positive outlook for the craft beer industry in Temecula over the next 12
months.
Craft Brewer Business Indicators
As shown in Figure 10, the craft brewer confidence index respondents were asked to
indicate forward looking confidence over a 12 month period regarding employment,
capital expenditures on brewing equipment, distribution, and barrelage production.
These values indicate that craft brewers in Temecula are optimistic about the future
growth and development of their operations. Specifically, confidence that employment,
distribution, and barrelage production will increase over the next 12 months is
significant.
FIGURE 10: CRAFT BREWER BUSINESS INDICATORS
Conclusion
As the Temecula Valley Brewers Guild is a newly established guild (founded in 2017),
OBRA recommends that the Temecula Valley Brewers Guild create a website
highlighting the brewers’ award-winning beer, philanthropic donations, and an
interactive map showing the craft brewery locations.

15
Nationally, the craft beer industry is expected to continue to grow throughout the next
several years. If approved, the Craft Beverage Modernization and Tax Reform Act
(CBMTRA) will allow craft brewers to continue to invest greater amounts in their
businesses and employees, and therefore, continue to invest in local and national
economies.
Temecula craft breweries contribute to California ranking number one as the state with
the most craft breweries in the nation.
In 2018, Temecula craft brewers have made a significant impact on the region’s
economy.The craft brewers donated over $80,000 to various local organizations,
employed over 130 people, and had an economic output of approximately $37.3M.
With a positive industry outlook over the next 12 months, the Temecula craft beer
industry is likely to continue to see significant growth in the region. Cheers!
About the Publishers
Office of Business Research and Analysis
Founded in 2018, the Office of Business Research and Analysis (OBRA) is a joint
partnership between California State University San Marcos’ College of Business
Administration (CoBA) and the Department of Economics. OBRA works directly with the
local community in creating a suite of research services, including economic impact
reports.
California State University San Marcos
Building on an innovative 30-year history, California State University San Marcos
(CSUSM) is a forward focused institution, dedicated to preparing future leaders, building
great communities, and solving critical issues. Located on a 304-acre hillside
overlooking the city of San Marcos, the University is just a short distance from some of
Southern California’s best beaches and an hour from the US-Mexico border. CSUSM
enrollment is over 17,000 (and growing). The University is fully accredited by the
Western Association of Schools and Colleges.
CSUSM enjoys a special relationship with Craft Beer. Stone Brewing is nearby
and grew alongside the University. Numerous alumni have started breweries
in the region. The University offers its EngiBeeringTM program, which trains students to
brew craft beer at scale, and to create and run a brewery. In addition, the University has
a registered archive, called BrewchiveTM.

16
Temecula Valley Brewers Guild
The Temecula Valley Brewers Guild, in partnership with the City of Temecula, was
created in 2017 in response to the craft beer industry emerging in Temecula. The Guild
offers an opportunity for local craft brewers to get involved and help shape City zoning
regulations that affect this industry. As this bustling sector started to grow, the City
wanted to provide a forum that brewers and officials could come together, discuss, and
positively shape the future of craft beer in Temecula.
Since inception, the Brewers Guild and the City have met on a regular basis and have
created numerous marketing campaigns to promote the breweries, including the Ale
Trail Guide and Visit Temecula Valley’s Craft Beer Month.
The Guild is extremely active in the community. The Temecula craft brewers donate and
participate in various community events, including Temecula Valley Chamber of
Commerce events, the Temecula Education Foundation’s Taste of Temecula Valley,
Temecula Valley Balloon and Wine Festival, and other local events. The Brewers Guild
also meets on a regular basis with City of Temecula law enforcement to ensure positive,
open communication. The Brewers Guild is going strong with ten craft breweries located
in the City of Temecula, offering unique flavors and award-winning brews.
Sources
1) IBISWorld
2) Brewers Association
3) California Craft Brewers Association
4) City of Temecula
5) Temeculawines.org
6) Bureau of Labor Statistics