economic indicators for belgium
TRANSCRIPT
1www.nbb.be
1www.nbb.be
2018 2019 2020 2021 2022
1.9 1.8 -8.2 3.8 - 5.1 4.3 - 7.2 - 5.3 5.7 -
1.3 1.7 0.2 3.7 - 3.0 5.0 - -0.1 - 0.1 0.6 -
3.0 4.5 -6.2 10.9 - 10.5 7.5 - 2.1 - 2.0 4.4 -
0.6 2.0 -5.5 6.8 - 9.9 7.0 - 4.8 - 3.7 4.8 -
1.4 1.6 -5.9 5.6 - 9.5 7.7 - 5.7 - 4.5 5.4 -
1.8 2.1 -5.7 5.5 - 6.0 4.7 5.5 3.3 - 2.6 3.5 3.5
1.8 1.6 -6.4 - 5.0 5.0 4.3 5.1 - 4.6 4.3 4.4 4.5
2.1 1.8 -5.9 - - 5.0 - - - - 4.3 - -
2.3 1.2 0.4 2.2 - 2.7 1.5 2.2 2.1 - 2.3 1.2 2.0
2.1 1.4 0.7 1.5 - - - - 2.0 - - - -
1.8 1.5 1.0 1.2 - - - - 2.0 - - - -
1.8 1.2 0.3 - 2.2 2.4 1.8 2.1 - 1.7 2.2 1.3 1.7
1.8 1.4 0.7 - - 2.6 - - - - 2.5 - -
1.5 2.3 4.3 0.4 - - - - 1.8 - - - -
1.4 1.8 3.4 -1.2 - -1.4 - - 0.8 - 2.9 - -
1.9 1.9 4.3 - -1.0 -0.4 - - - -0.4 0.2 - -
2.2 2.0 4.5 - - -0.3 - - - - 0.4 - -
1www.nbb.be
Econ
omic
indi
cato
rs fo
r Bel
gium
N° 2
021-
47
20
21-1
1-26
Economic indicators for Belgium
General Statistics Departement
g Summary
REAL GDP
Belgium Final consumption private public Grossfixedcapitalformation Exportsofgoodsandservices Importsofgoodsandserices GDP
InternationalcomparisonofGDP Euro area(1)
EU-27
CONSUMER PRICES
Belgium HICP Nationalgeneralindex Nationalhealthindex
InternationalcomparisonofHICP Euro area(3)
EU-27
LABOUR COSTS IN THE PRIVATE SECTOR(2)
Belgium Labourcostsperhourworked Unit labour costs
Unit labour costs Euro area(1)
EU-27
(percentage changes compared to the previous year)
ACTUAL FIGURES* FORECASTS**
(percentage changes compared to the previous year)
(percentage changes compared to the previous year)
WEEKLY PUBLICATION N° 2021-47 2021-11-26
* Sources: Belgium (NAI. NBB. Statbel. EC); Euro area. EU-27 (ECB. Eurostat).** The2021and2022forecastsfromtheNBBareconsistentwiththeestimatesfromJune2021intheEconomicRevue(nextupdate-EconomicRevueDecember2021). Usersshouldbeawarethatestimatesofthiskindcansometimesbeoutofdateowingtochangesintheinformationavailable.Theoldertheestimates.the greaterthisriskbecomes.PublicationoftheestimatethereforesimplymeansthatitisthelatestestimatereleasedbytheNBB. ECBstaffmacroeconomicprojectionsSeptember2021(nextissueDecember2021); OECDEconomicOutlookMay2021(nextreleaseNovember2021). ECEuropeanEconomicForecastAutumn2021(nextreleaseSpring2022)andBPNSeptember2021(nextreleaseDecember2021).*** Averageofthecreditinstitutionswhichparticipateinthe«Belgian Prime News».(1) Euroarea=EA19.excepttheOECDforecasts.(2) ExceptfortheactualfiguresoftheEuroareaandtheEU-27andtheECandOECDforecastswhichpertaintothewholeeconomy.(3) Euro area = EA11-2000. EA12-2006. EA13-2007. EA15-2008. EA16-2010. EA17-2013. EA18-2014. EA19.
NBB ECB EC OECD BPN*** NBB ECB EC OECD BPN***

2www.nbb.be
2www.nbb.be
2018 2019 2020 2021 2022
1.5 1.6 0.0 0.6 - 0.9 -0.5 0.6 0.2 - 0.4 0.6 0.7
-5.8 -3.8 3.7 -1.2 - - - - 0.6 - - - -
70.7 77.9 -1.5 31.6 - 44.5 -23.0 - 8.4 - 20.9 29.7 -
-30.4 -18.8 17.5 -5.8 - - - - 2.9 - - - -
6.0 5.4 5.6 5.8 - 6.2 6.4 6.5 6.0 - 6.3 6.3 6.3
8.2 7.6 7.9 - 7.9 7.9 8.2 7.9 - 7.7 7.5 7.9 7.7
7.3 6.7 7.1 - - 7.1 - - - - 6.7 - -
1.3 0.1 -7.1 -5.2 - -6.1 - - -2.6 - -3.7 - -
-0.8 -1.9 -9.1 -6.8 - -7.8 -7.2 -6.7 -4.0 - -5.1 -4.0 -4.5
99.9 97.7 112.8 112.8 - 112.7 115.3 111.5 112.1 - 113.1 115.0 110.9
-0.4 -0.6 -7.2 - -7.1 -7.1 -7.2 -7.4 - -3.0 -3.9 -3.7 -4.0
-0.4 -0.5 -6.9 - - -6.6 - - - - -3.6 - -
-0.8 0.2 0.8 -0.3 - 0.8 -0.9 0.5 -0.5 - 0.3 -1.4 0.0
3.0 2.4 2.2 - 1.8 3.1 3.3 2.4 - 1.3 3.2 3.2 2.2
2.9 2.7 2.7 - - 3.0 - - - - 3.0 - -
2www.nbb.be
Economic indicators for B
elgium
N
° 2021-47
2021-11-26
g Summary (continued)
LABOUR MARKET
Belgium Totalemployment Unemployment
Totalemployment Unemployment
Harmonisedunemploymentrate(1)
Internationalcomparisonofharmonisedunemploymentrate(1)
Euro area(2)
EU-27
GENERAL GOVERNMENT
Belgium Primarybalance Overall balance Consolidatedgrossdebt
Internationalcomparisonofoverallbalance Euro area(2)
EU-27
CURRENT ACCOUNT
Belgium
International comparison Euro area(2)
EU-27
ACTUAL FIGURES* FORECASTS**
(annual changes in percentages)
(annual changes in thousands)
(annual averages in percentages of labour force)
(percentages of GDP)
(percentages of GDP)
* Sources: Belgium (NAI. NBB. Statbel. EC); Euro area. EU-27 (ECB. Eurostat).** The2021and2022forecastsfromtheNBBareconsistentwiththeestimatesfromJune2021intheEconomicRevue(nextupdate-EconomicRevueDecember2021). Usersshouldbeawarethatestimatesofthiskindcansometimesbeoutofdateowingtochangesintheinformationavailable.Theoldertheestimates.the greaterthisriskbecomes.PublicationoftheestimatethereforesimplymeansthatitisthelatestestimatereleasedbytheNBB. ECBstaffmacroeconomicprojectionsSeptember2021(nextissueDecember2021); OECDEconomicOutlookMay2021(nextreleaseNovember2021). ECEuropeanEconomicForecastAutumn2021(nextreleaseSpring2022)andBPNSeptember2021(nextreleaseDecember2021).*** Averageofthecreditinstitutionswhichparticipateinthe«Belgian Prime News».(1) ThisseriescorrespondswiththeresultsoftheLabourForceSurvey(LFS.Populationolderthan15years).monthlyadjustedbyusingtheadministrativenational unemploymentfigures.inaccordancewiththeEurostat’smethodology.(2) Euroarea=EA19.excepttheOECDforecasts.
NBB ECB EC OECD BPN*** NBB ECB EC OECD BPN***
3www.nbb.be
-20
-15
-10
-5
0
5
10
15
20
25
2013 2014 2015 2016 2017 2018 2019 2020 2021-14-12-10-8-6-4-202468101214
2013 2014 2015 2016 2017 2018 2019 2020 2021
3www.nbb.be
2019 2020 2021III IV I II III IV I II III
111821 112552 109020 96331 107778 107629 108968 110851 n.
0.7 0.7 -3.1 -11.6 11.9 -0.1 1.2 1.7 1.8(4)
2.4 2.1 -1.4 -13.3 -3.6 -4.4 0.0 15.1 4.7(4)
0.3 0.0 -3.5 -11.7 12.6 -0.4 -0.3 2.1 2.2(4)
0.3 0.0 -3.1 -11.3 11.8 -0.2 -0.1 2.0 2.1(4)
1.8 1.2 -3.0 -14.5 -4.0 -4.4 -1.2 14.2 3.7(4)
2.0 1.4 -2.5 -13.7 -3.9 -4.1 -1.2 13.7 3.9(4)
2.5 2.4 -3.4 -16.4 -3.0 -10.1 -3.5 14.4 n.
1.9 3.0 1.9 -1.9 1.6 -0.8 0.6 4.8 n.
5.4 3.2 -0.6 -18.2 -4.6 -1.4 3.7 27.8 n.
5.9 4.6 0.4 -20.8 -5.6 -2.2 2.8 31.7 n.
3.5 1.7 -4.5 -18.1 -1.8 -2.7 5.9 24.5 n.
5.8 -2.9 0.8 -1.4 -3.1 6.2 4.7 13.3 n.
2.4 2.5 0.5 -13.1 -6.1 -3.2 -0.3 21.0 n.
1.2 1.5 -0.1 -14.1 -5.7 -3.9 -1.6 20.1 n.
2.4 2.1 -1.4 -13.3 -3.6 -4.4 0.0 15.1 4.7(4)
5.8 5.2 2.4 -11.1 -2.8 1.5 5.1 21.4 n.
-0.4 0.2 -2.7 -15.3 -1.2 -0.5 4.4 21.7 n.
2.0 1.6 -1.5 -13.0 -4.0 -5.0 -1.3 13.0 n.
2.4 2.1 -1.4 -13.3 -3.6 -4.4 0.0 15.1 4.7(4)
3www.nbb.be
Econ
omic
indi
cato
rs fo
r Bel
gium
N° 2
021-
47
20
21-1
1-26
g Real GDP
GDP(1)
Belgium GDPinchained2015euros
vs the previous quarter
vsthecorrespondingquarterofthe previousyear
International comparison vs the previous quarter Euro area(2)
EU-27
vsthecorrespondingquarterofthe previousyear
Euro area(2)
EU-27
MAIN COMPONENTS OF EXPENDITURE(1)
Final private consumption Final public consumption Grossfixedcapitalformation business housing public Exportsofgoodsandservices Importsofgoodsandservices GDP
MAIN COMPONENTS OF VALUE ADDED(1)
Industry Construction Services GDP
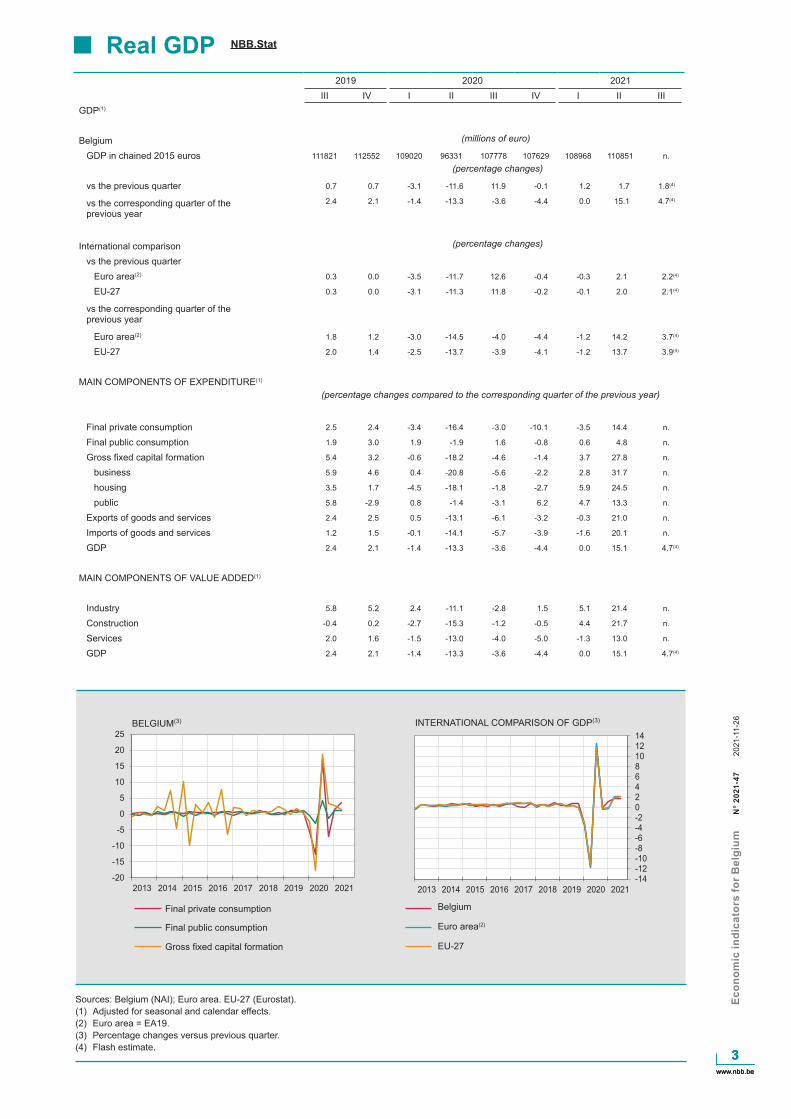
BELGIUM(3) INTERNATIONAL COMPARISON OF GDP(3)
Final private consumption
Final public consumption
Grossfixedcapitalformation EU-27
Belgium
Euro area(2)
(millions of euro)
(percentage changes)
(percentage changes)
(percentage changes compared to the corresponding quarter of the previous year)
NBB.Stat
Sources: Belgium (NAI); Euro area. EU-27 (Eurostat).(1) Adjustedforseasonalandcalendareffects.(2) Euro area = EA19.(3) Percentage changes versus previous quarter.(4) Flash estimate.

4www.nbb.be
4www.nbb.be
2019 2020 2021I II III IV I II III IV I II
4868.0 4886.3 4904.2 4922.3 4909.1 4873.7 4882.5 4912.3 4926.7 4963.9
64.5 65.6 65.8 65.3 65.1 64.2 65.1 64.5 63.6 65.0
69.8 71.0 70.7 70.5 70.4 69.6 70.2 69.9 69.0 70.5
67.3 68.0 68.2 68.3 67.6 66.3 67.1 67.4 66.3 67.8
72.0 72.7 72.8 72.9 72.2 70.9 71.6 72.1 70.9 72.4
67.7 68.5 68.8 68.6 68.0 66.9 67.7 67.9 66.8 68.2
72.4 73.2 73.4 73.3 72.7 71.6 72.4 72.7 71.5 73.0
2020 2021O N D J F M A M J J A S O
491 487 491 495 489 477 468 451 447 476 483 459 445
90 86 84 84 82 78 74 70 68 81 87 85 79
401 401 407 411 407 399 393 382 379 396 396 374 366
5.8 5.8 6.0 6.5 6.7 6.7 6.5 6.3 6.2 6.2 6.4 6.3 n.
8.4 8.1 8.1 8.2 8.1 8.1 8.1 8.0 7.8 7.6 7.5 7.4 n.
7.5 7.3 7.4 7.4 7.4 7.4 7.4 7.3 7.1 6.9 6.9 6.7 n.
2020 2021O N D J F M A M J J A S O
-1.7 1.4 1.5 1.1 1.0 7.3 17.7 23.6 31.5 25.9 26.9 21.4 n.
-12.0 -16.7 -20.1 -26.4 -21.0 -6.4 46.8 69.9 26.9 -19.4 -26.4 -30.6 -29.3
2019 2020 2021I II III IV I II III IV I II
2.3 -0.5 0.7 -0.3 -4.2 -19.6 -6.9 -4.2 3,7 36,0
5.7 2.9 2.7 -3.7 -2.6 -22.2 -8.9 -4.5 5,2 33,8
4www.nbb.be
Economic indicators for B
elgium
N
° 2021-47
2021-11-26
g Activity and labour market indicators
Activity
Labour market
EMPLOYMENT
Belgium Domesticemployment(3)
Employmentrate(4) 15-64years 20-64years
Internationalcomparisonoftheemploymentrate(4)
Euro area(5) 15-64years 20-64years
EU-27 15-64years 20-64years
UNEMPLOYMENT
Belgium Unemployment(6)
<25yearsold ≥25yearsold
Harmonisedunemploymentrate(7)
Internationalcomparisonofharmonisedunemploymentrate(7)
Euro area(5)
EU-27
(percentages of the population of working age)
(in thousands)
(percentages of the labour force)
(in thousands. end of period)
Industrialproduction,excludingbuilding(1)
Newcarregistrationsincludingmixedcars
(percentage changes in the average for the last 3 months compared to the corresponding period of the previous year)
Total turnover(2)
Investments(2)
(percentage changes compared to the corresponding period of the previous year)
NBB.Stat
NBB.Stat
NBB.Stat
Sources:NBB;Statbel.SMEs.Self-employedandEnergy;NEO;FEBIAC;Eurostat;NAI.(1) FollowingachangeinthedatacollectionatStatbelfromJanuary2020.thisserieshasbeenrevisedandnowincludesonlydatarelatingtothe miningandquarryingindustries.manufacturingandelectricity.gas.steamandairconditioningsupply(sectionsB-C-D).(2) BasedonVAT-declaration.(3) Quarterlyaverageofthenumberofemployeesandself-employedpersons.seasonallyadjusted.(4) Harmoniseddatafromthequarterlylabourforcesurvey(LFS).unadjusteddata.Breakinseriesin2017-Iduetothereformandmodernization oftheLFS. (5) Euro area = EA19.(6) Fullyunemployedpersonsreceivingbenefits.compulsorilyandvoluntarilyregisteredjob-seekers;grossdata.(7) ThisseriescorrespondswiththeresultsoftheLabourForceSurvey(LFS.groupof15-74years).monthlyadjustedbyusingtheadministrative nationalunemploymentfigures.inaccordancewiththeEurostat’smethodology.

5www.nbb.be
55
60
65
70
75
80
85
90
-30-25-20-15-10
-505
101520
2014 2015 2016 2017 2018 2019 2020 2021-40
-30
-20
-10
0
10
20
30
2014 2015 2016 2017 2018 2019 2020 2021
-30
-20
-10
0
10
20
30
-40
-30
-20
-10
0
10
20
2014 2015 2016 2017 2018 2019 2020 2021-20
-15
-10
-5
0
5
10
15
20
2014 2015 2016 2017 2018 2019 2020 2021
-50
-40
-30
-20
-10
0
10
20
30
2014 2015 2016 2017 2018 2019 2020 2021-30
-25
-20
-15
-10
-5
0
5
10
15
2014 2015 2016 2017 2018 2019 2020 2021
5www.nbb.be
5www.nbb.be
Econ
omic
indi
cato
rs fo
r Bel
gium
N° 2
021-
47
20
21-1
1-26
g Business survey
g Consumer survey
OVERALL SYNTHETIC CURVE(1) MANUFACTURING INDUSTRY
TRADE & BUSINESS-RELATED SERVICESBUILDING INDUSTRY
Seasonallyadjustedandsmoothedseries
Seasonallyadjustedseries
services(right-handscale)
trade
EXPECTATIONS(4) ON THE GENERAL ECONOMICSITUATIONCONSUMER CONFIDENCE INDEX(3)
useofproduction capacity(2)
(right-handscale)
NBB.Stat
NBB.Stat
Source: NBB.(1) Weightedaverageofthesyntheticcurveofmanufacturingindustry.buildingindustry.tradeandbusiness-relatedservices.(2) Percentageofproductioncapacityutilisation.seasonallyadjusted.(3) Includesexpectationsonthegeneraleconomicsituation.unemployment.financialsituationandsavingcapacity.(4) Overthenext12months.

6www.nbb.be
6www.nbb.be
2015 2016 2017 2018 2019 2020
0.6 1.8 2.2 2.3 1.2 0.4
-8.0 -0.6 9.9 8.9 -0.8 -11.0
2.1 2.6 -0.2 1.8 -0.4 4.7
1.6 3.5 1.8 2.9 1.7 2.1
1.6 1.8 1.5 1.3 1.5 1.4
0.5 1.0 0.8 0.8 1.0 0.7
2.4 2.2 1.9 1.6 1.8 1.8
0.6 2.0 2.1 2.1 1.4 0.7
1.1 2.1 1.8 1.8 1.5 1.0
0.2 0.2 1.5 1.8 1.2 0.3
-6.8 -5.1 4.9 6.4 1.1 -6.8
1.6 1.4 2.4 2.3 1.4 4.0
0.6 0.6 1.5 2.1 1.9 1.8
1.1 0.8 1.0 1.0 1.0 0.7
0.3 0.4 0.3 0.3 0.3 0.2
1.5 1.1 1.4 1.5 1.5 1.0
6www.nbb.be
Economic indicators for B
elgium
N
° 2021-47
2021-11-26
g Harmonised index of consumer pricesAnnualdata
BELGIUM
Total HICP Energy Unprocessedfood(1)
Processedfood Underlyingtrendininflation(2)
Non-energyindustrialgoods Services
p.m.Nationalindexofconsumerprices Generalindex Healthindex(3)
EURO AREA(4)
Total HICP Energy Unprocessedfood(1)
Processedfood Underlyingtrendininflation(2)
Non-energyindustrialgoods Services
(percentage changes compared to the previous year)
HICP TOTAL UNDERLYING TREND IN INFLATION
Euro area
Belgium
Sources:Eurostat;Statbel.SMEs.Self-employedandEnergy.(1) Fruit.vegetables.meatandfish.(2) HICPexcludingfoodandenergy.(3) Generalindexexcludingproductswhichareharmfultothehealth(tobacco.alcohol.petrolanddiesel).(4) Euro area = EA11-2000. EA12-2006. EA13-2007. EA15-2008. EA16-2010. EA17-2013. EA18-2014. EA19.
-2
-1
0
1
2
3
4
2015 2016 2017 2018 2019 2020 2021-2
-1
0
1
2
3
4
5
6
2015 2016 2017 2018 2019 2020 2021

7www.nbb.be
7www.nbb.be
2020 2021O N D J F M A M J J A S O
0.4 0.2 0.4 0.6 0.3 1.6 2.1 2.5 2.6 1.4 4.7 3.8 5.4
-11.0 -11.1 -9.2 -6.7 0.1 8.7 16.2 19.8 18.8 22.1 24.5 27.3 40.6
6.7 4.3 2.0 -1.4 -0.9 -1.9 -2.7 -3.3 -3.5 -3.6 -2.3 -2.3 -3.0
2.1 1.6 1.7 1.6 1.3 1.1 0.9 1.0 1.4 1.6 1.6 1.8 2.4
1.2 1.2 1.2 1.4 0.1 0.9 0.8 1.1 1.1 -1.2 3.2 1.6 1.9
0.6 0.7 0.6 1.7 -1.6 0.3 0.3 0.4 0.4 -4.3 6.5 1.1 1.4
1.6 1.5 1.7 1.4 1.2 1.3 1.2 1.6 1.6 1.0 1.3 2.0 2.2
0.9 0.7 0.5 0.4 0.3 0.5 0.9 1.2 1.6 2.3 2.7 2.9 4.2
1.1 1.0 0.8 0.6 0.6 0.5 0.6 0.6 1.1 1.8 2.3 2.3 3.5
-0.3 -0.3 -0.3 0.9 0.9 1.3 1.6 2.0 1.9 2.2 3.0 3.4 4.1
-8.2 -8.3 -6.9 -4.2 -1.7 4.3 10.4 13.1 12.6 14.3 15.4 17.6 23.7
4.3 4.2 2.1 2.0 1.5 1.6 -0.3 0.0 -0.3 1.9 3.0 2.6 1.4
1.3 1.2 1.1 1.3 1.3 1.0 0.9 0.7 0.8 1.5 1.7 1.9 2.1
0.2 0.2 0.2 1.4 1.1 0.9 0.7 1.0 0.9 0.7 1.6 1.9 2.0
-0.1 -0.3 -0.5 1.5 1.0 0.3 0.4 0.7 1.2 0.7 2.6 2.1 2.0
0.4 0.6 0.7 1.4 1.2 1.3 0.9 1.1 0.7 0.9 1.1 1.7 2.1
7www.nbb.be
Econ
omic
indi
cato
rs fo
r Bel
gium
N° 2
021-
47
20
21-1
1-26
g Harmonised index of consumer prices (continued)Monthlydata
BELGIUM
Total HICP Energy Unprocessedfood(1)
Processedfood Underlyingtrendininflation(2)
Non-energyindustrialgoods Services
p.m.Nationalindexofconsumerprices Generalindex Healthindex(3)
EURO AREA(4)
Total HICP Energy Unprocessedfood(1)
Processedfood Underlyingtrendininflation(2)
Non-energyindustrialgoods Services
(percentage changes compared to the corresponding month of the previous year)
NBB.Stat
Sources:Eurostat;Statbel.SMEs.Self-employedandEnergy.(1) Fruit.vegetables.meatandfish.(2) HICPexcludingfoodandenergy.(3) Generalindexexcludingproductswhichareharmfultothehealth(tobacco.alcohol.petrolanddiesel).(4) Euro area = EA11-2000. EA12-2006. EA13-2007. EA15-2008. EA16-2010. EA17-2013. EA18-2014. EA19.

8www.nbb.be
8www.nbb.be
2016 2017 2018 2019 2020
43.6 44.2 44.2 42.9 43.1
16.0 16.6 16.8 15.6 15.7
13.4 13.3 13.4 13.3 13.0
13.5 13.4 13.3 13.2 13.6
0.8 0.8 0.8 0.7 0.7
7.1 7.2 7.1 7.0 7.1
50.8 51.3 51.4 49.9 50.1
24.7 24.6 24.6 24.5 28.1
25.8 25.1 25.5 25.4 29.1
50.4 49.7 50.1 49.9 57.2
0.3 1.7 1.3 0.1 -7.1
2.7 2.4 2.1 2.0 1.9
-2.4 -0.7 -0.8 -1.9 -9.1
-2.6 -1.3 -0.2 -1.9 -7.1
-0.1 0.2 0.0 0.3 0.2
0.0 0.2 -0.4 -0.2 -2.2
0.2 0.2 -0.1 0.0 0.1
0.3 1.7 1.3 0.1 -7.1
0.6 1.0 1.4 1.0 -5.7
0.6 1.0 1.3 1.0 -5.5
-2.4 -0.7 -0.8 -1.9 -9.1
-1.5 -0.9 -0.4 -0.6 -7.2
-1.4 -0.8 -0.4 -0.5 -6.9
105.0 102.0 99.9 97.7 112.8
90.0 87.5 85.5 83.6 97.3
83.9 81.3 79.3 77.2 90.1
8www.nbb.be
Economic indicators for B
elgium
N
° 2021-47
2021-11-26
g Public financesGeneralgovernment-EDPdefinition(1)
REVENUE Fiscalandparafiscalrevenue Directtaxes Indirecttaxes Actual social contributions Capitaltaxes
Non-fiscalandnon-parafiscalrevenue(2)
Total
PRIMARY EXPENDITURE Socialbenefits(3)
Otherexpenditures Total
PRIMARY BALANCE
INTEREST CHARGES
OVERALL BALANCE
p.m. FOR THE SUBSECTORS Federalgovernment Socialsecurity Communitiesandregions Local authorities
INTERNATIONAL COMPARISON Primarybalance Belgium Euro area(4)
EU-27 Overall balance Belgium Euro area(4)
EU-27 Consolidatedgrossdebt Belgium Euro area(4)
EU-27
(percentages of GDP)
NBB.Stat
Sources: NAI. NBB. Eurostat.(1) ExcessiveDeficitProcedure(EDP).definitionoftheTreatyontheFunctioningoftheEuropeanUnion.(2) Propertyincome.imputedsocialsecuritycontributions.transfersfromothersectorsandsalesofgoodsandservices.(3) Fromsocialsecurityandallothersubsectorsofgeneralgovernment.(4) Euro area = EA19.

9www.nbb.be
-2
-1
0
1
2
3
4
5
6
2017 2018 2019 2020 2021100
105
110
115
120
125
130
135
140
2017 2018 2019 2020 2021
9www.nbb.be
2020 2021S O N D J F M A M J J A S
32.8 33.8 32.1 31.8 31.4 31.3 39.4 37.1 36.4 40.7 37.7 36.4 39.8
30.4 29.8 30.6 30.8 29.2 30.4 36.4 33.6 34.5 37.4 32.7 33.3 38.4
2.4 4.0 1.5 1.0 2.1 0.9 3.1 3.5 1.9 3.2 5.0 3.1 1.4
371.1 369.0 368.3 369.7 366.8 364.7 370.9 383.2 394.0 403.9 411.7 420.9 427.9
351.3 347.3 346.8 348.0 344.3 343.3 348.4 357.7 367.5 376.6 381.8 389.1 397.1
19.8 21.7 21.5 21.7 22.5 21.5 22.5 25.6 26.5 27.3 29.9 31.8 30.7
0.6 0.9 1.1 0.4 -0.1 -0.4 -0.2 0.0 1.3 1.6 3.0 4.8 n.
-0.9 -1.4 -1.5 -1.5 -1.6 -1.7 -1.6 -0.1 1.0 2.4 3.9 5.0 n.
1.6 2.3 2.6 1.9 1.6 1.3 1.5 0.1 0.2 -0.8 -0.9 -0.2 n.
-7.6 -8.4 -8.5 -7.8 -8.2 -8.6 -7.0 -1.9 2.1 4.8 6.6 8.0 n.
-8.6 -8.9 -8.3 -7.9 -8.8 -9.1 -7.2 -3.8 0.3 2.3 3.6 5.3 n.
1.1 0.5 -0.2 0.1 0.7 0.6 0.2 2.0 1.8 2.4 2.9 2.6 n.
9www.nbb.be
Econ
omic
indi
cato
rs fo
r Bel
gium
N° 2
021-
47
20
21-1
1-26
g Foreign trade(1)
VALUE
Monthlydata Export Import Balance
Cumulativedataoverthe last 12 months
Export Import Balance
PRICE Export Import TermsoftradeVOLUME Export Import Coverage ratio
(billions of euro)
(percentage changes in the last 12 months compared to the preceding 12 months)
PRICE INDEX(2010 = 100)
Export
Import
BALANCE(inbillionsofeuro)
NBB.Stat
Source: NAI.(1) From15/01/2020thefocusontheevolutionofforeigntradewillbeshiftedtothecommunityconceptinsteadofthenationalconcept. ThefiguresontheNBB.Statwebsiteremainfullyavailableinnationalandincommunityconcept.

10www.nbb.be
140150160170180190200210220230240250260270
-2500-2000-1500-1000-500
0500
1000150020002500
-9
-6
-3
0
3
6
9
2018 2019 2020 20212020 20212018 2019
10www.nbb.be
2020 2021J J A S O N D J F M A M J
5.3 4.8 3.3 3.9 5.2 5.6 3.8 5.8 6.4 5.9 7.3 7.4 8.7
4.4 4.0 3.4 4.1 5.2 4.9 4.6 5.5 5.0 5.5 6.1 6.7 7.6
3.3 3.3 2.4 2.6 2.8 2.6 1.8 2.6 3.5 2.7 2.9 2.5 2.1
4.4 4.4 4.4 4.3 4.2 5.4 4.8 5.1 5.7 5.7 6.3 6.0 6.8
-6.8 -6.9 -7.0 -7.1 -6.9 -7.3 -7.4 -7.4 -7.8 -8.0 -8.0 -7.9 -7.8
0.4 0.4 0.4 0.3 0.2 0.2 -0.1 0.4 0.4 0.5 0.6 0.5 0.4
1.9 0.7 0.8 -0.4 2.6 4.2 1.5 2.1 6.1 5.5 6.0 7.7 9.2
-12.0 -13.1 -7.8 -10.4 -7.1 -1.5 -1.2 -2.6 -0.2 3.7 5.1 -0.4 7.0
28.6 24.2 25.5 22.6 22.5 17.9 15.1 12.2 12.5 12.6 11.7 8.5 3.1
-40.5 -37.3 -33.3 -33.0 -29.6 -19.3 -16.3 -14.7 -12.7 -8.9 -6.6 -9.0 3.9
14.5 17.9 19.6 26.6 29.5 18.1 21.7 25.0 31.7 12.0 11.3 12.4 10.0
0.2 0.1 -0.6 1.5 1.8 2.7 0.5 0.2 0.8 1.0 1.6 0.1 0.6
-1.2 -4.6 -10.8 -18.3 -22.1 -15.5 -20.3 -21.2 -26.9 -11.8 -12.1 -4.6 -8.7
0.3 0.4 0.3 0.1 0.4 0.4 0.9 0.7 0.6 0.6 0.2 0.2 0.3
-3.8 -4.5 -2.9 -4.6 -2.9 -1.5 -2.2 -4.2 -0.7 -1.0 -1.8 -0.2 0.1
10www.nbb.be
Economic indicators for B
elgium
N
° 2021-47
2021-11-26
g Balance of payments
CURRENT ACCOUNT Goods Services Primaryincomes Secondaryincomes
CAPITAL ACCOUNT
FINANCIAL ACCOUNT Direct investment Equitycapital Other capital Portfolioinvestment Financialderivatives Other transactions NBB’sreserves
ERRORS AND OMISSIONS
(cumulative data over the last 12 months. in billions of euro)
BALANCE OF CURRENT ACCOUNT (quarterlydatainpercentageofGDP)
INTERNATIONAL INVESTMENT POSITION (quarterlydatainbillionsofeuro)
Netexternalassetposition(right-handscale)
Assets
Liabilities(left-handscale)
NBB.Stat
NBB.Stat
Sources: NBB. NAI.

11www.nbb.be
-1,0
-0,5
0,0
0,5
1,0
1,5
2,0
-2
-1
0
1
2
3
0
0,5
1
1,5
2
2,5
3
-1
0
1
2
3
4
-1,0
-0,5
0,0
0,5
1,0
1,5
2,0
25/11/2020 25/10/2021 25/11/2021
2019 2020
2019 2020
2019 2020
2019 2020
2021
2021 2021
2021
11www.nbb.be
11www.nbb.be
Econ
omic
indi
cato
rs fo
r Bel
gium
N° 2
021-
47
20
21-1
1-26
g Financial markets
Interest rates
EUROSYSTEMEURO
EURO YIELD CURVE
Mainrefinancingoperations(¹)
Marginallendingfacility
Depositfacility
PUBLIC DEBT
BELGIUM
INTERNATIONAL COMPARISON
Treasurycertificates
Referenceloan:OLO10years
Tohouseholdsforhousepurchases:floatingrateandupto1yearinitialratefixation
over10yearsinitialratefixation
Tonon-financialcorporations:
uptoanamountofEUR1million(3)
overanamountofEUR1million(3)
LONG TERM(4)
UnitedStates
Germany
Japan
logarithmic scale
1w. 1m. 3m. 6m. 1y. 3y. 5y. 10y.
NBB.Stat
LENDING RATES BY CREDIT INSTITUTIONS
Sources: ECB. NBB.(1) Minimumbidrate.(2) Weightedaveragerate.(3) Floatingrateandupto1yearinitialratefixation.(4) Ten-yeargovernmentbond.

12www.nbb.be
0,6
0,8
1,0
1,2
1,4
1,6
15000
18500
22000
25500
29000
32500
36000
39500
1800
2300
2800
3300
3800
4300
4800
5300
10
20
30
40
50
60
70
80
90
100
31000
34000
37000
40000
43000
46000
49000
52000
55000
58000
60
70
80
90
100
110
120
130
140
2020
2020 20212020 2021
2021 2020 2021
12www.nbb.be
2020 2021S O N D J F M A M J J A S
12803 12909 13018 13121 13173 13219 13303 13377 13471 13544 13678 13707 13742
14133 14247 14367 14491 14546 14600 14694 14776 14883 14967 15116 15146 15187
252.3 254.4 260.7 263.3 260.6 261.9 264.4 265.5 270.7 272.7 273.0 285.6 286.6
12.1 14.3 12.9 12.7 10.7 10.8 9.2 9.4 11.0 10.9 11.4 10.8 10.6
334.9 335.0 336.2 336.8 338.5 340.2 341.2 341.2 343.1 343.7 341.5 333.3 333.0
28.8 29.4 28.4 27.4 29.9 28.7 26.0 25.9 26.0 28.8 28.4 27.6 32.0
628.1 633.1 638.2 640.2 639.7 641.6 640.9 642.0 650.8 656.1 654.3 657.3 662.2
12www.nbb.be
Economic indicators for B
elgium
N
° 2021-47
2021-11-26
g Financial markets (continued)
Exchangerates
Stockandcommoditiesmarket
Sources:ECB.BIS.Euronext.
Monetaryaggregates(1)
EURO AREA M3excludingcurrencyincirculation M3
ofwhich:byMFI(2) in BELGIUM Deposits overnight withagreedmaturityupto2years redeemableatnoticeupto3months Others M3(3) components M3(3)
(end of period. in billions of euro)
REFERENCE EXCHANGE RATE NOMINAL EFFECTIVE EXCHANGE RATE (2010 = 100)
USdollar/euroPoundsterling/euroJapaneseyen(100)/euro
USdollarEuro
Japaneseyen
STOCK MARKET COMMODITIES MARKET
Left-handscale:
Right-handscale:DowJonesIndustrial
BEL 20DJEuropeStoxx50PIDXNikkei
GoldinBrussels(EUR/kg.left-handscale)
Brent(USD/barrel.right-handscale)
NBB.Stat
NBB.Stat
NBB.Stat
Sources: NBB. ECB.(1) M3comprisescurrencyincirculation.depositswithagreedmaturityupto2years.repurchaseagreements(excludetheRepurchase agreementswithCentralcounterparties-CCPs).moneymarketfundshares/units.moneymarketpaperanddebtsecuritiesupto2years.(2) MonetaryFinancialInstitutions.(3) Excludingcurrencyincirculation.

13www.nbb.be
13www.nbb.be
2019 2020 2021I II III IV I II III IV I II
1358.2 1375.5 1396.9 1406.9 1346.9 1405.8 1417.3 1461.4 1475.3 1506.0
210.2 218.1 220.2 216.3 221.7 245.9 231.5 227.6 230.2 242.6
1439.0 1435.0 1504.2 1476.3 1417.4 1410.0 1406.4 1428.5 1453.6 1491.8
291.5 296.0 298.4 304.3 306.4 309.2 312.7 315.5 319.2 324.4
612.0 626.7 646.7 618.2 652.0 693.8 686.6 687.3 682.3 694.7
1928.9 1939.3 1989.2 1991.9 1902.8 1905.6 1902.5 1931.9 1937.5 1974.1
1066.7 1079.5 1098.5 1102.7 1040.5 1096.6 1104.6 1145.9 1156.0 1181.6
-401.9 -408.6 -426.5 -401.9 -430.3 -447.9 -455.1 -459.7 -452.1 -452.1
-489.9 -504.4 -485.0 -515.5 -485.4 -495.7 -496.1 -503.4 -483.9 -482.3
13www.nbb.be
Econ
omic
indi
cato
rs fo
r Bel
gium
N° 2
021-
47
20
21-1
1-26
g Conventional signs indicatesdatawhichhavebeenupdatedsincethepreviouspublication.0.0 nilorlessthanhalfthesmallestdigitconsidered.- datanon-existentormeaningless. n. not available. e estimate.
g InformationWesuggestpeoplewantingmoreinformationaboutthecontents.themethodology.themethodsofcalculationsandthesourcestogetintouchwiththeStatisticalinformationsystemsoftheNationalBankofBelgium.
Nino Di Zinno tel.: +32 2 221 21 36 FrankyVanDeWalle tel.:+3222212967E-mail:[email protected]
EditorRudiAcx HeadoftheGeneralStatisticsDepartment
NationalBankofBelgiumboulevarddeBerlaimont14BE-1000Brussels
Closingdate2021-11-26 Nextissue:2021-12-03
Allrightsreserved.Reproductionforeducationalandnon-commercialpurposesispermittedprovidedthatthesourceisacknowledged.
g Financial accounts
FINANCIAL ASSETS Individuals General government Non-financialcorporations
FINANCIAL LIABILITIES Individuals General government Non-financialcorporations
NET FINANCIAL WEALTH Individuals General government Non-financialcorporations
(end of period outstanding amounts in billions of euro)
NBB.Stat
Source: NBB.