economic legacies of the cultural revolutionigov.berkeley.edu/sites/default/files/liang...
TRANSCRIPT

Economic Legacies of the Cultural Revolution∗
Liang Bai†
April 1, 2014
Abstract
This paper investigates the economic legacies of the Cultural Revolution in rural China.With its purported goals of tackling inequality and forestalling a “capitalist restoration,”the decade of 1966-1976 witnessed widespread violence, much of it directed towards theeducated elite. Using a unique county-level dataset on collective killings, coupled withoriginal economic data collected from archives of regional gazetteers, I investigate theextent to which this historic event yielded different trajectories of development acrossregions in China. To address endogeneity concerns, I control for pre-revolution outcomesand exploit transitory shocks to agricultural income during the period of violence asan instrument. Empirical results show that more revolutionary regions were slower toindustrialize, had lower levels of education and per-capita output. These effects arelarge in magnitude, detectable more than thirty years later, and in some cases beginto decline at longer time horizons. Trust-based informal lending appears to have beenadversely affected, while the timing of policy reforms does not.
JEL Codes: O11, P16, N45.
∗I am grateful to Edward Miguel, Barry Eichengreen and Gérard Roland for their advice and encour-agement. I also thank Fred Finan, Martha Olney, Tom Vogl, Noam Yuchtman, and several colleagues andseminar participants for their helpful comments; and Andrew Walder for sharing his data. Financial supportfrom the Berkeley Economic History Laboratory, Center for Equitable Growth, and the All-UC Group inEconomic History is gratefully acknowledged. Special thanks to Joseph Chan, Wan Duan, Jiaojiao Feng,Pin-Hsi Liu, Shuqi Pan, Weiqian Pan, Celine Xu and Carlo Yeung for excellent research assistance in archivaldata collection.†Department of Economics, UC Berkeley. Email: [email protected]
1

"A revolution is not a dinner party, or writing an essay, or painting a picture, ordoing embroidery; it cannot be so refined, so leisurely and gentle, so temperate, kind,courteous, restrained and magnanimous. A revolution is an insurrection, an act ofviolence by which one class overthrows another."
- Chapter 2, "Quotations from Chairman Mao Zedong"
1 Introduction
The Cultural Revolution is a watershed moment in 20th-century Chinese history. Spanninga decade from 1966 to 1976, it constitutes the final years of Mao Zedong’s leadership, andshortly precedes the country’s economic liberalization. Intended as a campaign to consolidatethe communist revolution of 1949 by “cleansing the class ranks” of “bourgeois elements,” itsaccompanying violence and chaos is widely believed to have left an indelible mark on Chinesesociety (Esherick et al. (2006)). This paper explores the economic legacies of this period,focusing in particular on the rural experience.
With its purported goals of tackling inequality and forestalling a “capitalist restoration,”the “Great Proletarian Cultural Revolution” was a catastrophic event for large sections ofthe population, especially members of the educated elite. All across China, because of theirperceived lack of commitment to socialism, individuals with so-called “bad class backgrounds”(e.g. former landlords, rich peasants, intellectuals) were particularly at risk (Su (2011)).Existing estimates of the number of fatalities range from 250,000 to 1.5 million, while that ofvictims, including those imprisoned and otherwise persecuted, is closer to 30 million (Walderand Su (2003)). In addition to this targeted violence, there was widespread disruption tothe functioning of government services, most notably the closure of schools and universities.Taken together, this has often led to the cohorts growing up during this period being labeledas China’s “lost generation” (Chen (1999)).
Although perhaps the most direct, the loss of human capital is only one channel throughwhich the revolution may have affected the country’s subsequent economic development.Another potential channel is the erosion of social capital. Violence within communities mayhave made trust and cooperation more difficult (Nunn and Wantchekon (2011)), therebyworsening the functioning of informal credit and risk-sharing institutions. Yet another po-tential consequence of exposure to violent conflict is an induced change to one’s time andrisk preferences. Previous studies have found that such experiences can cause people to bemore impatient and risk-seeking (Voors et al. (2012); Callen et al. (2011)). This in turn hasmany important implications for savings and investment decisions.
2

Finally, the revolution is often thought to have influenced the timing and choice of eco-nomic policies during the reform era (Xu (2011)). One key example was the decollectivizationof agriculture and the introduction of the “household responsibility system,” which made agri-cultural households the residual claimants of their output, and enabled the return of ruralmarkets. In a seminal paper, Lin (1992) attributes roughly half of the output growth during1978-1984 to this reform. The decision of when to implement this policy varied substantiallyacross regions. This heterogeneity allows for the testing of two competing hypotheses. Onthe one hand, if the revolution succeeded in shaping people’s ideologies, more revolutionaryareas would have been more reluctant to embrace these market-oriented reforms. On theother hand, and contrary to the China envisioned by Mao, the revolution’s excesses may haveaccelerated the pace of economic reform, due to a “reactionary backlash” effect, in which caseworse-affected areas would have liberalized more quickly.
While there is no shortage of theoretical mechanisms through which the Cultural Rev-olution may have influenced subsequent economic development, it has not been possible toexplore them systematically until now, due to a lack of data. In this paper, I constructan original county-level panel dataset of economic outcomes using regional gazetteers1 andpopulation censuses, combined with rare data on the extent of violence during the revolution(Walder and Su (2003)). Finally, the analysis also makes use of survey data from the ChinaHousehold Income Project (CHIP).
A key challenge to estimating the causal impact of revolutionary intensity on economicoutcomes is the presence of potential confounding factors. For instance, we may be concernedthat more revolutionary regions were more likely to have a history of previous conflicts andwere worse off economically to begin with, leading OLS to overestimate the true effects. Onthe other hand, it is possible that areas with higher educational attainment, and thereforegrowth potential, suffered disproportionately because of the presence of “bourgeois elements,”resulting in an underestimation of the true impacts. To address this, I control for pre-revolution outcomes and province fixed effects in the econometric estimation. Moreover,temporary fluctuations in local economic conditions during the violence years, as driven byclimate shocks, provide one source of plausibly exogenous variation.
Before discussing the estimated impacts, two determinants of revolutionary intensity areworth noting. First, areas with a higher male-to-female gender ratio among 15-24 year-olds in 1970 experienced greater levels of violence. This is perhaps unsurprising, given therole of the largely-male “Red Guards” as perpetrators. Second, areas with abnormal levels of
1These are book-length local histories published during the late 1980s and early 1990s.
3
precipitation (i.e. either drought or flooding) during the late-1960s experienced less violence.This latter result differs from those found in some earlier studies (e.g. Miguel et al. (2004)),which have tended to find a positive relationship between adverse climate shocks and theincidence of violence.2 The context of the revolution may help us make sense of this pattern.Specifically, it is important to remember that participating in revolutionary activities carriedno obvious economic benefit. This is in sharp contrast to the other episodes of politicalviolence analyzed in the literature, where the ultimate objective is the capturing of resources.As a result, individuals and local governments focused on dealing with agricultural shortagesmay well have diverted their efforts and attention away from the revolution. Moreover,economic hardship means that fewer individuals and their families may have fallen into thecategory of “rich peasants,” a legitimate group to be “struggled against”. Finally, regionsexperiencing shortages are less likely to have hosted “Red Guard” groups from other regionsduring the revolution.3
This relationship between transitory shocks to agricultural income and revolutionaryintensity enables the estimation of the latter’s impact on subsequent economic outcomes. Aninstrumental-variables strategy is used to address both omitted variable bias and classicalmeasurement error.4 A key identifying assumption is that climate shocks in the late-1960sshould not have long-term impacts of their own. Reduced-form estimates using climateshocks from nearby, non-revolution years indeed find this to be the case.
The empirical results show large and negative effects of revolutionary intensity on eco-nomic outcomes, such as the extent of industrialization and per-capita output. These impactsare detectable more than thirty years later, with some beginning to decline at longer timehorizons. For instance, an increase in reported deaths of 50 persons is estimated to havecaused a 17% decrease in the fraction of population employed in industry in 1982.5 Themagnitude of this effect is reduced to 11% by 1990. Both are significant at the 95% levelof confidence. By 2000, the estimated magnitude is further reduced to 3%, and no longer
2The theoretical relationship between income shocks and violence is ambiguous (see Fearon (2008), Dal Bóand Dal Bó (2011), Besley and Persson (2011)). On the one hand, adverse income shocks may lower theopportunity cost of participating in violence. On the other hand, such shocks also reduce the potentialsurplus available to be gained through violence. See Dube and Vargas (2013) for an empirical examinationof different types of income shocks and their implications for conflict.
3There was a policy directive at the time, which stated that “Red Guard” groups traveling to “spread therevolution” are entitled to free room and board wherever they went.
4In addition, we may be concerned about non-classical measurement error, or reporting bias. See section4 for robustness checks dealing with this issue.
5In the baseline sample, the average number of reported deaths is 86 persons per county, with a standarddeviation of 276.
4

statistically significant.The effect on per-capita GDP is equally large. Here an increase in reported deaths of 50
persons is associated with a 10% decrease in 1982. Moreover, this effect is persistent, withan estimated magnitude of 15% in 2000. Both results are significant at the 95% level.
In terms of mechanisms, there is evidence to support both the human and social capitalchannels. First, worse-affected areas tend to have significantly fewer college graduates asa percentage of their population. Second, residents in more revolutionary counties reportsignificantly less mutual lending with other members of their community. As for the timing ofpolicy reforms, I do not find systematic differences along the lines of revolutionary intensity.
In addition to the literature on the relationship between climate shocks and violence,6 thispaper is also closely related to a recent body of work studying the long-run impacts of violentconflict. For instance, Nunn (2008) finds adverse effects of slave exports from Africa during1400-1900 on the economic performance of these regions in 2000. Similarly, Acemoglu et al.(2011) estimate that Russian cities which experienced the Holocaust more intensely have hadworse economic indicators in the post-Soviet era. Dell (2012) studies legacies of the MexicanRevolution, and finds that municipalities with greater insurgent activities redistributed moreof their land, are more agricultural, and have lower incomes today. Lastly, there exists a smallliterature in economics investigating the educational impacts of the Cultural Revolution (seeMeng and Gregory (2002) and Giles et al. (2008)), by comparing cohorts with differentialexposures to the disruptions. To the best of my knowledge, this is the first paper to exploitspatial heterogeneity in revolutionary intensity as a source of identifying variation. Doingso allows for the examination of a more comprehensive set of economic outcomes, and theincorporation of general equilibrium effects.
A few caveats should accompany the results reported in this paper. First, the CulturalRevolution was a nationwide political movement. To the extent it shaped the economictrajectory of the country as a whole, we are unable to capture it in the analysis, whichexploits sub-national variation in revolutionary intensity. Second, this paper focuses on therural areas, and therefore the findings may not generalize to the urban centers. Third,the estimated impacts should not be interpreted as coming from violence alone, as otheraspects of the revolution (such as propaganda, education and economic policies) may wellbe correlated with our violence measures. Instead, they ought to be considered as the effectsof the revolution as a whole.
The remainder of the paper is organized as follows. Section 2 discusses the history of the6See Hsiang et al. (2013) for a recent survey and meta-analysis.
5

Cultural Revolution. Section 3 describes the data and empirical strategy. Section 4 reportsthe main findings, and Section 5 concludes.
2 Historical Background
The “Great Proletarian Cultural Revolution” was a complex social upheaval that began as astruggle between Mao Zedong and other senior party leaders for influence within the ChineseCommunist Party (CCP) and went on to affect all of China with its call for “continuing rev-olution. (Spence (1990))” Similar to other revolutionary movements in China and elsewhere,it had the objective of overthrowing politically-powerful individuals to reshape the natureof government and its policies. Specifically, it took aim at moderate party cadres who were“taking the capitalist road.” Unlike other episodes, however, the call for radical change camefrom within the party, and the movement placed an unprecedented emphasis on culture,broadly defined. This meant that even people without political power can become “classenemies” because of their professions, interests or backgrounds.
2.1 Origins of the Revolution
Numerous factors, both international and domestic, may have contributed to the CulturalRevolution’s conception (MacFarquhar and Schoenhals (2009)). Internationally, the SovietUnion was seen to have abandoned Marxism-Leninism after the death of Stalin. A seriesof anti-Soviet polemics issued in the mid-1960s in China denounced Khrushchev’s “phoneycommunism,” outlining “proof that the proletariat was under attack from the bourgeoisie.”In particular, these expositions criticized the USSR’s promotion of material incentives, toler-ance of large income differentials and the substitution of capitalist management for socialistplanning. This mixture of “revisionist” policies were considered a betrayal to the revolu-tionary ideals, and Mao Zedong and his allies may have been determined to prevent thesame “capitalist restoration” from occurring in China. Meanwhile, closer to home, this wasa period of military tension across the Taiwanese Strait, with the Nationalist Party stillharboring hopes of ultimate victory in the Chinese Civil War. To the extent that potentialsupport for the Guomindang still existed in the mainland, the Cultural Revolution was alsodesigned to deal that support a final blow.
It would be a mistake, however, to imply that the Revolution was launched in responseto overseas events alone. For domestically, China had only recently recovered from the GreatLeap Forward and the Famine of 1959-1961 that claimed the lives of tens of millions (Yang
6

(2012); Meng et al. (2010)). Partially acknowledging the role of government in causing thehardship of the preceding years, Mao was a passive figure in the years leading up to 1966,spending more time away from Beijing. During his leave of absence, the party leadershipendorsed more conservative policies that attempted to breathe new life into the agriculturalsector. Some of these initiatives, such as the partial restoration of family farming and ruralmarkets, while effective,7 would undoubtedly have been objectionable to an ideological puristsuch as Mao.
Finally, there were also concerns that the CCP was becoming too bureaucratic, withits members taking advantage of their privileged positions for personal gain. Rather thanresolving such cases internally to preserve the prestige of the party, Mao favored open criti-cism and the involvement of the people to expose and punish the members of the ruling classwho disagreed with him, framing this as a genuine socialist campaign involving the centralstruggle of the proletariat versus the bourgeoisie (Spence (1990)).
Ultimately it is this combination of events, together with Mao’s concern for his legacy,that gave birth to the Cultural Revolution. In August 1966, a directive entitled the “Decisionof the Central Committee of the Chinese Communist Party Concerning the Great ProletarianCultural Revolution” (a.k.a. the Sixteen Points) was issued to define the revolution’s goals:
“Although the bourgeoisie has been overthrown, it is still trying to use the old ideas,culture, customs and habits of the exploiting classes to corrupt the masses, capturetheir minds and endeavor to stage a come-back. The proletariat must do the op-posite... and change the mental outlook of society. At present, our objective is tostruggle against and overthrow those persons in authority who are taking the capital-ist road, to criticize and repudiate the reactionary bourgeois academic “authorities”and the ideology of the bourgeoisie, to transform education, literature, art and allother parts of the superstructure not in correspondence with the socialist economicbase, so as to facilitate the consolidation and development of the socialist system”.
2.2 Popular Participation
The implementation of such an ambitious program required popular participation. To thisend, China’s youth was called upon to become the next generation of revolutionaries. Be-ginning in Beijing, countless “Red Guard” organizations formed across the country within
7Per-capita GDP grew at 14.9% and 15.4% in 1964 and 1965 respectively.
7

a few months (Walder (2009); Perry and Li (1997); Howe (1981)). Schools and universitieswere closed for years, during which students were instructed to study communist classics,to identify and struggle against class enemies from their own communities, even families.Teachers and professors were frequently the targets of such struggles, due to their status as“reactionary bourgeois academics.”
Many of China’s cultural treasures also came under attack during the “Destroy the FourOlds” campaign,8 as they were deemed to be incompatible with the socialist system. Instead,numerous revolutionary ballets were commissioned as part of an elaborate propaganda op-eration. Furthermore, many local government officials were ousted from office during violentpower seizures, with new “revolutionary committees” formed as replacements (Vogel (1971);Walder and Su (2003)).
Meanwhile, purges were carried out in the highest ranks of the Communist Party, with theremoval of Liu Shaoqi and Deng Xiaoping the most prominent. Both had played influentialroles in reviving the economy after the Great Famine. As the nation’s president, Liu waslabeled “the biggest capitalist roader in the Party,” leading to his arrest in 1968. Regularlybeaten at public denunciation meetings, and denied medicine for his illnesses, he died inNovember 1969. Compared to Liu, Deng’s treatment was much milder. Sent to rural Jiangxiprovince to work as a factory worker for four years, he was eventually brought back intonational politics in early 1970s (Joseph et al. (1991)).
By the summer of 1967, there was widespread breakdown of order throughout the coun-try’s major urban centers, with violent clashes between opposing worker and student factions.As Mao later noted,9 “everywhere people were fighting, dividing into two factions; there weretwo factions in every factory, in every school, in every province, in every county; every min-istry was like that, the Foreign Ministry was in chaos... In July and August 1967, nothingcould be done; there was massive upheaval throughout the country.”
The reasons behind this overwhelming response has been a central topic of inquiry amongCultural Revolution scholars (Meisner (1999)). A popular theory emphasizes the Party’srepressive policies during the preceding decades. In particular, the CCP had devised effectivemethods of control that involved assigning class labels to each person, and giving the bossof each work unit nearly unlimited control over and knowledge of the lives of all the workersaccountable to him or her. As a result, it has been argued, freedom of expression wasdenied, people were totally dependent on their bosses and were obliged to sacrifice and
8These were Old Customs, Old Culture, Old Habits, and Old Ideas respectively.9Jianguo Yilai Mao Zedong wengao,13:163
8

remain completely obedient to the Chinese nation, and only Party members exercised directinfluence over their own lives. Thus, to the youth of the day, the Cultural Revolutionrepresented a release from their shackles, frustrations, and feelings of powerlessness. Italso gave them the freedom to exact revenge on those whom they believed exercised undueinfluence over them or whom they had been told were “class enemies.”
2.3 Rural Rustification
In an attempt to end the urban unrest of 1967, a large-scale rural rustification programwas initiated in part to discharge the Red Guards (Bernstein (1977)). Also known as Mao’smass send-down movement, it was framed as a necessary exercise so that urban youth couldbe re-educated by the poor peasants through farm labor. It also served the purposes ofreducing unemployment in urban areas, as well as increasing agricultural output (Zhou andHou (1999)). Some were no doubt inspired by the revolutionary and patriotic propagandaand went to the countryside voluntarily. However, most did not, and coercion in the formof threatened job loss for parents was used to ensure compliance (Li et al. (2010)). From1967 until 1978, an estimated 17 million urban youths were sent down to rural areas. Thevast majority returned to cities after a few years, although roughly 5 percent stayed onpermanently.
2.4 Disruptions to Education
The rural rustificaiton movement was not the only program that affected the educationalopportunities of China’s youth during this period. Starting in 1966, all primary schools inurban China were closed for 2-3 years, and secondary- and tertiary-level institutions wereclosed for much longer. Some primary and middle schools reopened in 1968-69, so thosewho would have completed primary school in 1966-68 were able to go on to high school andchildren aged 7-9 began primary school. However, teachers were not allowed to follow thestandard curriculum, and instead students were asked to study Mao Zedong Thought andlearn farming and manual labor. Those of normal graduation age for middle- or high- schoolwere given diplomas even though they did not complete a traditional middle- or high-schooleducation. High schools stopped admitting new students during 1966-72, and when theyfinally reopened, their curriculum focused on factory and farm work.
Universities were closed from 1966 to 1970-71, although those who had entered univer-sity before the Revolution and had not completed their degrees were allowed to stay there
9

without formal teaching until 1970-71. They were then given a university degree and as-signed jobs. After 1970-71, universities began to admit students, with new admission criteriabased on the political attitudes or family background of the students, which favored unskilledworkers, peasants, soldiers, party cadres, or students whose parents were from these groups.Admission was not based on academic merit, and no high-school graduates were allowed togo to college directly. As in the lower-level schools, students in universities did not receivethe education provided by a normal curriculum; instead political study was given emphasis.
2.5 “Cleansing the Class Ranks”
While the chaos of urban areas in 1967 has been studied extensively, the extent of violencein rural areas has only become apparent within the last decade (Su (2011)). Contrary toconventional wisdom, rural China suffered at least as much during the Cultural Revolution,although during a slightly later period.
Following the formation of the new “revolutionary committees,” the Revolution enteredits bloodiest phase in rural counties as the "cleansing of the class ranks" campaign gotunderway in 1968. As with many other policy directives during this period, the centralleadership’s instructions left plenty of room for local interpretation. Consequently, “in someplaces it became a massive pogrom against people of exploiting class backgrounds; in someplaces a campaign of retribution and murder against factional rivals; and in still others acampaign of torture and murder to uncover wholly imaginary mass conspiracies that couldinvolve tens of thousands. (MacFarquhar and Schoenhals (2009))”
In southwestern Yunnan province, according to calculations made by the provincial au-thorities in August 1969, 448,000 people were targeted in the province as a whole. Of these,some 15,000 were “cleansed” as either “bourgeois” or “counter-revolutionary” elements, with6,979 dying in the process.10 In eastern Hebei, more than 84,000 individuals were persecutedon suspicion of being members of an underground Guomindang network: tortured duringinterrogation, 2,955 of them died, and 763 suffered permanent injuries.11 In Zhejiang, anestimated 100,000 people were “arrested, detained, dragged out, and struggled” during thecourse of the movement and a total of 9,198 officially “hounded to death.”12
In Inner Mongolia, there was a campaign against deposed regional leader Ulanfu’s “anti-10Zhongguo gongchandang Yunnan sheng zheng jun tong qun zuzhi shi ziliao 1926.11-1987.10 (Materials
on the History of the CCP Organization, Government, Military, United Front, and Mass Organizations inYunnan Province, November 1926 - October 1987)(Beijing: Zhonggong dangshi chubanshe, 1994), p.231
11Jin Chunming, Huang Yuchong, and Chang Huimin, “Wenge” shiqi guaishi guaiyu, pp. 386-387.12Cheng Chao and Wei Haoben, Zhejiang “Wenge” jishi, p.104
10

party clique” and the ferreting out of suspected members of a “New Inner Mongolian People’sParty,” an alleged “counter-revolutionary” underground organization of ethnic separatistswith clandestine links to Outer Mongolia and the Soviet Union. Most of the people atthe receiving end of these local campaigns were of Mongolian descent. A post-CulturalRevolution Central Document, Zhongfa [1981] 28, noted that in Inner Mongolia
the number of people that were put in prison, criticized, struggled, isolated, and in-vestigated in direct connection with the three big unjust cases totaled 790,000. Ofthese, 22,900 died and 120,000 were maimed. While “ferreting out and eliminating”additional enemies, some 8,000 herdsmen living close to the border with Outer Mon-golia were forcibly resettled farther inland, and this caused the death of an additional1,000 people.
Though the precise dynamics of conflict differed across regions, more educated individualssuffered disproportionately almost everywhere. Another common theme of violence in ruralareas is the lack of external intervention. Unlike the street battles of urban centers, thePeople’s Liberation Army were absent, and the majority of perpetrators and victims werefrom the same communities.
2.6 Return to Order
The terrors of 1968 and 1969 coincided with changes at the top of the CCP leadershipthat would foreshadow the end of the revolution, and thereby restore order to much of thecountry by the early 1970s. A key turning point was the downfall of Lin Biao in late 1971.As Defense Minister and the de facto head of the People’s Liberation Army, Lin was one ofthe protagonists of the Cultural Revolution. He was instrumental in the promotion of Mao’spersonality cult, directing the compilation of his book of quotations (also known as TheLittle Red Book13). By 1969, he was officially appointed Mao’s successor at the NationalParty Congress.
Little over a year later, however, Lin’s political future as heir apparent was in doubt,following the promotion of numerous civilian officials to the Politburo. Ambiguities over thesuccession process finally culminated in a failed assassination attempt on Mao Zedong byLin and his supporters in September 1971. The events that transpired next have been the
13One of the most printed books in history, more than a billion copies of “Quotations from Chairman MaoZedong” was circulated between 1964 and 1976, according to official statistics.
11

subject of lengthy debate, with the official narrative being that Lin and his family died in aplane crash while fleeing to the USSR.
Whatever the actual version of events, Lin Biao’s demise served to discredit the widerpolitical movement by highlighting glaring inconsistencies in the official propaganda, whichhad hailed him as a “true Marxist revolutionary” and Mao’s “closest comrade in arms.” Hisapparent defection therefore marked a “major turning point” that “objectively proclaimedthe theoretical and practical defeat of the Cultural Revolution.”
By 1974, China’s two most powerful leaders, Zhou Enlai and Mao Zedong, were chron-ically ill and unable to govern effectively. The four remaining leaders of the Revolution,led by Mao’s wife Jiang Qing, engaged in an internal power struggle with more moderate,pragmatic Party leaders such as Deng Xiaoping.
Soon after Mao’s death in September 1976, Hua Guofeng, the CCP’s second-in-command,seized power and arrested the four remaining leaders of the Revolution, the so-called “Gangof Four” and finally marked the end of the tumultuous decade.
2.7 Contemporary Economic Impacts
Besides the political upheaval, the Cultural Revolution was also a disastrous time for thecountry’s economy, as regional governments pursued policies that were invariably antagonis-tic towards private business. The aggregate impact can be seen from Figure 5, which plotsthe evolution of per-capita GDP for China as a whole from 1952 to 1978.
In Jiangxi province, for instance, the government shut down and dissolved all of thecooperative shops and retail outlets, in order to “eradicate once and for all” any signs of“capitalism.” Moreover, it revoked the licenses of all private petty traders. The traders(some 15,900 in number) and about one-third (18,800) of the employees of the dissolvedcollectively-run shops were relocated to the countryside, where they were assigned jobs inthe agricultural sector.
For the country as a whole, the value of total production declined by 9.6 percent in 1967,with industry harder hit than agriculture. The decline continued steadily in 1968, when theindustrial output of the southern provinces of Henan, Hubei, and Hunan combined declinedby 25 billion yuan. In southwest China, output was down by more than 41 percent; inYunnan, the output value of state-owned industries dropped by almost two-thirds.
Despite the disruptions, the agricultural sector remained relatively unscathed. In someareas, this was an unintended by-product of a dysfunctional state bureaucracy, as factionalfighting made it impossible for government personnel to attend to their tax collection duties.
12

While the contemporary economic impacts are well documented, the extent to which theRevolution may have permanently shaped the development trajectories of different regionsis hitherto unexplored. It is to this task that we now turn.
3 Data and Empirical Strategy
While the CCP’s Central Committee formally acknowledged in its 1981 Resolution on PartyHistory that the “Cultural Revolution was responsible for the most severe setback and theheaviest losses suffered by the Party, the state and the people since the founding of thePeople’s Republic,” there does not yet exist a centralized and publicly-available source ofinformation on the violence that occurred in the different regions.
3.1 Regional Gazetteers
Instead, our analysis uses a county-level dataset digitized from regional gazetteers publishedduring the late-1980s (Walder and Su (2003)). These are book-length volumes of localhistory, and contain a wealth of information about a wide range of subjects (e.g. localgeography, economics, politics, and so on), including the county’s experience during theCultural Revolution. The tradition of producing regional gazetteers in China dates back tothe Han dynasty (202BC-220AD), when local gentries became invested in their productionas a source of information and local pride. While the quality and content of gazetteers varyacross regions, most local governments devoted significant resources for this purpose. Theywere often years in the making, with a designated team of dozens involved. As a result,China scholars have often relied on these publications for different research projects acrossthe social sciences (e.g. Chen et al. (2013)).
The casualty numbers reported in these publications are the consequence of a central pol-icy directive, issued in 1978, that called for the rehabilitation of victims in “false, innocent,and wrongful” cases during the Cultural Revolution. Specifically, each county governmentwas instructed to form a delicately-named “Resolving Remaining Historical Problems Com-mittee,” headed by top party leaders, to investigate relevant cases. The findings were laterused to compensate remaining family members, as well as to prosecute perpetrators of thecrimes. There is large variation in the amount of detail that is included in these histo-ries. Some devote tens of pages to describing the events that unfolded, while others simplyacknowledge their existence.
13

The gazetteer of Lingui county in Guangxi province provides one example that is typicalof areas with detailed records of the killings14:
In the name of “cleansing the class ranks” and “mass dictatorship,” indiscriminatekillings took place across the county. Between mid-June and August [of 1968], 1,991people were killed as members of “Assassination Squads,” “Anti-Communist Armyof Patriots,” and other “black groups.” Among them were 326 cadres, 79 work-ers, 53 students, 68 ordinary urban residents, 547 peasants, and 918 Four-Typeelements (landlords, rich peasants, counter-revolutionaries, and bad elements) andtheir children. Among the 161 brigades [of the county], only Wenquan in Huixianand Dongjiang in Wantian did not indiscriminately detain and kill.
The gazetteers also serve as the primary source of information for baseline economicoutcomes (such as the extent of industrialization and population size), as well as the timingof agricultural policy reforms. Data on these variables are digitized by the author, using thearchives from the C.V. Starr East Asian Library of the University of California at Berkeley.Detailed definitions of these variables are included in the data appendix.
3.2 Other Data Sources
In addition to these archives, the analysis uses multiple rounds of census data, covering boththe period before the Cultural Revolution (the most recent year being 1964) and the periodafterwards (1982, 1990 and 2000). These data provide information on numerous countycharacteristics (e.g. geographic size, population structure, ethnic minority groups, etc.), aswell as economic outcomes (e.g. per-capita income). These are merged with the archivaldata to construct a panel for 1692 rural counties.
To investigate outcomes related to preferences and trust, I use household-level data fromthe rural sample of the 2002 wave of the China Household Income Project (CHIP). This is anationally-representative income-expenditure survey, with an added social-networks module.While the questionnaire is detailed, the number of counties included is small (80 in total).
Finally, data on monthly precipitation and temperature from 1950 to 2010 come from theUniversity of Delaware’s Center for Climatic Research.15 This widely-used dataset (some-times referred to as the Matsuura and Willmot data) provides climate information for each
14Lingui xianzhi (Beijing: Fangzhi chubanshe, 1996), p.492.15See: http://climate.geog.udel.edu/~climate/html_pages/archive.html#gcd
14

0.5 degree * 0.5 degree grid cell. Spatial averages corresponding to administrative boundariesof Chinese counties are then computed using the ArcGIS software.
3.3 Empirical Strategy
While the dataset on casualties is extensive in its geographic coverage - over 80% of allcounties in mainland China are included in the sample - it likely contains measurement errorin the form of under-reporting. For the purposes of our study, it is important that the extentof under-reporting is not correlated with the degree of violence. To check for the robustnessof our results to potential reporting bias, I complement the baseline analysis by restrictingattention to counties with detailed accounts of the revolution, as proxied by the length ofreports in their gazetteers, as well as dropping counties with zero reported fatalities.
As Figure 1 indicates, there is a great deal of variation in the geographic distributionof revolutionary intensity. In particular, the southern provinces of Guangxi, Guangdongand Yunnan experienced the most violence. There was also relatively more violence inthe northeast and inner Mongolia. The central and eastern regions, on the other hand,appear to have been more peaceful. The non-random nature of revolutionary intensitymakes causal inference challenging. On the one hand, we may be concerned that morerevolutionary regions were more likely to have a history of prior conflicts and were worse offeconomically to begin with, leading to an overestimation of the effects. On the other hand,it is possible that areas with higher educational attainment, and therefore growth potential,suffered disproportionately because of the presence of “bourgeois elements,” resulting in anunderestimation of the true impacts.
To make progress, the empirical specification controls for pre-revolution outcomes (e.g.the extent of industrialization, size of population) and province fixed effects. Furthermore,temporary fluctuations in local economic conditions during the violence years, as driven byclimate shocks, provide a source of plausibly exogenous variation.
In other words, the main estimating equation is the following:
Yc,p,1982 = α + βCRc,p + γ′Xc,p + λYc,p,1964 + µp + εc,p,1982 (1)
where CRc,p is the number of casualties in county c of province p, Xc,p is a vector ofcounty characteristics, µp is a province fixed-effects term, and Yc,p is the outcome of interest(e.g. extent of industrialization, per-capita GDP, education, etc.). The vector of controlsinclude population size in 1964, fraction of non-agricultural population in 1964, gender ratio
15
among 15-24 year-olds in 1970, area size, an index of ethnolinguistic fractionalization, aswell as long-run average precipitation and temperature.
Using absolute deviations of precipitation in 1968 and 1969 from the county’s long-runaverage as an instrument for CRc,p, we have the following first-stage equation:
CRc,p = α + βPrecipc,p,1968/9 + γ′Xc,p + λYc,p,1964 + µp + εc,p (2)
The choice of 1968/9 is based on the fact that they were the worst years of violence forthe counties in our sample (Su (2011)).
Although not the primary focus of the present study, the determinants of political violenceis an interesting research topic in its own right. Here the first-stage relationship estimateswhether baseline economic outcomes and population characteristics have predictive powerfor the violence measure. In particular, some recent studies have explored the class originsof ethnic conflicts (Esteban and Ray (2008); Esteban et al. (2012)). By including an indexof ethnolinguistic fractionalization16 as a regressor, we can investigate whether the overtlyclass-based rhetoric during the Cultural Revolution manifested itself in the form of ethnicconflicts. If this is true, we would expect areas with more ethnically-diverse populations toexhibit higher levels of violence.
In order for the IV approach to deliver consistent estimates, we need to assume bothexogeneity and excludability of the instrument. Fortunately both assumptions can be testedempirically in our setting through the use of falsification tests. In the case of exogeneity, wecan regress various county characteristics and baseline economic outcomes on the instrument.In the case of excludability, we can run regressions of economic outcomes on climate shocksfrom nearby, but non-revolutionary years as placebos.
To investigate potential regional spillover effects, I also include the number of deaths inneighboring counties from the same prefecture as an explanatory variable in the outcomesregressions. The coefficient estimate on this term can shed light on the extent to whichevents outside of a given county can affect outcomes within it.
A somewhat mechanical way in which the revolution may have affected economic tra-jectories is through that of migration. In particular, more educated individuals may havemoved away from worse-affected areas to seek refuge from the violence. On the other hand,to the extent that a shortage of skilled labor implied higher factor returns in the 1980s, theremay be incentives for such individuals to migrate into the more revolutionary areas during
16This index is constructed as follows: consider a society composed of K ≥ 2 different ethnic groups andlet pk indicate the share of group k in the total population. The ELF index is given by 1−
∑Kk=1 p
2k.
16

the subsequent period. While theoretically plausible, it is unlikely for migration to haveplayed an important role before the mid-1980s, due to China’s strict household registrationsystem (also known as the hukou system). To examine possible effects after the system’spartial relaxation, I look at the relationship between revolutionary intensity and the fractionof immigrants within the local population in 1990.
To investigate human capital impacts, I use the share of college graduates within the localpopulation in 1982 and 1990 as the main outcomes. This represents a combined measure ofthe quantity and quality of education available at the primary and secondary levels.
In terms of trust, I make use of survey data from the 2002 wave of the China HouseholdIncome Project. In particular, rural households were asked about the extent to which theyengage in mutual lending with other households in their villages. Given the imperfect natureof formal credit and insurance markets in these areas, informal lending of this type representsan important financial management tool. The answer to this question is used as a proxy forthe level of trust in these communities. Unfortunately there does not exist similar survey datafor the pre-revolution period, rendering the findings more correlational in nature. Moreover,due to the small number of counties (80 in total) in the sample, there does not exist a strongfirst-stage relationship between climate shocks and revolutionary intensity.
Finally, after 1978, the Chinese government pursued much more liberal economic policies.A key reform was the introduction of the so-called “household responsibility” system, wherebyagricultural households were allowed to sell their surplus output on local markets. ManyChina scholars have interpreted this change as a “reactionary backlash” against the ultra-left policies in place during the Cultural Revolution. To investigate this claim, I use dataon the timing of the reform’s implementation at the county level to study whether morerevolutionary areas indeed liberalized earlier.
4 Results
Before discussing the regression results, there are a few points worth noting in the summarystatistics reported in Table 1. First, the counties in our baseline sample is predominantlyrural, where the average fraction of non-agricultural population in 1964 is only 8.2%. Thisnumber increases dramatically over time, to more than 26% by 2000. Second, and relatedly,our sample is relatively poor. The average per-capita GDP in 2000 is just under 5,000 RMB,compared to an average per-capita GDP of almost 9,000 RMB for the country as a whole.In terms of the casualty figures, the mean number of reported fatalities is 86 persons (with a
17

standard deviation of 276), while the mean number of victims is 4860. The latter representsapproximately 2% of the total population in 1964. In terms of ethnic diversity, our sampleis relatively homogeneous, with an average ELF value of 0.136.
4.1 The Determinants of Revolutionary Intensity
Table 2 reports regression results examining the determinants of violence. First, areas with alarger population in 1964 had more deaths. Second, areas with worse-than-normal harvests in1968/9 suffered less. This can be seen from the negative coefficient estimate on the “averagerainfall deviation in 1968 and 1969” variable. This result differs from those found in someearlier studies (e.g. Miguel et al. (2004)), which have tended to find a positive relationshipbetween adverse climate shocks and the incidence of violence.17
The context of the revolution may help us make sense of this pattern. Specifically, itis important to remember that participating in revolutionary activities carried no obviouseconomic benefit. This is in sharp contrast to the other episodes of political violence analyzedin the literature, where the ultimate objective is the capturing of resources. As a result,individuals and local governments focused on dealing with agricultural shortages may wellhave diverted their efforts and attention away from the revolution. Moreover, economichardship means that fewer individuals and their families may have fallen into the categoryof “rich peasants,” a legitimate group to be “struggled against”. Finally, regions experiencingshortages are less likely to have hosted “Red Guard” groups from other regions during therevolution.18
In addition, areas with a higher male/female gender ratio among 15-24 year-olds in 1970had significantly more deaths. This is perhaps unsurprising, given the role of the largely-male “Red Guards” as perpetrators. Moreover, this could also be a proxy for backwardness,due to a traditional preference for sons. In other words, areas that were socially and eco-nomically more backward may have experienced greater violence. Interestingly, the extentof industrialization in 1964 does not appear to be significant in predicting the number offatalities.
In terms of ethnolinguistic fractionalization, more diverse areas experienced less violence.17The theoretical relationship between income shocks and violence is ambiguous (see Fearon (2008), Dal Bó
and Dal Bó (2011), Besley and Persson (2011)). On the one hand, adverse income shocks may lower theopportunity cost of participating in violence. On the other hand, such shocks also reduce the potentialsurplus available to be gained through violence. See Dube and Vargas (2013) for an empirical examinationof different types of income shocks and their implications for conflict.
18There was a policy directive at the time, which stated that “Red Guard” groups traveling to “spread therevolution” are entitled to free room and board wherever they went.
18
This runs contrary to the hypothesis that the Culture Revolution may have triggered signif-icant ethnic conflicts along the lines of Esteban and Ray (2008). Instead, it seems that therewas more violence in ethnically-homogeneous areas.
Finally, as a placebo test, column 3 show that rainfall deviations in 1964 and 1965 donot have any predictive power in the first-stage regression.
4.2 Economic Impacts
Before turning our attention to the estimated coefficients, Figures 2 and 3 map the extent ofindustrialization before and after the Cultural Revolution respectively. While there is a highdegree of serial correlation, there are a couple of note-worthy changes. First, the Shandongpeninsula south of Beijing appears to have become relatively more industrialized over thisperiod. Second, the southwestern provinces of Yunnan and Guangxi moved in the oppositedirection. Interestingly, the former experienced relatively little violence, while the lattersuffered much more heavily. Another way of seeing this relationship is through Figure 6,which plots the kernel densities of the change in industrialization rates separately for areasin the top and bottom quartiles of our deaths measure. The distribution clearly shifts to theright for the less-revolutionary counties.
The econometric results show large and negative effects of revolutionary intensity oneconomic outcomes, particularly the extent of industrialization and per-capita GDP. Theseimpacts are detectable more than thirty years later, with some beginning to decline at longertime horizons. For instance, an increase in reported deaths of 50 persons is estimated tohave caused a 17% decrease in the fraction of population employed in industry in 1982 (seeTable 4).19 The magnitude of this effect is reduced to 11% by 1990. Both are significant atthe 95% level of confidence. By 2000, the estimated magnitude is further reduced to 3%,and no longer statistically significant.
The effect on per-capita GDP is equally large. Here an increase in reported deaths of 50persons is associated with a 10% decrease in 1982. Moreover, this effect is persistent, withan estimated magnitude of 15% in 2000. Both results are significant at the 95% level.
19In the baseline sample, the average number of reported deaths is 86 persons per county, with a standarddeviation of 276.
19

4.3 Mechanisms
The most direct mechanism through which the revolution may have affected subsequent eco-nomic outcomes is the loss of human capital, considering the identities of the victims. Thereis some evidence for this mechanism in the findings reported in Table 7. Using the fractionof local population with college education in 1982 as an outcome measure, we find a largeand almost statistically-significant impact (t-statistic = 1.63). Specifically an increase in re-ported fatalities of 50 persons is associated with an 11% decrease in the share of populationwith college education. As with the industrialization measure, this effect appears to diminishover time, such that by 1990 the point estimate is both smaller and not significant.
Table 8 reports estimates on the potential role of migration in driving economic dispar-ities. While it is impossible to investigate the importance of out-migration with the dataavailable, worse-affected areas do appear to have significantly lower shares of immigrants intheir 1990 populations. The point estimate is large and negative - an increase in reportedfatalities of 50 persons is associated with a 23% decrease in the share of immigrants.
Table 9 reports results on whether the revolution may have altered the timing of agri-cultural reforms. This allows us to test the “reactionary backlash” hypothesis against the“ideological persistence” hypothesis. The former predicts a negative relationship (i.e. morerevolutionary areas liberalized earlier), while the latter predicts the opposite. Overall, theredoes not appear to be any evidence for either theory, with the coefficient estimates close tozero.
Finally, Table 10 reports correlational evidence in support of the social capital channel.In particular, residents in worse-affected counties engage in significantly less mutual lendingwith other members of their community in 2002. This result is robust to the inclusion of alarge number of household and village controls. Although precisely estimated, the magnitudeof the effect is small - an increase in reported fatalities of 50 persons is associated with a1.3% decrease in the extent of mutual lending.
4.4 Placebo Tests and Robustness Checks
As mentioned in the previous section, two assumptions are required for an instrumental-variables strategy to deliver consistent estimates in this context: exogeneity and excludabil-ity. To test the former, I regress all available non-climatic county characteristics on theinstrument, controlling for province fixed effects. The results are reported in Table 3. Noneof the observed characteristics are correlated with the IV. It should be noted that the in-
20

strument is correlated with the average climatic variables, which are included in all of theoutcomes regressions.
As a test for excludability, Table B1 reports reduced-form regressions for all of theoutcome variables with significant results, including rainfall deviations from each of threeyears either side of the revolution as placebos. Overall, rainfall deviations from the non-revolutionary years do not appear to be systematically correlated with our outcome vari-ables. The instrument, on the other hand, does appear to be significantly and positivelycorrelated with all of the outcomes.
Finally, to address concerns of reporting bias in the casualties measure, I first restrict thesample to areas with non-zero fatalities (Table B2), then to areas with relatively detailedcoverage of the Revolution in their respective gazetteers (Table B3). In both cases, thepoint estimates are largely unchanged compared to those obtained from the baseline sample,though they are somewhat less precisely estimated, due to the smaller sample size.
5 Conclusion
In this paper, I investigate the economic legacies of the Cultural Revolution in rural China.Regions that experienced the revolution more intensely were slower to industrialize, hadlower levels of education and per-capita output. These effects were large in magnitude,detectable more than thirty years later, and in some cases begin to decline at longer timehorizons. Trust-based informal lending does appear to have been adversely affected, while thetiming of policy reforms does not. Taken together, these findings suggest that the CulturalRevolution significantly affected the economic trajectories of the different regions.
Several caveats should accompany these empirical results. First, the Cultural Revolutionwas a nationwide political movement. To the extent it shaped the economic trajectory ofthe country as a whole, we are unable to capture it in the analysis, which exploits sub-national variation in revolutionary intensity. Second, this paper focuses on the rural areas,and therefore the findings may not generalize to the urban centers. Third, the estimatedimpacts should not be interpreted as coming from violence alone, as other aspects of therevolution (such as propaganda, education and economic policies) may well be correlatedwith our violence measures. Instead, they ought to be considered as effects of the revolutionas a whole.
Going forward, more work is needed to understand the reasons behind why some of theeconomic consequences documented here are more persistent than others, how the urban
21

experience differs from that of the rural areas, and what other non-economic factors canhelp explain the differences in revolutionary intensity.
References
Acemoglu, Daron, Tarek A Hassan, and James A Robinson (2011), “Social Structure andDevelopment: A Legacy of the Holocaust in Russia.” The Quarterly Journal of Economics,126, 895–946.
Bernstein, Thomas P (1977), Up to the Mountains and Down to the Villages. The Transferof Youth from Urban to Rural China.
Besley, Timothy and Torsten Persson (2011), “The Logic of Political Violence.” The QuarterlyJournal of Economics, 126, 1411–1445.
Callen, Michael, Mohammad Isaqzadeh, James D Long, and Charles Sprenger (2011), “Vio-lent Trauma and Risk Preferences: Artefactual Experimental Evidence from Afghanistan.”Unpublished manuscript.
Chen, Yixin (1999), “Lost in Revolution and Reform: The Socioeconomic Pains of China’sRed Guards Generation, 1966–1996.” Journal of Contemporary China, 8, 219–239.
Chen, Yuyu, Hongbin Li, and Lingsheng Meng (2013), “Prenatal Sex Selection and MissingGirls in China: Evidence from the Diffusion of Diagnostic Ultrasound.” Journal of HumanResources, 48, 36–70.
Dal Bó, Ernesto and Pedro Dal Bó (2011), “Workers, Warriors, and Criminals: Social Conflictin General Equilibrium.” Journal of the European Economic Association, 9, 646–677.
Davis, Donald R. and David E. Weinstein (2002), “Bones, Bombs, and Break Points: TheGeography of Economic Activity.” American Economic Review, 92, 1269–1289.
Dell, Melissa (2012), “Path Dependence in Development: Evidence from the Mexican Revo-lution.”
Dube, Oeindrila and Juan Vargas (2013), “Commodity Price Shocks and Civil Conflict:Evidence from Colombia.” The Review of Economic Studies.
22

Esherick, Joseph, Paul G. Pickowicz, and Andrew G. Walder (2006), The Chinese CulturalRevolution as History. Stanford University Press.
Esteban, Joan, Laura Mayoral, and Debraj Ray (2012), “Ethnicity and Conflict: An Empir-ical Study.” The American Economic Review, 102, 1310–1342.
Esteban, Joan and Debraj Ray (2008), “On the Salience of Ethnic Conflict.” The AmericanEconomic Review, 98, 2185–2202.
Fearon, James (2008), “Economic Development, Insurgency, and Civil War.” Institutions andEconomic Performance, 292–328.
Forster, Keith (1990), Rebellion and Factionalism in a Chinese Province: Zhejiang, 1966-1976. ME Sharpe.
Giles, John, Albert Park, and Meiyan Wang (2008), “The Great Proletarian Cultural Revo-lution, Disruptions to Schooling, and the Returns to Schooling in Urban China.”
Howe, Christopher (1981), Shanghai: Revolution and Development in an Asian Metropolis.Cambridge University Press.
Hsiang, Solomon M, Marshall Burke, and Edward Miguel (2013), “Quantifying the Influenceof Climate on Human Conflict.” Science.
Jia, Ruixue (2010), “The Legacies of Forced Freedom: China’s Treaty Ports.”
Joseph, William A, Christine PW Wong, and David Zweig (1991), New Perspectives on theCultural Revolution.
Li, Hongbin, Mark Rosenzweig, and Junsen Zhang (2010), “Altruism, Favoritism, and Guiltin the Allocation of Family Resources: Sophie’s Choice in Mao’s Mass Send-Down Move-ment.” Journal of Political Economy, 118, 1–38.
Lin, Justin Yifu (1992), “Rural Reforms and Agricultural Growth in China.” The AmericanEconomic Review, 34–51.
MacFarquhar, Roderick and Michael Schoenhals (2009), Mao’s Last Revolution. HarvardUniversity Press.
Meisner, Maurice J (1999), Mao’s China and after: A History of the People’s Republic. FreePress (New York, NY).
23

Meng, Xin and Robert G Gregory (2002), “The Impact of Interrupted Education on Sub-sequent Educational Attainment: A Cost of the Chinese Cultural Revolution.” EconomicDevelopment and Cultural Change, 50, 935–959.
Meng, Xin, Nancy Qian, and Pierre Yared (2010), “The Institutional Causes of China’s GreatFamine, 1959-61.”
Miguel, Edward and Gerard Roland (2011), “The Long-run Impact of Bombing Vietnam.”Journal of Development Economics, 96, 1–15.
Miguel, Edward, Shanker Satyanath, and Ernest Sergenti (2004), “Economic Shocks andCivil Conflict: An Instrumental Variables Approach.” Journal of Political Economy, 112,725–753.
Naughton, Barry (2007), The Chinese Economy: Transitions and Growth. The MIT Press.
Nunn, Nathan (2008), “The Long-term Effects of Africa’s Slave Trades.” The QuarterlyJournal of Economics, 123, 139–176.
Nunn, Nathan and Leonard Wantchekon (2011), “The Slave Trade and the Origins of Mis-trust in Africa.” American Economic Review, 101, 3221–3252.
Perry, Elizabeth J. and Xun Li (1997), Proletarian Power: Shanghai in the Cultural Revo-lution. Boulder, C.O.: Westview.
Spence, Jonathan D (1990), The Search for Modern China. WW Norton & Company.
Su, Yang (2011), Collective Killings in Rural China during the Cultural Revolution. Cam-bridge University Press.
Vogel, Ezra F. (1971), The Cultural Revolution in the Provinces. Harvard University Press.
Voors, Maarten J., Eleonora E. M. Nillesen, Philip Verwimp, Erwin H. Bulte, RobertLensink, and Daan P. Van Soest (2012), “Violent Conflict and Behavior: A Field Ex-periment in Burundi.” American Economic Review, 102, 941–964.
Walder, Andrew G (2009), Fractured Rebellion: The Beijing Red Guard Movement. HarvardUniversity Press.
Walder, Andrew G. and Yang Su (2003), “The Cultural Revolution in the Countryside:Scope, Timing and Human Impact.” The China Quarterly.
24

Xu, Chenggang (2011), “The Fundamental Institutions of China’s Reforms and Develop-ment.” Journal of Economic Literature, 49, 1076–1151.
Yang, Jisheng (2012), Tombstone: The Great Chinese Famine, 1958-1962. Macmillan.
Zhang, Junsen, Pak-Wai Liu, and Linda Yung (2007), “The Cultural Revolution and Returnsto Schooling in China: Estimates Based on Twins.” Journal of Development Economics,84, 631–639.
Zhou, Xueguang and Liren Hou (1999), “Children of the Cultural Revolution: the State andthe Life Course in the People’s Republic of China.” American Sociological Review, 12–36.
25
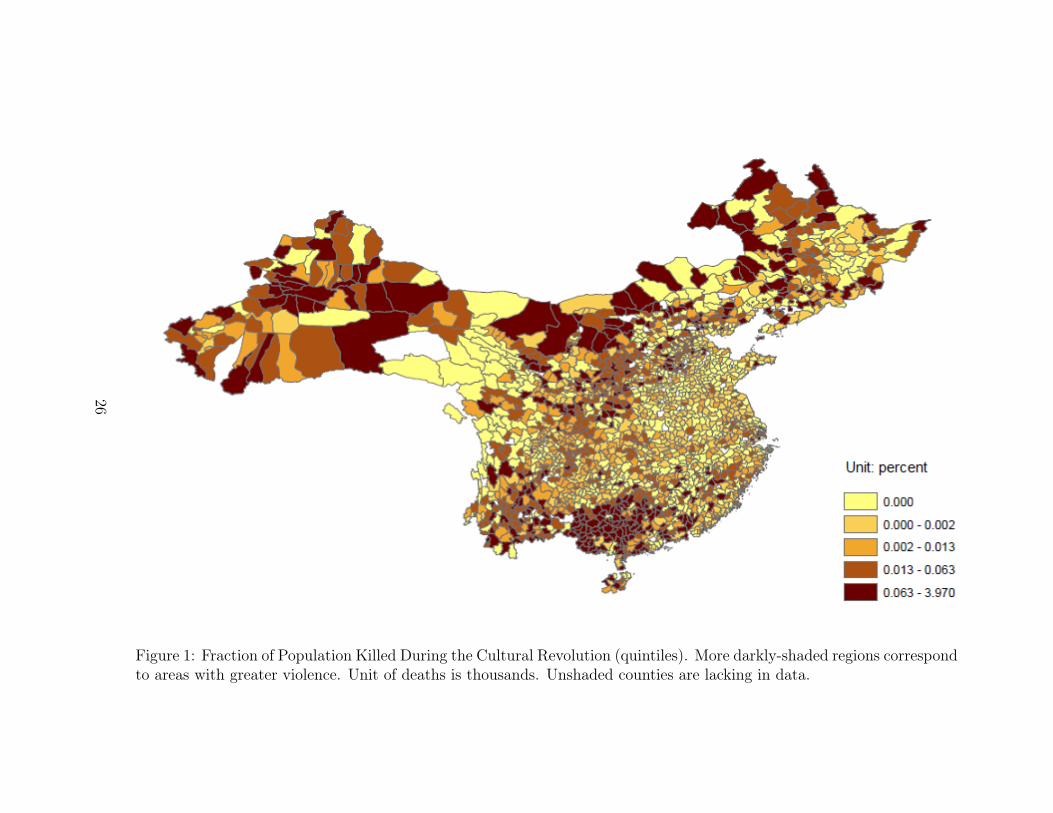
Figure 1: Fraction of Population Killed During the Cultural Revolution (quintiles). More darkly-shaded regions correspondto areas with greater violence. Unit of deaths is thousands. Unshaded counties are lacking in data.
26

Figure 2: Rural Industrialization in 1964 (quintiles). More darkly-shaded regions correspond to areas with a larger shareof their population working in industry. Unshaded counties are lacking in data.
27

Figure 3: Rural Industrialization in 1982 (quintiles). More darkly-shaded regions correspond to areas with a larger shareof their population working in industry. Unshaded counties are lacking in data.
28

Figure 4: Absolute rainfall deviation in 1968/9 from 1950-2010 average (quintiles). More darkly-shaded regions correspondto areas with a larger deviation. Unshaded counties are lacking in data.
29

Figure 5: Per-capita GDP, 1952 - 1978
Figure 6: Kernel Density Plots of Industrialization by Revolutionary Intensity
30

Figure 7: Relationship Between Temporary Climate Shocks and Violence
Figure 8: IV Estimates of Revolutionary Intensity on Industrialization over time
31

Figure 9: IV Estimates of Revolutionary Intensity on Per-capita GDP over time
32

Table 1: Summary Statistics
Variable Name Mean Std. Dev. Min. Max. N
Panel A: Cultural Revolution Variables
Number of deaths (1000 persons) 0.086 0.276 0 4.519 1692Number of victims (1000 persons) 4.86 11.8 0 262.7 1692Number of deaths in neighboring counties (1000 persons) 0.917 2.307 0 20.43 1692
Panel B: Baseline Economic Outcomes
Total population in 1964 (1000 persons) 285.4 207.2 3.05 1186.9 1692Fraction of non-agricultural population in 1964 (percent) 8.16 7.74 1.13 79.79 1692
Panel C: County Characteristics
Ethnolinguistic fractionalization 0.136 0.211 0 0.812 1686Male/female ratio among 15-24 year-olds in 1970 1.087 0.077 0.876 1.464 1687Area size (10000 sq. km) 0.356 0.897 0.004 23.435 1686Average yearly rainfall 1950-2010 (mm) 947.2 471.7 26.7 2513 1692Average monthly temperature 1950-2010 (degrees) 12.83 5.67 -6.10 25.29 1692
Panel D: Post-Revolution Economic Outcomes
Per capita GDP in 1982 (1000 RMB) 0.453 0.271 0.07 3.517 1686Per capita GDP in 2000 (1000 RMB) 4.981 3.947 0.667 34.782 1692
Fraction of non-agricultural population in 1982 (percent) 8.84 7.84 0.4 64.8 1686Fraction of non-agricultural population in 1990 (percent) 19.67 12.45 2.89 86.05 1687Fraction of non-agricultural population in 2000 (percent) 26.76 13.26 0 100 1506
Fraction of population with college education in 1982 (percent) 0.197 0.164 0.03 3.32 1686Fraction of population with college education in 1990 (percent) 0.512 0.445 0.04 9.44 1687
Share of immigrants in population in 1990 (percent) 1.99 2.26 0 31.63 1687Timing of agricultural reform 1980.5 1.08 1977.3 1984 1033
33

Table 2: Climate Shocks and Cultural Revolution Violence (First Stage)
OLS
Dep Var: Number of Deaths (persons) (1) (2) (3)
Absolute rainfall deviation in 1968 and 1969 from LR average -2.482*** -1.998*** -2.122***(0.654) (0.721) (0.777)
Ethnolinguistic Fractionalization -77.093** -72.136*(37.050) (37.086)
Area size in 1982 (10000 sq. km) 5.662 5.904(3.803) (3.906)
Male/Female Ratio Among 15-24 year-olds in 1970 144.154** 145.942**(68.307) (68.885)
Total Population in 1964 (10000 persons) 1.078*** 1.112***(0.334) (0.340)
Fraction of non-agr population in 1964 (percent) -0.471 -0.447(0.549) (0.554)
Average yearly rainfall 1950-2010 (mm) 0.073 0.084(0.048) (0.052)
Average monthly temperature 1950-2010 (degrees) 1.723 1.538(1.660) (1.647)
Absolute deviation of rainfall in 1965 0.343(0.394)
Absolute deviation of rainfall in 1964 0.476(0.406)
N 1692 1680 1680Adj. R2 0.01 0.33 0.33F -Stat 14.40 3.76 3.25Mean of Dep. Var. 86.08 86.08 86.08Province FE No Yes Yes
Robust standard errors are in parentheses. */**/*** denotes significance at the 10% / 5% / 1% levels.The dependent variable, number of deaths, is the reported number of fatalities for a given county during theCultural Revolution. Rainfall deviations are computed using the 1950-2010 average for a given county. Theyears 1968 and 1969 are used due to the timing of violence in rural areas. Gender ratio among 15-24 year-olds in 1970 is used to proxy for the intensity of “Red Guard” activities. Ethnolinguistic fractionalization ismeasured using the standard ELF index, where a higher number corresponds to greater ethnic diversity.
34

Table 3: Exogeneity - Balance Checks
(1) (2) (3) (4) (5)
Dep Var: Population Industrialization Gender Ratio Area Ethnolinguisticin 1964 in 1964 in 1970 size fractionalization
Absolute rainfall deviation in 1968 and 1969 from LR average -0.064 0.012 -0.000 0.005 0.001(0.049) (0.024) (0.000) (0.004) (0.001)
N 1692 1692 1687 1686 1686Adj. R2 0.36 0.36 0.19 0.22 0.50Mean of Dep Var. 28.54 8.16 1.09 0.36 0.14Province FE Yes Yes Yes Yes Yes
This table reports OLS regressions of all available non-climatic county characteristics on the instrument, controlling for province fixedeffects. Rainfall deviations are computed using the 1950-2010 average for a given county. The years 1968 and 1969 are used due to thetiming of violence in rural areas. Industrialization is measured using the fraction of non-agricultural workers in the labor force. Gender ratioin 1970 is the ratio of male to female persons aged 15-24 in 1970. This proxies for the intensity of “Red Guard” activities. Ethnolinguisticfractionalization is measured using the standard ELF index, where a higher number corresponds to greater ethnic diversity. Robust standarderrors are in parentheses. */**/*** denotes significance at the 10% / 5% / 1% levels.
35

Table 4: Revolutionary Intensity and Industrialization
1964 1982
OLS OLS IV OLS OLS IV
Dep Var: Fraction of non-agricultural workers (1) (2) (3) (4) (5) (6)
Number of deaths (100 persons) -0.089** -0.014 0.082 -0.206*** -0.044 -2.973**(0.037) (0.043) (0.946) (0.045) (0.054) (1.396)
Number of deaths in neighboring counties (100 persons) -0.008 -0.001(0.008) (0.008)
Total Population in 1964 (10000 persons) -0.048*** -0.049*** 0.029*** 0.062***(0.008) (0.013) (0.010) (0.017)
Male/Female Ratio Among 15-24 year-olds in 1970 -1.592 -1.695 -4.577** -0.388(2.405) (2.890) (1.923) (3.012)
Area size in 1982 (10000 sq. km) 1.402** 1.397** -0.294 -0.159(0.629) (0.636) (0.212) (0.246)
Ethnolinguistic Fractionalization 4.155*** 4.270*** -0.223 -2.694(1.144) (1.451) (0.743) (1.884)
Average yearly rainfall 1950-2010 (mm) -0.000 -0.000 0.002*** 0.005**(0.001) (0.001) (0.001) (0.002)
Average monthly temperature 1950-2010 (degrees) -0.070 -0.072 -0.103** -0.089(0.071) (0.073) (0.050) (0.067)
Fraction of non-agr population in 1964 (percent) 0.530*** 0.516***(0.057) (0.057)
N 1692 1680 1680 1686 1680 1680Adj. R2 0.00 0.41 0.41 0.00 0.56 -0.15Mean of Dep Var. 8.16 8.16 8.16 8.84 8.84 8.84Province FE No Yes Yes No Yes Yes
Robust standard errors are in parentheses. */**/*** denotes significance at the 10% / 5% / 1% levels. Number of deaths is the reportednumber of fatalities for a given county during the Cultural Revolution. In columns 3 and 6, this is instrumented using average rainfall deviationin 1968 and 1969 from a given county’s 1950-2010 average. The years 1968 and 1969 are used due to the timing of violence in rural areas.Neighboring counties are defined as those from the same prefecture of a given county. Gender ratio among 15-24 year-olds in 1970 is used toproxy for the intensity of “Red Guard” activities. Ethnolinguistic fractionalization is measured using the standard ELF index, where a highernumber corresponds to greater ethnic diversity. The 1964 outcome is included as a placebo test.
36

Table 5: Revolutionary Intensity and Industrialization
1990 2000
OLS OLS IV OLS OLS IV
Dep Var: Fraction of non-agricultural workers (1) (2) (3) (4) (5) (6)
Number of deaths (100 persons) -0.355*** -0.079 -4.654** 0.218** 0.080 -1.566(0.070) (0.066) (2.106) (0.098) (0.155) (3.159)
Number of deaths in neighboring counties (100 persons) -0.006 -0.041(0.011) (0.029)
Total Population in 1964 (10000 persons) -0.013 0.039 0.147*** 0.159***(0.014) (0.027) (0.017) (0.028)
Fraction of non-agr population in 1964 (percent) 0.856*** 0.835*** 0.178*** 0.166***(0.060) (0.062) (0.039) (0.047)
Male/Female Ratio Among 15-24 year-olds in 1970 -2.601 3.962 -11.047*** -9.361*(3.144) (4.731) (3.446) (4.904)
Area size in 1982 (10000 sq. km) 0.668*** 0.877** -0.522 -0.446(0.257) (0.347) (0.323) (0.321)
Ethnolinguistic Fractionalization 0.178 -3.664 -7.826*** -8.595***(1.126) (2.895) (1.623) (2.284)
Average yearly rainfall 1950-2010 (mm) 0.002** 0.006** 0.006*** 0.006***(0.001) (0.003) (0.001) (0.002)
Average monthly temperature 1950-2010 (degrees) -0.169** -0.148 0.491*** 0.509***(0.070) (0.090) (0.081) (0.101)
N 1687 1680 1680 1506 1495 1495Adj. R2 0.01 0.63 -0.05 0.00 0.53 0.47Mean of Dep Var. 19.67 19.67 19.67 26.76 26.76 26.76Province FE No Yes Yes No Yes Yes
Robust standard errors are in parentheses. */**/*** denotes significance at the 10% / 5% / 1% levels. Number of deaths is the reportednumber of fatalities for a given county during the Cultural Revolution. In columns 3 and 6, this is instrumented using average rainfall deviationin 1968 and 1969 from a given county’s 1950-2010 average. The years 1968 and 1969 are used due to the timing of violence in rural areas.Neighboring counties are defined as those from the same prefecture of a given county. Gender ratio among 15-24 year-olds in 1970 is used toproxy for the intensity of “Red Guard” activities. Ethnolinguistic fractionalization is measured using the standard ELF index, where a highernumber corresponds to greater ethnic diversity.
37

Table 6: Revolutionary Intensity and Per-capita Output
1982 2000
OLS OLS IV OLS OLS IV
Dep Var: Log(GDP/capita) (1) (2) (3) (4) (5) (6)
Number of deaths (100 persons) -0.010*** 0.002 -0.203** -0.009** -0.005 -0.297**(0.003) (0.003) (0.097) (0.004) (0.006) (0.132)
Number of deaths in neighboring counties (100 persons) -0.001** -0.001(0.001) (0.001)
Total Population in 1964 (10000 persons) -0.000 0.002* 0.001 0.004***(0.001) (0.001) (0.001) (0.002)
Fraction of non-agr population in 1964 (percent) 0.022*** 0.021*** 0.028*** 0.027***(0.003) (0.003) (0.003) (0.003)
Male/Female Ratio Among 15-24 year-olds in 1970 -0.584*** -0.285 -0.844*** -0.424(0.144) (0.213) (0.195) (0.296)
Area size in 1982 (10000 sq. km) 0.009 0.018 0.011 0.024(0.022) (0.023) (0.018) (0.020)
Ethnolinguistic Fractionalization -0.259*** -0.427*** -0.239*** -0.484***(0.065) (0.137) (0.083) (0.186)
Average yearly rainfall 1950-2010 (mm) 0.000 0.000 0.000 0.000(0.000) (0.000) (0.000) (0.000)
Average monthly temperature 1950-2010 (degrees) -0.004 -0.003 0.016*** 0.017***(0.004) (0.005) (0.005) (0.006)
N 1686 1680 1680 1692 1680 1680Adj. R2 0.00 0.41 -0.52 0.00 0.48 -0.55Mean of Dep Var. -0.91 -0.91 -0.91 1.38 1.38 1.38Province FE No Yes Yes No Yes Yes
Robust standard errors are in parentheses. */**/*** denotes significance at the 10% / 5% / 1% levels. Number of deaths is the reportednumber of fatalities for a given county during the Cultural Revolution. In columns 3 and 6, this is instrumented using average rainfall deviationin 1968 and 1969 from a given county’s 1950-2010 average. The years 1968 and 1969 are used due to the timing of violence in rural areas.Neighboring counties are defined as those from the same prefecture of a given county. Gender ratio among 15-24 year-olds in 1970 is used toproxy for the intensity of “Red Guard” activities. Ethnolinguistic fractionalization is measured using the standard ELF index, where a highernumber corresponds to greater ethnic diversity.
38
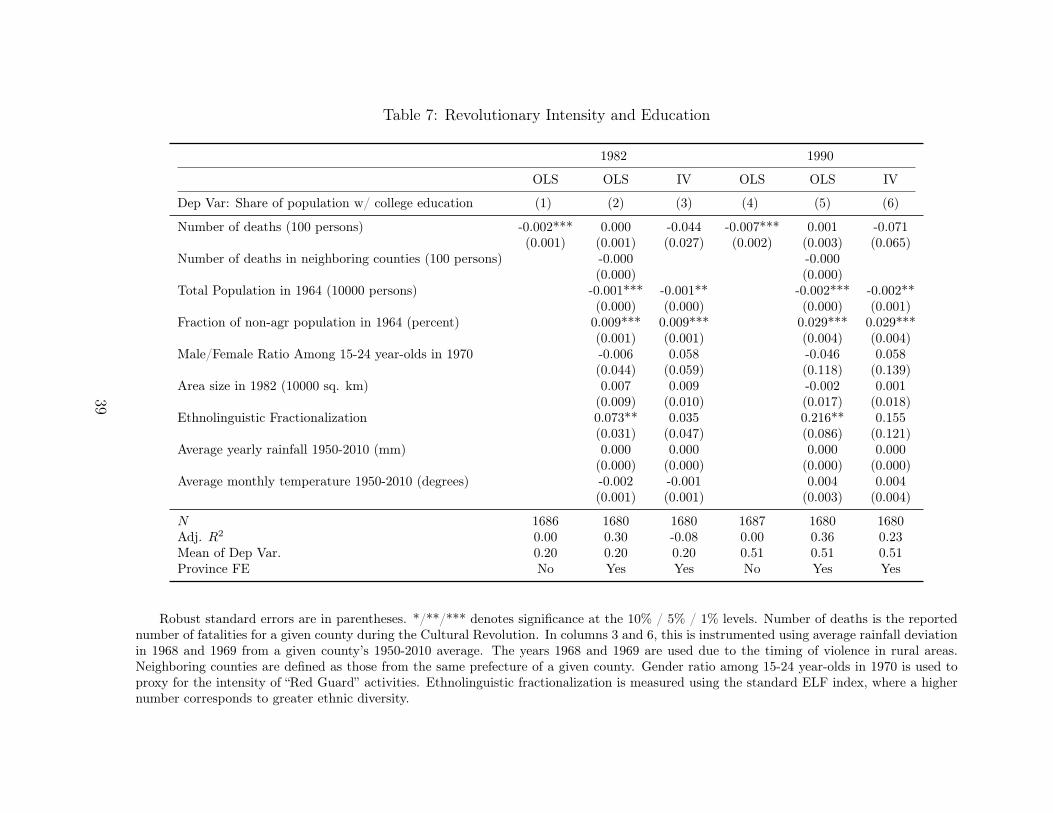
Table 7: Revolutionary Intensity and Education
1982 1990
OLS OLS IV OLS OLS IV
Dep Var: Share of population w/ college education (1) (2) (3) (4) (5) (6)
Number of deaths (100 persons) -0.002*** 0.000 -0.044 -0.007*** 0.001 -0.071(0.001) (0.001) (0.027) (0.002) (0.003) (0.065)
Number of deaths in neighboring counties (100 persons) -0.000 -0.000(0.000) (0.000)
Total Population in 1964 (10000 persons) -0.001*** -0.001** -0.002*** -0.002**(0.000) (0.000) (0.000) (0.001)
Fraction of non-agr population in 1964 (percent) 0.009*** 0.009*** 0.029*** 0.029***(0.001) (0.001) (0.004) (0.004)
Male/Female Ratio Among 15-24 year-olds in 1970 -0.006 0.058 -0.046 0.058(0.044) (0.059) (0.118) (0.139)
Area size in 1982 (10000 sq. km) 0.007 0.009 -0.002 0.001(0.009) (0.010) (0.017) (0.018)
Ethnolinguistic Fractionalization 0.073** 0.035 0.216** 0.155(0.031) (0.047) (0.086) (0.121)
Average yearly rainfall 1950-2010 (mm) 0.000 0.000 0.000 0.000(0.000) (0.000) (0.000) (0.000)
Average monthly temperature 1950-2010 (degrees) -0.002 -0.001 0.004 0.004(0.001) (0.001) (0.003) (0.004)
N 1686 1680 1680 1687 1680 1680Adj. R2 0.00 0.30 -0.08 0.00 0.36 0.23Mean of Dep Var. 0.20 0.20 0.20 0.51 0.51 0.51Province FE No Yes Yes No Yes Yes
Robust standard errors are in parentheses. */**/*** denotes significance at the 10% / 5% / 1% levels. Number of deaths is the reportednumber of fatalities for a given county during the Cultural Revolution. In columns 3 and 6, this is instrumented using average rainfall deviationin 1968 and 1969 from a given county’s 1950-2010 average. The years 1968 and 1969 are used due to the timing of violence in rural areas.Neighboring counties are defined as those from the same prefecture of a given county. Gender ratio among 15-24 year-olds in 1970 is used toproxy for the intensity of “Red Guard” activities. Ethnolinguistic fractionalization is measured using the standard ELF index, where a highernumber corresponds to greater ethnic diversity.
39

Table 8: Revolutionary Intensity and Migration in 1990
OLS IV
Dep Var: Share of immigrants within local population (%) (1) (2) (3)
Number of deaths (100 persons) -0.042*** 0.006 -0.899**(0.011) (0.013) (0.429)
Number of deaths in neighboring counties (100 persons) -0.005*(0.002)
Total Population in 1964 (10000 persons) -0.013*** -0.003(0.003) (0.006)
Fraction of non-agr population in 1964 (percent) 0.161*** 0.157***(0.017) (0.018)
Male/Female Ratio Among 15-24 year-olds in 1970 2.935*** 4.249***(0.845) (1.070)
Area size in 1982 (10000 sq. km) 0.203 0.243(0.173) (0.192)
Ethnolinguistic Fractionalization 1.084*** 0.338(0.338) (0.637)
Average yearly rainfall 1950-2010 (mm) -0.000 0.000(0.000) (0.001)
Average monthly temperature 1950-2010 (degrees) 0.034* 0.037*(0.019) (0.022)
N 1687 1680 1680Adj. R2 0.00 0.43 -0.37Mean of Dep Var. 1.99 1.99 1.99Province FE No Yes Yes
Robust standard errors are in parentheses. */**/*** denotes significance at the 10% / 5% / 1% levels.Columns 1 and 2 are OLS regressions, while column 3 is a 2SLS specification. Number of deaths is thereported number of fatalities for a given county during the Cultural Revolution. In column 3, this isinstrumented using average rainfall deviation in 1968 and 1969 from a given county’s 1950-2010 average.The years 1968 and 1969 are used due to the timing of violence in rural areas. Neighboring counties aredefined as those from the same prefecture of a given county. Gender ratio among 15-24 year-olds in 1970 isused to proxy for the intensity of “Red Guard” activities. Ethnolinguistic fractionalization is measured usingthe standard ELF index, where a higher number corresponds to greater ethnic diversity.
40

Table 9: Revolutionary Intensity and Economic Liberalization
OLS IV
Dep Var: Timing of agricultural reform (1) (2) (3)
Number of deaths (100 persons) -0.008 -0.004 0.412(0.007) (0.012) (0.440)
Number of deaths in neighboring counties (100 persons) -0.002(0.002)
Total Population in 1964 (10000 persons) -0.000 -0.005(0.002) (0.006)
Fraction of non-agr population in 1964 (percent) 0.004 0.010(0.006) (0.009)
Male/Female Ratio Among 15-24 year-olds in 1970 -0.952** -1.410*(0.464) (0.794)
Area size in 1982 (10000 sq. km) 0.083** 0.064*(0.035) (0.037)
Ethnolinguistic Fractionalization 0.170 0.319(0.221) (0.384)
Average yearly rainfall 1950-2010 (mm) -0.000 -0.000(0.000) (0.001)
Average monthly temperature 1950-2010 (degrees) -0.012 -0.016(0.012) (0.014)
N 1033 1031 1031Adj. R2 -0.00 0.24 -0.72Mean of Dep Var. 1980.53 1980.53 1980.53Province FE No Yes Yes
Robust standard errors are in parentheses. */**/*** denotes significance at the 10% / 5% / 1% levels.The dependent variable is the timing of introduction of the “household responsibility” system, which madeagricultural households the residual claimants of their output, and enabled the return of rural markets.Columns 1 and 2 are OLS regressions, while column 3 is a 2SLS specification. Number of deaths is thereported number of fatalities for a given county during the Cultural Revolution. In column 3, this isinstrumented using average rainfall deviation in 1968 and 1969 from a given county’s 1950-2010 average.The years 1968 and 1969 are used due to the timing of violence in rural areas. Neighboring counties aredefined as those from the same prefecture of a given county. Gender ratio among 15-24 year-olds in 1970 isused to proxy for the intensity of “Red Guard” activities. Ethnolinguistic fractionalization is measured usingthe standard ELF index, where a higher number corresponds to greater ethnic diversity.
41
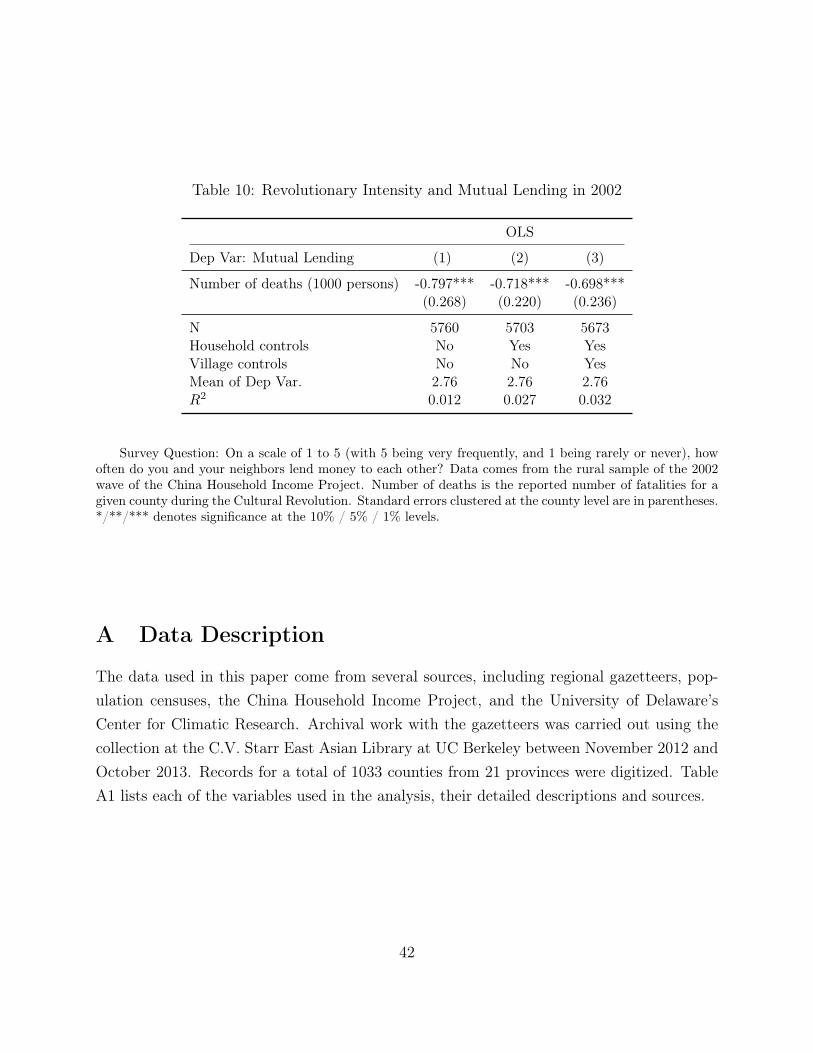
Table 10: Revolutionary Intensity and Mutual Lending in 2002
OLS
Dep Var: Mutual Lending (1) (2) (3)
Number of deaths (1000 persons) -0.797*** -0.718*** -0.698***(0.268) (0.220) (0.236)
N 5760 5703 5673Household controls No Yes YesVillage controls No No YesMean of Dep Var. 2.76 2.76 2.76R2 0.012 0.027 0.032
Survey Question: On a scale of 1 to 5 (with 5 being very frequently, and 1 being rarely or never), howoften do you and your neighbors lend money to each other? Data comes from the rural sample of the 2002wave of the China Household Income Project. Number of deaths is the reported number of fatalities for agiven county during the Cultural Revolution. Standard errors clustered at the county level are in parentheses.*/**/*** denotes significance at the 10% / 5% / 1% levels.
A Data Description
The data used in this paper come from several sources, including regional gazetteers, pop-ulation censuses, the China Household Income Project, and the University of Delaware’sCenter for Climatic Research. Archival work with the gazetteers was carried out using thecollection at the C.V. Starr East Asian Library at UC Berkeley between November 2012 andOctober 2013. Records for a total of 1033 counties from 21 provinces were digitized. TableA1 lists each of the variables used in the analysis, their detailed descriptions and sources.
42

Table A.1: Data Description
Variable Name Description Source(s)
Number of deaths The total number of reported fatalities during theCultural Revolution
Regional gazetteers
Number of victims The total number of reported victims during theCultural Revolution
Regional gazetteers
Number of deaths inneighboring counties
The total number of reported fatalities during theCultural Revolution in nearby counties within thesame prefecture
Regional gazetteers
Total population in 1964 Population size of a given county in 1964 Population census; Re-gional gazetteers
Industrialization in 1964 Fraction of non-agricultural population in 1964 Population census; Re-gional gazetteers
Ethnolinguistic fraction-alization
Consider a society composed of K ≥ 2 differ-ent ethnic groups and let pk indicate the shareof group k in the total population. The ELF in-dex is given by 1−
∑Kk=1 p
2k.
Population census
Gender ratio Male/Female ratio among 15-24 year-olds in 1970 Population census
Area size Geographic size of a given county National Bureau ofStatistics
Average rainfall 1950-2010 average rainfall for a given county,computed using ArcGIS
Matsuura and Willmot
Average temperature 1950-2010 average temperature for a givencounty, computed using ArcGIS
Matsuura and Willmot
GDP Gross Domestic Product of a given county National Bureau ofStatistics
Immigration Share of local population that was born outsideof a given county
Population census
Timing of policy reform Timing of implementation of the “household re-sponsibility” system in a given county
Regional gazetteers
Mutual lending Survey Question: On a scale of 1 to 5 (with 5 be-ing very frequently, and 1 being rarely or never),how often do you and your neighbors lend moneyto each other?
China Household In-come Project 2002
43

B Additional Results
This section reports additional results. Table B1 contains regressions used to examine theexclusion restriction in the IV specification. In particular, I regress all outcomes that theRevolution significantly affected on climate deviations in each of three years before and afterthe active phase of the Cultural Revolution (1966-1971).
Tables B2 and B3 show robustness checks when the sample is restricted to countieswith non-zero reported fatalities and counties with relatively detailed historical accounts,respectively. This is used to address possible non-classical measurement error.
44

Table B.1: Exclusion Restriction - Placebo Tests
OLS
Dep Var: GDP.1982 GDP.2000 IND.1982 IND.1990 IMMI.1990
Absolute rainfall deviation in 1968 and 1969 from LR average 0.004*** 0.005*** 0.039** 0.063** 0.018***(0.001) (0.002) (0.020) (0.027) (0.006)
Absolute deviation of rainfall in 1963 -0.000 -0.000 -0.018* -0.052*** -0.004(0.001) (0.001) (0.010) (0.015) (0.003)
Absolute deviation of rainfall in 1964 0.001 0.003*** 0.048*** 0.016 -0.003(0.001) (0.001) (0.015) (0.018) (0.004)
Absolute deviation of rainfall in 1965 0.001 0.002 -0.003 0.009 0.005(0.001) (0.001) (0.014) (0.020) (0.005)
Absolute deviation of rainfall in 1972 -0.002 -0.002 -0.023 0.010 -0.005(0.001) (0.002) (0.015) (0.025) (0.005)
Absolute deviation of rainfall in 1973 -0.001 -0.001 0.019 0.045* 0.008(0.001) (0.002) (0.015) (0.025) (0.006)
Absolute deviation of rainfall in 1974 -0.000 0.003* -0.027* -0.011 0.009(0.001) (0.002) (0.015) (0.024) (0.006)
N 1680 1680 1680 1680 1680Adj. R2 0.42 0.49 0.57 0.64 0.43Mean of Dep Var. -0.91 1.38 8.84 19.67 1.99Province FE Yes Yes Yes Yes YesAdditional controls Yes Yes Yes Yes Yes
This table reports reduced-form estimates for the outcomes that were significant in the baseline sample. Additional controls includepopulation size in 1964, degree of industrialization in 1964, male/female gender ratio among 15-24 year-olds in 1970, area size, ethnic minoritycounty indicator, and long-run climate variables. Rainfall deviations for each of three years before and after the active phase of the CulturalRevolution, 1966-1971, are included as placebo tests. Robust standard errors are in parentheses. */**/*** denotes significance at the 10% /5% / 1% levels.
45

Table B.2: Reporting Bias - Excluding Counties with Zero Reported Deaths
IV
Dep Var: GDP.1982 GDP.2000 IND.1982 IND.1990 IMMI.1990
Number of deaths (100 persons) -0.167* -0.264* -2.295* -3.286* -0.533(0.097) (0.141) (1.385) (1.963) (0.366)
Total Population in 1964 (10000 persons) 0.003** 0.005** 0.071*** 0.050 -0.003(0.002) (0.002) (0.022) (0.031) (0.006)
Fraction of non-agr population in 1964 (percent) 0.026*** 0.027*** 0.519*** 0.886*** 0.153***(0.004) (0.004) (0.052) (0.080) (0.019)
Male/Female Ratio Among 15-24 year-olds in 1970 -0.367 -0.547 -0.832 2.127 3.726***(0.252) (0.357) (3.351) (5.119) (1.175)
Area size in 1982 (10000 sq. km) 0.022* 0.021 -0.222 0.541* -0.011(0.012) (0.023) (0.235) (0.296) (0.073)
Ethnolinguistic Fractionalization -0.391*** -0.547** -2.514 -2.918 0.568(0.147) (0.219) (1.964) (2.890) (0.569)
Average yearly rainfall 1950-2010 (mm) 0.000 0.000 0.007** 0.008** 0.000(0.000) (0.000) (0.003) (0.004) (0.001)
Average monthly temperature 1950-2010 (degrees) -0.002 0.015** -0.051 -0.181* 0.022(0.005) (0.007) (0.076) (0.103) (0.022)
N 1180 1180 1180 1180 1180Adj. R2 -0.42 -0.64 -0.05 0.16 -0.09Mean of Dep Var. -0.93 1.37 8.44 19.28 1.93Province FE Yes Yes Yes Yes YesFirst-stage F-stat 5.27 5.27 5.27 5.27 5.27
This table reports IV estimates when the sample is restricted to counties with non-zero reported fatalities. Number of deaths is the reportednumber of fatalities for a given county during the Cultural Revolution. This is instrumented using average rainfall deviation in 1968 and 1969from a given county’s 1950-2010 average. The years 1968 and 1969 are used due to the timing of violence in rural areas. Gender ratio among15-24 year-olds in 1970 is used to proxy for the intensity of “Red Guard” activities. Ethnolinguistic fractionalization is measured using thestandard ELF index, where a higher number corresponds to greater ethnic diversity. Robust standard errors are in parentheses. */**/***denotes significance at the 10% / 5% / 1% levels.
46

Table B.3: Reporting Bias - Provinces with Detailed Histories
IV
Dep Var: GDP.1982 GDP.2000 IND.1982 IND.1990 IMMI.1990
Number of deaths (100 persons) -0.154 -0.324* -1.455 -2.680 -0.840*(0.095) (0.167) (1.108) (1.811) (0.473)
Total Population in 1964 (10000 persons) 0.002 0.006** 0.048*** 0.014 -0.004(0.001) (0.002) (0.018) (0.028) (0.007)
Fraction of non-agr population in 1964 (percent) 0.024*** 0.027*** 0.583*** 0.845*** 0.143***(0.003) (0.004) (0.045) (0.063) (0.018)
Male/Female Ratio Among 15-24 year-olds in 1970 -0.397* -0.362 -2.883 -1.511 3.272**(0.236) (0.393) (2.761) (4.726) (1.280)
Area size in 1982 (10000 sq. km) 0.032** 0.035 -0.311 0.670** 0.057(0.014) (0.025) (0.213) (0.294) (0.088)
Ethnolinguistic Fractionalization -0.385*** -0.511** -1.360 -0.709 0.447(0.137) (0.243) (1.475) (2.463) (0.699)
Average yearly rainfall 1950-2010 (mm) 0.000 0.000 0.002 0.005 0.001(0.000) (0.000) (0.002) (0.003) (0.001)
Average monthly temperature 1950-2010 (degrees) 0.000 0.018** -0.066 -0.092 0.031(0.005) (0.007) (0.056) (0.080) (0.022)
N 1252 1252 1252 1252 1252Adj. R2 -0.24 -1.13 0.40 0.37 -0.63Mean of Dep Var. -0.97 1.35 8.29 18.63 2.01Province FE Yes Yes Yes Yes YesFirst-stage F-stat 5.09 5.09 5.09 5.09 5.09
This table reports IV estimates when the sample is restricted to provinces with relatively detailed historical accounts. Number of deathsis the reported number of fatalities for a given county during the Cultural Revolution. This is instrumented using average rainfall deviation in1968 and 1969 from a given county’s 1950-2010 average. The years 1968 and 1969 are used due to the timing of violence in rural areas. Genderratio among 15-24 year-olds in 1970 is used to proxy for the intensity of “Red Guard” activities. Ethnolinguistic fractionalization is measuredusing the standard ELF index, where a higher number corresponds to greater ethnic diversity. Robust standard errors are in parentheses.*/**/*** denotes significance at the 10% / 5% / 1% levels.
47