economic report 2021 - oguk.org.uk
TRANSCRIPT

1
BUSINESS OUTLOOK 2020
Economic Report 2021

ECONOMIC REPORT 2021
2
Read all our industry reports atwww.oguk.org.uk/publicati ons
TheUKOilandGasIndustryAssociationLimited(tradingasOGUK)2021OGUK uses reasonable efforts to ensure that the materials andinformation contained in the report are current and accurate.OGUKoffers thematerials and information in good faith and believes thattheinformationiscorrectatthedateofpublication.Thematerialsandinformationaresuppliedtoyouontheconditionthatyouoranyotherpersonreceiving themwillmake theirowndeterminationas to theirsuitability and appropriateness for any proposed purpose prior to their use.NeitherOGUKnoranyofitsmembersassumeliabilityforanyusemadethereof.

3
Contents
Foreword 4
Keyfindings 6
Theglobalenergylandscape 8
Thepathtonetzero 16
Buildingsustainableinvestment inUKenergy 22
TheNorthSeaTransitionDeal 36
Economic Report 2021

ECONOMIC REPORT 2021
4
TheUK’soffshoreoilandgasindustryremainsacentralpillar of the UK economy. Providing energy, jobs andactively driving low carbon innovation the length andbreadthofthecountry, itsfootprintextendsintoeverysector,community,andhomeacrosstheUK.
OGUK’s Economic Report 2021 provides a detailed insightintoourchangingenergylandscapeatacriticaltimeinthenationalconversation.Theneedforurgentaction, byeveryone,totackleclimatechangeisindisputable.AsthegovernmentpreparestohostCOP26inGlasgow,
we,theUK’schangingoffshoreoilandgasindustry,areunequivocalinoursupportfornetzero.Indeed,wearealready in action to improve theproductionof cleanerindigenousoilandgaswhileputtingourskillstoworktohelpothersectorstransform.Almostsixmonthsonfromtheground-breakingNorth
Sea Transition Deal, the report reinforces industry’slong-termcommitmenttothetransitiontoalowcarbonfutureanddetails thevalueof the sector to thewidereconomy.However,ourreportalsosetsoutthestarkchoicesthe
countryfacesasitcharts itstransitiontowardsalowercarbonfuture.In thefirst fewmonthsof2021, theUKhas imported
more gas than any other year, as demand rose anddomestic production fell. And while renewables havemade inroads in supportingelectricity generation, thatelectricitystillonlyaccountsfor20percentoftheUK’stotalprimaryenergyneeds.Nearly three-quarters of the UK’s energy currently
comesfromoilandgas,ofwhicharound70percentwas
metbyproductionfromtheUKContinentalShelf(UKCS)in2020.Evenaswetransitiontoanet-zerofuture, theworkoftheClimateChangeCommitteeshowshalfoftheUK’s energy requirements between now and 2050willstillbemetbyoilandgas.Thefactsandevidencethroughoutthisreportunderline
theneedforgovernmentsandpolicymakerstosupportamanagedtransition.SuchanapproachwillensurethatforaslongastheUK
continuestouseoilandgas,asmuchaspossiblecanbemetby indigenousproduction, as set out in theNorthSeaTransitionDeal.In this way the UK can retain the essential skills
needed to deliver and underpin its low carbon energytransitionandimportantly,notoffshoreitsresponsibilityand accountability for emissions associated with suchdemand.OGUKrefutesthecliffedgeapproachbeingsuggested
by some as a symbolic gesture that would do little toaddresstheUK’songoingdemandforenergy, includingoilandgas.A managed transition, supported by governments,
regulatorsandindustry,willfurtherreinforcetheglobalcompetitiveness of the UKCS and the UK as “open forbusiness”. Such an approach will ensure that the UKcontinuestoattractthebillionsofpoundsofinvestmentinto the UKCS that is needed for cleaner oil and gasproduction as well as for low carbon and renewableenergies.Thechangestotheregulatoryframeworkforoilandgas
overthepast18monthsaretimely.Industrywelcomed
Foreword

5
therevisedOilandGasAuthority(OGA)Strategy,whichrequirestheongoingeconomicrecoveryofhydrocarbonswhiletakingappropriatestepstosupportthedeliveryofnetzerotargets.The future competitiveness of producing basins and
therationaleforongoingexplorationandproductionwilldependasmuchontheembeddedemissioncontentofenergyproductionasitdoesonoperatingcosts.Thisiswhatgovernment,investorsandsocietyatlargerequireandakeyobjectiveofthisreportistoassessprogresstodateintermsofmeetingsuchchallengingobjectives.Our industry is inextricably linked to achieving a just
transitiontoalower-carbonfuture.Withatrulyinclusivetransition,we canmake full use of the 1,000 ormoresupply chain companieswhich service the full lifecycleoftheoilandgasindustryaswellastheothergrowingenergysectorsthatweneedtodeliverournetzerogoals.The report also details the major economic and
employment contributions that the oil and gas sectorcontinuestomake,withitsactivitysupporting200,000jobs.ThegrossvalueaddtotheUKeconomyiscalculatedat£31.1billion–1.7percentoftheUKtotal–andmeansthat every £1 million spent by the oil and gas sectorgeneratesanother£2.5millionofactivityinotherpartsoftheeconomy.Thereforeitisessentialthatthistransitionfairlysupports
the communities where our sector has a significantpresence, to change and adapt. This is also recognisedin the North Sea Transition Deal, with a significantcommitmentbycompaniestoensureatleast50percentUKcontentisachievedoverthelifeofthedecarbonising
projects, including carbon capture, hydrogen, offshoreemissionsreductionandelectrification.Thiswillensurethe benefits are being delivered by companies here intheUK.With amanaged, fair and inclusive transition,we can
be confidentofour collectivepath todelivernet zero,butweneedallpartiestoworkwithusandtoactivelysupportusinourcommitmentsandendeavours.Wehavea radicalplan in theshapeof theNorthSea
Transition Deal to accelerate homegrown greenerenergies.As thefirstof itskind, it isaguiding light forindustry,supportingjobsandcommunitiesacrosstheUKandchampioningthegrowthofoursupplychain.Todevelop thesedomestic greener industries, and to
supportothernations in theirbid tocutemissions,weneedtoensuretheUKbecomesthegloballeaderinlowcarbon solutions through urgently implementing theNorthSeaTransitionDeal.Wehavetheframework,wehavetheforwardpath,andwearealreadyinactiontomakeitareality.
Deirdre Michie OBEChief ExecutiveOGUK

ECONOMIC REPORT 2021
6
Keyfindings
Energy Security
Throughto2050,halfofallUKcumulativeenergydemandwillbemetbyoilandgas
Oilandgasmet73%ofUKprimaryenergyconsumedin 2020
TheUKenergyservicessectorisamajorproviderofoilfieldgoodsandservices.Exportsfromoursectorroseto45%oftotalrevenuesandwasvaluedat£60billionoverthelastfiveyears(pre-pandemic).
Investment
Around £390bn of capitalinvestmenthasbeencommittedontheUKCSover thelast50years
Value-Adding Activity
In2021,thesectorsupportsanestimated£31.1bnofGVA–1.7%ofUKtotal
Every£1millionspentbytheoilandgassectorsupportsaround£2.5millionofactivityinotherpartsoftheeconomy
£390billion
Thisincludes£3.7bnin2020,despitethechallengingeconomicenvironment
£3.7bn
73% 2050
£31.1bn
£1m £2.5m
£60bn
1,000Over
supplychaincompaniesactiveontheUKCS
56%Oilandgasrepresented56%ofglobalenergyconsumption in 2020
£21bn is to be investedoverthenextfiveyears,delivering2.7bnboeovertime
£21bn

7
Employment
•26,900direct
•91,500indirect
•77,500induced
Fiscal Contribution
£1.7bninnettaxpaymentsexpectedbetween2021–26
The industry remainsanetcontributor to theUKTreasury,providing:
£360bnnetover thelast50yearsand£33.7bn since 2010
Performance
2021priceaverages:
OilandgasproductioninQ12021was1millionboepd–11%downonQ12020
39wellsdrilledhavebeen so far in2021:
•3exploration
• 2 appraisal
•34development
Powering Net Zero
The North Sea TransitionDealwasagreedinMarch2021,supporting:
Upto£16bninvestment 40,000jobs 60milliontonnesofemissionsreduction
Industryhascommittedtohalveoperationalemissionsby2030
ProvidingthetalentandtechnologytosupportthedevelopmentofCCS,hydrogenandoffshorewind
Industryactivityisestimatedtosupportalmost200,000jobsin2021,spanningeveryregionoftheUK
£360bn
£1.7bn
39wells-11%
OIL £48.52
/bbl
GAS 67.41
p/th

ECONOMIC REPORT 2021
8
Oil and gas represented 56 per cent of global energyconsumptionin2020,6percentdownontheprioryear,primarilybecauseoftheimpactofCOVID-19ontheglobaleconomy, and which affected oil more than any otherfuel.Asthepandemicrestrictionsremaininplaceacrossthe globe, energy demand continues to be subdued,as was seen throughout 2020. Forecasts suggest thatemerginganddevelopingmarketswillrepresentmostoftheenergydemand increase,with theirdemand set torise3.4percentabove2019levels.The International Energy Agency (IEA) estimates
that global oil demand will rise by 5.4 millionbarrels per day (bpd) in 2021 to about 96.7 millionbpd – an almost 6 per cent increase – and recoverto pre-pandemic levels by the end of 2022.1
The Agency also expects gas demand to increase by3.6 per cent and exceed pre-pandemic levels by theendofthisyear, largelydrivenbydemandinAsianandRussianmarkets. Globally, greater levels of investmentarestillneededtoavoidsupply-demandtensions,whichwouldotherwiseleadtosignificantpriceincreases.Thisinvestmentisinsupportof“existingresources”identifiedbytheIEAandiscriticaltoensuredemandismet.
Theglobalenergylandscape
31%
25%
27%
4%
13%Oil
Natural Gas
Coal
Nuclear energy
Renewables
Source: BP
Figure 1: Global Energy Consumption, 2020
1https://www.iea.org/reports/oil-market-report-june-2021
31%
25%
27%
4%
13%Oil
Natural Gas
Coal
Nuclear energy
Renewables
Source: BP
31%
25%
27%
4%
13%Oil
Natural Gas
Coal
Nuclear energy
Renewables
Source: BP
31%
25%
27%
4%
13%Oil
Natural Gas
Coal
Nuclear energy
Renewables
Source: BP
31%
25%
27%
4%
13%Oil
Natural Gas
Coal
Nuclear energy
Renewables
Source: BP

9
TheUKenergysystemTheUK’sprimaryenergyneedsaremetbyadiverserangeof sources, of which oil and gas provide the majority,followed by bioenergy andwaste, renewables, nuclearand importedelectricity.Oil andgasmetanestimated73 per cent of the UK’s energy needs in 2020, withproductionfromtheUKCSprovidingaround70percentof this (enoughtomeet95percentofoildemandand54percentofgasdemand).Thisisahigherproportionthan that typically seen in recent years as a result of the impactofthepandemicsuppressingtravelandaviation,bothofwhicharehighlyreliantonoil,andoilproducts.Energy consumption in 2020 was at its lowest levels
sincethe1950s2astherestrictionstomanageCOVID-19significantly reduced activity across the economy. Therestrictions which were reimposed in the first quarterof 2021 have had a further impact on demand. Totalenergyconsumptionwas7.4percent lower in thefirstquarterthanthesameperiodin2020.Thisfallwastheresultofreductions inbothtransport(31percent)andindustrialconsumption(2.1percent),howeverdomestic(residential) consumption increased by 8.9 per cent asmovementrestrictionsandcolderweatherprevailed.As
restrictionscontinuetobe lifted, inparticular thoseontravel,itisanticipatedthattherewillbeasharpupturninenergydemandwhichshouldbemetbymakingthemostofindigenousresources.OverallUKenergyproductionfellby12percentinthe
firstquarterof2021comparedwiththesameperiodin2020, largelydue to reductions indomesticoilandgasoutputasCOVID-19supressedactivityontheUKCS.Theimpactonproductionreflectslowerratesofbrownfieldandgreenfield investmentand the impactof increasedplanned maintenance outages deferred from 2020,including that of the Forties Pipeline System in May.Whilst these outageswill have a short-term impact onproduction, there will be a limited impact on overallproductionlevelsinthenextyear.
0
20
40
60
80
100
120
1990 1994 1998 2002 2006 2010 2014 2018 2022
Mill
ion
bpd
Demand Production
Source: EIA, IEA
Figure 2: Global Oil Demand and Production
2https://assets.publishing.service.gov.uk/government/uploads/system/uploads/attachment_data/file/1006569/DUKES_2021_Chapter_1_Energy.pdf

ECONOMIC REPORT 2021
10
Oil: In the UK, oil is primarily used for transport andmanufacturing, including petrochemical needs. Ingeneral,UKoilproductionmakesup0.9percentofglobaloutputbasedon2021productiontodate.Oiluseinthefirstfourmonthsoftheyearwasdown29percentonthesameperiodin2020.Significantly,therewasa31percentreductioninoveralltransportdemand,largelydrivenbya70percentreductioninaviationasinternationaltravelwascurtailed.
Gas: TheUK isoneof the largest consumersof gas inEurope, at 44 billion cubic metres3 per year, most ofwhichprimarilysupportsdomesticandindustrialheatingneeds.Gasconsumptionreboundedinearly2021,up8.1percentcomparedtoQ12020.Thiswaslargelytheresultofincreaseduseinelectricitygeneration,whereoutputincreasedby19percentyearonyearduetoreductionsinrenewableandcoalgenerationoutput.Gasaccountedfor35percentofelectricitygenerationinQ12021and
remains a central part of the electricity system. Theflexibilitygasbringsmakesitacriticalpillarintheenergylandscapeandhelpscomplementproductionfromothersources. To offset lower production and higher-than-normaldemandforgasgeneration,gasimportsreachedarecordlevelinQ1,accountingfor56percentoftotalUKgassupplies.Makingthemostofindigenousresourceshelpsmeet
UKdemandandcontainpricegrowth,providingsecuresupplies with a lower carbon footprint than importsoffer.Thiswillbecrucialtoavoidingagrowingrelianceon imports and offshoring of emissions tomeet thesupplyshortfall.
Renewables: Whilst we are increasingly electrifyingtheeconomy,electricitystillonlysupportsaround20.5per cent of the UK’s total primary energy demand.Renewableenergy–wind,hydro,solarandbiomethane–isthelargestcontributortotheUK’selectricitysupply,
3https://www.gov.uk/government/statistics/gas-section-4-energy-trends

11
having grown its percentage share of total electricitysignificantlyoverthelasttwodecades,to41.6percenttoday.In Q1 2021, total electricity demand was 3 per cent
lowercomparedwith thesameperiod lastyear.Whilstrenewable power generation was down 5.6 per centcompared to 2020, largely due to less favourableconditions for wind generation, gas-fired electricitygenerationroseby6.8percentpercenttohelpbalancesupplies.
Coal:Coaldemandforelectricitygenerationwas30percentdowninthefirstquarterof2021comparedto2020(tothelowestfirstquarterlevelsonrecord)ascoal-firedgeneration (2.8per centof total electricity generation)continues to be displaced in favour of gas-fired andrenewablepower.TheUKhascommittedtoceasingcoaluseby1October2024,throughamanageddeclineincoal-fired electricity generation. Domestic coal productionmirroredthis,witha53percentreductionlargelydrivenbytheclosureofFiddlersFerryandAberthawmines inMarch2020.
0
50
100
150
200
250
1995 2000 2005 2010 2015 2020
UK E
nerg
y Co
nsum
ptio
n (M
toe)
Oil Natural Gas Coal Bioenergy & waste Nuclear Wind, solar and hydro Net Imports
Source: BEIS
Figure 3: UK Energy Consumption

ECONOMIC REPORT 2021
12
Despite falling demand, the UK remains reliant onimported coal to meet a supply gap from domesticproduction. Imports rose by 45 per cent in Q1 2021compared with the same period in 2020 to fill theremaining demand gap largely within the industrialsector. Coal imports have supportedmost of the UK’scoalsupplyforthelastdecades,reachingapeakin2013.Thereplacementofcoal-firedgenerationwithgashas
been central to theUK cutting its carbon emissions byover 40 per cent since 1990. Continued access to gasgeneration alongside renewable power will be key tocontinuing to displace coal whilst ensuring ongoingsecurityofsupply.Inthiscontext,theUKhassuccessfullyavoidedscenariossuchasthoseseencurrentlyintheEU,wherecoal-firedgenerationisincreasingtosupplementgas supplies constrained by production challenges.4
CommoditypricesandmarketsCommodity prices have seen continued recovery fromthe low levels experienced during the pandemic, withBrent crude prices reaching $70/barrel by the end ofAugustandgaspricestouching112pencepertherm(p/th).Indeed,pricesforthefirsthalfof2021haveaveraged67.41p/th,oneofthehighestlevelseverrecorded.
Oil: Despite the increase in prices, there is stilluncertainty within the supply-demand dynamic aswe continue to see subdued oil demand, below pre-pandemiclevels,whichisdirectlyimpactingtherecoveryin supply. Owing to reduced production, themarket isreliantonOPEC+ countries toprovide stability throughcontinuedproductionrestrictions.Theoilpricecollapsehas constrained investment and greater confidence inlong termpricingsignalswillhelpunlock investment inall types of energy resources including both greenfieldandbrownfieldoil andgasprojects. Sucha recovery isstilllikelytobegradual,reflectingtherangeofpressureswhichcompaniescontinuetoface.
4https://ec.europa.eu/energy/sites/default/files/quarterly_report_on_european_gas_markets_q1_2021_final.pdf

13
0
10
20
30
40
50
60
70
80
90
01/2
020
02/2
020
03/2
020
04/2
020
05/2
020
06/2
020
07/2
020
08/2
020
09/2
020
10/2
020
11/2
020
12/2
020
01/2
021
02/2
021
03/2
021
04/2
021
05/2
021
06/2
021
07/2
021
08/2
021
Bren
t Oil
Price
($/b
arre
l)
Source: EIA
Figure 4: Brent Oil Price
0
10
20
30
40
50
60
70
80
90
100
110
01/2
020
02/2
020
03/2
020
04/2
020
05/2
020
06/2
020
07/2
020
08/2
020
09/2
020
10/2
020
11/2
020
12/2
020
01/2
021
02/2
021
03/2
021
04/2
021
05/2
021
06/2
021
07/2
021
08/2
021
NBP
Gas P
rice
(p/t
herm
)
Source: ICIS
Figure 5: NBP Gas Price

ECONOMIC REPORT 2021
14
Gas: 2021 has seen a notable increase in UK and European gasprices.Aswellasgrowthindemand,priceshavebeendriven by the increase in carbon prices now that theEU Emissions Trading Scheme (ETS) has entered PhaseIV, alongside the launch of the UK’s separate nationalscheme(UKETS).Bothhaveledtoincreasedchargesforgas inelectricitygenerationand industrialapplications,though other influences including the longer winter of2020–21, decreased production and a rapid uptick indemand,haveledtoarestrictedmarket.Reduced production both in the UK and in Europe,
along with increased Asian demand due to fuel-switching, are having a significant impact on globalgasmarket dynamics. In the formermarkets we are
0
2
4
6
8
10
12
April - June 2020 July - Sep 2020 Oct - Dec 2020 Jan - March 2021 April - June 2021
$/MMBt
u
NBP Henry Hub JKM Source: World Bank, EIA, ICE
Figure 6: Global Gas Prices
beginning to see structural change and productionchallengesbeingpricedinaccordingly.Asaresult,UKNationalBalancingPoint(NBP)andDutchTitleTransferFacility(TTF)pricesarebeginningtomirrortheJapanKoreaMarker(JKM).Recently,NBPandTTFpriceshaveincreasedasrisingcarbonprices,coupledwithsupplyconstraints and changing demand patterns, are allfactoredintopricingmechanisms. Given current constraints on supply, both in the UK
and on the continent, there are serious concerns thatwholesale prices will reach record levels and generatecost challenges during the comingwintermonths. Thisisalreadyhavingconsequencesacrossthewholevalue-chain, includingelectricitypricesandhouseholdenergy

15
costs,whichOfgemestimatescouldincreaseby£135perhousehold.Similarly,theUK(andothers)arerecordingsomeofthe
highest petrol and diesel prices since 2013. These arelargelylinkedtorisingoilpricesaswellasconstraintsindomesticandcontinentalproductionalongwithrefineryoutput pressures being priced in. Alongside increasedcarbonprices,thesevariousfactorsareallaffectingthewholesalepriceofoil.AsfueldutyandVAThaveremainedstable, the pressures within the wholesale market areexpectedtobeborne in termsofcost to theend-user.OGUKanticipatesthatfuelcostsarelikelytocontinuetoriseaspolicymovestowardsdecarbonisingthetransportsectorandincentivisingtheuseoflow-carbonvehicles.
WholesalePrice
Fuel Duty
VAT
Figure 7: UK Fuel Price Breakdown
GasProduction UK EU
-14% -11%1Q2021
GasConsumption UK EU
+19% +7.6%1Q2021

ECONOMIC REPORT 2021
16
Global landscapeThe energy landscape is fundamentally changing atboth a global and national level. It is widely forecastthatenergyintensityisbeginningtofallglobally,despitetrends which have historically linked economic growthwithhigherenergyconsumption. Indeed, it isexpectedthat the energy intensity of global GDP could drop 40percentby2050.5ThisdecouplingofenergyandGDPgrowth will be driven by efficiency gains, technologyadvancementsandfuelswitching–trendsalreadybeingseenhereintheUK.The IEAhasforecastthatby2050,totalglobalenergy
consumptionwillhavefallenby8percent,6 despite the world’s population increasing by over 2 billion peopleto around 9.6 billion and annual global GDP growthaveraging around 2.6 per cent.7 This will be driven byenergy efficiency improvements, the application ofnew technologies and systemic behavioural changes.Therecent IntergovernmentalPanelonClimateChange
(IPCC)AR6reporthighlightstheneedforindustry,policyleadersandconsumerstoactnowtocurbclimatechangeimpactandembedthetransitiontonetzeroonaglobalscale.WearealreadytakingactionintheUKtorespond,inparticulartheoilandgasindustry,asevidencedbytheNorthSeaTransitionDealandRoadmap2035.As the IEA and others show, oil and gas production
will continue to have an important role to play in theenergy ecosystem and will remain the backbone ofmany hard-to-decarbonise sectors and developingeconomies. The recent IEA Net Zero by 2050 Report8
outlined one such global pathway to green the entireglobalenergyecosystemby2050.Thereportconsideredradicalchangeswithglobalenergysupplydominatedbyrenewablesby2050withcarboncaptureandhydrogencrucial to decarbonisation. The net zero pathwayfocussed on supply-side measures and assumed thatdemandforoilandgaswouldfalltojustover20percent
The path to net zero
5https://www.mckinsey.com/industries/oil-and-gas/our-insights/global-energy-perspective-20216https://www.iea.org/reports/net-zero-by-20507https://www.bp.com/en/global/corporate/energy-economics/energy-outlook/global-backdrop.html8https://www.iea.org/reports/net-zero-by-2050

17
ofprimaryenergyneedsin2050,comparedwith80percentin2020.Whilst the report offers a valuable insight into the
opportunitiestodecarbonisetheglobalenergysystem,further consideration of the pace of demand sidemeasures will also be needed to balance the supplyscenarios.Thiswillbeparticularly relevant inemergingmarketsandlow-tomiddle-incomeeconomiestoensureallhavethesameopportunities forgrowthfromwhichotherdevelopedcountrieshavebenefitted.Under one scenario, the IEA assumes that oil and
gas needs could be met globally from existing knownresources,howeverthiswouldmeanaradicalchangetothe functioning of global oil and gasmarkets and risksenergy security and loss of environmental controls. Itcould,forexample,resultin52percentoftheglobaloilsupplybeing controlledbyOPECcountries, an increaseonthe37percentsharetheycurrentlyhold.Theshiftinoilsupplydynamicscouldalsoimpactenergy
security for many countries including the UK, as the
marketbecomesincreasinglymonopolised.Thisreliancebecomesexacerbatedas certain countries look to stopexplorationandproductionlicenceswithoutaddressingthedemandsideoftheenergymarket.OGUKisclearthatthereisacontinuedneedtoinvest
innewoilandgasdevelopmentstoensuresecurityofsupplyandastrongdomestic industryuponwhichtobuildthelow-carbonenergyecosystemofthefuture.IntheUK,this investmentwillalsohelpunlockotherlowcarbonenergysourcesandwouldincludeensuringthe full scaleof thegovernment’sHydrogenStrategycan be embraced. In line with this, the productionofoil andgasmustbemade lower carbon, includingthroughmeanssuchastheelectrificationof facilitiesand increasing abatement opportunities. Facilitatingthe balance between a secure energy supply whilstsupporting decarbonisation will be critical to ensurenet-zero is achieved in amanaged, fair, andefficientmannerforallpartsoftheeconomy.

ECONOMIC REPORT 2021
18
0
20
40
60
80
100
120
140
160
180
200
2020 2025 2030 2035 2040 2045 2050
CCC
Bala
nced
Pat
hway
Ene
rgy
Dem
and
(Mto
e)
Petroleum GasElectricity demand Solid fuelNon-bio waste BioenergyHydrogen CCSTotal Energy Demand
Source: CCC
UK landscapeAs the UK transitions towards net zero, the projecteddemand for oil and gas in the UKwill decrease as wesee low carbon sources displacing demand. However,in its Balanced Net Zero Pathway scenario (a scenariocompatible with achieving net zero), the UK ClimateChange Committee (CCC) outlines that oil and gas willstillbeneededtomeetaroundhalfoftotalcumulativeenergyconsumptionoverthenextthreedecades.Within that scenario, oil and gas are projected to
provide around 70 per cent of UK energy over thisdecade(2020s),around50percent in thenextdecade(2030s)andaround28percent in the2040s.By2050,theCCCforecastassumesthatdemandforoilproductsfallsby85percent–anaverageyearlydeclineof6.1per
cent–whilegasconsumptionwillhavefallenby76percent. In theBalancedNetZeroscenario,gaswouldstillbesupporting15percentoftheenergydemandin2050,albeit decarbonised or otherwise usedwith a net-zerocarbonimpact.Asintheglobalcase,itisessentialtheUKworkstowards
a net-zero energy ecosystem in the most economical,fair, efficient, andenvironmentally responsiblemanner.However, restricting supply from the UKCS will donothing to address demand. Continuing to meet asmuch of our domestic demand through investment inclean domestic resourcesminimises net importswhilstcontrollingenvironmentalstandardsandsupportingjobsandcommunitiesacrossthecountry.
Figure 8: CCC Balanced Pathway Energy Demand

19
THREE60 Energy Group is a leading independent energyservicecompanyofferingcompleteassetlifecyclesolutions.Thecompanyhasnotonlytrebled insizeoverafour-yearperiod, but also expanded its team and secured severalsignificantnewcontracts,enablingittogrowoperationsinkeystrategic locationsaroundtheworld includingtheUK,NorwayandSoutheastAsia.
In addition, the company secured contracts which sawit becomeadutyholderon three facilities in theUK andinternationally.Thissuccessactedasacatalystforfunding,andsawthegroupsecureaseven-figuredealthatwouldaidfurtherglobalexpansionthroughbothorganicgrowthandacquisitions.
A key factor supporting THREE60 Energy’s strong positionto engage with lenders earlier this year was its range ofproprietarydigitaltechnology,whichissupportingtheenergytransition.
For example, its Poseidon 4D seismic software has beenproventoreducevolumetricuncertainty,highlightingnewtargets for increased recovery. It typically delivers an estimated 70%reductioninanalysistime.WideradoptionofPoseidonacrosstheUKCScouldhelpunlocksomeoftheestimated2.1billionbarrelsremaininginexistingfields–enablingoilandgasdiversificationandthetransitiontonetzero.
Furthermore, the group’s ability to provide skills to support renewablesprojects around theworld, in particular offshorewinddevelopments, haspositioneditwellforgrowthandinvestment.
CASE STUDY:THREE60Energy

ECONOMIC REPORT 2021
20
MakingthemostofindigenousresourcesTheUKCShasproducedaround46billionbarrelsofoilequivalent(boe)overthelastfivedecadesandjustunder600millionboein2020(around85milliontonnesofoilandgasequivalent).In2020,overallproductionwas5percent lowerthan
in2019inlargepartduetotheimpactofthepandemicandconstraintsonactivityandinvestment.Thiswillalsoinfluence production in 2021 as deferredmaintenanceactivityincludingmajorinfrastructureisalsoaddressed.EvenastheUKCSisinlong-termnaturaldeclineitstill
hastheresourcestounderpinthesupplyofoilandgasthattheUKwillneedasitmakesthetransitiontoanet-zerocarbonfuture.TheOil&GasAuthority(OGA)estimatesthatremaining
UK recoverable petroleum resources are in the rangeof 10–20 billion boe, including both discovered andundiscovered petroleum resources as at the end of2019.Oil and gas reserves as at the endof 2019were5.2 billion boe,with contingent resources in producingfields and proposed new developments of 3.8 billionboe and 3.5 billion boe in marginal discoveries. In
addition, exploration potential from prospects andleadswasestimatedat4.1billionboewithanadditional 11.2 billion boe in plays across theUKCS, all based onmeanprospectiveassessments.Againstprojectedglobaldemand and supply this is comparatively small, butthe continued exploration and development of theseresourcesiscriticaltopreventoverrelianceonimportedenergy.Lookingforward,oilandgaswillcontinuetofeatureas
importantcomponentswithintheenergymix.Overthenextthreedecadesto2050,astheworkofthe
CCCdemonstrates,oilandgaswillprovidejustoverhalfofthecumulativeenergyneedsintheUK,albeitdecliningover the period.Given this, theUK should ensure thatit continues to meet as much of domestic demand aspossible from UK resources and as cleanly as possiblewhilstbenefittingthewidereconomy.In its Balanced Net Zero Pathway, the CCC estimates
thattheUKwillconsume18.3billionboeofoilandgasoverthenextthreedecades,witharound8.5billionboe (45 per cent) of this demand forecast to be met by

21
0
20
40
60
80
100
120
140
160
180
200
2020 2022 2024 2026 2028 2030 2032 2034 2036 2038 2040 2042 2044 2046 2048 2050
Tota
l Ene
rgy
Dem
and
(Mto
e)
Oil Demand Gas Demand BNZ Total Energy UKCS ProductionSource: CCC
Figure 9: UK Oil and Gas Production and Consumption Forecast
ongoingproductionfromtheUKCS.TheseprojectionsforoilandgassupplyfromtheUKCS
arewholly consistentwith theUK’s net zeroplans andalready reflect ongoing development of reserves andresources and anticipated exploration activity on theUKCSinsupportofprojecteddemand.The UK’s existing connected reserves alone will not
meet expectations on domestic supply in the years tocome. Continued development of existing discoverieshas been fully accounted for in the CCC’s scenarios and
frameworkwhichprogressivelydelivernetzeroin2050.This continued activity not only supports the energytransitionbut also allows theUK to set environmentalstandards,reducesrelianceonimportsandsustainsjobsandskillsinyearstocome.Even with sustained ongoing exploration and
developmentactivityfromtheUKCS,itisstillestimatedthat the UK will import 36 per cent of its oil and 63percentofitsgasrequirementsin2050.

ECONOMIC REPORT 2021
22
0
2
4
6
8
10
12
14
16
18
1970 1975 1980 1985 1990 1995 2000 2005 2010 2015 2020
Annu
al C
apita
l Inv
estm
ent (
£ BI
llion
-20
20 M
oney
)
Source: OGA, OGUK, CCC
Figure 10: UKCS Capital Investment
Activity arising from oil and gas production, coupledwiththeexportofrelatedgoodsandservices,continuesto make a substantial contribution to the wider UKeconomy,withbenefitsdeliveredacrosstheUK.In2021,theoilandgassectorisestimatedtosupport£31.1billionof gross value added (GVA), amounting to £17.9 billiondirect, £25.5 billion indirect and £5.6 billion induced,or 1.7 per cent of theUK total. Thismeans that every £1millionspentbytheoilandgassectorisestimatedtosupportaround£2.5millionofactivityinotherpartsoftheeconomy.Additionally,theUKenergyservicessectorisamajorexporterofoilfieldgoodsandservicesandisvaluedat£60billionoverthelastfiveyears(priortothepandemic).OGUK estimates that in the region of £3 billion was
taken out of E&P company plans for 2020–21 as thesectorrespondedtothewidespreadchallengesposedbyCOVID-19.Thefragilityofthemarketoverthe lastyearhashadanimpactoninvestorconfidenceanditwilltaketimeandsustainedhighercommoditypricestogeneratetheconfidenceneededtounlockcapital.
Buildingsustainableinvestment inUKenergy
TheUKhascommittedtoscalingR&Dinvestmentto2.4%by2027acrossthewholeeconomy.Thiswillbeakeyenablerinthe
successoftheenergytransition.

23
WhilsttheUKCSsawasharptail-offinactivitythroughthe pandemic, and is only now beginning to recover,the negative impact on the Norwegian ContinentalShelf (NCS)hasbeenminimal,withthemaintenanceofpre-pandemicratesof investmentandproduction.Thishasbeen achieved throughapackageof focusedfiscalmeasureswhichenabledcompaniestocontinuetoinvestandprogressopportunities conducive to the long-termfutureoftheNCS.Althoughsimilarfiscalmeasureshavepreviously been implemented on the UKCS, they havebeenmoreimpactfulinaNorwegiancontext.
Supplychainandtherecovery Theimpactoftheoilandgaspricecrashlastyearaddedfurtherpressuretothesupplychaincompaniesservicingtheoilandgassector.Thiswas feltparticularlysharplybecausemanycompaniesentered2020stillfragilefromdealingwiththechallengesofthepreviousdownturnthattheywerejuststartingtoemergefrom.Duringthe last18monthscompanieshavehadtomakehardchoices,in
many cases reducing theirworkforce toalignwith thebusinessoutlook.Howevertherearenowsometentativesigns to suggest that activity levelsmay be starting toslowlypickup.As the industry recovers, margins must be sufficient
to allow innovation to flourish and support companiesto move into the opportunities offered by the energytransition.Increasingly in recent yearswe have seen oil and gas
supply chain companies diversify their businesses tomeet the new opportunities offered by the energytransition. The rate of diversification has continuedthrough the pandemic. The capabilities developed indesign, construction and operations, aswell as projectmanagement (both onshore and offshore) are equallyapplicable in CCUS, hydrogen and offshore wind,particularly floating wind. Many companies investingand operating on the UKCS are also entering theseotherenergymarkets,andindeed,lastyear85percentof OGUK supply chainmembers surveyed expected toincreasetheirdiversificationeffortsinthecomingyears.

ECONOMIC REPORT 2021
24
Asgovernmentscontinuetoprogressandsupportthepath tonet zero, it isanticipated this repositioningwillonlygrow.Theenergysupplychaincontinuestohaveauniqueopportunitytocapitaliseonthegrowingenergymarket, pivoting from purely oil and gas productionto maximise wider energy system opportunities. Thisis an important step that needs to continue, as theenergysupplychainwillcontinuetobegloballeadersindevelopingtechnologiesthatwillbeanimportantdriverinovercomingtechnologybarriers.Itisthereforecrucialthat we build back a strong base fromwhich to pivotintonewenergyopportunities–andatpace.TheNSTDhighlightsanumberofkeyareasofopportunityandtheintegratedapproachneededtodothis.
CapitalinvestmentontheUKCSAround£390billionofcapitalhasbeeninvestedontheUKCSover the last50years (2020prices), enabling theproduction of 46 billion boe of oil and gas. Over £100billion of this has been invested since 2010, althoughinvestment levels have generally been in decline sincethemiddleofthepreviousdecade,onthebackofrecordinvestment levels and following the price downturnbetween2014–17.Thattrendhasmanifestedparticularlyoverthepast18monthsasaresultofCOVID-19andthecollapse in oil price. This led to only £3.7 billion beinginvestedin2020–thelowestlevelinrealtermssince1973– and a reduction of around one-third comparedwith2019(almost£5.5billion).ThecontractionininvestmentseenbytheUK’soilandgasindustryhasbeenlargerthanthatseenacrossthesectorglobally,whichRystadEnergyestimatesshrankby27percentlastyear.ItisalsogreaterthanthatseenbyothersectorsoftheUKeconomy;forexample, overall UK business investment in early 2020fellby17percentcomparedwithbeforethepandemic.9
9https://www.ons.gov.uk/economy/grossdomesticproductgdp/bulletins/businessinvestment/januarytomarch2021revisedresults

25
OGUK has visibility of around £21 billion of potentialcapitalwithinE&Pplansbetween2021–25whichwouldunlock 2.7 billion boe over the production period,howeverlessthanone-thirdofthis(£6.6billion)hasbeenfullycommittedbycompanies.Inano-further-investmentcase, total capital could fall to less than £1 billion peryearbythemiddleofthedecade.SuchascenariowouldleadtotheUKproviding lessthanone-thirdoftheCCCBalancedNetZeroPathwaydemandforoilandgas(anet-zeroaligned forecast)by2027.Thiswouldsee theUK’srelianceonimportsgrowtosupplementthedemandgap,damagingtheeconomyandreducingenergysecurity.Itwouldalsolimittheenergyservice’sexportopportunitywhichiscurrentlyvaluedatjustlessthanhalfofcompanyoilandgasturnoverrecordedin2019.10
£14.5bn of investments yet to be sanctioned
Brownfield is the area of greatest opportunity – representing 2/3 of unsanctioned activity
Half of CAPEX opportunity is in wells activities, 2/3 of which is unsanctioned and brownfield
£9.5 bn opportunities in facilities investment – most of which is greenfield work
£21bn of capital in company plans from 2021–25 – 75% brownfield projects, 25% greenfield
There is also an estimated £2bn in OPEX opportunity within these unsanctioned projects
£21bn
£14.5bn
2/3Brownfield
50%
£9.5bn
£2bn
10https://assets.ey.com/content/dam/ey-sites/ey-com/en_uk/topics/energy-resources/how-accelerating-energy-transition-will-shape-the-industry/ey-uk-energy-services-overview.pdfs

ECONOMIC REPORT 2021
26
Progression of these investments provides theopportunity tomaintain theproportionofdomesticoiland gas demandmet by domestic resources. A loss ofinvestmentwouldresultintheUKbecomingincreasinglyreliant on international sources of oil and gas,withouthavinganyimpactonlevelsofconsumption.
0
1
2
3
4
5
6
2021 2022 2023 2024 2025
Capi
tal I
nves
tmen
t (£
Billi
on -
2020
Mon
ey)
Committed Investment
Investment Under Consideration
Source: OGA, OGUK, CCC
0
200
400
600
800
1,000
1,200
2019 2020 2021 2022 2023 2024 2025 2026 2027 2028 2029 2030
Annu
al O
il an
d Ga
s Pro
duct
ion
and
Dem
and
(Mill
ion
boe)
Potential Production from Projects Under Consideration Production from Committed ProjectsCCC Balanced Pathway Oil & Gas Demand
Source: OGUK, OGA, CCC
Figure 11: UKCS Production and DemandFigure 12: UKCS Committed and
Non-Committed Investment
The UK must continue to offer a robust economicproposition to attract and retain both investors andcompanies, as many will make an important net zerocontributionwhilsthelpingtoensurestabilityofsupplythroughoutthetransition.

27
ExplorationOngoingexploration fornewresourceswillplayanimportant role in reducing reliance on net energyimports whilst helping to underpin the transition.ThroughtheNorthSeaTransitionDeal,theindustrywill ensure all exploration and production andindustry activities will meet the NSTD frameworkof50percentemissionreductionsby2030,90percent by 2040 and net zero by 2050. This coupledwith the application of the proposed ClimateCompatibilityCheckpoint(seeoverleaf),specifically
for exploration, provides the opportunity todemonstratealignmentwithnet-zerotargetswhilstprovidingtheresourcestheUKwillcontinuetoneedonitsjourneytoanet-zerofuture.As previously noted, the CCC in its Balanced Net
Zero Pathway estimates that the UK will consume 18.3 billion boe of oil and gas over the next threedecadeswith around 8.5 billion boe (45 per cent) ofthisdemandcurrently forecast tobemetbyongoingproductionfromtheUKCS.Currentreserveswillonly
2Preserves contingent mean prospective
5.2bn 7.4bn 4.1bn10-20bnboe leftintheUKCS
Resources
producingfields
proposednew developments
2.1bn 1.7bn 3.5bnContingentResources
marginaldiscoveries(newdevelopments)
Source:OGA

ECONOMIC REPORT 2021
28
provide5.2billionboe,illustratingtheneedforongoinginvestment both in the maturation of contingentresources and from continued exploration whereprospectsandleadsofferanadditional4.1billionboeofresourcesonameanbasis.Exploration on theUKCS can develop resources in an
efficient and lower carbonmanner, benefiting theUK’swidercarbonfootprint.Thisislargelyhelpedbythefactmuch of this exploration potential is close to existinginfrastructure. Currently, there are 76 production hubseitherproducingorunderdevelopment,and they forma key driver for exploration campaigns on the UKCS.Without continued activity the number of hubs willdramatically reduce over the next decade, to just 39,whichcouldleadtoassetsbecomingstrandedasfutureopportunitiesaredeemedtoosmalltobecarriedoutassingle campaigns. There are several exampleswherebyexisting infrastructure has had its life cycle extendedby decades, as in the cases ofMagnus and the Fortiespipeline, due to the option of continued step-outdevelopment.Maximisingthis infrastructurewillbekey
to providing affordable energy whilst preserving keyinfrastructureforfuturelow-carbonneedssuchasCCUS.Similarly,aswecontinuetoprogressCCUSopportunities,itisclearwewillrequirecontinuedexplorationtoidentifyreservoirs and opportunities within the rich naturalresourcesoftheUKCS.
UpdatedOGAStrategyand ClimateCompatibilityCheckpointOverthepast18months,therehavebeensignificantchangestotheUK’soilandgasregulatoryregimeimplementedbytheOGA.MaximisingEconomicRecovery (MERUK) isnolongerthesolefocusoftheUK’shydrocarbonsstrategy.TherevisedStrategyfromtheOGAplacesarangeofstringentnetzeroobligationsontheUKoilandgasindustry.AlongsidethenewOGAStrategy,theproposedClimateCompatibilityCheckpoint for exploration provides an effective balancefocussingon thenet zeroobjectivewhilstaddressing theassociated policy objectives of an affordable and diverseenergysupply.

29
TheCheckpointmustbe implemented inaconsistent,sustainable and fit-for-purpose way to ensure ongoinginvestor confidence as companies transition into newopportunities.Thiswillensurewecancontinuetomeetthe UK’s energy needs in a manner compatible withactionstocombatclimatechange.AstheUKunlockstheexplorationpotentialofferedby theUKCS, itwill all bewithin theClimateCompatibilityCheckpointsbeingput inplaceand theCCCandOGAestimate forproductionandemissions.
UKCS Production Efficiency maintained at 80% in 2020
Operating Costs – £11/barrel
Finding Costs – £1.40/barrel
95% of prospects in the UKCS are within 45km of a hub currently in production or coming online within the next 10 years
£11barrel
£1.40barrel
95%
80%
Source:OGUK,Westwood

ECONOMIC REPORT 2021
30
InvestinginthetransitionTheUK’soilandgassectorcontinuestoofferanattractiveproposition to awide rangeof investors, illustratedbythemore than £15 billion in transactions on theUKCScompleted over the last three years, including severalnew entrants. Companies continue to be attracted totheUKdue to the rangeof prospects available, accessto infrastructure, competitive operating costs and apredictableregulatoryregime.Similarly,thecompetitiveenergy supply chain that has been active on theUKCSfor the last five decades provides innovative andwell-establishedtechnologiesandmanagementtomaximiseefficientproduction.TheUKisalsoleadingtheresponsebytheoilandgasindustrytoembracetheenergytransitionthroughtheground-breakingNorthSeaTransitionDeal,demonstrating the industry’s commitment to invest inanddeliveranet-zerofutureatpace.In current times, investors and stakeholders are
increasinglylookingatafarwiderrangeofnon-financial
disclosures from businesses with respect to theiralignment with environmental, social and governance(ESG)factors,andinparallelwithcompanyprofitability.Through the North Sea Transition Deal, the industry isabletodemonstratetheactionitistakingontheUKCStomeetdemandingemissionreductiontargetsand investin wider emissions reduction technologies that the UKwill require. Performance and investment planswill betransparentlymonitoredtoensuretargetsarebeingmetand companies’ environmental andnet zero objectivesarealigned.ItiskeythattheUKcontinuestoofferarobusteconomic
proposition for investors that aligns with investors’expectations on ESG. This will ensure that investmentacross theenergysector is future-proofandconsistentwiththenewenergylandscape,providingenergysecuritywhilstunlockingfuturenetzeroprojects.

31
Proserv’s technology ethos has always beenbased around improving efficiencies, maximisingperformanceandextendingthelifeandreliabilityofkeyequipment.
Thatmeansusingitscoexistencecapabilitiesonsubseacontrol systems to refurbish existing infrastructure,avoidingthewasteandenvironmentalimpactoffullsystem replacements. Proserv’s asset enhancementsolutions enable it tomonitor real-time operationsout in the field, helping to optimise processes andpreventexcessenergyandfluiduse.
Equally, the companyhas always had clear commitments to following best practice regarding itspeople,theirdevelopmentandhowthecompanyconductsbusiness.Butleadershiprecognisedthecompanyneededtodomoretoaddressitsownoperationstobringtheminlinewiththistechnologicalphilosophyandreflecttheglobalresponsibilitytowardsprotectingtheenvironment.So,ProservsetaboutdevisingarangeofobligationsandgoalsinanewESGpolicy.
Buildinganenvironmentalroadmaprequiredpoolingthecombinedknowledgeacrossthegroup’sfunctionsandsites,andalmost40teammemberssteppedforwardtosteerthisproject.Theworkinvolvedanalysingefficienciesaroundtheglobeandhowtheycouldbeimproved.
TheoutcomefromthisevaluationisthatProservnowhasanaspirational,yetachievable,targetforreducingitscarbonfootprint.Proserviscommittedtobecomingacarbonnetzerocompanyby2050orsooner.
ThispolicyhasrecentlybeenpublishedonProserv’swebsite.
CASE STUDY:Proserv

ECONOMIC REPORT 2021
32
Growingstakeholderexpectations Thereisagrowingrangeofexpectationsregardingnon-financial disclosures which the industry supports. Aswithallemergingregulation,itwillneedtobemanagedcarefully to ensure it collectively achieves the desiredoutcomes in the simplest and least disruptivemanner.Streamlining of reporting obligations will encourageefficient capital allocation towards activities deemedconsistentwithlong-termESGexpectations.A key challenge to address will be to assimilate the
reportingrequirementsplacedoncompaniesandacrossthe value chain with regards to Scope 1–3 emissions.Stakeholder appetite is fundamentally changing howinvestmentsareappraised,whichcanbetothebenefitofall ifdonecarefully.However, improvingreporting isnot without its challenges. For example, meeting userexpectations could require oil and gas companies toengageacross theirentirevaluechain tosatisfycapitalproviderandstakeholderrequirements. Inthiscontext,itisimportantthatanyregulatoryorreportingmeasures
are put in place tomaintain the objective of bringingmarket clarity through carbon accounting, rather thanbecoming a regulatory burden. Industry will continueto respond sensitively to stakeholder and shareholderexpectations.OGUK expects this trend to continue over the next
decadeasclimateandenvironmentalandsocialpoliciesare embedded into the market through initiativesincluding the Taskforce on Climate-Related FinancialDisclosures (TCFD),TaskforceonNature-basedfinancialdisclosures (TNFD),andGreenTaxonomies.Recognisingthis, OGUK has established a new work stream topositivelypositiontheindustrytomeetappropriateESGcriteria.BothoperatorandsupplychaincompaniesontheUKCS
arealreadyleadingthewayonclimatedisclosuresandthistrendlookssettocontinueasenergycompaniescontinuetoplacethemselvesattheforefrontofreporting.11
11https://www.fsb.org/2020/10/2020-status-report-task-force-on-climate-related-financial-disclosures/

33
[05]
CHAPTER 01 Introduction
The Scope 3 Standard complements and builds upon the
Corporate Standard to promote additional completeness
and consistency in the way companies account for and
report on indirect emissions from value chain activities.
The Corporate Standard classifies a company’s direct and
indirect GHG emissions into three “scopes,” and requires
that companies account for and report all scope 1
emissions (i.e., direct emissions from owned or controlled
sources) and all scope 2 emissions (i.e., indirect emissions
from the generation of purchased energy consumed by
the reporting company). The Corporate Standard gives
companies flexibility in whether and how to account for
scope 3 emissions (i.e., all other indirect emissions that
occur in a company’s value chain). Figure 1.1 provides
an overview of the three GHG Protocol scopes and
categories of scope 3 emissions.
Since the Corporate Standard was revised in 2004, business
capabilities and needs in the field of GHG accounting and
reporting have grown significantly. Corporate leaders are
becoming more adept at calculating scope 1 and scope 2
emissions, as required by the Corporate Standard. As GHG
accounting expertise has grown, so has the realization
that significant emissions – and associated risks and
opportunities – result from value chain activities not
captured by scope 1 and scope 2 inventories.
Scope 3 emissions can represent the largest source of
emissions for companies and present the most significant
opportunities to influence GHG reductions and achieve a
variety of GHG-related business objectives (see chapter 2).
Developing a full corporate GHG emissions inventory –
incorporating scope 1, scope 2, and scope 3 emissions –
enables companies to understand their full emissions
Figure [1.1] Overview of GHG Protocol scopes and emissions across the value chain
CO2 CH4 SF6N2O HFCs PFCs
purchased electricity, steam, heating & cooling for own use
purchased goods and
services
capital goods
fuel and energy related
activities
transportation and distribution
waste generated in operations
business travel
transportation and distribution
processing of sold products
use of sold products
end-of-life treatment of sold products
leased assets franchisesemployee commuting
leased assets investments
company facilities
company vehicles
Scope 3INDIRECT
CO2 CH4 SF6N2O HFCs PFCs
purchased electricity, steam, heating & cooling for own use
purchased goods and
services
capital goods
fuel and energy related
activities
transportation and distribution
waste generated in operations
business travel
transportation and distribution
processing of sold products
use of sold products
end-of-life treatment of sold products
leased assets franchisesemployee commuting
leased assets investments
company facilities
company vehicles
Reporting companyUpstream activities Downstream activities
CO2 CH4 SF6N2O HFCs PFCs
purchased electricity, steam, heating & cooling for own use
purchased goods and
services
capital goods
fuel and energy related
activities
transportation and distribution
waste generated in operations
business travel
transportation and distribution
processing of sold products
use of sold products
end-of-life treatment of sold products
leased assets franchisesemployee commuting
leased assets investments
company facilities
company vehicles
Scope 1DIRECT
Scope 2INDIRECT
Scope 3INDIRECT
CO2 CH4 SF6N2O HFCs PFCs
purchased electricity, steam, heating & cooling for own use
purchased goods and
services
capital goods
fuel and energy related
activities
transportation and distribution
waste generated in operations
business travel
transportation and distribution
processing of sold products
use of sold products
end-of-life treatment of sold products
leased assets franchisesemployee commuting
leased assets investments
company facilities
company vehicles
CO2 CH4 SF6N2O HFCs PFCs
purchased electricity, steam, heating & cooling for own use
purchased goods and
services
capital goods
fuel and energy related
activities
transportation and distribution
waste generated in operations
business travel
transportation and distribution
processing of sold products
use of sold products
end-of-life treatment of sold products
leased assets franchisesemployee commuting
leased assets investments
company facilities
company vehicles
CO2 CH4 SF6N2O HFCs PFCs
purchased electricity, steam, heating & cooling for own use
purchased goods and
services
capital goods
fuel and energy related
activities
transportation and distribution
waste generated in operations
business travel
transportation and distribution
processing of sold products
use of sold products
end-of-life treatment of sold products
leased assets franchisesemployee commuting
leased assets investments
company facilities
company vehicles
CO2 CH4 SF6N2O HFCs PFCs
purchased electricity, steam, heating & cooling for own use
purchased goods and
services
capital goods
fuel and energy related
activities
transportation and distribution
waste generated in operations
business travel
transportation and distribution
processing of sold products
use of sold products
end-of-life treatment of sold products
leased assets franchisesemployee commuting
leased assets investments
company facilities
company vehicles
CO2 CH4 SF6N2O HFCs PFCs
purchased electricity, steam, heating & cooling for own use
purchased goods and
services
capital goods
fuel and energy related
activities
transportation and distribution
waste generated in operations
business travel
transportation and distribution
processing of sold products
use of sold products
end-of-life treatment of sold products
leased assets franchisesemployee commuting
leased assets investments
company facilities
company vehicles
CO2 CH4 SF6N2O HFCs PFCs
purchased electricity, steam, heating & cooling for own use
purchased goods and
services
capital goods
fuel and energy related
activities
transportation and distribution
waste generated in operations
business travel
transportation and distribution
processing of sold products
use of sold products
end-of-life treatment of sold products
leased assets franchisesemployee commuting
leased assets investments
company facilities
company vehicles
CO2 CH4 SF6N2O HFCs PFCs
purchased electricity, steam, heating & cooling for own use
purchased goods and
services
capital goods
fuel and energy related
activities
transportation and distribution
waste generated in operations
business travel
transportation and distribution
processing of sold products
use of sold products
end-of-life treatment of sold products
leased assets franchisesemployee commuting
leased assets investments
company facilities
company vehicles
Figure 13: Understanding Scope 1–3 Emissions
Source:GHGProtocol

ECONOMIC REPORT 2021
34
Theworld is changingat a fastpace, asweadoptnewtechnologies, new regulations and a rising interestin reducing our environmental impact. Logistics andmaterials management group, ASCO is committed tobecomingresponsiblecustodiansofourhuman,financialand natural capital, supporting the energy transitionand protecting our planet by aiming to reduce itsenvironmental impact and shape a low-carbon supplychain. The company commits to becoming a net-zerogreenhousegasemissionsbusinessbytheendof2040.
Attheendof2020,ASCOestablished“Sustainability”asoneofitscoreobsessionsalongwithSafetyExcellenceandServiceExcellence,andwillnowassessall itsoperationsundera sustainable framework, theASCOEnvironmentalSustainabilityPolicy.ThisrecognisestheenvironmentalimpactofoperationalactivitiesandsetsoutacommitmenttoensurethatASCOcaneffectivelycontrol,reduceand/ormitigatethisimpact.Indoingso,ASCOwasdelightedtoseeapositivelevelofengagementandagreatuptakefromitsstaff,aswellaspartnersandclients.
Thistransitioniswellunderway,evidencedbythedigitalisationandinstallationofshorepowerin somesupplybases inNorway, the introductionofelectric forklifts,alternative fuel trialsandthe launchofanewOperationalControlCentre inDyce,UK,tostreamlineoperationsandthusreduceemissions.Therearefurtheropportunitiestomaximisevaluethroughoutthesupplychainandacrossvaluechains,benefitingfromtransferableskillsandcapabilities.
Thisrequirestransparency,closecollaborationandtrustwithclientsandpartnerstounderstandtheircurrentandfutureneeds,workingtogetherinnewbusinessmodelsandaligningstrategies.ASCOstronglybelievesworkingtogetheronthesechallengeswillprovideabetterchanceofsuccess.Theenergytransitionwillundoubtedlybringexcitingopportunitiesandthewholesectorneedstoworktogethertomaximisethem.
CASE STUDY: ASCO

35

36
TheNorthSeaTransitionDeal (NSTD), thefirstbyaG7country,willacceleratetheenergytransition,reduceUKemissions,andcreatenewjobsacrosstheUK.The Deal represents an agreement between the UK
governmentandindustrytohelpdeliveranetzerofutureas rapidly as possible,making thebest useof theUK’sownresourcestoprovidecleanenergyandenablingtheUK’senergysupplychaintounlockalowcarbonfuture,supporting communities and accelerating employmentopportunitiesthroughthetransition.The OGA shows the true potential of the North Sea
whichwillhelpdecarboniseupto60percentoftheUKeconomythroughacombinationofprovidingcleaneroilandgas,anddevelopmentofrenewableandnewenergycapabilities(floatingwind,electricitynetworks,CCSandhydrogen)onthepathwaytonetzero.12
TheDealsetsambitioustargetstoreducetheemissionsfromtheproductionofoilandgasontheUKCS,whichwillbehalvedby2030andcutby90percentby2040.
TheNSTDalsosetsouthowthesectorwillcontributetothedecarbonisationofthewidereconomy,inparticularthrough the investment of billions of pounds in CCUSinfrastructureandtheproductionofhydrogenwhichhasavital roleasasubstitute for someexistingusesofoilandgasintheeconomy.Overtheperiodto2030theDealisexpectedtodeliver
£14–16 billion of additional investment into drivingdecarbonisation through the UKCS, on top of thatrequired tomeetongoingoil and gasdemand.Around40,000incrementaljobswillresultfromthisinvestment.This is expected to go some way to offsetting theexpected reductions as the basinmatures and therebycontributing to a fair and managed transition for thesector.Thesejobswillbeacrossconstruction,operationsandthesupplychainandthereisanaspirationtoachieve 50percentUKcontentoverthelifecycleofallrelatednewenergy projects, including 30 per cent locally providedtechnologycontent.
TheNorthSeaTransitionDeal
12https://www.ogauthority.co.uk/news-publications/publications/2020/ukcs-energy-integration-final-report/
ECONOMIC REPORT 2021

37
1
North Sea Transition Deal
Infrastructure delivery will be made reality through capability-related commitments that underpin the growth of the UK economy
The Deal will require an internationally competitive and level playing field as part of a broader energy framework
Supply decarbonisationcutting upstream Oil and Gas industry emissions through an
ambitious production emissions reduction programme
Carbon Capture & Storage
enabling large parts of UK industry and society to
eliminate emissions
Hydrogenproviding a realistic
alternative for heating, heavy industry, and
transport
Supply chain transformationdeveloping expertise that underpins energy-sector wide export growth from the UK,
creating a globally competitive energy supply chain of international repute
People & Skillssecuring, stimulating, and creating tens of thousands of high quality jobs in
industrial heartlands
Supply decarbonisationcutting upstream Oil and Gas industry emissions through an
ambitious production emissions reduction programme
Carbon Capture & Storage
enabling large parts of UK industry and society to
eliminate emissions
Hydrogenproviding a realistic
alternative for heating, heavy industry, and
transport
The UK North Sea Transiti on Deal, the fi rst by a G7 country, will accelerate the energy transiti on, reduce UK emissions, and create new jobs across the UK

ECONOMIC REPORT 2021
38
TherateofchangetofullydecarbonisetheUKeconomyisonlyacceleratingaswecontinuetounlocklowcarbontechnologies and scale projects. At the core of thetransition ismanagingbothenergysupplyanddemandfundamentalsthroughrobustsupplyandconsumerstepchanges.Netzeroandcontinuedoilandgasproductionare intrinsically linked andwill be the backbone of thefuture energy ecosystem. As we look ahead towardsCOP26,itisimportantthatwecontinuetoseethepaceofpolicydecisionandsupportof investmentneededtoensureasuccessfultransition.The NSTD provides for a transitioning future for the
UKCS, consistent with the net zero objectives of thegovernment and wider society. This includes both thediversification into important new activities offshore,suchasrenewablesandcarboncaptureandstorage,andtheongoingproductionofoilandgaswithconsistentlylower Scope 1 emissions. Industry continues to workwithgovernmentandtheOGAtorealiseandimplementthe commitments of thedeal, including submissions tofundingevents.
Learnmoreaboutthe NorthSeaTransitionDeal andtheworkofOGUK
www.oguk.org.uk/nstd
OGUKwillpublishitsEnergy Transition Outlook
inQ32021

39
ECONOMIC REPORT 2021
40
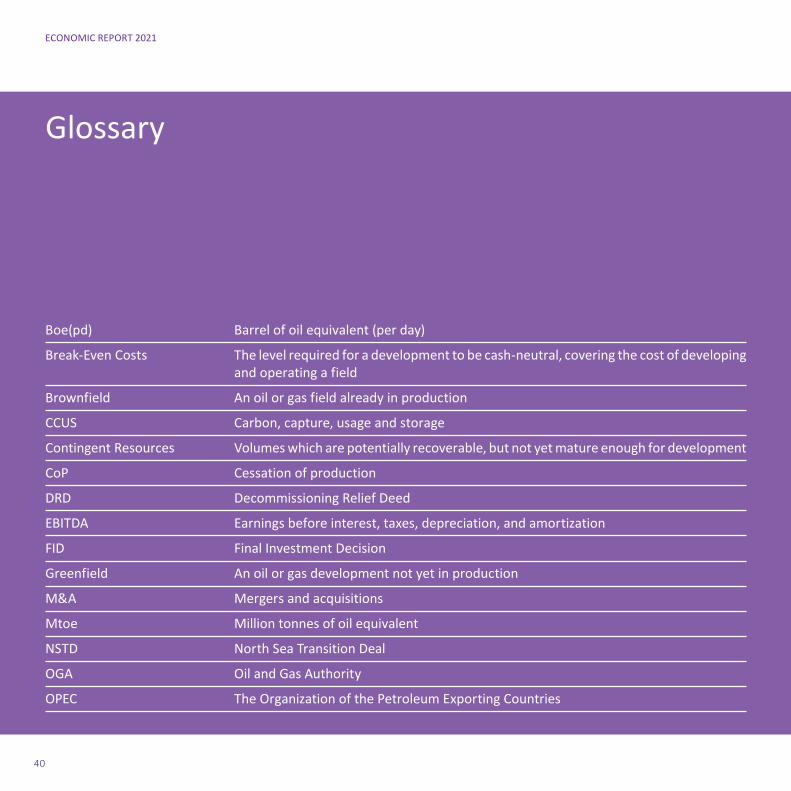
Boe(pd) Barrelofoilequivalent(perday)
Break-EvenCosts Thelevelrequiredforadevelopmenttobecash-neutral,coveringthecostofdevelopingandoperatingafield
Brownfield Anoilorgasfieldalreadyinproduction
CCUS Carbon,capture,usageandstorage
ContingentResources Volumeswhicharepotentiallyrecoverable,butnotyetmatureenoughfordevelopment
CoP Cessation of production
DRD DecommissioningReliefDeed
EBITDA Earningsbeforeinterest,taxes,depreciation,andamortization
FID FinalInvestmentDecision
Greenfield Anoilorgasdevelopmentnotyetinproduction
M&A Mergersandacquisitions
Mtoe Milliontonnesofoilequivalent
NSTD North Sea Transition Deal
OGA Oil and Gas Authority
OPEC TheOrganizationofthePetroleumExportingCountries
Glossary

41
OSPAR The Oslo and Paris convention is the Convention for the Protection of theMarineEnvironmentoftheNorth-EastAtlantic
ProductionEfficiency Thetotalannualproductiondividedbythemaximumproductionpotentialofafield
p/th Pencepertherm(forgas)
ProspectiveResources Volumeswhichareyettobediscovered
Reserves Volumeswhicharediscovered,commercialandwithin fields inproductionorunderdevelopment.Thesecanbefurthercategorisedas:
•1Preserves:provenreserves(bothproveddevelopedreserves+provedundevelopedreserves).
•2Preserves:1P(provenreserves)+probablereserves,i.e.“provenANDprobable”
•3Preserves:thesumof2P(provenreserves+probablereserves)+possiblereserves,i.e.“provenANDprobableANDpossible”
TTH TransferableTaxHistory
UKCS UK Continental Shelf
UDC Unitdevelopmentcosts
UOC Unitoperatingcosts

ECONOMIC REPORT 2021
42©2021TheUKOilandGasIndustryAssociationLimited,tradingasOGUK
oguk.org.uk
@OGUKenergy
OGUK