economic report on southern africa 2011 - united nations economic … · 2014-06-23 · the...
TRANSCRIPT

Economic Commission for Africa Southern Africa
Status and prospects for economic diversification in Southern Africa
Southern Africa2011Economic Report on

Southern Africa2011Economic Report on
Status and prospects for economic diversification in Southern Africa
Economic Commission for Africa Southern Africa

© United Nations Economic Commission for Africa, 2012Addis Ababa, Ethiopia
All rights reservedFirst printing April 2012
Material in this publication may be freely quoted or reprinted. Acknowledgement is requested, together with a copy of the publication.
Cover photos:
Ordering informationTo order copies of Status and prospects for economic diversification in Southern Africa by the Economic Commission for Africa, please contact:
Publications:Economic Commission for AfricaP.O. Box 3001Addis Ababa, Ethiopia
Tel: +251 11 544-9900Fax: +251 11 551-4416E-mail: [email protected]: www.uneca.org

iii
Table of Contents
Acronyms v
Acknowledgements vii
Foreword ix
Introduction 1
Recent economic and social trends in Southern Africa and Prospects for 2011 31.1 Developments in the global Economy and Implications for Southern Africa 3 I.1.1. Overview 3 I.1.2. Implications for Southern Africa 6I.2. Recent macroeconomic performance and prospects for 2011 8 I.2.1. GDP Growth 8 I.2.2. Sector performance and contribution to GDP 9 I.2.3. Main drivers and constraints for economic performance in Southern African 11 I.2.4. Consumption and investment 11 I.2.5. Inflation 12 I.2.6. Tracking the SADC debt sustainability target 14 I.2.7. Debt 14 I.2.8. FDI trends and related policy issues 15 I.2.9. Fiscal balance and Public Finance 16 I.2.10. Trade, External Balance and Exchange Rates 17I.3 Recent developments in Social Conditions 22 I.3.1. Human Development 22 I.3.2. Education and Training 22 I.3.3. Gender and Development 23 I.3.4. Population and demographic dynamics 24

I.3.5. Health 25 I.3.6. HIV and AIDS 26References 27
Status and Prospects for Economic Diversification in Southern Africa 292. Introduction 29 2.0.1 Overview 29 2.0.2 A case for economic diversification 31 2.0.3 Pitfalls of economic diversification 32 2.1 Status of economic diversification in Southern Africa 33 2.1.1 Measurements of economic diversification in Southern Africa 34 2.1.2 Opportunities for economic diversification 412.2. National experiences of economic diversification: Case studies 45 2.2.1 South Africa 45 2.2.2 Mauritius 49 2.2.3 Swaziland 52 2.2.4 Lessons from the experiences of South Africa, Mauritius and Swaziland 572.3 Conclusion and recommendations 60 2.3.1. Summary of findings 60 2.3.2 Overall policy recommendations 61 2.3.3 At the National Level 61 References 65

v
Acronyms
ACP-EU African, Caribbean and Pacific countries – European Union
AfDB African Development Bank
AGOA African Growth and Opportunity Act
ART Antiretroviral Treatment
AU African Union
BRIC Brazil, Russia, India and China
COMESA Common Market for East and Southern Africa
DAC Development Assistance Committee
DRC Democratic Republic of Congo
EAC Eastern African Community
EDC Emerging Developing Countries
EPA Economic Partnership Agreement
EU European Union
FAO Food and Agriculture Organization of the United Nations
FDI Foreign Direct Investment
FTA Free Trade Area
HDI Human Development Index
HIPC High Indebted Poor Countries
HIV/AIDS Human Immunodeficiency Virus/ Acquired Immune Deficiency Syndrome
ICE Intergovernmental Committee of Experts
ISI Import Substitution Industrialization
IMF International Monetary Fund

MFEZ Multi Facility Economic Zone
MDGs Millennium Development Goals
NEPAD New Partnership for Africa’s Development
NTBs Non Tariffs Barriers
GDP Gross Domestic Product
OECD Organisation for Economic Co-operation and Development
PTA Preferential Trade Arrangements
TB Tuberculosis
SACU Southern Africa Customs Union
SADC Southern Africa Development Community
SME Small and Medium Enterprises
UN United Nations
UNAIDS The Joint United Nations Programme on HIV/AIDS
UNCTAD United Nations Conference on Trade and Development
UNECA-SA United Nations Economic Commission for Africa’s Southern Africa Office
UNDP United Nations Development Programme
USA United States of America
WTO World Trade Organization

vii
The Economic Report on Southern Africa 2011 is an annual publication of the United Nations Economic Commission for Africa’s Southern African Office (UNECA-SA) submitted to the sub region’s Intergov-ernmental Committee of Experts (ICE). This report was completed under the leadership of the Mr. Emile Ahohe, the Officer-in-Charge of ECA-SRO/SA. The first part of the report was prepared by the ECA-SRO/SA professional team, comprising of Susan Mokonyana, Johnson Oguntola, Keiso Matashane, Matfobhi Riba, Jean Luc Mastaki, Jack Jones Zulu, Benjamin Banda, Atamelang Ngwako and Maame Agyeben. The thematic part of this report was based on the original paper of the consultant, Dr. Bwalya Ngandu under the coordination of Mr. Jack Jones Zulu and reviewed by the UNECA-SA professional team. The report team would also like to acknowledge the assistance of the support team, including Meseret Worku, Dailes Matoka, Ruth Kananda, Dorothy Pelekamoyo, Ian Filakati, Ronald Nkhoma, Bedson Nyoni, Anne Mwansa, Grace Kaonga, Annie TembaTemba, Katongo Mubanga and Bartholomew Nyendwa.
A draft version of this report was presented and reviewed by the experts who took part in the Seventeenth Meeting of the Intergovernmental Committee of Experts for Southern Africa on “Status and Prospects for Economic Diversification in Southern Africa” held in Windhoek, Namibia, 17-18 March 2011. ECA-SRO/SA would like to thank both the internal and external reviewers of this report for their comments and suggestions.
ECA-SRO/SA also extends its appreciation to Doreen Bongoy-Mawalla, ECA’s Director of the Division of Administration, the Publications and Conference Management Section (PCMS) of ECA led by Etienne Kabou and ECA Documents Control team led by Marcel Ngoma Mouaya for their support and assistance in bringing this report to fruition.
Acknowledgements


ix
The countries of Southern Africa are on the road to recovery given the recent global economic trends and the robust growth profile of the emerging economies. The SADC countries posted moderate growth in 2010 and are all expected to perform better in 2011. Whilst the current global upward trend of metals and minerals prices presents an opportunity for the SADC mining based economies, the rising prices in selected food commodities pose a serious threat to food security in the sub region.
Issues and challenges faced by the sub region include its low domestic savings rates leading to a weak domestic resources mobilization; the trade-offs between inflation management and the need to increase public spending for development; and the need to adopt prudent debt management strategies whilst harnessing the benefits of debt relief initiatives to speed up poverty reduction and MDGs attainment. The low level of intra-SADC trade sustained by missing complementarities, restrictive rules of origin, inefficiencies in transport, customs and logis-tics, inadequate technical regulations and standards, and supply-side constraints coupled with an over reliance on imports is having a widespread effect on the rate of socio-economic development.
Most economic activity in the Southern Africa sub region takes place in the two primary sectors of agriculture and mining. Dependence on primary exports exposes SADC countries to the negative effects of global commodity price volatility. Commodity price volatility was responsible for steep losses in the value of commodity exports in the early months of 2009. Less diversified countries exporting primary products are estimated to have suffered at least 20 per cent more than other countries that export manufactures. High economic concentration that is characteristic of undiversified economies often leaves a country vulnerable to fluctuations in the price of the dominant export product leading to national income high volatility and acts then, as the instigator of disruptive boom and bust cycles which undermine sustainable development.
This report aims at providing SADC member States with an overview of the recent economic and social develop-ments in Southern Africa and summarises the prospects for 2011. It also further seeks to deepen the reflection on and explore practical steps to strengthening economic diversification and making recommendations on develop-ment policy coordination and harmonisation in the sub region.
It is my hope that the recommendations of this report will be useful to all stakeholders, in particular member States and development partners.
Emile Ahohe,
Officer-in-Charge, UNECA-SA
Foreword


1
This year’s Economic Report on Southern Africa builds on the recommendations of the 16th session of the Intergovernmental Committee of Experts (ICE) held in March 2010 in Lilongwe, Malawi, which considered the paper submitted by UNECA-SA on the impacts of the international economic and financial crises on the economies of the sub region. The ICE called for the intensification of efforts aimed at economic diversification in order to minimise the sub region’s vulnerability to ex-ternal shocks and commodity price volatility. The far-reaching adverse effects of the global downturn that range from a collapse in trade volumes with attendant reductions in export revenues and the loss of jobs across various sectors to a significant drop in private remittances across the sub region are extensively documented. These impacts were par-ticularly severe because of the lack of diversification and the primary commodity export dependence of many of the sub region’s economies.
It is against this backdrop that the theme of the 17th Meeting, “Status and Prospects for Economic Diversi-fication in Southern Africa”, was chosen. This theme was selected not only to facilitate deepened reflec-tion amongst policymakers on the importance of economic diversification as the most viable strategy to withstand persistent exogenous shocks, but also to help identify and address the challenges faced by member States in their quest for sustainable growth
that is essential for achieving poverty reduction in the aftermath of the global downturn.
Part I details recent economic and social devel-opments in Southern Africa and summarises the prospects for 2011. It encompasses an overview of the trends in the global economy and their im-plications for Southern Africa, a snapshot of eco-nomic performance in 2009-2010 and highlights of emerging social issues in the sub region. Part I aims to initiate an exchange of experience and a broad dialogue among development experts and prac-titioners from member States, intergovernmental organizations and other stakeholders. It contains a set of recommendations for strengthening develop-ment policy and its coordination and harmonisation across member States. Part I is widely disseminated following review by the ICE. Part II of the Report explores in depth the “Status and Prospects for Eco-nomic Diversification in Southern Africa”. It presents a literature review on the concept of diversification and then takes stock of diversification initiatives in the sub region by interrogating the frameworks, policies and strategies that member States have put in place to support economic diversification. It concludes by exploring the way forward.
Introduction


3
1Recent economic and social trends in Southern Africa and Prospects for 20111.1 Developments in the global Economy and Implications for Southern AfricaI.1.1. Overview
The Global economy continues to be buoyed by government-led stimulus packages in Europe and North America and by the resilience of emerging economies such as China and India. The world economy grew by 3.9 per cent in 2010 up from 0.8 per cent in 2009. Global imbalances, whereby the growth in emerging economies far outpaces that of advanced economies, exchange rates are increas-ingly unaligned and trade balances become un-sustainable, have intensified in 2010-2011. Global economic activity is forecast to expand by 4.2 per cent in 2011with the output of emerging and devel-oping economies expected to expand at 7.1 and 6.4 per cent respectively, in 2010 and 2011. In contrast, growth in advanced economies is projected at only 2.7 and 2.2 per cent in 2010 and 2011, respectively. Unemployment is expected to remain persistently high while inflation is projected to stay generally low in most economies apart from a few exceptions amongst emerging economies.
In the euro zone, a major trade partner for SADC, the recovery has gained some vigour but it remains moderate and uneven. Europe’s GDP is projected to grow at 2.0 per cent in 2010 and 1.8 per cent in 2011
but there are pronounced differences in economic prospects across the euro zone in accordance with the condition of public and private sector balance sheets and the extent to which macroeconomic policies are able to support the recovery. There are concerns that a European debt crisis (which first manifested in Greece) and fiscal austerity meas-ures in several countries might derail the region’s economic recovery.
Thanks to an unprecedented stimulus package, the U.S. economy has registered a modest cyclical upswing. The country’s GDP growth rose to 2.6 per cent in 2010 up from - 3.2 per cent in 2009 and is projected at 2.3 per cent in 2011. The unemployment rate is expected to remain stubbornly high (9.7 per cent) while inflation remained low at 1.4 per cent in 2010 and is projected at 1 per cent in 2011.
Supported by the domestic demand, the growth profile in the emerging economies, particularly in China and India, continues to be robust. In China, annual growth was 10.5 per cent in 2010 and is pro-jected at 9.6 per cent in 2011 — putting that country at the lead of the global recovery. Although China’s

4 Economic Report on Southern Africa 2011 Status and Prospects for Economic Diversification in Southern Africa
exports were hard hit by the global crisis and activity slowed sharply over the course of 2008, prompt and vigorous policy action as well as swift adjustments in the labour market helped spur growth by the second quarter of 2009. China’s importance in the world economy is set to increase further, as are living standards. Growth will likely continue to be largely driven by investment and a shift out of low-productivity agriculture.
India’s macroeconomic performance has also been vigorous; economic growth is estimated at 9.7 per cent in 2010 and forecast at 8.4 per cent in 2011. Growth is increasingly led by domestic demand and the con-tribution from net exports is projected to turn negative in 2011. GDP growth in Russia was estimated at 4 percent in 2010 up from (-7.9% in 2009) and is projected to be 4.3 percent in 2011. Similarly, GDP growth in Brazil rose to 7.5% in 2010 following decline of -0.2 percent in 2009 and is expected to be 4.1 percent in 2011.
During 2010, inflation in the euro zone was within single-digit bounds ranging from -2.8 per cent (Latvia) to 5 per cent (Hungary). Similarly for key emerging economies, available information shows that despite strong growth, inflation is expected to remain under control in Brazil, Russia, India and China (BRIC) in 2011. China, Brazil and Russia recorded 3.1 per cent, 5.2 per cent and 6.1 per cent inflation, respectively, in 2010. Monetary policy measures kept inflation down in Brazil while in Russia the recent appreciation of the Rouble is also likely to keep inflation low. However, it is expected that inflation might accelerate in India during 2010-11 as supply-side inflationist pressures build up.
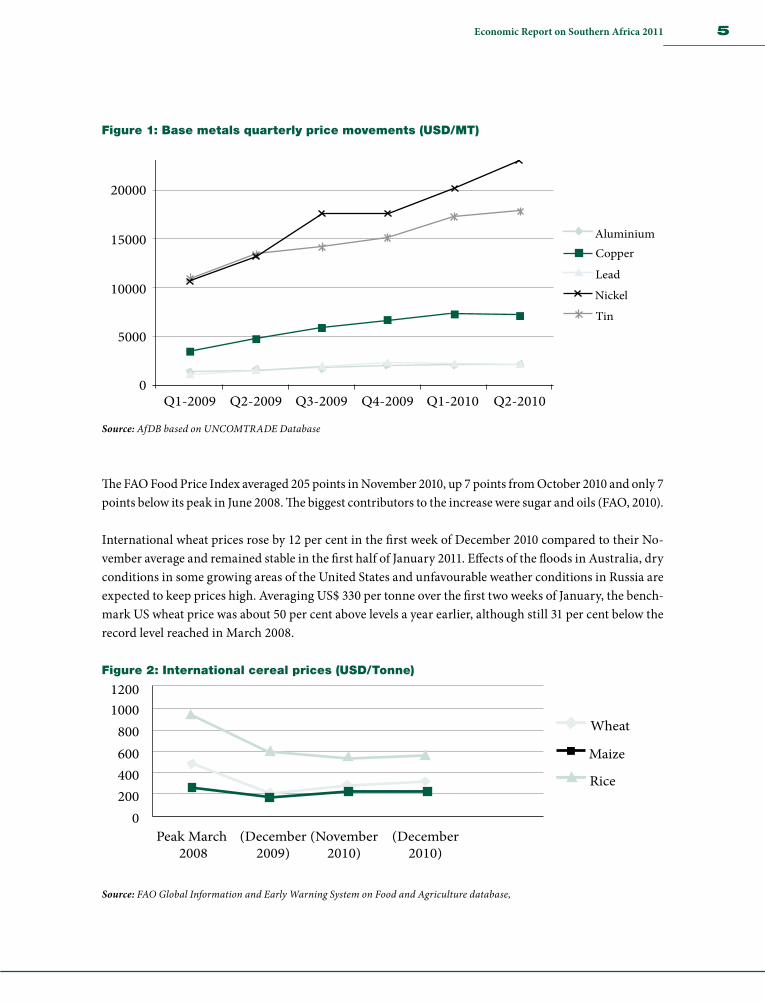
Commodity prices in 2008-2010 reflected the fluctuating global economic outlook. The movement of global commodity prices has a pivotal influence on some SADC economies. For example, Zambia’s real GDP growth exhibits a positive correlation with world copper prices with higher copper prices tending to be associated with higher economic growth. Copper contributed up to 39.2 per cent of total exports and 62.8 per cent of government revenues in Zambia in 2008. The majority of SADC economies are fuel importers. In 2010, the commodity non-fuel price index rose by 4.8 per cent on a monthly basis mainly supported by metal prices (+6.3 per cent) and food prices (+5.3 %). Metals and minerals prices registered a slight recovery on a quarterly basis from early 2009. Industrial metal prices recorded substantial but diverse increases in August 2010 but conditions in these markets are still very fragile and dependent on growth in the US and China. Metal prices are expected to continue to rise in 2011 due to a lack of investment in new mines. The Virtual Metals Group estimates that the average price per metric tonne of base metals in 2011 will be as follows: aluminium (US$2,652), copper (US$7,908), lead (US$2,463), nickel (US$24,792), tin (US$19,521) and zinc (US$2,825).
5 Economic Report on Southern Africa 2011
Figure 1: Base metals quarterly price movements (USD/MT)
5000
Q1-2009 Q2-2009 Q3-2009 Q4-2009 Q1-2010 Q2-2010
Tin
Nickel
Lead
Copper
Aluminium
10000
15000
20000
25000
0
Source: AfDB based on UNCOMTRADE Database
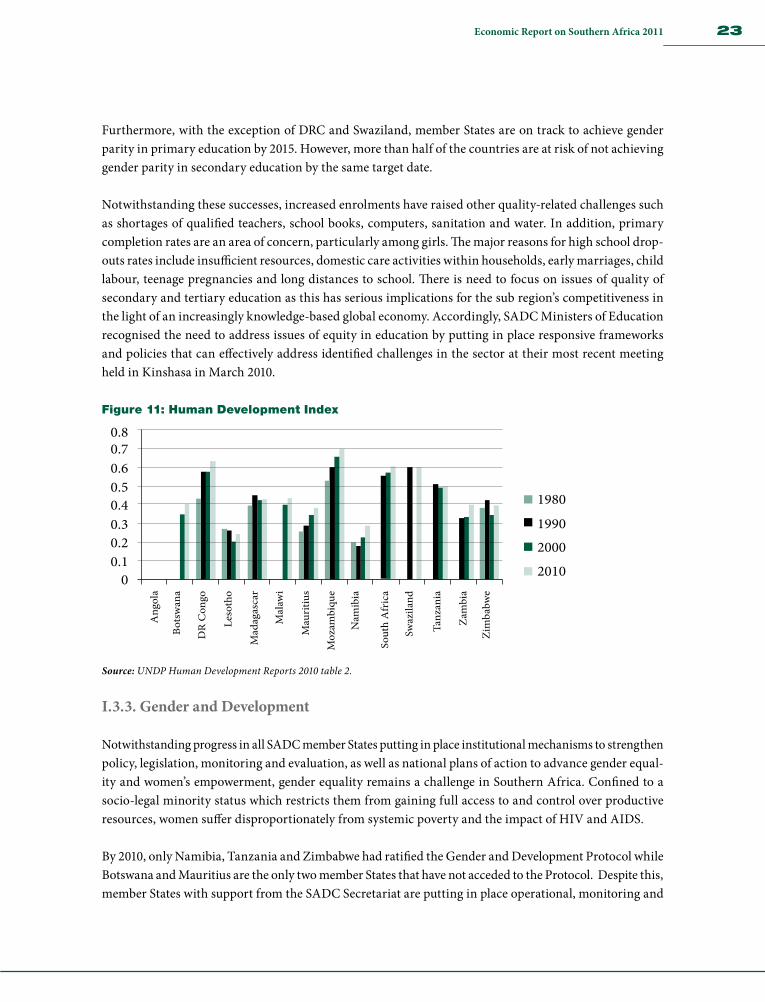
The FAO Food Price Index averaged 205 points in November 2010, up 7 points from October 2010 and only 7 points below its peak in June 2008. The biggest contributors to the increase were sugar and oils (FAO, 2010).
International wheat prices rose by 12 per cent in the first week of December 2010 compared to their No-vember average and remained stable in the first half of January 2011. Effects of the floods in Australia, dry conditions in some growing areas of the United States and unfavourable weather conditions in Russia are expected to keep prices high. Averaging US$ 330 per tonne over the first two weeks of January, the bench-mark US wheat price was about 50 per cent above levels a year earlier, although still 31 per cent below the record level reached in March 2008.
Figure 2: International cereal prices (USD/Tonne)
12001000
800600400200
Wheat
Maize
Rice
Peak March 2008
(December2009)
(November2010)
(December2010)
0
Source: FAO Global Information and Early Warning System on Food and Agriculture database,

6 Economic Report on Southern Africa 2011 Status and Prospects for Economic Diversification in Southern Africa
International rice prices increased in November and early December 2010, however, the reference Thai rice price remained 41 per cent below the peaks reached in mid 2008. The increase in prices followed downward revisions of the rice production forecasts in main exporter countries and strong international demand.
I.1.2. Implications for Southern Africa
Progress in the European recovery will have an impact on the performance of SADC’s extractive sector. China and India’s strong and sustained growth in recent years has boosted their trade with SADC countries as a result of their growing economies’ thirst for primary resources. Exports to China and India from SADC are gaining an increasing share of total SADC exports and are reducing the sub region’s overreliance of traditional trading partner see box 1). SADC’s commodity exporters will continue to reap the benefits of China and India’s appetite for raw materials. Sustained demand for commodities from Asian emerging economies is likely to further boost exports and export receipts in SADC. Since China’s footprint in global markets is large, it is expected that global commodity prices will also remain high.
Given that inflation in Southern Africa is largely influenced by economic activities in its external trading partners, mainly the EU, US and the BRIC, some of the inflationary pressures in these economies could be transmitted into the sub region.
The US, China, Brazil and India are major base metal consumers. As the global economy recovers, it is expected that a sustained bullish base metal market with strong industrial demand particularly from the emerging economies that are building their infrastructure. In the medium-term, the expanded assembly of motor vehicles worldwide will boost demand, reduce stockpiles, tighten supply and raise the price for lead, nickel, and zinc and benefit the SADC economies.
Although the metals and minerals price recovery presents a great opportunity for the commodity based economies in Southern Africa, the current upward trend in selected food commodities poses a serious threat to the majority net food importing countries. The rise in food prices has already led to social tensions in Mozambique in 2010. While SADC recorded major deficits in wheat (2.75 million tonnes) and rice (0.66 million tonnes) in 2010, the cereal import bill of SADC countries, which fell in 2009/10, is forecast to increase by 11 per cent to US$ 29.6 billion in 2011. Rising imported cereal prices could worsen the food security in the sub region.
European and American fiscal austerity programmes can also be expected to hamper the sub region’s 2010-2011 growth outlook. The marked increase in the importance of non-African developing countries (e.g. China and India) in SADC merchandise trade should, hopefully, help cushion (albeit not expected to offset) lingering nega-tive effects from the global financial and economic crises in advanced markets.

7 Economic Report on Southern Africa 2011
Box 1: The China Factor
China’s rapidly growing interest in Southern Africa is evidenced by an impressive growth in exports to and imports from
China. China has also assumed a key role as a source of debt relief providing concessional and near conditionality-free
financing to governments, export credits, infrastructure assistance and FDI inflows. China has articulated specific policy
for engagement with Africa and Chinese FDI is driven significantly by active government policy. Angola, South Africa and
Zambia are by far China’s biggest partners in SADC but China also has large investments in Tanzania, Mauritius and
Mozambique. There is no question that host countries in SADC are receiving quantitative returns from Chinese engage-
ment, although it is difficult to generalise across countries and sectors or estimate a net outcome for the sub region and
individual countries. The gains for commodity exporters are obvious and Chinese FDI flows are spreading to many more
sectors (apparel, agro-processing, financing, power generation, road construction, tourism and telecommunications)
thus expanding the pool of countries that stand to benefit. Moreover, imports from China increasingly include cheap and
appropriate capital goods that can enhance the competitiveness of domestic industries and exports to China increasingly
include semi-processed commodities. Significant and potentially sustained opportunities lie in China’s rapidly modernising
industries and burgeoning middle class, which offer a growing market for SADC light manufactured products, household
consumer goods, processed foods, back-office services and tourism. Most importantly, some of these industries present
a pivotal opportunity as they are less sensitive to the boom and bust of business cycles and experience fairly constant
demand (e.g. agribusiness). So far, only South Africa has major investments in China. With China officially confirmed as
the second-largest economy in the world in 2011 and analysts predicting that it will replace the USA as the world’s top
economy in about a decade, the critical question for the sub region is how to leverage China’s ascendancy to grow,
strengthen and diversify SADC economies without generating imbalances and distortions that could hamper develop-
ment and regionalisation.
Much of China’s trade and investments in the sub region are concentrated in a few countries and favour the extractive
sector, thus reinforcing existing imbalances between SADC economies and threatening regional integration. In most
cases, project operation and all inputs (management, project design, labour, materials, components and technology)
originate from China. There is little or no room for local content, incorporation of local enterprises into global value chains
and trade in intermediate goods. Questions arise about the jobless nature of Chinese investment, the limited possibili-
ties of skills and technology transfer, the crowding out of small and large domestic enterprises (both in the domestic
consumer sector and government procurement) and the possible emergence of Chinese monopolies with a myriad of
attendant competition issues down the line. Similarly, China’s leveraging of state resources (both in terms of state backing
and entry of large state-owned enterprises) to implement commercial policy raises competition and unfair trade issues.
Chinese companies’ far from stellar track record on health, safety and environmental standards is a source of growing
disquiet. The quality and safety of Chinese imports and their potential to discourage diversification of the productive base
of importing countries has also been questioned. So is the political influence China potentially wields as the only non-
African investor in the COMESA PTA Bank and as a member of the African Development Bank (AfDB). All in all, the risk of
repeating patterns of traditional indebtedness and dependency remain, albeit with a new partner and of a different style.

8 Economic Report on Southern Africa 2011 Status and Prospects for Economic Diversification in Southern Africa
I.2. Recent macroeconomic performance and prospects for 2011
I.2.1. GDP Growth
Prior to the onset of the global economic crisis, Southern Africa was on an upswing reaching a high of 7 per cent GDP growth in 2007. Growth fell from a 3 year average of 6 per cent in 2008 to -1 per cent in 2009. The sectors most affected by the crisis were mining, tourism, textiles and other manufacturing. Of the five sub regions of Africa, Southern Africa was the hardest hit (see figure 3). Southern Africa is estimated to have posted moderate growth in 2010 as the global economy began to recover buoyed by sustained levels of consumer demand in emerging economies. Growth in the sub region is mainly attributed to macroeconomic policy measures aimed at cushioning domestic economies, investment inflows and high commodity prices, particularly for oil and minerals. Assuming continued favourable demand patterns in trading partner economies and bullish commodity prices, current trends in growth in the sub region are likely to continue in 2011. Southern Africa is thus projected to maintain a faster rate of growth than most other sub regions in Africa. However, the reliance of the sub region on commodity export-led growth is a source of concern because the extractive sector tends to be capital intensive. With a growing population and high levels of unemployment generally (and particularly among the school leaving (youth), the issue of putting the sub region on a job-creating growth path is paramount. Member States are urged to focus on broad-based job creation policies and strategies to address unemployment and poverty in the sub region.
As the crisis dissipates, there is need to reflect on strategies for consolidating gains in sectors that perform consistently better and on future reforms in sectors that were particularly vulnerable. Natural resource investments were especially vulnerable. There is a need to strategically invest and allocate resource rents accumulated during boom years.
Virtually all countries in the sub region suffered an economic slowdown in 2008 - 2009. Resource rich countries were particularly vulnerable as revenues from mineral and other export products tumbled in the face of contracting world demand. Year-on-year GDP growth losses ranged from 13 per cent for Angola in 2009, 7 per cent for Botswana, Madagascar, and Seychelles to 6 per cent for South Africa (see table 1). Smaller economies e.g. Malawi, Swaziland and Tanzania were relatively immune from the crisis due to internal social spending measures and relatively smaller financial markets. It is projected that by 2011 all countries in the sub region will be on the road to recovery with at least 3 countries (Angola, DR Congo and Mozambique) expected to achieve the SADC target of at least 7 per cent annual GDP growth.
Individual country performance varied across the sub region. For example, despite growth in construc-tion and tourism leading up to the 2010 FIFA World Cup, South Africa experienced negative growth in 2009. Manufacturing production volumes had declined at a year-on-year rate of 4.4 per cent in November 2008 due to a reduction in the utilization of production capacity. Local demand contracted drastically as household final consumption plummeted from 63.5 per cent in the second quarter of 2007 to the lowest ever level since 2005 of 59.6 per cent by second quarter of 2010. However, the economy has recovered posting estimated growth of about 3 per cent in 2010 and projected to post further growth in 2011 — particularly if household final demand picks up.

9 Economic Report on Southern Africa 2011
Botswana is the only country to have met the SADC target of GDP growth in 2010. The country employed a number of countercyclical measures as the global recession deepened in 2009, including easing fiscal and monetary policies, to cushion the impact of difficulties in the mining sector on the rest of the economy. As a result, the non-mining sector grew by 6.1 per cent in 2009. The outlook for 2011 is conservative as government revenues are set to become more constrained with the projected decline in mineral revenues and customs and excise receipts.
Figure 3: Real GDP growth by sub region (%)
-2
-1
01
23
4
5
6
7
8
9
2005 2006
North Africa
Real GDP growth by sub region (%)
West Africa
Central Africa
East Africa
Southern Africa
2007 2008 2009 2010
Source: International Monetary Fund World Economic Outlook Database
Note: Excludes Seychelles, DRC and Tanzania.
Seychelles has been battling a severe debt crisis brought on by a combination of domestic policy factors since the second half of 2008. The result was low GDP growth, losses in government revenue and weakened external balances. The onset of the global economic crisis worsened the situation of severe balance of pay-ments difficulties and public debt crisis as tourism declined, decimating the services sector which accounts for more than 70 per cent of GDP. The country instituted IMF supported reforms and is estimated to have posted a moderate rate of growth (4 %) in 2010. Seychelles is expected to continue on a positive growth path if global economic conditions remain favourable and macroeconomic policy reforms bear fruit.
I.2.2. Sector performance and contribution to GDP
The services sector (mainly tourism related) remains the main contributor to GDP (46 %) in the sub region followed by industry (33 %) and agriculture (15 %). Manufacturing contributes about 9 per cent to GDP in the sub region. Country specific differences in sectoral contribution to GDP are indicative of natural resource endowments relating to extraction or tourism. For instance, Angola and Botswana are heavily reliant on mining output (industry), contributing as much as 67 per cent and 48 per cent, respectively to

10 Economic Report on Southern Africa 2011 Status and Prospects for Economic Diversification in Southern Africa
GDP. Higher oil prices helped to strengthen Angola’s fiscal position in 2010, which coupled with expenditure restraint, stabilized growth and assured positive projections for 2011 (IMF, 2010).
Table 1: Real GDP growth by country (%)
Country 2005 2006 2007 2008 2009 2010 2011
Angola 20.6 18.6 20.3 13.3 0.7 5.9 7.1
Botswana 1.6 5.1 4.8 3.1 -3.7 8.4 4.8
DR Congo 7.8 5.6 6.3 6.2 2.8 5.4 7.0
Lesotho 1.1 6.5 2.4 4.5 0.9 5.6 3.8
Madagascar 4.6 5.0 6.2 7.1 -3.7 -2.0 2.8
Malawi 2.6 7.7 5.8 8.8 7.5 6.0 6.2
Mauritius 1.5 3.9 5.4 5.0 2.5 3.6 4.1
Mozambique 8.7 6.3 7.3 6.7 6.3 6.5 7.5
Namibia 2.5 7.1 5.4 4.3 -0.8 4.4 4.8
Seychelles 7.5 8.3 19.7 -1.3 0.7 4.0 5.0
South Africa 5.3 5.6 5.5 3.7 -1.8 3.0 3.5
Swaziland 2.2 2.9 3.5 2.4 1.2 2.0 2.5
Tanzania 7.4 6.7 7.1 7.4 6.0 6.5 6.7
Zambia 5.3 6.2 6.2 5.7 6.3 6.6 6.4
Zimbabwe -3.7 -3.7 -18.9 5.7 5.9 4.5
Source: International Monetary Fund, World Economic Outlook Database, October 2010
Note: Shaded figures show achievement of SADC target of 7 per cent annual GDP growth
Available data suggests that the global economic crisis did not result in structural changes to sectoral con-tributions to GDP in the sub region. Tourism remains the leading contributor to GDP in Seychelles, Mau-ritius, Namibia and Madagascar. The rest of the sub region’s economies are either driven by agriculture or industry (mining and manufacturing). Manufacturing is closely linked with the leading sector (agriculture and extractive sectors) in most SADC members denoting limited diversification within these economies.
However, other non-crises related shifts in economic activity took place in Angola and DRC in 2009 as a result of investments in the services sector over the last five years. Zambia also experienced a boost in in-dustry in 2009 as foreign investors became increasingly bullish over mining prospects and tourism slowed due to the global economic crisis.

11 Economic Report on Southern Africa 2011
Figures 4: Value added by economic activity in the SADC countries
Final consumption expenditureGross �xed capital formation
Net Exports
Distribution of Expenditure (%GDP)
150
100
50
0
-50
-100
Ang
ola
Bots
wan
a
DR
C
Leso
tho
Mad
agas
car
Mal
awi
Mau
ritiu
s
Moz
ambi
que
Nam
ibia
Seyc
helle
s
Sout
h A
fric
a
Sub
regi
on*
Source: World Bank World Development Indicators and Global Development Indicators Database.
I.2.3. Main drivers and constraints for economic performance in Southern African
While natural resource sectors continue to receive increasingly attention from foreign investors in the sub region, it is the services sector through tourism that is driving economic growth via its impact on employ-ment and its capacity to generate foreign earnings.
It is thus important that even as investments are being made in natural resources sector, strategies are put in place to expand the productive base and ensure maximum utilisation of the productive potential of national labour forces. In this context, a number of factors must be considered holistically to encourage increased investment flows to the sub region, including getting macroeconomic fundamentals right. It is also important to enhance sub regional infrastructure development to facilitate regional integration and trade and thereby lower transaction costs. Investors are also particularly wary of the shortage of suitably skilled labour — which acts as a brake on investments in other sectors, particularly manufacturing. It is crucial that investment in science, technology and innovative capabilities are stepped up in addition to simplifying the investment regulatory framework and promoting domestic and foreign investment in industrial sectors.
I.2.4. Consumption and investment
Final consumption is very high in the sub region, particularly for Lesotho, Mozambique, Seychelles and Swaziland.

12 Economic Report on Southern Africa 2011 Status and Prospects for Economic Diversification in Southern Africa
Overall, expenditure on final consumption in the sub region accounted for 84-90 per cent of GDP between 2007 and 2009 indicating that domestic savings are low. Low domestic savings rates are cause for concern because they equate to low domestic resource mobilization for productive investments. Seychelles and Mozambique have the lowest saving rates at 2.3 per cent and 6.5 per cent of GDP, respectively. Not all the consumption expenditure is due to households as some economies in the sub region have quite a large public sector relative to domestic output. For instance, Lesotho recorded the largest share of government in final consumption expenditure for the period 2007-2009 (see figure 3) at 44.3 per cent while Madagas-car recorded the lowest share at 4.5 per cent of GDP. Domestic savings are also important for achieving sustainable levels of government investment spending, particularly on infrastructure (roads, water and energy). A number of countries in the sub region need to mobilise domestic savings to achieve sustainable fiscal balances. Lesotho’s share of imports in final consumption expenditure is also quite high given that imports account for more than 110 per cent of GDP. The same applies for Seychelles, whose imports are even higher at 130 per cent of GDP.
Figure 5: Distribution of Expenditure (%GDP)
Final consumption expenditureGross �xed capital formation
Net Exports
Distribution of Expenditure (%GDP)
150
100
50
0
-50
-100
Ang
ola
Bots
wan
a
DR
C
Leso
tho
Mad
agas
car
Mal
awi
Mau
ritiu
s
Moz
ambi
que
Nam
ibia
Seyc
helle
s
Sout
h A
fric
a
Sub
regi
on*
Source: World Bank, World Development Indicators and Global Development Indicators Database. *Sub regional average excludes Zimbabwe and Tanzania.
According to World Bank data, the best performers in mobilizing domestic savings (i.e. >30 % of GDP) are Lesotho, Botswana and Namibia. These countries also reflect significant fixed investments (>25 % of GDP) as it is less costly for investors to raise capital from domestic resources given large domestic savings.
I.2.5. Inflation
The global financial and economic crises have had profound impacts on inflation, interest and exchange rate management in the sub region. Inflation pressures mounted in 2008 with the regional average hovering around 9 per cent. The post crisis period, however, shows a downward trend in most member States. The overall lower inflation rates follow a period of double-digit inflation in many countries in the sub region

13 Economic Report on Southern Africa 2011
that significantly reduced real incomes in previous years and led to an increased incidence of poverty. Worth noting is the South African economy, which by its sheer size exerts a lot of influence on the rest of the sub region, where strong capital inflows strengthened the rand and kept inflation in check in the Rand Monetary Area (Lesotho, Namibia and Swaziland) in 2010. The appreciation of the rand also kept a lid on the price of imported goods, including fuel. However, the rand weakened at the start of 2011 and interna-tional food prices have risen dramatically across a broad category of items since mid-2010. Nevertheless, it is expected that the post-recession economic recovery will be sustainable even as inflation is likely to be rising and eating into real disposable incomes. Higher energy prices will be an additional source of inflationary pressure in Southern Africa’s oil importing countries.
Apart from Angola, DR Congo, Seychelles and Tanzania, which had double-digit inflation, the rest of SADC Member States registered steady progress towards achieving the regional target of single-digit inflation in 2009. Available estimates for 2010 for a limited group of SADC countries (see figure 6) suggest that a number of countries will post single digit inflation on the back of falling commodity demand in interna-tional markets, with Seychelles being an outlier at -2.4 per cent and Angola and DR Congo maintaining double-digit inflation.
Figure 6: Annual Inflation for selected SADC Countries
2009
2010 Est.
2011 Proj.
Annual In�ation for selected SADC Countries
50
40
3020
10
0
Ang
ola
DR
C C
ongo
-10
-20 Mad
agas
car
Mau
ritiu
s
Nam
ibia
Sout
h A
fric
a
Tanz
ania
Zim
babw
e
Source: AfDB World Economic Outlook 2010
It is now generally recognised that there are trade-offs between inflation management and the genuine need to increase public spending for infrastructure development and attaining the MDGs. Critical invest-ments in social sectors such as education, health, water and sanitation, and productive infrastructure can push up inflation. Such a scenario might be unavoidable in the case of countries like Angola, DR Congo, Mozambique and Zimbabwe, which currently have an acute deficit in infrastructure and might have to make heavy investments in order to spur economic growth. Hence, member States should harmonise their positions on government expenditure with a view to ensuring that emphasis is placed on the quality rather than the quantity of spending. Consequently and notwithstanding the SADC single-digit target on infla-tion, marginal inflation could be viewed positively if it does not hurt economic growth.

14 Economic Report on Southern Africa 2011 Status and Prospects for Economic Diversification in Southern Africa
I.2.6. Tracking the SADC debt sustainability target
Most countries in the sub region have external debt stocks within the SADC target of debt to GDP ratio of 60 per cent. Malawi, Mozambique and Tanzania fell short of the target in 2005 but have remained within target since 2006.
Apart from Angola and Zambia, which were coming from very large debt service ratios exceeding the en-hanced HIPC top range of 15 per cent before 2003 and 2005, respectively, the majority of SADC members have maintained their debt service ratios below 10 per cent of GDP between 2003 and 2008. Seychelles faced a very high liquidity burden, particularly after 2005, compared to other countries in the sub region. Liquidity constraints have generally been declining especially during 2006 - 2008 as exports from the sub region performed better in the wake of high global commodity prices, although some countries faced ris-ing debt service ratios with the general contraction in global trade.
Ability to raise domestic resources to service debt has remained a challenge in the sub region, particularly for Seychelles and Mauritius. Expanding the tax base within the broader framework of mobilizing domestic resources for development is required. In terms of solvency conditions, all countries in the sub region have a present value of external debt in the range of 0 to 0.6 per cent of current exports. However, solvency problems suffered by Seychelles and emerging resource allocation problems in Democratic Republic of Congo (DRC) are increasingly a major concern. The DRC reached completion point under the HIPC initiative in June 2010, which will go some way to ease debt service pressures on the national budget but this achievement needs to be complemented by enhanced efforts to improve the climate for private investment and increase the capacity of the Government to collect tax revenue from the natural resource sector.
I.2.7. Debt
Between 2007 and 2009, debt forgiveness or reduction figures for the countries concerned in the sub region (see table 2) declined to less than US$1 billion as the OECD Development Assistance Committee (DAC) and other creditors grappled with the uncertainty brought on by the global economic crisis. Debt reduc-tion grants are increasingly being used to provide relief and avert possible debt overhang in the short to medium term. Between 2007 and 2008, Tanzania was among the main recipients of debt reduction grants. Some countries, notably Zambia, were able to channel more resources towards improvements in social sectors through benefiting from debt reduction.
Much progress has been achieved in repositioning debt management strategies with all HIPC countries in the sub region having now reached completion points. HIPC funds are being used to support health, education, social protection, infrastructure, natural resources, institutional capacity building and rural

15 Economic Report on Southern Africa 2011
development. Expenditure on safety nets and democratic institutional reinforcement has also been a major feature of agreed reallocation schemes.
Table 2: HIPC Progress (US$ Million) 2005-2009
Country Decision Completion Total grants * Total debt reduction*
DR Congo 07/2003 06/2010 1,250 325
Madagascar 12/2000 10/2004 2,990 2,710
Malawi 12/2000 09/2006 2,590 2,620
Mozambique 04/2000 09/2001 1,850 1,980
Tanzania 04/2000 11/2001 4,880 5,250
Zambia 12/2000 04/2005 5,100 5,230
Source: IMF and World Bank HIPC Country Reports; * World Bank GDI Database
It is important for SADC to assess the risk of member States engaging in new forms of unsustainable debt through, for example, the “infrastructure for natural resources” arrangements with China and to enhance sub regional capacity for external debt management with a clear focus on sustainability and transparency. Member States should adopt prudent debt management strategies, including undertaking necessary regula-tory reforms where applicable. Such initiatives should also ensure that the benefits of HIPC and other debt relief initiatives are harnessed to speed up poverty reduction and enhance human and social development.
I.2.8. FDI trends and related policy issues
Net foreign direct investment inflows to the sub region have generally been on the increase since 2005 following a more positive climate for investments and a surge in commodity prices. FDI inflows topped US$18.4 billion in 2008. Most of the investments were in natural resources, particularly oil and minerals. The global economic crisis dampened prospects only slightly with net inflows dipping to US$13.7 billion in 2009.
Figure 7: FDI net inflows in millions of US Dollars (2005-2009)
FDI net in�ows in million US Dollars (2005-2009)
DRC Congo
Zambia
Madagascar
Other SADC countries
South Africa
27,300
13,760
3,650
3,930
4,740
Source: World Bank, Global Development Indicators

16 Economic Report on Southern Africa 2011 Status and Prospects for Economic Diversification in Southern Africa
South Africa remains the main destination; attracting 48 per cent of total investment inflows into the sub region during 2007 - 2009 (see figure 7). DRC (10 %), Angola (7 %), Madagascar (7 %) and Zambia (7 %) are the other top destinations for mining, oil and tourism investments. Foreign direct investment inflows to the rest of SADC is very low (<US$0.5bn annually) because investors perceive smaller economies as offer-ing insignificant market shares, unskilled labour and supply and capacity problems. Accelerating regional integration should help make these smaller economies more attractive to foreign investors.
I.2.9. Fiscal balance and Public Finance
Fiscal balances generally deteriorated for the majority of SADC member States in 2009. The worsened fis-cal position across SADC countries was due to a combination of factors — some of which are transient or directly related to policy responses to the global economic crises, while others are more structural in nature. Infrastructure development and social investments continued to be the main focus of public expenditure in 2009. Countercyclical fiscal policies adopted by a number of SADC countries (e.g. Namibia, South Africa, and Swaziland) worsened fiscal balances as did social sector spending towards MDG target attainment and country-specific developmental priorities. For example, public expenditure in South Africa was only 25% of GDP at the onset of the crisis in 2007 but rose to about 30% during the first and fourth quarters of 2009.
Underlying public sector structural issues in some countries, such as Swaziland (where the wage bill ac-counts for 51 per cent of recurrent expenditure), pose a threat to the medium-term health of the fiscus, particularly in the context of priority infrastructure projects and the implementation of social programmes such as free primary education. Similarly, SACU receipts, which are an important single source of fiscal revenue for Botswana, Lesotho and Swaziland, fell significantly in 2009. SACU receipts are estimated to have been lower in 2010 and are likely to shrink further in subsequent years.
Revenue collection was below target in a number of countries, (e.g. Zambia, South Africa, and Madagascar). In South Africa, revenue collection fell by 7.3 per cent. In the case of the Democratic Republic of Congo, delays in the disbursement of aid support shrunk the fiscal purse. On a positive note, some countries are making progress in diversifying sources of tax revenue. For example, Mozambique recorded increased revenue collection as a result of measures taken to enlarge the national tax base and Botswana recorded a growth in revenue from non-mineral taxes.

17 Economic Report on Southern Africa 2011
Figure 8: Evolution of Current Account Balance (%GDP)Evolution of Current Account Balances (% GDP)
30
20
10
-10
-20
0
30
-40
-50
2008
2009
2010
Ang
ola
DR
C
Bots
wan
a
Leso
tho
Mad
agas
car
Mal
awi
Mau
ritiu
s
Moz
ambi
que
Nam
ibia
Seyc
helle
s
Sout
h A
fric
a
Swaz
iland
Tanz
ania
Zam
bia
Source: Data from AfDB African Statistical Yearbook 2009 and 2010.
Conditions varied across the sub region in 2010 with some countries looking to continue expansionary fiscal policies (e.g. Zambia, South Africa) while others tighten fiscal policy with the intention of putting public finances on a more sustainable footing (e.g. Botswana, Swaziland) following the upheavals in 2008-2009. Among the strategies aimed at maintaining sustainable fiscal balances employed by various countries in 2010 were the simplification of domestic taxation systems (e.g. Botswana and South Africa), tightening of tax administration, introduction of new or raising various existing indirect taxes, including reviewing excise taxes. Enhancing transparency and strengthening public procurement rules, including through enforcing competition and anti-corruption initiatives, would be a complementary strategy that could deliver cost savings that SADC member States are encouraged to also pursue.
I.2.10. Trade, External Balance and Exchange Rates
Following strong growth in 2008, overall SADC merchandise exports suffered a steep decline in 2009 as a result of the effects of the global financial and economic crises, despite recovery in global trade in the latter half of the year.
Services exports, which are a fraction of SADC external trade, showed more resilience, although also weakening. Similar trends were observed with regard to SADC merchandise and services imports. Nota-bly, the contraction in overall merchandise and services exports was more extreme than that of imports and was globally synchronous. For example, while the value of merchandise imports decreased by 11 per cent, that of exports decreased by 30.2 per cent in Mozambique. The severe dip in merchandise exports is glaringly evident in the full swing of the pendulum from the strong growth rates witnessed in 2007-2008 to the negative highs recorded in 2009 (see figure 9).

18 Economic Report on Southern Africa 2011 Status and Prospects for Economic Diversification in Southern Africa
Table 3: Annual Average Growth in SADC Merchandise Trade
Category 2007 2008 2009
Merchandise Exports 20.5 26.8 -29.0
Merchandise Imports 15.6 16.5 -18.8
Source: UNCTAD Handbook of Statistics 2010
The sub region’s reversal of fortune is mainly rooted in the structure and direction of SADC trade. SADC exports continue to be dominated by primary products, their manufactured derivatives and other low-technology manufactures (e.g. textiles) with low income elasticity of demand (imports, on the other hand, tend to be manufactures). Dependence on primary exports also exposes SADC countries to the negative effects of global commodity price volatility. Commodity price volatility was responsible for steep losses in the value of commodity exports in the early months of 2009. Advanced economies, which are SADC’s traditional and major export destination, experienced sharp slumps in production output and demand for raw materials and commodities from developing countries.
Countries exporting primary products are estimated to have suffered at least 20 per cent more than other countries that export manufactures. For example, the DRC reported that net exports as a share of GDP growth fell from 3.7 to 0.1 per cent between 2008 and 2009, with the mining sector accounting for most of the decline — likewise, Namibia’s primary sector contracted by 25.7 per cent. Similarly, Lesotho’s dia-mond mining industry saw annual production measured in carats, plummet by 80.7 per cent. Footwear and clothing industries were also affected by low consumer demand in the United States.
Madagascar plunged into economic crisis, registering negative growth, a number of garment factories were closed and the food products sub-sector experienced negative growth. In contrast, South Africa, which is the most industrialized member of SADC, experienced an increase in manufactured exports in line with the recovery of global demand in the second half of 2009. The economic recovery is most pronounced in Asia. Emerging markets are gaining an increasing share (see figure 9) of SADC trade and their accelerated recovery spurred primary commodity exports in the latter half of the year benefiting countries such as Zambia (owing to a surge in copper prices).
The fall in imports was too small to offset the collapse in exports, contributing to an overall weakened sub regional external balance position. The crises also resulted in lower tourism revenues, remittances and foreign direct investment. At least seven members of SADC could not achieve or stay within the -9 per cent limit agreed by SADC members for current account deficits as a percentage of GDP. Marginal to significantly improved current account balances are forecast for about half of the SADC membership in 2010, however, many countries will likely still not be in compliance with the agreed SADC benchmark.

19 Economic Report on Southern Africa 2011
Figure 9: 2009 Shar eof Intra-SADC Exports as Proportion of Total Exports (*%)2009 Share of Intra-SADC Exports as Proportion of Total Exports (*%)
Intra-SADC
South Africa
China
India
EDC
United Kingdom
United States
Source: IMF Direction of Trade Statistics database. *Excludes SACU members Botswana, Lesotho, Namibia and Swaziland.
The SADC share of global trade hovers stubbornly around the 1 per cent mark. 2009 recorded some slippage in the SADC share in global trade at 1.09 and 1.07 per cent of world merchandise exports and imports, respectively. The share of intra-SADC trade remained relatively steady at around 10 per cent of total sub regional exports to the world. The patterns and composition of intra-SADC trade are also mostly unchanged, with the sub region’s most industrialized economy (South Africa) maintaining a trade surplus with the majority of its SADC trade partners despite the coming into existence of the SADC FTA in August 2008. Intra-SACU trade also accounts for a significant proportion of intra-SADC trade. In 2009, 20.9 per cent of intra-SADC exports were destined for South Africa compared to 15.9 and 29.5 per cent in 2007 and 2008 respectively, whereas 59 per cent of intra-SADC imports originated from South Africa compared to 56.5 and 56.8 per cent in 2007 and 2008 respectively.
Missing complementarities in intra-regional trade, restrictive rules of origin, inefficiencies in transport, customs and logistics (i.e. high transaction costs), poorly-designed technical regulations and standards, and supply-side constraints coupled with an over reliance on import revenues for a significant number of SADC Member States are among the enduring challenges to deeper regionalisation. Efforts to reduce tariffs have been largely successful, however, non-tariff barriers (NTBs) have been found to have a widespread effect on SADC new and existing trade. NTBs that have been reported (e.g. restrictive product standards or complex rules of origin) are estimated to affect one fifth of sub regional exports. Sluggish progress on the harmonization of policies, regulatory frameworks and standards compromised the timeline for the establishment of the SADC Customs Union in 2010.
The strong cyclical rebound in external demand and stronger commodity prices from the second half of 2009 bodes well for SADC export figures and current account balances in 2010. Nonetheless, of major concern are indications that the recovery in European and North American markets will likely remain weak for some time with some analysts forecasting up to 7 years for trade to regain pre-crises levels and trends in those markets.

20 Economic Report on Southern Africa 2011 Status and Prospects for Economic Diversification in Southern Africa
Figure 10: Composition of SADC Members’ exports 2008-2009

21 Economic Report on Southern Africa 2011
Box 2: The Same Old Story
SADC trade with the rest of the world shows a high dependence on primary commodity exports and for
most SADC economies is skewed towards the US and a small group of large European economies. This
pattern of trade has changed little in the last two decades. The direction, composition and concentration
of intra-SADC trade mirror the intractable situation at the global level. The lowering of SADC trade tariffs
has is yet to foster the transformation of the structure of SADC economies delivering little by way of sub
regional value chains or vertical specialization.
For countries having similar economic structures and technological capability, industrial differentiation
is the key to broadening the scope for intra-industry trade. National industrial policies must support this
process and the coordination and harmonisation of such policies will be necessary at the SADC level.
Exports and imports from emerging developing countries have been growing at a staggering rate in recent
years, however, the current pattern of trade with emerging markets is worrying in that it replicates the
existing pattern of trade with developed countries; it is concentrated in primary commodity exports while
imports tend to be manufactures. Trade with emerging economies thereby further entrenches commodity
dependence and vulnerability to external shocks. This is a concern even for South Africa, which experi-
enced a surge of almost 20 per cent in raw material and intermediate exports at the start of 2010 — raw
materials and intermediate goods accounted for 39.3 per cent and 35.2 per cent of the overall export
basket in the first 6 months of 2010.
Neither do prospects for structural transformation appear to improve much with trade initiatives such as
AGOA — an analysis of trade data by product sector reveals a very narrow distribution of exports into the
US. It is clearly going to take a lot more than racking up regional trade agreements to deliver the diversifica-
tion of the SADC productive base. Formal regional arrangements do not guarantee the spread of industrial
activity across neighbouring economies and trade liberalisation alone will not trigger a regional dynamic.
Source: UNCTAD Handbook of Statistics 2010
The impact of the global economic crisis and the existing patterns of extra- and intra-SADC trade un-derline the urgency for SADC to redouble efforts aimed at achieving the objective of harnessing regional integration to reinforce industrial development. Extensive work is still required by SADC member States to remove tariff and non-tariff barriers to trade and achieve harmonization targets. The lack of up-to-date, credible and comparable trade statistics continues to be a critical challenge that not only hamstrings SADC policy and strategy development (and their prioritization and evaluation) but also hampers strate-gic engagement by SADC at the multilateral level (e.gWTO) or with other regional economic groupings (e.g.ACP-EU economic partnership agreements) and no doubt complicates the identification of regional responses to economic crises.

22 Economic Report on Southern Africa 2011 Status and Prospects for Economic Diversification in Southern Africa
I.3 Recent developments in Social Conditions
The impact of the global economic crisis on social conditions and the general poverty situation in Southern Africa may never be fully measured. It can be deduced that the losses in jobs and fiscal revenue will have increased the incidence of poverty and constrained the delivery of social services and the attainment of the MDG goals, both in terms of quality and quantity. Nearly all Southern African countries reported job losses and a decline in migrant remittances. Similarly, past and current increases in food and energy prices severely affect the majority poor, especially in the face of shrinking incomes.
Overall attainment of MDG targets in the period preceding the financial and economic crises was mixed, mainly because of the varying levels of socio-economic development pertaining in individual countries in the sub region. Poverty levels remain generally high and food security and nutrition for a large proportion of households hangs in the balance.
Climate change is also a concern as the majority of rural and urban poor have limited capacity and re-sources to adapt to and mitigate the effects of the environmental impacts. Some of the visible effects of climate change in the sub region are increased flooding, particularly in low-lying coastal areas, increased water scarcity due to recurrent and prolonged droughts, and a general loss of biological resources, includ-ing a general decline in agricultural yields and aquatic resources. It is predicted that yields from rain-fed agriculture in Africa could have been reduced by as much as 50 per cent by 2020 thereby worsening an already compromised food security situation.
I.3.1. Human Development
The 2010 UNDP Human Development Report shows that with the exception of Mauritius and Botswana (ranking 72nd and 98th respectively), Southern African countries do not feature in the group of top 100 countries of the global Human Development Index (HDI). Zimbabwe ranks the lowest at 169th in the world. Whilst some countries have made steady progress over the past 40 years, three countries in the region i.e. DRC, Zimbabwe and Zambia scored lower in 2010 than they did in 1970. Despite low human development attainment, the sub region records progress in key areas such as net primary school enrolment, gender parity in primary education, the political empowerment of women, access to safe drinking water and stemming the spread of HIV and AIDS.
I.3.2. Education and Training
Access to education and performance at both primary and secondary levels vary widely across the sub region. For example, the Seychelles had a net secondary enrolment rate of 94 per cent in 2007 while the net secondary enrolment rate for Mozambique was 3 per cent. On average, the rates of primary school enrol-ment are high and most Member States have attained or are likely to attain universal primary education by the target date. The average net primary school enrolment rate in Southern Africa has increased from 71 per cent in 2006 to 74 per cent in 2007. Improvements in primary enrolment rates were driven largely by a combination of government spending that has expanded primary education facilities and eliminated school fees. For instance, DRC, Lesotho, Malawi, Mozambique, Swaziland and Tanzania have all recently introduced free primary education.
23 Economic Report on Southern Africa 2011
Furthermore, with the exception of DRC and Swaziland, member States are on track to achieve gender parity in primary education by 2015. However, more than half of the countries are at risk of not achieving gender parity in secondary education by the same target date.
Notwithstanding these successes, increased enrolments have raised other quality-related challenges such as shortages of qualified teachers, school books, computers, sanitation and water. In addition, primary completion rates are an area of concern, particularly among girls. The major reasons for high school drop-outs rates include insufficient resources, domestic care activities within households, early marriages, child labour, teenage pregnancies and long distances to school. There is need to focus on issues of quality of secondary and tertiary education as this has serious implications for the sub region’s competitiveness in the light of an increasingly knowledge-based global economy. Accordingly, SADC Ministers of Education recognised the need to address issues of equity in education by putting in place responsive frameworks and policies that can effectively address identified challenges in the sector at their most recent meeting held in Kinshasa in March 2010.
Figure 11: Human Development IndexHuman Development Index
0.80.70.60.50.40.30.2
1980
1990
2000
20100.1
0
Ang
ola
DR
Con
go
Bots
wan
a
Leso
tho
Mad
agas
car
Mal
awi
Mau
ritiu
s
Moz
ambi
que
Nam
ibia
Sout
h A
fric
a
Swaz
iland
Tanz
ania
Zam
bia
Zim
babw
e
Source: UNDP Human Development Reports 2010 table 2.
I.3.3. Gender and Development
Notwithstanding progress in all SADC member States putting in place institutional mechanisms to strengthen policy, legislation, monitoring and evaluation, as well as national plans of action to advance gender equal-ity and women’s empowerment, gender equality remains a challenge in Southern Africa. Confined to a socio-legal minority status which restricts them from gaining full access to and control over productive resources, women suffer disproportionately from systemic poverty and the impact of HIV and AIDS.
By 2010, only Namibia, Tanzania and Zimbabwe had ratified the Gender and Development Protocol while Botswana and Mauritius are the only two member States that have not acceded to the Protocol. Despite this, member States with support from the SADC Secretariat are putting in place operational, monitoring and

24 Economic Report on Southern Africa 2011 Status and Prospects for Economic Diversification in Southern Africa
evaluation mechanisms to track progress made in advancing gender equality and women’s empowerment. Among the hurdles remaining is the mainstreaming of gender into critical areas such as national budgets. Further challenges lie in generating and effectively using gender disaggregated data for monitoring and evaluating policy implementation.
The sub region is making progress towards (Southern Africa has recorded a greater increase in the number of women in decision-making positions than any other sub region of the world since the 1995) attaining parity in representation of women in all spheres of power and decision-making although none of the mmember States has to date reached the 50 per cent bench mark set by the AU. Some countries are lag-ging behind with percentages that are far below the minimum 50 per cent AU threshold (Malawi; 14 %, Zambia; 18 %, Seychelles; 23 %, Namibia; 26.9 % and Lesotho; 25 %). The top performers in 2010 in the sub region were Angola (37 %), Mozambique (34.8 %), South Africa (33 %) and Tanzania (30.4 %). Compared to Republic of Rwanda’s 56.3 per cent, much work has still to be done to catch up with African peers. The average representation of women at parliamentary level in SADC stands at 20 per cent in 2010. Notable examples are Namibia, Malawi and Zimbabwe, which have women deputy presidents and Mozambique that has a female Prime Minister. In Lesotho and Namibia gender parity at local government level stands at 58 and 42 per cent, respectively.
Achieving sustainable levels of gender equality in Southern Africa will require member States to address a number of critical issues such as full ratification of the Gender and Development Protocol, scaling up gender mainstreaming efforts, including support for monitoring and evaluation preparedness, and strengthening capacity of national gender machineries and other national experts to collect gender disaggregated data in order to enhance the integration of gender perspectives in the development processes.
I.3.4. Population and demographic dynamics
The SADC population is estimated at 285.7 million (about 27.6 per cent of the population of Africa). In absolute terms, the sub region has experienced steady population growth; from 228 million in 2000 to 286 million in 2010. The population structure is predominantly youthful population with 40 per cent being under the age of 15 years of and 70 per cent of the total population aged 30 years and below. Planning and public expenditure must keep pace with the population growth In order to meet the needs of this rapidly growing population.
Population growth rates, as projected by the UN Population Division, vary widely ranging from a low of 0.3 per cent for Zimbabwe to a high of 2.9 per cent for Tanzania between 2005 and 2010. The variation in population growth can be attributed to the trends in mortality rates and fertility rates of respective countries. For example, Tanzania has a high but gradually declining fertility rate of 5.6. Zimbabwe, which has the highest cause-specific mortality rate due to HIV/AIDS and one of the lowest life expectancy in the region, reports a fertility rate at 3.4.
With the exception of Mauritius and Seychelles, mortality rates in the sub region are high for the age group 15-60 years. The sub region is losing much of its population in the most productive years. This trend in

25 Economic Report on Southern Africa 2011
mortality rates has negative implications for economic productivity, growth and development while also creating high dependency ratio in the region with fewer adults providing for children and the elderly.
I.3.5. Health
The global financial crisis has probably weakened the ability of SADC countries to allocate a minimum of 15 per cent of their national budgets to health as per the 2001 Abuja Declaration provisions. Six SADC member States allocated more than 10 per cent of their national budget to health in 2007.
The disease burden in the sub region has become more complex with high levels of infectious diseases such malaria, TB and HIV/AIDS and a rise of lifestyle-related non-communicable diseases afflicting especially urban populations such as obesity, high blood pressure and diabetes. The sub region needs to consolidate actions to address the challenges presented by these ailments. Over the last two decades, the majority of SADC countries have seen gradual increases in life expectancies. However, life expectancy levels in countries such as Zambia, Zimbabwe, Lesotho, Namibia, South Africa and Swaziland are lower than they were in 1990. These declines in life expectancy are largely due to the impact of HIV/AIDS and rising disease burdens.
Many SADC countries have been experiencing fluctuations in mortality indicators, including maternal and child mortality. Progress on achieving improvements in maternal mortality rates (MDG5) has been slow and the sub region is in danger of missing the target. member states would need to scale up measures for effective maternal care service provision; eliminating gender inequality and combating HIV/AIDS — all of which play a significant role in maternal mortality — in order to attain MDG5.
Figure 12: SADC Under Five Mortality (per 1000 live births)SADC Under Five Mortality (per 1000 live births)
2000-20052005-2010
250
200
150
100
50
0
Ang
ola
DR
Con
go
Bots
wan
a
Leso
tho
Mad
agas
car
Mal
awi
Mau
ritiu
s
Moz
ambi
que
Nam
ibia
Sout
h A
fric
a
Swaz
iland
Tanz
ania
Zam
bia
Zim
babw
e
Source: SADC and DSDSA (2009).

26 Economic Report on Southern Africa 2011 Status and Prospects for Economic Diversification in Southern Africa
Certain countries in the region have performed well in the last five years of making reductions in their under-five mortality rates. The best sub regional performers in under-five mortality rates between 2005 and 2010 range from 17 out of 1000 live births (Mauritius) to 94 out of 1000 live births (Zimbabwe). South Africa stands at 72 out of 1000 live births. A number of countries continue to record under-five mortality rates of 100 or above per 1000 births (see figure 12). The sub region continues to put in place a wide range of policy interventions and programmatic measures to address both infant and under-five mortality such as access to antenatal and delivery care, immunization and access to safe drinking water.
The challenges highlighted point to a need for SADC members to strengthen health systems, enhance partnerships with private health providers and adopt multi-sectoral and integrated approaches to disease control. The fiscal constraints brought on by the financial crisis pose a challenge in this regard but also underline the urgency to scale up budgetary allocations to health. Governments should continue to explore partnerships and cost-sharing arrangements with the private sector in the provision of health services wherever feasible, bearing in mind the need to assure affordable, adequately equipped and staffed health services to guarantee efficient and quality healthcare that is accessible to all.
I.3.6. HIV and AIDS
Although the prevalence and incidence of HIV and AIDS in Southern Africa remains comparatively high, the 2010 UNAIDS Global Report shows that a number of countries have experienced a reduction of more than 25 per cent in infection rates (Botswana, Malawi, Mozambique, Namibia, South Africa, Tanzania, Zambia and Zimbabwe) while in Angola, DR Congo, Lesotho and Swaziland the epidemic has stabilized. This progress is attributable to the aggressive and multi-pronged sectoral approach that SADC members have taken in combating the epidemic. HIV and AIDS remain the greatest public health and developmental challenges in SADC. The sub region has made significant progress in the implementation of the Maseru Declaration in the combating of HIV and AIDS, particularly on the prevention of mother to child trans-mission and the provision of antiretroviral treatment (ART) to infected persons. However, the region has not yet reached the UN target of universal access to ARTs.
Figure 13: HIV Prevalence Rates 2010 (ages 15-49)
3530
25
20
1510
5
0
Ang
ola
DR
Con
go
Bots
wan
a
Leso
tho
Mad
agas
car
Mal
awi
Mau
ritiu
s
Moz
ambi
que
Nam
ibia
Sout
h A
fric
a
Swaz
iland
Tanz
ania
Zam
bia
Zim
babw
e
HIV Prevalence Rates 2010 (ages 15-49)
Source: National Surveys and National AIDS Commissions/Councils

27 Economic Report on Southern Africa 2011
The risks are relatively higher for women and girls than they are for men and boys; hence, combating the epidemic demands a careful assessment of gender roles and targeted and specific interventions aimed at women and girls.
References
AfDB 2010. Africa and Global Economic Trends, Quarterly Review, Third Quarter 2010, Volume 3, issue 3, 12 October
BBC 2011. China overtakes Japan as the World’s Second Economy. http://www.bbc.co.uk/news/busi-ness-12428661, 14/02/11
Broadman, H. G. 2008. China and India Go to Africa; New Deals in the Developing World. Foreign Affairs. New York, March/ April 2008, vol. 87, Iss.2; pg. 95
Gillson, I. 2010. Deepening Regional Integration to Eliminate the Fragmented Goods Market in Southern Africa. Africa Trade Policy Notes # 9, World Bank. November 2010
IMF 2010. World Economic Outlook: Recovery, Risk, and Rebalancing, IMF Multimedia Services Division, Washington D.C., October 2010
Kaplinsky et al. 2008. China and Sub Saharan Africa: Impacts and Challenges of a Growing Relationship. SAIS Working Papers in African Studies. May 2008.
SADC and Department of Social Development of South Africa, 2009. Review of the fifteen years of the International Conference on Population and Development (ICPD) Programme of Action (POA) in the Southern African Development Community (SADC) Region, South Africa.
SADC 2010. Food Security Early Warning System, Food Security Update, Gaborone. July 2010
UNAIDS 2010. Report on the Global AIDS Epidemics, Geneva, Switzerland
UNCTAD 2010. Evolution of the international trading system and of international trade from a development perspective: the impact of the crisis-mitigation measures and prospects for recovery. TD/B/57/3. 13 July 2010
UNDP 2010. Human Development Report — 20th Anniversary Edition: The Real Wealth of Nations: Pathways to Human Development, UNDP, New York

28 Economic Report on Southern Africa 2011 Status and Prospects for Economic Diversification in Southern Africa
UNESCO 2010. Global Education Digest: Comparing Education Statistics across the World, UNESCO-UIS, Montreal, Canada
WHO 2010, World Health Statistics 2010, WHO Press, Geneva, Switzerland

29
2Status and Prospects for Economic Diversifica-tion in Southern Africa2. Introduction
2.0.1 Overview
Diversification is a term commonly used in business to mean the spreading of one’s investment across a range of financial instruments or securities such as equities, bonds or cash and non marketable invest-ments (Winfield and Curry, 1991). By not relying solely on a single financial instrument, an investor is assumed to be better protected from possible financial ruin that might be associated with the failure of one financial instrument to perform. Eco-nomic diversification is used in a similar sense. As explained by Wheeler (2008), economic diversifica-tion is the variety of different areas within which an economy operates. More generally, diversification exists when an economy is characterised by a variety of economic activities, products, sources of income or markets. On the contrary, there is no or little diversification where an economy is based on one dominant sector, a narrow range of products or an equally narrow range of export markets. Achieving economic diversification, therefore, involves build-ing an economy around a wide number of different sectors, a wide basket of exports which target many export destination markets (Zhang, 2006).
Economic diversification can, therefore, exist in dif-ferent forms or present itself in different types. The
first variation to diversification is product diversifi-cation which refers to an increase in the composition of products that are produced in the economy. This can be achieved through concentric diversification under which technologically similar new products are added to existing products (Chisnall, 1995 and Jain, 1997). Essentially concentric diversification is presented as modification to existing products. In effect the country leverages new products on its technological know-how or existing markets. Product diversification can also be achieved through horizontal diversification which entails introducing new products or services which are not technologi-cally related to current products. A simple example of horizontal diversification could be that of a farm-er growing a new crop in additional to a traditional crop. Vertical diversification is yet another level of achieving product diversification and it involves transforming goods through value addition. It refers to a process which results in the transformation of a commodity into a higher product through value addition (South Centre, 2005). Value addition of this kind is often the first stage in manufacturing process and in diversifying an economy into the production of industrial goods. For the commodity dependent countries in Southern Africa, increasing

30 Economic Report on Southern Africa 2011 Status and Prospects for Economic Diversification in Southern Africa
the range of manufactured goods, which can be exported, provides a direct way of diversifying their export structures, whilst at the same time reducing their vulnerability to the negative effects of fluctuations in world commodity prices.
The second type of economic diversification is export market diversification which is achieved by increas-ing a country’s composition of destination markets for its products or services. A country becomes more diversified if no single destination country takes up a disproportionately large share of that country’s exports. On the contrary, a country whose export market is concentrated in one or two countries is considered as lacking in market diversification. The extent to which a country’s export market is diversified is a function of having a large export product basket destined to a large number of countries (Ali, Alwang and Siegel 1991). Alternatively, it can be presented as diversification in its overseas markets. Product diversification and market diversification, however, do not necessarily go together. A country with a reasonably developed manufacturing base may still fail to gain access to many export markets. On the contrary, a country can have both a narrow range of export products and a small number of export partners. The case of Lesotho’s garment exports to the United States of America demonstrates this. It is also possible for a country such as Malawi to have tobacco as its major export but still show little concentration in its export market destinations.
The third type of diversification is sector diversification which can be inferred from the percentage con-tribution that the different sectors make towards the total GDP of a country or from how production is spread across many sectors. A more diversified economy will normally present relatively higher spread in the contribution to GDP from mining, agriculture, construction, trade, transport, etc. A typical case of poor sector diversification or sector concentration would be a country which derives, for example, close to 60% of its GDP from mining as is the case with Angola. It is important to note that horizontal diversification can be achieved within a given sector. For instance, in agriculture, greater diversification can be achieved through the production of a wider range of crops such as sugar, tobacco, groundnuts, coffee, etc. instead of one or two crops. Similarly in mining, production of different base metals, precious stones, industrial minerals, etc would represent more diversification within the sector than reliance on one or two minerals like cooper and cobalt. Sector concentration therefore, may fail to give a complete story about the diversi-fication status of a country in the absence of a decomposition of the various sectors.
The measurement of diversification itself also gives another perspective to how economic diversification can be understood. One method by which diversification can be measured involves examining the distribution of GDP across various economic sectors in order to determine the level of concentration. A concentration ratio can be calculated to measure whether a country’s economic activity is taking place predominantly in one sector by taking the sum of squares of the percentage distribution to GDP of each sector (Shediac et al., 2008). A higher ratio signifies concentration and, therefore, poor diversification. The Ogive index and the Hirschman index are examples of such measures of diversification or concentration (Hammouda et al, 2006). The inverse of the concentration ratio can also be presented as the diversification coefficient or index. Since this coefficient or index is the opposite of the concentration ratio, a higher diversification coefficient denotes that an economy is more diversified and a low measure implies poor diversification. Changes in the composition of exports present another way by which diversification can be measured.

31 Economic Report on Southern Africa 2011
By noting the inclusion of new commodities to the export portfolio of a country’s exports, a new level of export diversification can be attained.
A less direct way of measuring diversification is to infer it from an examination of the distribution of labour across sectors. Employment distribution across sectors tends to mirror the GDP distribution across the same sectors (Shediac et al, 2008). When an economy is poorly diversified, employment distribution will tend to be skewed in such a way that most people will be employed in sectors that are relatively less eco-nomically productive. The dominant sector, contributing significantly to GDP and exports, will generally employ less people than secondary sectors. But when an economy diversifies, the opposite tends to happen. Employment will reflect more balance across sectors, although may skew slightly towards the service sector.
2.0.2 A case for economic diversification
The benefits of economic diversification are varied. At one level, they manifest themselves as problems associated with the absence of diversification. High economic concentration that is characteristic of undiversified economies often leaves a country open to fluctuations in the price of the dominant export product. Consequently, national income becomes highly volatile which in turn jeopardizes long term plan-ning (Humphrey et, al., 2007 and Fairhead, 2008). Specifically, high commodity prices in the international market create the temptation for national expenditure to become profligate. When prices drop the ensuing reduction in expenditure often strips a country of its capacity to protect growth started in the boom period. Economic concentration, acts then, as the instigator of disruptive boom and bust cycles which undermine sustainable development.
The biggest problem arising from volatility in the price of the dominant commodity is that it tends to spill over into other sectors. Ultimately, several if not all sectors in the economy, begin to experience volatil-ity. This spill-over effect serves to deepen the impact of the original price volatility experienced by the dominant commodity. The more concentrated an economy is, the more disruptive the effect is likely to be on the entire economy. This is noted by Shediac et al., 2008) who point out that in the face of an economy slowing down or recession, the lack of diversification appears to deepen its impact.
Some of the evidence for this can be drawn from the response of Southern African countries to the 2008/2009 global economic and financial crisis. It is noted in the 2010 African Economic Report (UNECA, 2010) that Southern Africa was among the regions hardest hit by the crisis. The economy of the sub region is reported to have contracted by 1.6% in 2009. Investment flows, overseas remittances, aid flows and global demand for its oil and mineral products, all reduced significantly. Public spending on social services and infrastructure remained static. On the other hand, unemployment rose quite substantially. Estimates put rising unemployment during the period at 346, 681 from just DRC, Zambia and South Africa. For an area which is not that well integrated into the international economy, the degree of the disruption suffered can only be explained by the fact that most of these mineral dependant countries were not robust enough to absorb the effects of the crisis.

32 Economic Report on Southern Africa 2011 Status and Prospects for Economic Diversification in Southern Africa
The vulnerability of individual countries in Southern Africa to the effects of the global financial crisis is evident. Angola which relies on oil exports experienced a drop in public spending from 12% of GDP in 2007 to 9.2% of GDP in 2008. But more devastating was the fact that its strong run in economic growth of 20.6% in 2005, 18.6% in 2006 and 20.3% in 2007 all came to an end with 0.7% growth rate recorded in 2009. Botswana, a big exporter of diamonds, experienced a 10.3% drop in GDP in 2009. South Africa shrunk by 0.6% in 2009 while its SACU partners Lesotho and Namibia shrunk by 1% and 0.4%, respec-tively. Mauritius recorded a GDP growth drop of 2.5% in 2009 from the 5% recorded in 2008. In all these examples, the significant factor at play appears to have been the reduced demand for commodity exports which in turn depressed national earnings.
A diversified economy, in similar economic circumstances, responds differently because of an in-built ca-pacity to withstand external shocks. Such an economy has the capacity to absorb volatility better, thereby preserving economic performance and contributing to long term sustainability. The common theme running through the literature regarding economic diversification is that dependence on one dominant product increases chances of volatility and instability due to the cyclical nature of commodity prices. What diversification accomplishes, then, is to stabilise export revenues since income sources are spread across many products which have their own cycles. Little or no diversification, therefore, renders an economy fragile and undermines its capacity to compete effectively at the global level. On the contrary, when an economy is reasonably diversified various resources are more evenly distributed throughout the economy. Consequently, financial resources, labour productivity and human capital, which are associated with the growth of an economy, also tend to be spread out across many sectors. Basically, diversification influences growth by spreading investment opportunities which allows the economy to grow from many rather than one sector or product (Hammouda et al., 2008). An economy that is based on a wide range of sectors is for this reason likely to be more sustainable as it has reduced economic volatility which allows real activity performance. The anchoring of the economy in many sectors ensures its sustainability and robustness (Shediac, et al., 2008).
2.0.3 Pitfalls of economic diversification
As an economic development strategy, diversification differs from specialisation. A specialised economy often operates at the level of the country’s comparative advantage. Hence, such an economy produces and exports goods and services for which it has either a natural endowment or specialist skills, so that it is able to produce for the market competitively. Specialisation is indeed a time tested strategy that has buttressed industrial development over the centuries. Consequently, increasing the basket of goods and services produced and exported by a country is not necessarily a guarantee of economic success. It can be a risky strategy which if not implemented properly can worsen rather than improve a country’s economic situation (South Centre, 2005). A number of reasons account for this, including;
Loss of market for a traditional product: The introduction of a new product may lead to competition and loss of market for a traditionally high value product. This may result in reduced export income for the

33 Economic Report on Southern Africa 2011
country. Equally important is the possibility that the new product may dilute the value of the traditional product (South Centre, 2005).
Increased supply of new product: If horizontal diversification results in a high supply of the new product, it may precipitate a reduction in market price not just for the new product but even for the one from which the country diversified from. Market crises involving one product could, therefore, spread to other similar commodities.
Additional investment needed: Vertical integration, in particular requires that a country invests in new manufacturing processes and in research and development. Resources may not be available to support this investment increasing the chance of producing new suboptimal products. Launching a new product under these conditions can easily result in product failure.
Launching into a new market can be expensive: Entering a new foreign market is inherently risky because it is unfamiliar and may require investment in human development, institutional capacity building and infrastructure for the launching to be successful. Another shortcoming may be that the country fails to understand the new market and how it operates and, therefore, loses the positive benefits of prior investment.
Diversion of investment and other resources from core industries: The introduction of new products may only be achieved at the expense of diverting financial and other resources which are required to sustain the traditional core product or sector thereby undermining what might be the country’s mainstay.
The ultimate failure of diversification can manifest itself as the fallacy of composition. This means that an increase in the number of export products or export markets results in reduced rather than increased export earnings for a country. Diversification can be a difficult strategy to implement successfully. A lot of care and commitment is required for it to bring about the positive transformation in the economy.
2.1 Status of economic diversification in Southern Africa
Most economic activity in the Southern Africa sub region takes place in the two primary sectors of agriculture and mining. That which is often described as industry in the sub region typically encompasses a limited processing of agricultural and mineral based products with very limited value addition. Manufacturing activity is mostly small and confined to the production of a narrow range of products such as foodstuffs, beverages, tobacco, textiles, clothing and footwear which are predominantly agricultural-resource based.
Since the productive activity is concentrated in the primary sector, primary commodities make up most of the sub region’s exports The exports of Angola, Botswana, Democratic Republic of Congo (DRC), Na-mibia South Africa and Zambia are mainly oil or mineral exports. These are also the principal sources of foreign exchange for these countries. However they are also the potential base on which countries can build their industries. In the case of Malawi, for instance, agricultural commodities dominate its export trade while with Swaziland agro-processed products like sugar, wood pulp and citrus and canned fruits

34 Economic Report on Southern Africa 2011 Status and Prospects for Economic Diversification in Southern Africa
take up the significant share of exports. South Africa is probably the single country in the sub region that exports value-added industrial goods such as chemicals, machinery and more recently automobiles. The sub region shows general concentration in both product composition and export market composition. With regards to employment, the dominant sectors of oil and mining industries absorb only a small portion of the labour force employed. The agricultural sector’s contribution to GDP is often small; however the sector constitutes the largest employer in most of the countries in the sub region. The dominant sectors, with the greatest contribution to GDP, in essence contribute relatively little to total employment in the sub region.
Trade patterns within Southern Africa show that the bulk of intra-regional trade takes place among mem-bers of the Southern African Customs Union (SACU) which is dominated by South Africa. South Africa’s exports to the Southern African region is estimated at 19 percent of its total exports and of that 13% are with other SACU members. Zambia, Zimbabwe, Malawi and Mozambique export a limited range of their products to South Africa, but all maintain negative trade balances with the country. For the majority of countries in Southern Africa; Angola, Mauritius, Mozambique, South Africa, Tanzania and Zambia their principal export markets are the OECD countries, Middle East countries and Asia, which import mostly oil and mineral products. The subsequent sections aim to demonstrate the economic concentration or the poor diversification that characterises the sub region.
2.1.1 Measurements of economic diversification in Southern Africa
Figure 14 shows the trends of economic diversification for SADC, Africa as a whole, South Africa and Angola covering the period 1980 to 2002. Overall, the sub region has experienced a consistent improve-ment in economic diversification with the Hirschman index consistently dropping from 1980 to 1996. This means, the region has been making consistent progress towards achieving some degree of diversification. Furthermore, the sub region has been diversifying at a rate better than the rest of the African continent. But there is clearly a close relationship between the South African diversification ratio and the SADC di-versification ratio. This reflects largely the influence of South Africa’s diversified economy on the rest of the sub region and confirms that the SADC overall index is driven and determined by South Africa. Further examination of Figure 14 shows that the economy of Angola has over the period moved in an opposite direction to the SADC becoming more concentrated. But the dominant influence of South Africa appears to mask the experiences of individual countries like Angola.

35 Economic Report on Southern Africa 2011
Figure 14: Normalized Hirschman index for SADCNormalized Hirschman index for SADC
Year
Angola SADC
AfricaSouth Africa
1.00
0.80
0.60
0.40
0.20
0.00
1980
1982
1984
Inde
x
1986
1988
1990
1992
1994
1996
1998
2000
2002
Source: Hakim Ben Hammouda et al., 2006
In Figure 15, the normalized Hirschman index for Mauritius is shown and compared with the rest of Africa and Tunisia to illustrate the performance of another country, which unlike Angola, is diversifying. The trend shows that the country has consistently become less economically concentrated indicating improvement in economic diversification. But it is interesting to note that Mauritius has diversified slower than Tunisia and lags slightly behind the trend for Africa as a whole. What is significant, however, is that the economy of Mauritius has been progressively diversifying over the years.

36 Economic Report on Southern Africa 2011 Status and Prospects for Economic Diversification in Southern Africa
Figure 15: Mauritius Hirschman index
Africa Mauritius Tunisia
Year
1.000
0.800
0.600
0.400
0.200
0.000
1980
1982
1984
1986
1988
1990
1992
1994
1996
1998
2000
2002
Source: Hakim Ben Hammouda et al., 2006
Table 4 shows economic diversification for countries of the sub region over a more recent period of 2004 to 2008. The diversification trend is measured using the diversification coefficient or index. South Africa, with an average diversification index of 46.9, stands out as the most diversified economy in the sub region. The next in line are Tanzania and Madagascar with average diversification indices of 28.7 and 20.38, respectively. At the other end Angola, Botswana, Malawi, Seychelles and Zambia come out as the least diversified in the sub region. The diversification indices remain generally unchanged meaning that these countries did not show improvements in diversification during the period under examination.
Table 4: Economic Diversification Indices for Southern African Countries
Country Diversification index
2004 2005 2006 2007 2008 Average
Angola 1.1 2.3 2.3 2.4 2.5 2.12
Botswana 1.4 1.4 1.8 2.7 4.0 2.26
DRC 4.0 4.6 6.2 7.5 7.0 5.86
Lesotho 7.2 7.2 7.9 6.5 4.8 6.72
Madagascar 15.6 19.7 19.5 21.9 25.2 20.38
Malawi 3.8 2.6 3.0 3.8 3.6 3.36
Mauritius 11.8 12.3 12.8 13.7 15.2 13.16
Mozambique 2.6 3.2 2.7 3.5 6.3 3.66
Namibia 7.8 5.8 5.2 9.0 11.7 7.9
Seychelles 3.8 4.7 3.3 3.9 3.1 3.76
South Africa 52.1 49.4 46.8 45.5 40.7 46.9
Swaziland 16.9 17.5 20.3 22.3 18.7 19.14
Tanzania 25.5 20.2 31.0 31.9 34.9 28.7
Zambia 4.1 3.5 2.2 2.5 3.0 3.06
Zimbabwe 13.7 15.9 16.1 11.0 13.7 14.08Source: African Economic Outlook, 2011 based on ADB Statistics Department, COMTRADE database

37 Economic Report on Southern Africa 2011
In order to seek some explanation for the trends shown in Table 4, the various facets of economic concen-tration or diversification are examined below.
Sector diversification: Information in Table 5 gives an illustration of the percentage contribution to GDP coming from the different sectors for all the countries in the sub region. Angola and Botswana show huge mining sector concentrations as it contributes to the respective countries’ GDPs 59% and 42.7%. The sig-nificance of the mining sector to the economies of these countries partly explains the low diversification ratio observed in Table 1. Swaziland also shows that the manufacturing sector contributes a significant 42.2% to GDP. However, diversification within the manufacturing sector, as reflected in the production of sugar, wood pulp, textile, soft drink concentrates, citrus and canned fruits, ensures that overall Swaziland’s economy remains reasonably diversified. In the cases of the DRC, Madagascar, Malawi, Mozambique and Tanzania, the agricultural sector contributes significantly to the respective GDPs of the countries. In the case of DRC, it contributes 38.2% while in Malawi it contributes 34.3% to GDP. Another additional finding presented in Table 5 is that for the diversified economies like South Africa, the contribution to GDP is more spread out among the various sectors. However, the service sector comprising of trade, finance, real estate and communication makes a more significant contribution to GDP than in less diversified countries. The contribution of the service sector to GDP appears to be relatively low in the case of countries with high sector concentrations as exemplified by Angola and Botswana.
Table 5: GDP Distribution by Sector (%)
Country Agric Const Finance,real es-tates &other
services
Govern&
related
Transp&
Comm
Manu Mining&
quarry
Trade OtherServices
Angola 6.8 5.2 17.9 - 6.1 4.9 59.0 - 0.1
Botswana 1.9 4.1 14.3 15.5 3.9 3.5 42.7 11.5 2.7
DRC 38.2 8.3 6.1 1.6 6.5 4.1 12.2 22.4 0.6
Lesotho 7.9 4.6 4.8 25.2 6.6 18.5 6.2 8.7 4.4
Madagascar 26.9 5.3 6.8 5 23.7 16.1 0.1 14.5 1.5
Malawi 34.3 4.6 14.9 14.3 7.6 8.2 0.9 14.4 3
Mauritius 4.3 6.8 29.8 6.6 11.3 19.5 - 12 2.3Power
Mozambique 27.4 2.9 11.1 9.2 10.7 14.5 1.6 13.2 6.2Power
Namibia 9.3 4.4 12.1 14.7 5.1 13.2 16.6 9.1 2.3Power
South Africa 3 3.9 21.7 15.4 9.5 15.1 9.7 13.3 5.9
Swaziland 7.9 3 3.5 19.8 7.4 42.3 0.3 8.9 4
Tanzania 29.4 8.4 14.6 12.3 7.3 8.5 3.7 15.5 2.3
Zambia 20.9 19.4 14.4 10.3 3.6 9.3 9.1 15.6 2.8
Source: African Economic Outlook, 2008
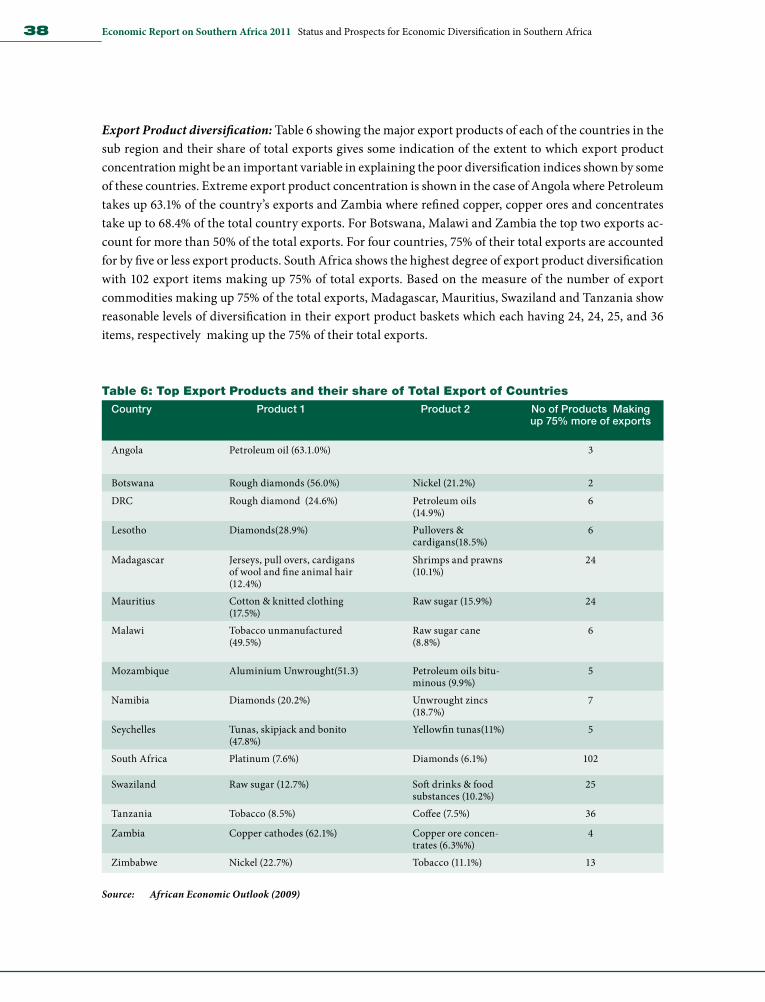
38 Economic Report on Southern Africa 2011 Status and Prospects for Economic Diversification in Southern Africa
Export Product diversification: Table 6 showing the major export products of each of the countries in the sub region and their share of total exports gives some indication of the extent to which export product concentration might be an important variable in explaining the poor diversification indices shown by some of these countries. Extreme export product concentration is shown in the case of Angola where Petroleum takes up 63.1% of the country’s exports and Zambia where refined copper, copper ores and concentrates take up to 68.4% of the total country exports. For Botswana, Malawi and Zambia the top two exports ac-count for more than 50% of the total exports. For four countries, 75% of their total exports are accounted for by five or less export products. South Africa shows the highest degree of export product diversification with 102 export items making up 75% of total exports. Based on the measure of the number of export commodities making up 75% of the total exports, Madagascar, Mauritius, Swaziland and Tanzania show reasonable levels of diversification in their export product baskets which each having 24, 24, 25, and 36 items, respectively making up the 75% of their total exports.
Table 6: Top Export Products and their share of Total Export of Countries Country Product 1 Product 2 No of Products Making
up 75% more of exports
Angola Petroleum oil (63.1.0%) 3
Botswana Rough diamonds (56.0%) Nickel (21.2%) 2
DRC Rough diamond (24.6%) Petroleum oils (14.9%)
6
Lesotho Diamonds(28.9%) Pullovers & cardigans(18.5%)
6
Madagascar Jerseys, pull overs, cardigans of wool and fine animal hair (12.4%)
Shrimps and prawns (10.1%)
24
Mauritius Cotton & knitted clothing (17.5%)
Raw sugar (15.9%) 24
Malawi Tobacco unmanufactured (49.5%)
Raw sugar cane (8.8%)
6
Mozambique Aluminium Unwrought(51.3) Petroleum oils bitu-minous (9.9%)
5
Namibia Diamonds (20.2%) Unwrought zincs (18.7%)
7
Seychelles Tunas, skipjack and bonito (47.8%)
Yellowfin tunas(11%) 5
South Africa Platinum (7.6%) Diamonds (6.1%) 102
Swaziland Raw sugar (12.7%) Soft drinks & food substances (10.2%)
25
Tanzania Tobacco (8.5%) Coffee (7.5%) 36
Zambia Copper cathodes (62.1%) Copper ore concen-trates (6.3%%)
4
Zimbabwe Nickel (22.7%) Tobacco (11.1%) 13
Source: African Economic Outlook (2009)

39 Economic Report on Southern Africa 2011
Export Market Diversification. Table 7 shows the main export partners of each of the countries in the sub region in order to establish the extent to which their export markets are either concentrated or diversified. The table reveals the percentage of export trade that is taken up, firstly, by the main export partner and, secondly, by the top two export partners. Based on the top export partner the countries with the highest export market concentrations are Angola, Botswana, DRC, Lesotho, Mozambique and Swaziland for which the top partner takes up 35.65%, 78.6%, 46,7%, 59.9%, 47,6% and 59.7%, respectively. When the top two export partners are taken into account, the emerging picture shows them taking up exports amounting to 61.61 for Angola, 94.6% for Botswana, 62.10% for DRC, 97.27% for Lesotho, 59.22% for Mozambique and 68.5% for Swaziland. South Africa for which the top two export partners take up only 19.53% has relatively low export market concentration together with Malawi and Tanzania where the top two export partners take up 20.89% and 16.05%.
Table 7: Percentage of Exports Taken up by Top Export PartnersCountry Top Export Partner Two Top Export Partners
Angola 35.65 61.61 Botswana 78.6 94.6
DRC 46.7 62.10%
Lesotho 59.9 97.27%
Madagascar 28.9 49.39%
Malawi 12.37 20.89%
Mauritius 25.55 42.44%
Mozambique 47.62 59.22%
Namibia 33.4 37.4%
Seychelles 24.8% 43.37
South Africa 10.34% 19.53
Swaziland 59.7 68.5
Tanzania 8.5 16.05
Zambia 21.85 29.37
Zimbabwe 14.82 28.31
Source: African Economic Outlook, 2008
Information contained in Tables 5, 6 and 7, permit the following deductions to be made with respect to concentration of the economies of the Southern African sub region.

40 Economic Report on Southern Africa 2011 Status and Prospects for Economic Diversification in Southern Africa
Sector concentration
High concentration: Angola, Botswana, Swaziland
Moderate concentration: DRC, Madagascar, Malawi, Mozambique, Tanzania
Low concentration: South Africa
Export Product concentration
High concentration: Angola, Malawi, Botswana, Lesotho, Seychelles, Zambia
Moderate concentration: Madagascar, Mauritius, Swaziland, Tanzania
Low concentration: South Africa
Export Market concentration
High concentration: Angola, Botswana, DRC, Lesotho, Mozambique, Swaziland
Moderate concentration: Malawi, Tanzania, Mauritius
Low concentration: South Africa
On all the three measurements, South Africa comes out as the least concentrated indicating its status as the most diversified economy in the sub region. But Angola and Botswana show high sector, export product and export market concentrations which explains why these countries score poorly on measures of diver-sification. Malawi’s, Seychelles and Zambia’s low diversification indices are explained by their high export product concentrations. Mauritius, Swaziland, Madagascar and Swaziland show moderate diversification indices because they tend to have either moderate export market, export product or sector concentrations or some combination of the three.
Variability in GDP growth: It was observed earlier in this paper that poor economic diversification or economic concentration increases variability in the growth rates of commodity rich countries. This is caused primarily by the destabilising influence of commodity price volatility in the international market. A review of the GDP growth rates for the countries in the sub region are given in Table 1 for the period 2004 to 2010 in order to assist in determining whether highly concentrated countries show higher GDP growth variation than the moderately or lowly concentrated countries.

41 Economic Report on Southern Africa 2011
2.1.2 Opportunities for economic diversification
The analysis of the status of diversification and challenges to diversification in the preceding sections offer a number of opportunities for economic diversification that countries in the Southern Africa sub region can adopt. Some of these are associated with overcoming the current constraints to diversification while others arise from the possibility of expanding on existing economic activity. The major opportunities include;
Horizontal diversification: Sector and product concentrations are characteristic of many countries in the sub region. For these highly concentrated economies, the first opportunity for diversification lies in horizontal diversification. Countries like Malawi which relies on tobacco, as its principal export, can add new cash or export crops to both enhance and stabilise its export earnings. But it is an option that is open to many countries in the sub region. Many of them have various levels of agricultural potential which can allow them to produce competitively more crops than they are currently doing. Horizontal diversifica-tion has a number of advantages including relying on current technologies and leveraging on existing knowledge and structures. New crops, for instance can be introduced in such a way that a country makes use of the experience, expertise and institutions that it already possesses. The same agricultural exten-sion programmes created to sustain tobacco growing can, for instance, be used to support the growth of ground nuts, tea, coffee, bananas, etc. Therefore, it can be achieved with limited investment both in terms of technology and human skill.
Horizontal diversification in mining is somewhat much more difficult to attain because the mineral wealth endowments for each country are limited. If a country’s only natural resource endowment is copper, it can-not diversify into commodities it does not possess. However, what is apparent even in mining is that with commitment to exploration, new mineral resources can be discovered and added to the pool of what the country produces. Zambia, as an example, has embarked on an aggressive programme to achieve greater diversification within the mining industry beyond copper. Extensive explorations across the country, mostly using private sector resources, are currently going on with the view to increasing the number of minerals produced from the country. Preliminary results are encouraging as they point to the possible availability of large quantities of various minerals including uranium, gold and tin. But South Africa presents the best example of horizontal diversification in mining given the wide range of its mining production.
Vertical diversification: The second opportunity for diversification exists at the level of vertical diversifi-cation involving countries transforming commodities into higher value products which can fetch better prices than in their unprocessed form. This is another opportunity that is open to all countries in the sub region as they are all involved in the production and exporting of agricultural and mining primary com-modities and most of them show concentration at the level of primary commodity. Vertical diversification is also referred to as beneficiation or value addition which can range from rudimentary value addition to the production of sophisticated industrial machinery and equipment. Although vertical diversification often requires investment in processing, research and development and marketing, the amount of invest-ment outlay can be controlled by limiting the level of processing at different levels of development. This also allows a country to mobilise financial resources and build technical expertise at every stage prior to moving to higher levels of production. But as a strategy it does not necessarily have to be outside the scope
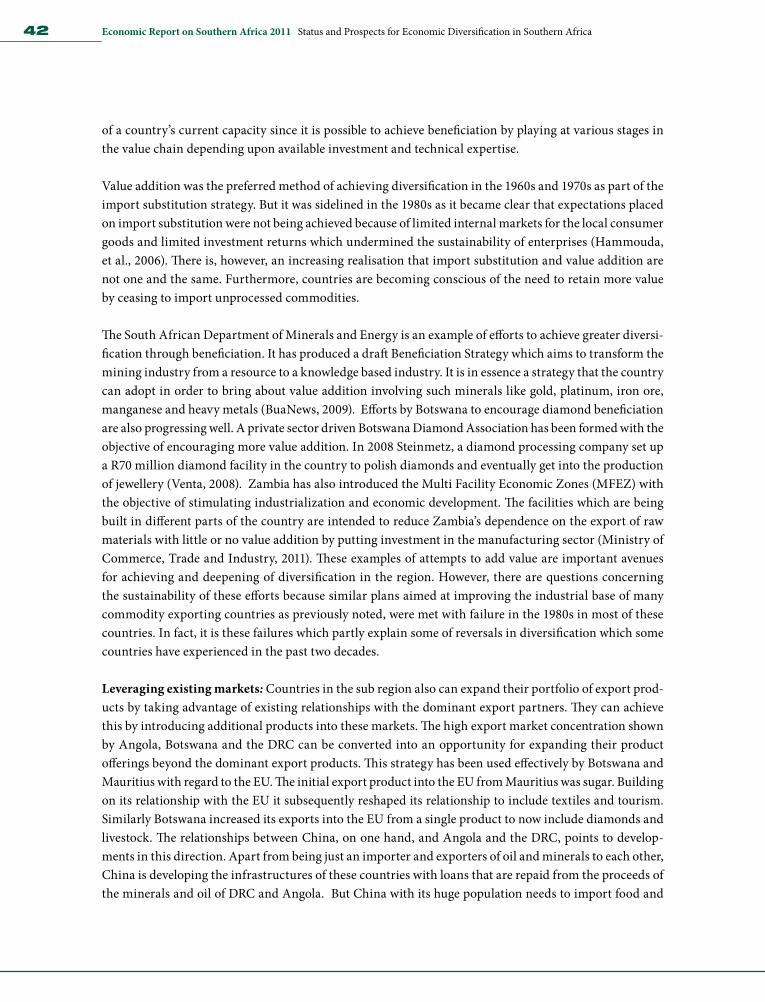
42 Economic Report on Southern Africa 2011 Status and Prospects for Economic Diversification in Southern Africa
of a country’s current capacity since it is possible to achieve beneficiation by playing at various stages in the value chain depending upon available investment and technical expertise.
Value addition was the preferred method of achieving diversification in the 1960s and 1970s as part of the import substitution strategy. But it was sidelined in the 1980s as it became clear that expectations placed on import substitution were not being achieved because of limited internal markets for the local consumer goods and limited investment returns which undermined the sustainability of enterprises (Hammouda, et al., 2006). There is, however, an increasing realisation that import substitution and value addition are not one and the same. Furthermore, countries are becoming conscious of the need to retain more value by ceasing to import unprocessed commodities.
The South African Department of Minerals and Energy is an example of efforts to achieve greater diversi-fication through beneficiation. It has produced a draft Beneficiation Strategy which aims to transform the mining industry from a resource to a knowledge based industry. It is in essence a strategy that the country can adopt in order to bring about value addition involving such minerals like gold, platinum, iron ore, manganese and heavy metals (BuaNews, 2009). Efforts by Botswana to encourage diamond beneficiation are also progressing well. A private sector driven Botswana Diamond Association has been formed with the objective of encouraging more value addition. In 2008 Steinmetz, a diamond processing company set up a R70 million diamond facility in the country to polish diamonds and eventually get into the production of jewellery (Venta, 2008). Zambia has also introduced the Multi Facility Economic Zones (MFEZ) with the objective of stimulating industrialization and economic development. The facilities which are being built in different parts of the country are intended to reduce Zambia’s dependence on the export of raw materials with little or no value addition by putting investment in the manufacturing sector (Ministry of Commerce, Trade and Industry, 2011). These examples of attempts to add value are important avenues for achieving and deepening of diversification in the region. However, there are questions concerning the sustainability of these efforts because similar plans aimed at improving the industrial base of many commodity exporting countries as previously noted, were met with failure in the 1980s in most of these countries. In fact, it is these failures which partly explain some of reversals in diversification which some countries have experienced in the past two decades.
Leveraging existing markets: Countries in the sub region also can expand their portfolio of export prod-ucts by taking advantage of existing relationships with the dominant export partners. They can achieve this by introducing additional products into these markets. The high export market concentration shown by Angola, Botswana and the DRC can be converted into an opportunity for expanding their product offerings beyond the dominant export products. This strategy has been used effectively by Botswana and Mauritius with regard to the EU. The initial export product into the EU from Mauritius was sugar. Building on its relationship with the EU it subsequently reshaped its relationship to include textiles and tourism. Similarly Botswana increased its exports into the EU from a single product to now include diamonds and livestock. The relationships between China, on one hand, and Angola and the DRC, points to develop-ments in this direction. Apart from being just an importer and exporters of oil and minerals to each other, China is developing the infrastructures of these countries with loans that are repaid from the proceeds of the minerals and oil of DRC and Angola. But China with its huge population needs to import food and

43 Economic Report on Southern Africa 2011
using the existing relationship DRC and Angola can expand into food exports as one logical step up in this relationship. The point is that trading with a one dominant export partner helps the exporting country to gain experience and know the market into which it is exporting. This knowledge can be used to develop relationships which can create other export opportunities.
Prudent use of commodity and natural resource rents: The possession of natural resource wealth can offer a country a great opportunity for diversifying its economy. Proceeds from the sale of these commodi-ties can be invested to develop other sectors or to achieve horizontal or vertical diversification within the same sectors. Botswana, clearly concerned about its poor diversification status announced in 2009 the National Development Plan 10 which identified six areas of focus for enhancing the country’s economic development and achieving diversification (OASAA et al., 2010). The plan envisaged growing the economy of Botswana based on six hubs;
• An education hub which is based on developing quality education at all levels
• An innovation hub which will encourage R&D and knowledge intensive activities
• An agricultural hub which will create a sustainable agricultural sector
• A diamond hub which will establish diamond trade centres and diamond polishing facilities
• A medical hub which will turn Botswana into a centre of medical excellence
• A transport hub which will reposition the country into a hub for transport and transport logistics in the Southern African sub region
Resource rich countries like Angola, DRC and Zambia can use this wealth to drive the process of deepening diversification. In the case of Botswana, the US$1.5 billion needed to implement this diversification strategy comes mainly from proceeds of diamond sales as the core funding on which the private sector can pig back.
Relative political and social stability: The sub region, as a whole, is relatively peaceful and is mostly run by democratically elected governments. These improvements in governance are helping to attract invest-ment into the region to support a whole range of different economic activities. It is also helping to bring about discussions of how the proceeds from natural wealth endowments are used by governments in order to encourage the prudent use of proceeds from these resources.
Low intra SADC trade and reducing South Africa’s share of sub regional exports in favour of other countries: The current low levels of trade among the members of SADC, offers another opportunity for countries to expand their export base. The sub region is the first export market opportunity for products from member states. But the greater part of trade within the sub region takes place among members of SACU; namely South Africa, Botswana, Namibia, Lesotho and Swaziland. But South Africa dominates both SACU and SADC. It exports nearly 19% of its total exports to the SADC region of which 13% is with SACU
44 Economic Report on Southern Africa 2011 Status and Prospects for Economic Diversification in Southern Africa
countries. South Africa’s dominance is itself an opportunity for other countries to increase their share of the sub regions market. The challenge for other members is to explore their comparative advantages so that they are able to produce certain goods more competitively than South Africa. The shift that has taken place in the international markets involving the increasing influence of China and India can be mirrored in the sub region with other countries producing more for export to each other.
The SADC market will be enhanced when the Free Trade Area incorporating SADC, COMESA and the East African Community (EAC) is finally established. Whether member States can make effective use of this market space, will among others, require them to overcome their supply constraints and to produce goods which have demand among the countries within the sub region based on each country’s comparative advantage. Other constraints to be overcome include infrastructural deficiencies and non tariff barriers which currently hinder trade. A good case in point is the low volume of trade between Zambia and Angola which is related partly to the poor road network between the two countries. This makes it very difficult to export Zambian foodstuffs into Angola for which studies indicate both the productive capacity and the market exists.
Lessons from past failed diversification policies: The history of economic diversification in the sub region has been marked by progress followed by reversals in the gains made. In the 1980s, in particular, pursuit of macroeconomic policies at the expense of sectoral policies was a major factor in explaining the curtailment of progress in economic diversification made by some countries in the 1970s (Hammouda et al. 2006). These failed attempts at diversification provide a unique opportunity for countries to implement new diversifica-tion efforts through improved management and more innovative application of sectoral economic policies. Since evidence appears to suggest that part of the failure to sustain diversification relates to inappropriate trade, financial sector and industrial policies, beginning to reform these policies in earnest will restore some of these countries’ capacities to diversify in a more robust way.
With respect to trade policy, the application of either protectionist or orthodox liberal policies, at different times, seem to have ultimately resulted in the weakening of the diversification efforts. Similarly, liberal financial sector reforms have not necessarily resulted in the financial sector becoming efficient or deeper. Instead they have been accompanied by increase in interest rates, failure to develop development finance institutions and capital markets which ordinarily should be the essential sources of long term investment finance. Therefore, private sector investment needed to catalyse diversification has not been forthcoming in a good number of countries in the sub region. With regards to industrial policies, the import substitu-tion strategies which were at the centre of diversification in the 1970s, failed to sustain the initial gains in diversification associated with them. These experiences point to the need for countries in the sub region to become more strategic in their policy choices in order to strengthen diversification. The Economic Com-mission for Africa (2004) observes that these policies might require adopting sector by sector bottom-up strategies from downstream to upstream as a way of deepening horizontal diversification in intermedi-ate goods right through to capital goods. It notes, further, that this strategy could also lead to vertical diversification by developing connections between internal markets and exports. Downstream industrial segments, in this situation, become the basis for developing export oriented sectors while intermediate sectors would target the capital market.

45 Economic Report on Southern Africa 2011
Improvement in the general business environment: Most countries in the sub region are committed to improving the business operating environment by removing constraints to doing business. Swaziland and Zambia, for instance, have embarked on ambitious programmes to improve their respective overall business climates. In the case of Zambia, the components of the programme include creating one stop border post between Zambia and Zimbabwe and Namibia, dealing with business license problems associated with too many licenses and expediting company registration. This is giving great impetus to the private sector so that they can extend business to new products and attract investment.
Dealing with sub regional infrastructural deficiencies: SADC recognises that both at the national and regional levels inadequate infrastructure has hindered economic integration and development of sub regional trade. With the exception of South Africa, whose infrastructure is generally well developed, other countries in the region still lag behind in terms of infrastructure development. But through SADC and COMESA a number of regional transport, telecommunication and energy infrastructure projects are either on the drawing board or are being implemented. This includes the North – South Transport corridor which runs from South Africa up to Tanzania and the DRC. The completion of many of these initiatives will alter the infrastructural landscape which will benefit the movement of goods and services and ultimately diversification in the products that the countries are able to trade among themselves and with those outside the region.
2.2. National experiences of economic diversification: Case studies
2.2.1 South Africa
South Africa is by far the most diversified economy in Southern Africa. Its diversification clearly influences the trend of the sub region as shown in Figure 14. Sector contribution to the country’s GDP is more or less evenly spread among agriculture, manufacturing, trade, transport and communications, finance and real estate. An analysis of these sectors in clusters shows that the economy is heavily concentrated in the service sector which contributes as much as 73% to GDP. Industry and agriculture contribute about 20% and 7%, respectively. The South African economy is, therefore, biased towards services and production activities at the higher levels of the value chain.
Further evidence of its diversification status can be deduced from its low export product and low market product concentrations. Platinum as the main export product contributes only 9% to total exports whilst diamonds, the number two export product makes up 5.3% of total exports. The total number of export products making up 75% of the country’s total exports stands at about 83; higher than any country in the sub region. As for export market concentration, China, the top export partner absorbs only 10.3% of total exports whilst the second placed export partner, the United States of America, takes up only 9.19% of the country’s total exports. This means that the top two export partners take up about 20% of the country’s total exports.
46 Economic Report on Southern Africa 2011 Status and Prospects for Economic Diversification in Southern Africa
The country’s strategy for diversification has been defined by differences in areas of emphasis at different times in the historical development of the country. The early stages of diversification in the 1950s and 1960s attempted to achieve horizontal diversification by increasing the number of agricultural products that the country produced. This has made South Africa self sufficient in virtually any agricultural product. Among the agricultural products that are grown and exported are avocados, grapefruit, plums, tangerine, pears, grapes, maize, apricots, pineapples and from livestock meat, hides and skins. The country also developed forestry and fisheries as part of achieving a wider economic base within the agricultural sector. South Africa has, therefore, the most diversified agricultural sector within the sub region.
Developments in farming were paralleled by similar horizontal developments in the mining sector which have made South Africa a leading mining country in the world. It is abundantly endowed with mineral resources which account for substantial portions of world production and reserves. The country has over the years diversified its mining activities into precious metals and minerals, energy minerals, non ferrous metals and minerals, ferrous metals and minerals and industrial minerals. Mining activities which started with the discovery of gold, diamonds and coal have turned South Africa into one of the main producers and exporters of platinum, palladium, gold, diamonds, chrome, manganese, vanadium titanium and vari-ous base metals and coal. As with agriculture, South Africa has managed to develop the most diversified mining sector in the sub region.
Traditionally, agricultural based processing and mining processing form the first attempts at promot-ing vertical diversification. Agricultural processing has lead to South Africa becoming one of the major producers and exporters of sugar, dairy products such as milk and cheese, beverages and wines. On the mining side, it has developed world class processing facilities from which such products like carbon steel, stainless steel, aluminium and jewellery are produced both for the local and export markets. For over a century, the mining industry in South Africa has provided the basis for developing other industries sup-portive of financial services, energy, water services; engineering services geological services, metallurgical services and so forth.
The country’s diversification process has gone through a number of stages starting with horizontal diversifica-tion in agriculture and mining and then followed by vertical diversification in the form of agricultural and mineral processing. Further beneficiation has been the basis on which it has built its diversified manufac-turing base comprising automobile, chemicals, ICT and electronics, metals, textile, clothing and footwear.
South Africa’s processing industry and beneficiation have also emerged from the import substitution period which the country adopted in response to the economic sanctions of the 1960s and 1970s arising from the country’s policies of apartheid. But the country’s commitment to appropriate industrial policies, trade policies, financial sector policies and macroeconomic policies has contributed to South Africa remarkable progress. Within the framework of horizontal and vertical diversification and implementation of import substitution policies and appropriate sector specific and macroeconomic policies, South Africa has emerged within SADC as the most competitive economy ranked 45 in the world out of 113 countries according to the 2009 Global competitiveness index. The major drivers of the impressive diversification process have been;

47 Economic Report on Southern Africa 2011
Creation of institutions to support diversification: This has been the traditional route through which government has driven diversification. Government has been central to the creation of critical economic management institutions that have been the driving force for economic diversification. Between the 1950s and 1960s, government established Phoskor for the purpose of producing phosphates needed to develop the agricultural sector. Sasol was also created to meet the energy needs of the country through the produc-tion of oil from coal. The Industrial Development Corporation (IDC), in turn, was established to provide finance to new industries. For the past sixty years or so IDC has financed rural projects that encourage employment creation, Small and Medium Enterprises (SMEs), emerging technology based institutions and new industrial development zones. To support the continuous development of the manufacturing sector, IDC has financed activities that encourage beneficiation of mineral and agricultural commodities. Trade financing extended to exporters and importers has assisted the trade sector to expand and make the country a leading force in the region. Institutions created after 1990 with the view to facilitating diversifi-cation are the South African Bureau of Standards, the Council for Scientific and Industrial Research and the African Renaissance Fund which is meant to support bi lateral and tri lateral partnerships. In 2007 the National Industrial Policy Framework (NIPF) was created with the mandate to implement the Industrial Policy Action Plan (IPAP). Subsequently, government created the National Planning Commission which was tasked with dealing with such shortcomings in the implementation of the IPAP like concerns over the appropriateness of IPAP sectors, sustainability in the absence of protection, international competitiveness and infrastructural deficiencies.
Design and implementation of appropriate policies: The second role of government has been that of establishing policies appropriate to diversification and ensuring that they are implemented. The IPAP’s is one such policy. It focuses on encouraging value addition so that the country’s capacity to compete in the export markets is enhanced by reducing reliance on traditional commodities and non- tradable services. Under the IPAP, sectors targeted for development are put into three categories each with its own outline of the sector profile, key opportunities, major constraints, key action programmes, outcomes, and mile-stones for the development of the sector. The plan has given impetus to the development of a wider range of products including Metal fabrication, capital and transport equipment sectors, automobiles, compo-nents, medium and heavy commercial vehicles and plastic, pharmaceuticals and chemicals to name a few. More significantly, the plan is leading the country into exploring sectors that have potential for long term developing of advanced capabilities in nuclear, advanced materials and aerospace.
The Motor Industry Development programme (MIDP) which was launched in 1995 to boost the automobile industry has achieved remarkable results for the country. The results of its intervention include the set-ting up of BMW’s plant in Pretoria, General Motors US$3 billion investment for the manufacturing of the Hummer H3 for exports to Asia, Middle East Africa and Europe, Volkswagen US$3.7 billion investment to produce the Golf 5 cars for export to Asia and Australasia and Daimler- Chrysler production of the C class sedan in the country.
Harnessing natural resources: Natural resources, especially mineral resources are the bed rock of the South African economy. Currently the country is the world’s largest producer of platinum, gold and chromium and among the leading producers of diamonds. Agriculture has also been a prominent sector although

48 Economic Report on Southern Africa 2011 Status and Prospects for Economic Diversification in Southern Africa
challenged by water scarcity and poor soils. Through the pursuit of appropriate policies, South Africa has demonstrated that natural resource wealth need not predestine an economy to high degrees of economic concentration. Prudent use of proceeds from mineral exports and policy emphasis on beneficiation has led to the country diversifying its economic activity to encompass automobile assembly, chemicals, machinery and fertilizers. The country’s biodiversity has been used to develop a thriving tourism industry with great potential for growing into a major employer. The SADC “Boundless Southern Africa” initiative which makes the national parks in all SADC member state a shared resource is giving South African tourism greater scope for conducting its tourist activities in the entire sub region.
Contribution of the Private sector: South Africa, compared to rest of SADC, has a relatively developed private sector which has been an active player in promoting diversification. It has shown great enterprise in pursuing new initiatives as producers of a wide range of products in different sectors and by reaching out to beyond its borders in order to grow new markets. It has shown its commitment to innovation by investing in research and development which continues to yield new product or improvements to existing products. South African Breweries, Shoprite and mining companies which have grown into large conglom-erates exemplify this spirit of enterprise.
Infrastructural development: While poor infrastructure has constrained the expansion of economic activ-ity in a number of SADC countries, South Africa’s developed infrastructure has been a positive influence in the diversification of the economy. Through Eskom, the country generates 70% of the power consumed in Southern Africa notwithstanding the power outages that are sometimes experienced in the country. The well developed road network within the country and connecting to other countries in the region has helped it develop reasonable trade links with Botswana, Lesotho, Zimbabwe and Mozambique and beyond. For this purpose, South Africa is active in developing infrastructure in the rest of Africa using facilities like the Pan African Development Fund. A seemingly valuable strategy for developing and maintaining infrastructure is the Public Private Partnership (PPP) model which has been legally institutionalized. Within eight years of applying this model, the country has approved and implemented sixty infrastructure projects. The government is also seeking new initiatives for diversifying its energy source away from coal to renewable sources. It is projected that by 2020, 15% of energy source will be from renewable sources including nuclear energy.
Investment and Financing capability: A strong driver of diversification in South Africa has been its well developed financial sector. The country’s financial institutions offer a variety of financial instruments including short term, medium and long term financing. The Development Bank of Southern Africa is an active player in long term project financing while the commercial banks are liquid and competitive. The capital market is the largest and most liquid on the African continent. The financial sector also has well developed links with international financial institutions which makes it possible for promoters of business ventures to access finance beyond the capacity of local institutions.
Education and skills levels: Over the years, the country has developed strong human resource capability in engineering, ICT, the service sector and energy which has provided the basis for sustaining new and

49 Economic Report on Southern Africa 2011
emerging sectors. Limited skills in the area of nuclear energy are considered as one reason that is limiting the diversification of sources of energy into new forms like nuclear energy.
Access to regional and international markets: South Africa is the most significant player in both the SACU and SADC markets in which it controls 93.3% of total SACU trade and 71% of the GDP of SADC. Access for its goods and services in these two regional groupings is basically unchallenged. For this reason South Africa has become a key player in driving the economy of the Southern Africa sub region. More importantly, South Africa is the country in the sub region which is most integrated into the global economy. Its major trading partners are China, the United States of America, Japan and the EU. To expand international trade, South Africa has established economic trade agreements with EU, USA, and is in the process of expanding relations with India and Brazil as well as China. It is also these trade agreements that have helped diversify South Africa’s export market beyond what any member state of SADC has been able to achieve.
2.2.2 Mauritius
Mauritius has one of the most diversified economies in the sub region. It terms of the diversification coef-ficients shown in table 1, the country is the fifth most diversified economy after South Africa. Both Table 4 and Figure 15 confirm that the country’s economy continues to diversify in contrast to countries like Swaziland which show signs of becoming less diversified. Sectors making significant contributions to the country’s GDP include finance and real estate, manufacturing, trade, transport and communication. It has a relatively moderate export product concentration with textiles, the main export product, contribut-ing 15% to total exports and raw sugar, the second most important export product, contributing 14.2% to total exports. This means that the top two export products account for nearly 30% of the country’s exports. However, 29 export products account for 75% of the country’s total exports. In terms of market concentration, the United Kingdom which is the first export market partner takes up 25% of its exports while France, the second export partner takes up nearly 17% of the country’s exports. Again the country shows a moderate export market concentration since the top two export partners between them take up 32% of the country’s total exports.
At independence in 1968, Mauritius was an agricultural based economy concentrated on the production and processing of sugar cane. It is has since then developed from a low-income country to an upper-middle income country with its economy diversified into the textile industry, tourism, and financial services. Sugar still commands an important place in the life of the country. It takes up nearly 90% of all cultivated land and contributes nearly 15% to the country’s export earnings. However, it is not the single important commodity it once was as subsequent developments have transformed Mauritius into a fairly diversified economy within Southern Africa. As evidence of its transformation, Mauritius’ share of agriculture in real GDP has declined from around 12% in 1990 to around 6%. The services sector, made up largely of tourism and financial services, is the most important in the economy contributing 74% of real GDP.
The export of services makes up more than one third of total foreign exchange earnings, with tourism being the major contributor. Manufacturing, of which textiles and clothing make up more than 40% 0f the output, is responsible for about 75% of merchandise exports and about one fifth of real GDP. For a country which

50 Economic Report on Southern Africa 2011 Status and Prospects for Economic Diversification in Southern Africa
does not have the natural resource endowments that many African countries have, its path to diversifica-tion makes a strong case for the role of appropriate policies and government commitment in transforming an economy. The current level of diversification, accordingly, is the end result of policy management and implementation of strategies by successive governments over the last forty years as outlined below.
Import substitution strategy: At independence the Government of Mauritius inherited an Import-Substi-tuting Industrialisation (ISI) strategy. The focus of the strategy was to encourage manufacturing activities in the economy which promoted import-replacement. Supportive legislation was passed in 1964 which in-troduced a number of fiscal and other incentives to encourage the setting up of ISI industries. Companies or Industries set up under this legislation were designated D.C. companies because they were issued with what was called “Development Certificates”. The privilege associated with being a D.C. company was protection from external competition through the imposition of tariff and non-tariff barriers on competing imports. At independence the new government realized that the ISI strategy was failing to create employment and did not seem to be the appropriate strategy on which the country could develop. It, therefore, resolved to abandon ISI in favour of the Export Oriented Industrialization (EOI) strategy. But the import substitu-tion strategy initiated the country’s vertical diversification process in the form of sugar cane processing.
Export oriented industrialization strategy:
This strategy shifted focus from producing import substitutes to producing for the export market. But apart from the sugar industry, the government did not have much to start with in order to pursue the export industrialization strategy. The country, as noted lacked natural resources on which industrialization could be built. It was also geographically remote from sources of raw materials and possible foreign markets. Management and technical skills were generally absent outside the sugar industry and capital investment was scarce. The country was faced with a host of constraints which from the outset made it difficult to achieve the desired industrialization and economic diversification.
In the 1970s government identified the textile and clothing manufacturing sector as the driving force around which the development of an export-oriented strategy could be built. It set out to attract foreign investment into this sector by offering a package of incentives which included tax holidays and duty-free importation of raw materials and equipment and free repatriation of capital. The country was subsequently designated as an Export Processing Zone, or a Free Zone with the passing of the Zone Export Processing Zone (EPZ) Act No.51 of 1970 under which it offered an expanded range of incentives to both foreign and local investors including:
• Complete exemption from the payment of import duties on productive machinery, equipment and spare parts.
• Complete exemption from payment of import and excise duties on raw materials and components except spirits, motor-cars and petroleum products.

51 Economic Report on Southern Africa 2011
• Exemption from payment of income tax on dividends and profits for the first ten years of operation and favourable corporate tax rate.
• Availing factory buildings and fully-serviced land at reasonable or subsidized rates.
• Subsidized electricity or water rates
• Favourable labour laws.
• Guarantee against nationalization.
• Free repatriation of capital (except capital appreciation), profits and dividends.
• Availing permanent residence and work permits for foreign technicians and managers.
The EPZ sector emerged as the major driving force in attracting investors into the textile industry and helped to establish manufacturing companies across the whole country. It stimulated the country’s export performance into becoming the leading factor in growing the economy. More significantly it formed the basis for the country’s impressive annual real GDP growth rates averaging 5.4% between 1976 and 1990, making it one of the most consistent performers in Africa. The EPZ sector, itself, grew at an average an-nual rate of 16% between 1976 and 1990 but peaked in 1986 when it grew at 35% in 1986. To ensure further diversification of the economy, Mauritius also embarked on developing the tourism sector, in the 1980s, to parallel the development of the industrial Export Processing Zone. It established new non-stop destina-tions into Europe through its national airline, Air Mauritius which made great contribution to bringing Mauritius to Europe and Europe to Mauritius and ultimately helped to boost the growth of the tourism industry in the 1980s. The country during this period combined horizontal and vertical diversification strategies in order to grow the economy.
The diversification strategy of 1990: The next stage in the country’s diversification drive was the imple-mentation of the diversification strategy in the 1990s.It sought to develop a strong financial services sector made up of commercial banking and insurance. In 2004, the National Productivity and Competitiveness Council (NPCC) of Mauritius pushed for greater diversification as a basis for future economic sustain-ability. It recommended that economic activity should move into developing a new range of professional services including accounting, management consultancy, engineering, architecture and information and communication technology. The country is now set to grow into a service and knowledge based economy with activities spanning also into health to include medical tourism, clinical trials and pre-clinical research as well education involving vocational and tertiary education in financial services, hospitality, public ad-ministration and distance learning (Commonwealth Secretariat, 2011)
In all these, the government of Mauritius has taken a very active role in driving the actual implementation of the diversification strategy. Its role has not been restricted to formulating appropriate policy but to being a hands on implementer. In the realization of the diversification strategy, it has sought the support of the

52 Economic Report on Southern Africa 2011 Status and Prospects for Economic Diversification in Southern Africa
Commonwealth Secretariat to assist in establishing a roadmap for achieving these objectives. In response the Secretariat consequently organized a series of symposia which generated ideas on the administrative and business related changes that needed to be made to boost the growth of professional services. Recom-mendations arising from these symposia have resulted in government constructing 22 buildings to house professionals working in the information and communications technology field, established an ICT academy in 2009 and introduced legislative changes to improve the regulatory framework for conducting business.
Political and social stability and good governance: Apart from the successive policies that have driven the diversification of the country, Mauritius has historically offered both political and social stability. Since its independence it has been spared political disruptions that have been witnessed in a number of other African countries. It has been a democracy which is premised the impartial application of the law and respect for private property. These have helped to create investor confidence and hence to attract the necessary levels of investment capital which the country has needed to implement its development programs and strategies.
Access to markets: Geographically, Mauritius is isolated from major markets. It has however, made good use of preferential trade access to the European Union markets. Access to these preferential markets was critical during the early stages of diversification. Later preferences under AGOA helped to entrench the new markets in the USA. The country has probably outgrown the stage where preferential markets made the difference between failed and successful economic transformation. But continued and fair access to regional and international markets will be needed to sustain and expand on the diversification level that has been reached to date.
Human resource factor: At independence, Mauritius did not have an established industrial culture to drive the industrialization process that the country had embarked on. Because it did not possess natural resources that would drive this transformation, the country understood the need to dependent on its people to play this role. Developing human capability has underlined programmes that target the building of greater capability in the service sector. The diverse background of the population has itself been of immense value in developing linkages for international trade and sourcing capital from countries in Asia and mainland Africa from which the citizens draw their ancestry.
2.2.3 Swaziland
Swaziland is a fairly diversified economy. Table 4 indicates that it is the fourth most diversified economy in the sub region after South Africa, Tanzania and Madagascar. Manufacturing is the main driver of the Swazi economy, accounting for 48% of GDP. The sector consists primarily of four export-oriented indus-tries: wood pulp production, drink processing, fruit canning, and sugar processing. It is estimated to have expanded by 0.5% in 2008, but contracted by 4% in 2009. Projections for 2010 point to a recovery with marginal growth of 1.5%. But this is expected to be followed by further decline in the subsequent years mainly as a result of possible second-round effects of the global recession.

53 Economic Report on Southern Africa 2011
With contributions from the agricultural sector, forestry and mining, the economy’s export product concen-tration is fairly moderate. Sugar which is the top export product, contributes 15% to total exports and soft drinks and foodstuff which rank second contribute 10.7% to the total exports. The top two export products, therefore, contribute 25.7% to total exports while 31 products account for 75% of the country’s exports. Trade is at the centre of its economic activities. But its export markets are highly concentrated as measured by an average export market index of 75.9 for the period 2005 to 2008. South Africa, its top export partner, accounts for 59.7% of its total exports and together with the EU make up 68.5% of the country’s exports.
SACU absorbs about 50% of its sugar, its major export, while the European Union, another major market, imports about 150,000 tons of the total sugar production. This works out to 16% of its total sugar exports. The EU alone contributes 30% of the industry’s export revenue because of the favourable sugar price which the Swazi growers have been able to obtain under preferential terms (World Bank, 2008).
The global crisis which has had a significant impact on the country’s wood and wood products sub-sector, underscores the country’s need to seek further horizontal and vertical diversification and, therefore, reduce on it export market concentration. Prior to 2009, Usutu Pulp was the main wood pulp processing com-pany and the largest employer in the country. But in January 2010, Sappi, the London-based management company of Usutu Pulp, wound up its operations resulting in a loss of 550 jobs. Swazi Paper Mills, another wood processing company, closed down resulting in a loss of 223 jobs while Peak Timbers, reduced its 170 work- force by half. Further job losses are likely to occur as the effects of the Usutu Pulp closure transmit through the economy. The cascading effect of the closure of Usutu Pulp is likely to be the closure of the many local companies that supplied the mill, loss of revenue by the Swaziland Electricity Company, which in 2009 lost about ZAR15.6 million, Swaziland Railways and a number of road transport companies.
With respect to the textile and apparel sector, an estimated 3 000 jobs were lost in 2009 in response to falling global demand and production cuts. The textile and apparel sector became eligible for the AGOA in 2000 which qualified it to enjoy the provisions provided under the arrangement. Although this resulted in the creation of 3,000 jobs in 2001, increased global competition brought about by the end of the Agreement on Textiles and Clothing (ATC) in early 2005, and the strong domestic currency reduced exports, set the stage for the economic downturn in the industry as far back as 2005-06.
The agricultural sector, which contributes 7% to GDP and 70% to employment, is responsible for the uti-lization of up to 80% of the country’s total land area (AfDB, 2010). The significance of the sector is that most of the country’s manufacturing activities are agricultural based. The two most important crops are sugarcane and maize both of which are grown commercially together with citrus, timber, and pineapples. Commercial farming activity takes place mostly in restricted private holdings.
Subsistence farming, on the other hand, occurs in communally owned land as generally low-productivity agriculture involving such crops as maize, cotton and tobacco. In December 2009, the government an-nounced agricultural policy reforms aimed at achieving greater food security, improved provision of farming implements and greater diversification of food and commercial crops. At the core of these reforms is the change to the country’s land tenure system.
54 Economic Report on Southern Africa 2011 Status and Prospects for Economic Diversification in Southern Africa
The tertiary sector, under which most service related activities fall, contributes approximately 38% of GDP. It comprises mainly finance, banking, transport and tourism. The tourism sub-sector which accounted for 7% of GDP in 2008 is considered as having great potential into which the economy can diversify. The World Travel and Tourism Council (WTTC), projects that the tourism sector is likely to grow at 5% and 3% growth in 2010 and 2011, respectively.
In order to assess Swaziland’s prospects for further diversification, it is necessary to examine briefly the processes that have driven economic development in the past and the current policies which are likely to shape its future direction. Swaziland’s economic development prior to and after independence in 1968 has had direct links to the South African economy. In 1960, Swaziland was given South Africa’s Com-monwealth quota for sugar. The investment for establishing the Swaziland sugar industry capability was provided by South Africa, which also managed the production and processing of sugar from the country. From this initial investment, South Africa continued to invest in the country in the textile industry, timber production and wood processing. Given the existence of apartheid induced economic sanctions, which were imposed against South Africa after the 1970s, Swaziland became an even more attracting destination for South African investment in various sectors including agriculture, manufacturing and tourism. For the manufacturing sector Swaziland provided an ideal destination from which South African companies could manufacture export products outside South Africa and, therefore, circumvent sanctions. The origins of the diversification of the Swazi economy, therefore, go directly back to South Africa’s active intervention in the economy and not to Swaziland’s own domestic economic policies. After South Africa’s independ-ence, growth in sugar exports to the European Union and later textile exports to the United States under AGOA have been driven largely by preferential treatment. But In 2006, the EU’s introduced reforms of its sugar market regime leading to a progressive reduction in the price of sugar obtained by growers and millers from the EU. The removal of these preferences also means increased competition from the non ACP sugar producing countries. Ultimately, however, the ending of these preferences provide Swaziland with a new challenge to develop its capacity to diversify its products and export markets in order for the economy to grow.
The source of Swaziland’s current economic difficulties can be traced back to the establishment of major-ity rule in South Africa in 1994. One of its effects was that it removed one of the main reasons for South Africa’s continued investment into the economy of Swaziland. This in turn, has been reflected in the progressive reduction in investment flows into the country. The current levels of investment show that Swaziland’s foreign direct investment (FDI) inflows are below the SADC average FDI as a percentage of capital formation. In addition FDI inflows of US$ 37.5 million recorded in 2007 placed Swaziland among the lowest in the Southern African region. As investment inflows have dwindled, the country’s capacity to continue to sustain viable levels of economic diversification have become weakened since investors are needed to bridge the current saving-investment gap. The country’s gross domestic savings rate stands at 13.78 % which amounts to only half of the SADC average recorded in 2008. At this level it is too low to drive a viable diversification programme.
Swaziland’s other problems that are adversely affecting investment into the productive sectors of the economy have to do with corruption and difficulty of conducting business. Corruption is perceived as
55 Economic Report on Southern Africa 2011
widespread in the country. Swaziland in 2009 ranked 79th out of 180 countries according to the Trans-parency International’s Corruption Perception index. This represented a worsening of its position of 72 reported in 2008. According to these findings, corruption is believed to be significant in the executive and legislative branches of government, and efforts to combat it are viewed as insufficient. The government enacted the Prevention of Corruption Law in 2007 and established the Anti-Corruption Commission. But effectiveness of both the law and the institution in tackling the scourge are doubtful as no complaints had been prosecuted by the end of 2009. A number of foreign and domestic businesses complain that corrup-tion and bribery influence their profits, contracts, and more importantly their investment decisions in the country. A significant complaint is that unqualified businesses routinely win contracts unfairly based on the owners’ relationships with government officials.
Corruption is compounded by bureaucratic inefficiencies which are thought to affect many aspects of the economy and discourage the development of vibrant economic activity. The World Bank’s 2010 Doing Business report ranked Swaziland 115 out of 183 for the overall ease of doing business. This represented a slight drop from the country’s position of 114th reported in 2009. A weak regulatory framework is cited in the report as a major bottleneck to doing business. Among the many challenges faced by the private sector in the country is how to bring about an enabling environment that can encourage investment and increase competitiveness, improve public finance management, remove administrative complexities, and encourage the respect for contracts and court enforcement of property rights by removing political interfer-ence. What comes out is that, although having a fairly diversified economic base, inefficient regulatory and legal frameworks are standing in the way of developing a dynamic economy based on private investment and production. Furthermore, they are undermining further diversification at a time when the collapse of companies in the wood processing sector is threatening to weaken the current diversification status of the country.
Swaziland’s current national policy agenda for sustainable social and economic development is contained in the National Development Strategy (NDS) which covers the period 1997 to 2022. This framework em-bodies the country’s long term vision to development and gives guidance to many government economic programmes and initiatives. In 2004, the government announced the Smart Programme on Economic Empowerment and Development (SPEED). The objective was to monitor the implementation of key gov-ernment programmes related to (a) a sustainable economy founded on fiscal discipline and good economic governance together with sound and proactive international trade policies, (b) regional development, (c) public service reforms, (d) human capital development including reform of the education system, health and HIV/AIDS and poverty reduction. Before that, government had developed the Poverty Reduction Strategy and Action Plan (PRSAP) which began with an intensive consultative process in 2001 leading to the 2002 production of an intermediate strategic document called the Prioritised Action Programme on Poverty Reduction. The final PRSAP was adopted in May 2007.
The Swazi government has recognized for a long time the presence of structural constraints to economic development and diversification. A number of additional reforms and initiatives have been formulated aimed at improving the country’s competitiveness. Among them are the Investor Roadmap, Industrial Policy, National Export Strategy (NES), Comprehensive Agricultural Strategy and the National Adaptation

56 Economic Report on Southern Africa 2011 Status and Prospects for Economic Diversification in Southern Africa
Strategy (NAS). The NAS which was launched in 2007, and is being implemented with the assistance of the European Commission (EC), is seen as a promising strategic framework under which a degree of economic diversification could potentially be achieved. Its major objective is to develop a strategy that will equip the country with the ability to respond to the EU sugar sector reforms and to limit their negative impact on the Swazi sugar industry and the economy as a whole. The EU support to this initiative is given as part of its pledge to assist countries affected by its sugar reforms to make the necessary adjustments. The strategy is introduced under four pillars, namely;
a. To support the restructuring needs of the sugar industry based on a programme that en-sures the implementation of ongoing productivity and efficiency improvements. This ef-fort should lead to the establishment of “Restructuring and Diversification Management Unit, (b) to help smallholder sugar cane farmers remain viable and financially stable,
b. To continue pursuing and enhancing access to preferential markets for sugar. The target markets for this are the EU and the regional markets in the Southern African sub region to which greater access can be attained by promoting regional integration and
c. To ameliorate the impact of EU sugar reforms on living standards. This involves minimizing de-terioration in the welfare of retrenched workers and ensuring sugar companies do not lose their capacity to continue to providing quality social services to their employees and adjacent communities.
The NAS has further identified actions in eight thematic areas which include the achieving of diversifica-tion within and outside the sugar industry. The initiative expects the industry to explore the possibility of generation electric energy from sugar and also to strengthen the value chains for other crops. Government, however, has realized that NAS is not sufficient to achieve the diversification which is widely acknowledged as necessary.
Other supplementary initiatives are, therefore, based on acknowledging the importance of the SMEs in stimulating growth and generating employment. Estimates show that SMEs make up about 33% of manufacturing and account for 56% of commerce in the country. The government in 2009 developed a comprehensive strategy aimed at promoting SMEs. The strategy renders support to smallholder sugar farmers through a guarantee scheme which helps them to secure access to credit by mitigating risks that are faced by banks lending to SMEs. The programme is funded by the EU under the National Adaptation Strategy and the scheme is managed by Nedbank, Finance Corporation (FINCORP) and the Swaziland Industrial Development Corporation (SIDC). In cooperation with the International Fund for Agricultural Development (IFAD), the government has also developed a rural financing pilot scheme involving a number of financial institutions to help SMEs access formal banking services. At the same time, the government has plans to recapitalise FINCORP in order to improve its capacity to meet the financing needs of the SME sector. The Swaziland Investment Promotion Authority (SIPA) working with the Ministry of Commerce has embarked on streamlining administrative, procedural and regulatory procedures in order to encour-age both domestic and foreign investment needed to stimulate growth. Other related activities which the government is pursuing are promoting value adding industries, establishing and promoting vertical
57 Economic Report on Southern Africa 2011
integration systems. In addition, there are ongoing efforts to develop industrial estates in parts of the country such as Matsapha, Mankayane, Ngwenya, Nhlangano and Sidvokodvo. These efforts to promote the productive side are being supplemented with government’s increased involvement in negotiating for increased market access for Swazi products.
In order to reduce all the various efforts noted above into one comprehensive diversification programme, the government of Swaziland has launched a study on the economic diversification of the country with financial assistance from the African Development Bank. The study which will commence in the course of 2011, will attempt to identify constraints to the broadening of the country’s economic base and how to increase its competitiveness in both traditional and emerging sectors and export markets. It is expected to give support to the country’s ongoing effort to restructure the economy based on a firm understanding of factors that can help drive diversification and the challenges that the country is likely to meet in diver-sifying the economy. The findings from this study are expected to influence the direction that the country will take in order to increase private sector investments, the production of traditional and non-traditional exports targeting traditional and new regional and global markets.
For Swaziland to prevent the erosion of past gains and achieve deeper economic diversification, it will need to face a number of challenges and constraints and quickly implement reforms that will help to create an environment that will support a wider range of economic activities. Particularly important will be the for-mulation and implementation of a comprehensive investment policy framework that can guide the country’s efforts in attracting new investors and retaining existing ones. The economic dominance of South African on the country in terms of goods and investment has its impact on the country’s diversification prospects. Long term economic sustainability and diversification efforts will be thwarted if a relationship based on dependence rather than complementarily continues to be maintained between South Africa and Swaziland.
2.2.4 Lessons from the experiences of South Africa, Mauritius and Swaziland
The three countries used in the study present three different levels of diversification with South Africa being far much diversified than Mauritius and Swaziland. But their individual paths to diversification present some lessons that can help other countries to move more resolutely on the path to Economic diversification.
A diversification policy and strategic framework is necessary: The experiences of South Africa and Mauritius indicate the importance of a clear policy, vision and strategy for achieving diversification. Di-versification will not come about by chance. It needs a clear and deliberate policy that the country pursues tenaciously over a long period of time. Mauritius with no natural resource endowments, limited access to capital and markets and a small private sector started its process of diversification on the strength of clear policies which were pursued over four decades albeit with some adjustments. Swaziland, on the contrary, has not diversified on the basis of a viable policy framework since the process was driven by South Africa. Consequently its diversification has not been robust and is subject to what happens in South Africa. By launching the Economic Diversification Study, Swaziland is attempting to build the basis on which to it can subsequently evolve a coordinated policy framework and strategy that will drive the country forward.

58 Economic Report on Southern Africa 2011 Status and Prospects for Economic Diversification in Southern Africa
In Mauritius some of government policy has been criticized because it has effectively amounted to offering protection of domestic markets from external completion while providing incentives for export enterprises. These incentives have strained public finances. Furthermore, there exist non-tariff barriers in the form of a large bureaucracy and import licenses on numerous products like circuit breakers and weighing scales which do not conform to the country’s regional and international trade commitments. Policy choices must be such that they are consistent with the general direction of promoting a viable economy that is able to attract investment.
Create institutions that will drive and sustain diversification: Policies and strategies alone are not suffi-cient. They must be supported by institutions that work to sustain the process. In the case of South Africa, Phoskor, Sasol, the IDC and the Department of Trade and Industry provide an example of such institutions.
Mauritius has relied heavily on the Export Processing Zone Authority to drive the diversification process at the initial stages and NPCC subsequently. What is important is not simply creating these institutions but also ensuring that they are sustained over time. Failure to sustain these supportive institutions may partly explain the general experience of volatility in the measurements of diversification observed in SADC. Volatility suggests that where gains are made towards improved diversification, reversals or back sliding can occur if the institutional support base is fragile and not able to sustain the movement towards deepening diversification.
Government must play a role in policy implementation: By establishing appropriate policies and creating the necessary supportive institutions, government performs its critical function in facilitating the deep-ening of diversification. Given a strong private sector, government’s role ends at policy formulation from where the private sector can then take things up as implementing agencies. But where the private sector is small and not strong government, as was the case with Mauritius at the beginning of diversification process, government may have to play role of actual implementer. The government in Mauritius is heavily involved in private companies through majority shareholding. It has equity interest in banking, insurance, telecommunication, commercial aviation, housing, real estate, restaurants, and entertainment activities. It also wields a monopoly on public utilities and casinos. Through its State Investment Corporation, which holds investments in about ninety companies out of a total of more than 5,000 across all economic sectors, it continues to be actively involved in these businesses. This degree of involvement has drawn criticisms from various sources who argue the state should not be this involved in the running of businesses. But it seems to have used this involvement to be in the driving seat of the process of diversifying the economy.
Externally driven diversification is not a basis for sustainable diversification: Swaziland’s experience of diversification indicates that for the process to be robust, it needs to be internally driven. The current dif-ficulties the country is facing in sustaining levels of diversification are directly associated with the change in the behaviour of South African investors on who are the core of the country’s private sector.
Small and Medium Scale Enterprises should become active players in driving diversification: For most of the countries in the sub region, a significant part of the country’s economic activities are carried out by small and medium scale enterprises. For this reason, Swaziland’s new approach to diversification includes

59 Economic Report on Southern Africa 2011
SMEs as key players. Other countries should also explore the opportunity that SMEs can offer as the agents for promoting horizontal diversification and some extent even vertical diversification.
Natural resource wealth must be harnessed properly for it to drive economic diversification: South Af-rica has used its natural wealth well to drive horizontal and vertical diversification. It has been the spring board to manufacturing initially through beneficiation. The proceeds from its mineral wealth have been used to finance economic activities making it possible for the economy to expand into other sectors such as services. But natural resource wealth can be neutral on the diversification process depending on how it is managed and utilised. Mineral rich countries in the region like Zambia, DRC and Botswana need to effectively harness their mineral wealth to drive diversification as Botswana and to some extent Zambia are beginning to do. The South African experience can, for them, be a source of inspiration. Mauritius which lacks natural resource wealth has taken a path to diversification which has not needed to depend on natural resources wealth offers the alternative model which the likes of Malawi and Lesotho may wish to examine.
Access to regional and international markets is essential: The experience of Swaziland shows that trade openness, in itself, will not necessarily facilitate the achievement of diversification. On the contrary, it may simply expose a country to externally induced fluctuations and volatility. But in general unimpeded access to regional and international markets is essential. Trade barriers whether at the international or regional levels impede the achievement of diversification. Without the preferential EU markets provided in the early years of implementing the export oriented industrialization strategy, which was the fore runner to the diversification strategy, Mauritius’ path to diversification might have been different. In the case of Swaziland, the removal of preferences on sugar by the EU is a threat to national income which has become a big impetus for seeking diversification. South Africa, on its part has demonstrated how market dominance can help the expansion of the export basket. Its control over the sub regional market through the SADC protocols and its expansion into the world market through bi lateral trade agreements with the EU, United States of America, China and India continue to give it a sound base for its diversification of its exports.
Technological innovation and education is needed to build capacity: Expanding an economy into new sectors calls for new skills and competences. When an economy is concentrated, it tends to build over-specialization around the dominant sector or product. This is not easily transferred to new sectors and activities. South Africa and Mauritius have had to develop the capacity of their respective labour forces by strengthening tertiary education, building technical skills in target sectors and encouraging the develop-ment of research and development activities.
Governance and stability are prerequisite for investment. Mauritian capital investment problem was resolved partly because its ability to attract investors due its stable democracy and accountable govern-ment. At a time when most African governments were experimenting with socialist inspired dictatorship, Mauritius stood out as a democracy. This made it a more attractive destination of FDI which in turn financed the country’s ambitious economic development programmes. South Africa’s apartheid system was source of apprehension among investors until 1980 when the new South Africa became a huge magnet for investment into the SADC region. In the absence of natural resource wealth, poor governance almost
60 Economic Report on Southern Africa 2011 Status and Prospects for Economic Diversification in Southern Africa
certainly dries up capital inflows. But in the face of natural wealth, poor governance is likely to give in to resource wastage and corruption which redirects resources away from diversification.
Infrastructure development is a key to both production and trade: South Africa diversification thrives on the back of very developed infrastructure which enables the effective delivery of goods and services within the country and into the regional and international market. In contrast, inter country trade among certain members of SADC is rendered difficult by access problems. Trade between Zambia and Angola, for instance, suffers at the hands of poor road and rail links. Developing sound infrastructure is one of the most important requirements that countries in the region ought to meet in order to drive diversification.
2.3 Conclusion and recommendations
2.3.1. Summary of findings
This report shows that countries of the Southern African sub region are mostly undiversified. Although the sub region as whole has made progress towards reducing the levels of economic concentration, the regional trend is being driven by South Africa. Most countries show various levels of export product and export market concentrations. They are also equally dependent largely on the export of mineral or agricultural commodities which are the lower end of the value chain.
The experience of South Africa has demonstrated that natural resource wealth can be used effectively to drive the diversification process as long as this is accompanied by appropriate diversification policies and supportive institutions. These policies should define how other critical ingredients like human resources development, financing and investment, infrastructure, private sector fit into the strategic framework of diversifying the economy. The experience of Mauritius shows an alternative path to the achievement of diversification which does not rely on the contribution of resource wealth. It demonstrates that political stability and governance provide a necessary requirement for attracting scarce investment capital.
Mauritius also shows that focused policies which must be implemented tenaciously against the background of government’s commitment to achieving diversification are essential. The strategy for gaining markets, developing capacity both of institutions and people, improving infrastructure and attracting investors are all aspects of this broad policy.
Clearly there are several paths that countries can take in terms of the specific sectors that are chosen to drive horizontal or vertical diversification. But there appears to be no substitute for sound policies and a commit-ment by national governments to see these policies through over a number of years. If policy measures are not well coordinated uncoordinated, then countries risk the possibility of regressing in the achievements. This will delay the progress in building ultimately delay or thwart the building of a diversified economy.

61 Economic Report on Southern Africa 2011
2.3.2 Overall policy recommendations
Deepening diversification in the Southern African sub region requires interventions to be initiated and carried through at four different levels. The first involves the individual countries themselves, the second is at the level of SADC, the third is at the continental level and the third is at the international level involving various forms of international cooperation including South- South and triangular cooperation.
2.3.3 At the National Level
Interventions at the national level are primary since the ultimate responsibility of diversifying a country lies with government and its people. This report recommends that national governments should undertake the following actions:
Prioritize economic diversification: Economic diversification does not occur by chance but only as a prod-uct of a decision to achieve it. Countries with high levels of economic concentration or single commodity countries must prioritize economic diversification as a matter of national policy.
Develop a comprehensive policy framework for economic diversification: The deepening of economic diversification must be reduced to a comprehensive policy framework which defines the non traditional target sectors that the economy is seeking to develop into and the strategies that will achieve it. Countries wishing to advance diversification must therefore develop viable policies for diversification which will direct how the country will diversify.
Government must make financial commitments to diversification by budgeting for it: Financial resources targeting economic diversification programmes must be provided for in national budgets and long term development plans. This will increase the prospects of achieving greater success in achieving diversification.
Establishing capacity building programmes: Countries must embark on equipping people with the skills necessary to succeed in the target non traditional sectors. This should be coupled with building the capacity of supportive institutions. Training of technology and engineering skills and building capacity for research and development need to be encouraged.
Provision of incentives: National governments should work to create incentives for the private sector and entrepreneurs, so that they might encourage the injection of labour and capital into new areas of knowledge, technology and sectors that have the capacity to sustain real growth.
Directing investment into sectors with comparative advantage: National governments should direct investments into sectors and industries where there is a comparative advantage to enhance national pro-ductivity and competitiveness.
Deepening of financial sector: Countries must embark on developing financial sector reforms which deepen the financial sector through the creation of effective financial institutions like capital markets ,

62 Economic Report on Southern Africa 2011 Status and Prospects for Economic Diversification in Southern Africa
development finance institutions, venture capital institutions which are able to provide long term finance to new business ventures.
Optimize the exploitation and use of natural resources: Countries with natural resource endowments must commit to the effective management of natural wealth to drive horizontal and vertical diversification and finance diversification of economic activities into other sectors of the economy.
At the Sub regional Level
Sub regional institutions have a critical role to play in promoting diversification by:
Spearheading the development of regional infrastructure: The successful completion of SADC infrastruc-ture projects will be an important contribution at the sub regional level. North-South Corridor and the Southern African Power Pool are part of the efforts that are being undertaken in this regard.
Encouraging regional trade through the removal of non tariff barriers: SADC must continue to improve regional integration especially through the removal of non tariff barriers which still stand in the way of improved trade in the sub region. It should also support the achievement of the full integration of SADC, COMESA and EAC into one comprehensive Free Trade Area to provide a wider market space to support new products produced at the national level.
Financing regional projects which encourage greater trade among countries in the sub region: Sub re-gional financial institutions such as the Development Bank of Southern Africa should be made to play a more active role in financing economic diversification initiatives. Already such funding facilities like the NEPAD infrastructure Project Fund, Pan African Infrastructure Fund and others are available and can be rechanneled to support specifically identified diversification projects.
Supporting national capacity building programmes: The SADC secretariat and the Economic Commis-sion for Africa, Southern Africa Office can support national institutions and skills building programmes by providing technical expertise in the preparation and execution of capacity building programmes.
At the Continental Level
At the African continental level a greater commitment to supporting diversification should take the form of:
Financing diversification efforts undertaken at the national level: A good example of this is the African Development Bank assistance to the Swaziland Economic Diversification Study. The African Union and the NEPAD and the Economic Commission for Africa can support more national programmes of this kind.

63 Economic Report on Southern Africa 2011
Assisting to conclude international trade agreements: The African Union can seek play a more proactive role in breaking the stalemate in the Doha Round over market access for agricultural products and also in negotiating economic partnership agreements.
Implications for cooperating partners
Greater commitment to South-South Cooperation and Triangular Cooperation: Economic diversification effort can benefit from the strengthening of South-South Cooperation and Triangular Cooperation. The sub region needs to deepen cooperation which has unfolded under the China-Africa Cooperation framework, the India–Africa Forum, the Africa-Turkey Partnership Declaration and the Korea Initiative for Africa’s Development. All these frameworks present a window of opportunity for cooperation with Africa in a wide range of areas including international trade, investment, infrastructure, research and development, technology transfer, energy and many others. This cooperation can greatly benefit the sub region’s pursuit of deeper integration and development in general.
Intensification of triangular cooperation is another important area where the traditional cooperating partners can work with the new donors such as China, India and Brazil to advance the diversification of economies in the sub region in terms of widening their products and markets. In the sub region, Germany and Brazil are working together to strengthen the metrology institution in Mozambique. Norway and Brazil are promoting the institutional capacity of public administration institutions in Angola. The scope to use the triangular cooperation to facilitate diversification appears to be available and only require to be harnessed to the benefit of the region and its member states.
Support in international trade negotiations: The support of donors in building Africa’s productive and trade capacity can lead to a win-win situation in concluding the Doha Round of Negotiations and the EPAs. The Doha Round has the potential to contribute to addressing Africa’s supply side constraints, improving its competitiveness and raising its voice in international trade negotiations. Access for agricultural products into international markets will help both horizontal and vertical diversification through strengthening the agricultural value chain.


65 Economic Report on Southern Africa 2011
References
Ali, Ridwan, Alwang, Jeffrey, and Siegel, Paul: 1991,“Is Export Diversification the Best Way to Achieve Export Growth and Stability? A Look at Three African Countries, The World Bank Policy Working Papers, No. 729, Washington, DC, USA
AfDB, 2011, Economic Diversification Study of Swaziland. Overview, 2011, Mbabane, Swaziland
AfDB, 2010, The African Development Bank Group in Southern Africa: Fostering Growth and integration, AfDB Group, 2010, Tunis, Tunisia
Ben Hammouda, H., Karingi, S.N., Njuguru, A.E. and Sadni-Jallab, M, 2006, Diversification. Towards a New Paradigm for Africa’s Development. Africa Trade Policy Centre. Work in Progress Number 35. Economic Commission for Africa, May 2006, Addis Ababa, Ethiopia
BuaNews (Tswane), 2009, South Africa: Public to comment on Draft beneficiation strategy, March,2009, Johannesburg, South Africa
Bureau of African Affairs, 2010, Background Note; South Africa. Government of South Africa Webpage,Washington DC, USA
Chamberlin, G.,2010, “Economic Review: March 2010.” Economic and Labour Market Review, 4(2)6-12, Office of National Statistics, London, United Kingdom
Chisnall, Peter, 1995, Strategic Business Marketing, Prentice Hall, New Jersey, USA
Commonwealth Secretariat, 2011, Mauritius Economy. Commonwealth Secretariat Webpage, London, United Kingdom http://www.thecommonwealth.org/YearbookInternal/138791/economy/
Cosbey, A, 2006, Economic Diversification, Sustainable Development and Impacts of Response Measures. Expert Meeting on Economic Diversification, Implication of Article 4, Paras 8 and 9 of the Convention. Bonn, May 16-17. Bonn, Germany
Economic Commission for Africa, 2004 Trade liberalization and Development: Lessons for Africa. ATP Work in Progress Paper Series No 6. African Trade Policy Centre , Addis Ababa, Ethiopia
Economic Commission for Africa and African Union, 2007 Economic Report for Africa: Accelerating Africa’s development through Diversification, Addis Ababa, Ethiopia
Fairhead, J.: 2008, Tackling the Natural Resource Trap. Institute of Development Studies, Issue Number 03.5. University of Sussex, March, 2008. Sussex, United Kingdom

66 Economic Report on Southern Africa 2011 Status and Prospects for Economic Diversification in Southern Africa
Humphreys, M., Sachs, J. and Stiglitz, J.E., 2007, Escaping the Resource Curse. Columbia University Press, New York, USA
Jain, Subhash, 1997, Marketing Planning and Strategy South-Western Pub. Co, Cincinnati, USA
Jallab, M.S, 2007. Diversification in Africa: Towards a New Paradigm. TFED-UNECA Addis Ababa, Ethiopia
Jaffe, S., 2005, Malawi Tobacco Sector: Standing on One Strong Leg is Better than None. Africa Regional Working Paper Series, June 2005, World Bank, Washington, DC, USA
Jugnauth, P.K, 2010, Facing the Euro Zone Crisis and Restructuring for Long Term Resilience. Ministry of Finance and Economic Development. Government of Mauritius, August,2010, Port Louis, Mauritius
Minard, J. and Cheun, E.R.P, 2011, Economic Freedom Pays Dividends in Mauritius. The African Execu-tive, January, 2011, Nairobi, Kenya
http://www.africanexecutive.com/modules/magazine/articles.php?article=5633
Ministry of Commerce, Trade and Industry, 2011, Multi- Facility Zones : What are They? Government of the Republic of Zambia, March 2011, Lusaka, Zambia
Restructuring and Diversification Management Unit, 2011, The NAS. The Sugar Sector in Swaziland. Government of Swaziland Mbabane, Swaziland
Rudiger, A, 2008, Strategies for Economic Diversification in resource rich countries. OECD Economics Department, Paris, France
Shediac, R., Abouchakra, R., Maujaes, C.N. and Najjar, 2008, M.R.: Economic Diversification. The Road to Sustainable Development. Booz and Company.Abu Dhabi, UAE
South Centre, 2005, Problems and Policy challenges faced by the commodity Dependent Developing Countries. Trade Related Agenda Development Equity (TRADE) Analysis. Series,November 2005, Geneva, Switzerland
Trade Chakra, 2008, Mauritius Government Role in Economic Development http://www.tradechakra.com/economy/mauritius/mauritius-government-role-in-economic-301.php
United Nations Office of the Special Advisor on Africa (OASSA), NEPA, OECD and Africa Investment Initiative, 2010, Economic Diversification. A Review of Selected Countries. OECD and United Nations OASAA, New York, USA

67 Economic Report on Southern Africa 2011
Venta, Irma, 2008, Beneficiation Kicks off in Botswana. More to Come Says Mogae. Pre-cious Minerals, Feb 2008, Johannesburg, South Africa, http://www.miningweekly.com/article/beneficiation-kicks-off-in-botswana-more-to-come-says-mogae-2008-02-15
Winfield, R. G. and Cury, S. J., 1991, Success in Investment, John Murray Publishers Ltd, London, United Kingdom
World Bank, 2011, Swaziland: trade at glance, World Trade Indicators 2009/10, World Bank Publications, Washington DC, USA
Zhang, Le-Yin: 2006, Economic Diversification and sustainable development: Linkages and barriers. University of London, London, United Kingdom