economic review of pennsylvania 2007 review of pennsylvania . 2007. c. e. n. ... the largest job...
TRANSCRIPT

Economic Review of Pennsylvania
2007
CCeenntteerr ffoorr WWoorrkkffoorrccee IInnffoorrmmaattiioonn && AAnnaallyyssiiss
((CCWWIIAA))
July 2008

This page left intentionally blank
2

Contents
Page Preface 4 Summary 5
I. Recent Trends and Developments 7
1) Labor Force Statistics 8 2) Industry Employment 10
3) Wages 12
4) Economic Indicators 14
II. Long-term Trends and Outlook 20
5) Demographics 21 6) Projections 24
Conclusion 30
3

Preface
Pennsylvania’s future depends upon the development of a workforce able to compete in today’s global economy. Understanding the potential obstacles the future workforce will have to overcome is important in developing policies and strategies for Pennsylvania to remain economically competitive. Workers from the baby-boom generation are moving into their 60s and are retiring in large numbers. They are taking with them key skills that kept industry growing and prosperous. Far fewer youth are available to enter the labor market, forcing greater efficiencies and competition for key skills. This report examines the demographic, economic, and labor market developments unfolding in Pennsylvania. While this report contains an analysis of Pennsylvania’s entire workforce composition, it also focuses on the future trends of the commonwealth’s economy, industries, and occupations. (This report was submitted to the Employment and Training Administration, U.S. Department of Labor, as required by the Core Products and Services Grant.)
4

Summary
• Pennsylvania’s employment reached 6,013,000 in 2007, an all-time high. The unemployment rate decreased to 4.4 percent in 2007, it’s lowest level since 2000.
• The Education & Health Services and Professional & Business Services
industry sectors have posted the largest job gains over the past year, tallying nearly 70 percent of all jobs created in Pennsylvania.
• The highest wages within Pennsylvania are found in the Financial
Activities, Information, and Mining industry sectors. However, the Professional & Business Services industry sector pays more than $13,000 dollars above the statewide average industry wage (nearly $41,000).
• Pennsylvania’s average weekly number of continued claims increased for
the first time in three years, as the state’s economic expansion came to an end. The state’s average weekly number of initial claims increased to its highest level since 2003 as an economic slowdown began.
• Pennsylvania’s diffusion, coincident, and leading indexes all show a
slowing of the state’s economy heading into 2008.
• Pennsylvania increased the minimum wage twice in 2007: from $5.15 an hour to $6.25 on January 1, and to $7.15 on July 1.
• Over the next ten years, Pennsylvania’s population is projected to grow by
just two percent. In comparison, the nations population will grow by nearly nine percent.
• Pennsylvania’s population is growing older. The number of
Pennsylvanians age 65 and over was 1.9 million in 2007. The state’s percentage of those age 65 and over is the second highest in the nation (15.3 percent). Florida has the highest percentage of those 65 and over.
• Beginning around 2015, Pennsylvania’s total working age population
(those age 25 to 64) will be less than the year before until at least 2029. Therefore, there will be workers shortages in the coming years and some areas, industries, and occupations will be affected sooner and harder than others.
• The proportion of minorities in the labor force will grow because of
immigration and higher labor force participation rates
• Women will dominate Pennsylvania’s labor force growth through 2014.
5

• Pennsylvania’s Education & Health Services, Professional & Business
Services, and Leisure & Hospitality industry sectors will account for nearly 90 percent of all annual employment growth through 2014.
• The education and health care industries will dominate growth.
• Jobs in most major occupational groups will be plentiful in the years to
come for current and future labor marker participants. Modest economic growth coupled with an aging workforce will create opportunities for anyone seeking a job. The best paying jobs will go to hose achieving more than a high school education.
6

Recent Trends and Developments
7
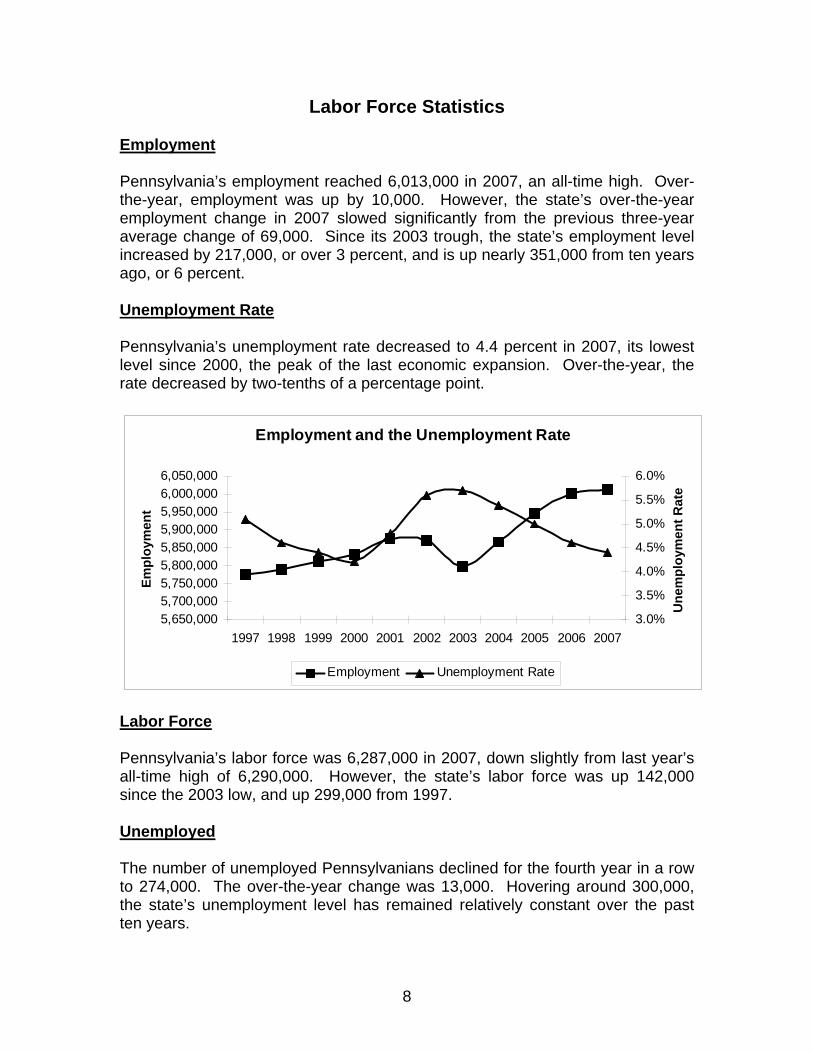
Labor Force Statistics Employment Pennsylvania’s employment reached 6,013,000 in 2007, an all-time high. Over-the-year, employment was up by 10,000. However, the state’s over-the-year employment change in 2007 slowed significantly from the previous three-year average change of 69,000. Since its 2003 trough, the state’s employment level increased by 217,000, or over 3 percent, and is up nearly 351,000 from ten years ago, or 6 percent. Unemployment Rate Pennsylvania’s unemployment rate decreased to 4.4 percent in 2007, its lowest level since 2000, the peak of the last economic expansion. Over-the-year, the rate decreased by two-tenths of a percentage point.
Employment and the Unemployment Rate
5,650,0005,700,0005,750,0005,800,0005,850,0005,900,0005,950,0006,000,0006,050,000
1997 1998 1999 2000 2001 2002 2003 2004 2005 2006 2007
Empl
oym
ent
3.0%
3.5%
4.0%
4.5%
5.0%
5.5%
6.0%
Une
mpl
oym
ent R
ate
Employment Unemployment Rate
Labor Force Pennsylvania’s labor force was 6,287,000 in 2007, down slightly from last year’s all-time high of 6,290,000. However, the state’s labor force was up 142,000 since the 2003 low, and up 299,000 from 1997. Unemployed The number of unemployed Pennsylvanians declined for the fourth year in a row to 274,000. The over-the-year change was 13,000. Hovering around 300,000, the state’s unemployment level has remained relatively constant over the past ten years.
8

Labor Force and Unemployment
5,950,0006,000,0006,050,0006,100,0006,150,0006,200,0006,250,0006,300,0006,350,000
1997 1998 1999 2000 2001 2002 2003 2004 2005 2006 2007
Labo
r For
ce
050,000100,000150,000200,000250,000300,000350,000400,000
Une
mpl
oyed
Labor Force Unemployed
Labor Force Participation Pennsylvania’s labor force participation rate was 64.5 percent in 2007, essentially unchanged from the previous year and identical to the reading in 1997. The rate peaked in 2002 at 65.8 percent. (The rate is a measure of people who are working or who want to work. It goes up when employment increases and or the perception that there is work rises.) In 2007, the male labor force participation rate was 71.4 percent, down slightly from the previous year, and the female rate was 58.1 percent, up slightly from 2006. Both were also down from their peaks in 2002.
Labor Force Participation Rates
50.0%
52.5%
55.0%
57.5%
60.0%
62.5%
65.0%
67.5%
70.0%
72.5%
75.0%
1997 1998 1999 2000 2001 2002 2003 2004 2005 2006 2007
Labo
r For
ce P
artic
ipat
ion
Rat
e
Participation Rate Male Participation Rate Female Participation Rate
9
Industry Employment
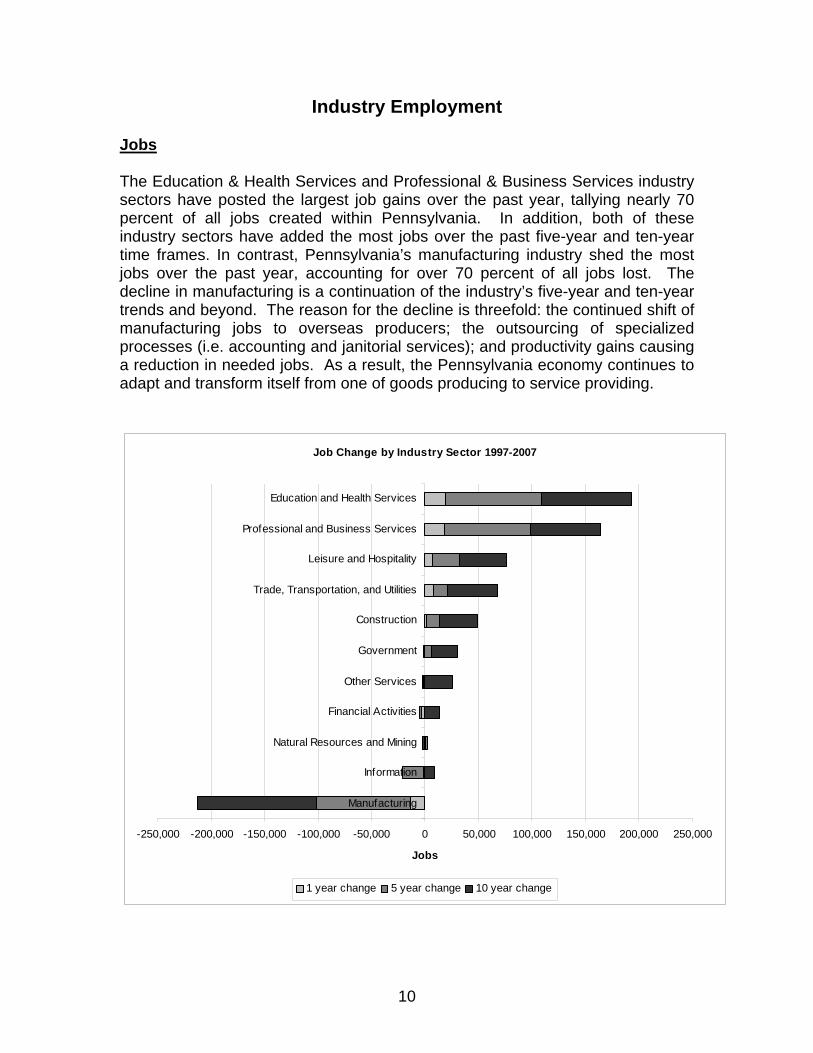
Jobs The Education & Health Services and Professional & Business Services industry sectors have posted the largest job gains over the past year, tallying nearly 70 percent of all jobs created within Pennsylvania. In addition, both of these industry sectors have added the most jobs over the past five-year and ten-year time frames. In contrast, Pennsylvania’s manufacturing industry shed the most jobs over the past year, accounting for over 70 percent of all jobs lost. The decline in manufacturing is a continuation of the industry’s five-year and ten-year trends and beyond. The reason for the decline is threefold: the continued shift of manufacturing jobs to overseas producers; the outsourcing of specialized processes (i.e. accounting and janitorial services); and productivity gains causing a reduction in needed jobs. As a result, the Pennsylvania economy continues to adapt and transform itself from one of goods producing to service providing.
Job Change by Industry Sector 1997-2007
-250,000 -200,000 -150,000 -100,000 -50,000 0 50,000 100,000 150,000 200,000 250,000
Manufacturing
Information
Natural Resources and Mining
Financial Activities
Other Services
Government
Construction
Trade, Transportation, and Utilities
Leisure and Hospitality
Professional and Business Services
Education and Health Services
Jobs
1 year change 5 year change 10 year change
10

Jobs Detail The specific industries in the Education & Health Services and Professional & Business Services sectors seeing the highest volume job growth over the past ten years were: Management of Companies & Enterprises, Nursing & Residential Care, Offices of Physicians, Services to Buildings & Dwellings, Computer Systems Design & Related Services, and Colleges & Universities. These industries reflect the demand for the efficient management of businesses, the growing health care needs of an aging population, the ever-increasing importance of technology to the state’s economy, and the current and future labor force participants’ constant demand for education in order to compete in the global market place.
Education & Health Services and Professional & Business Services Growth Industries
-5,000 0 5,000 10,000 15,000 20,000 25,000 30,000 35,000 40,000 45,000 50,000
Home health care services
Accounting and bookkeeping services
Architectural and engineering services
Business support services
General medical and surgical hospitals
Child day care services
Legal services
Elementary and secondary schools
Employment services
Scientif ic research and development services
Management and technical consulting services
Colleges and universities
Computer systems design and related services
Services to buildings and dw ellings
Off ices of physicians
Nursing and residential care facilities
Management of companies and enterprises
Jobs
1 year change 5 year change 10 year change
11

Wages Industry Wages The highest wages within Pennsylvania are found in the Financial Activities, Information, and Mining industry sectors. However, over recent years, relatively minor job growth has been created in these industries. The Professional & Business Services Industry, while not the highest paying industry, pays more than $13,000 dollars above the statewide annual average industry wage (nearly $41,000), and is seeing rapid job growth. The Manufacturing and Construction industries also pay above average wages. Education & Health Services, another high growth industry sector, pays slightly lower wages than the statewide average, but contains many high paying occupations.
Average Annual Wage by Industry 2006
$0 $10,000 $20,000 $30,000 $40,000 $50,000 $60,000 $70,000
Leisure and Hospitality
Other Services
Trade, Transportation, and Utilities
Educational and Health Services
All Industries
Construction
Manufacturing
Professional and Business Services
Mining
Information
Financial Activities
Average Annual Wage
12
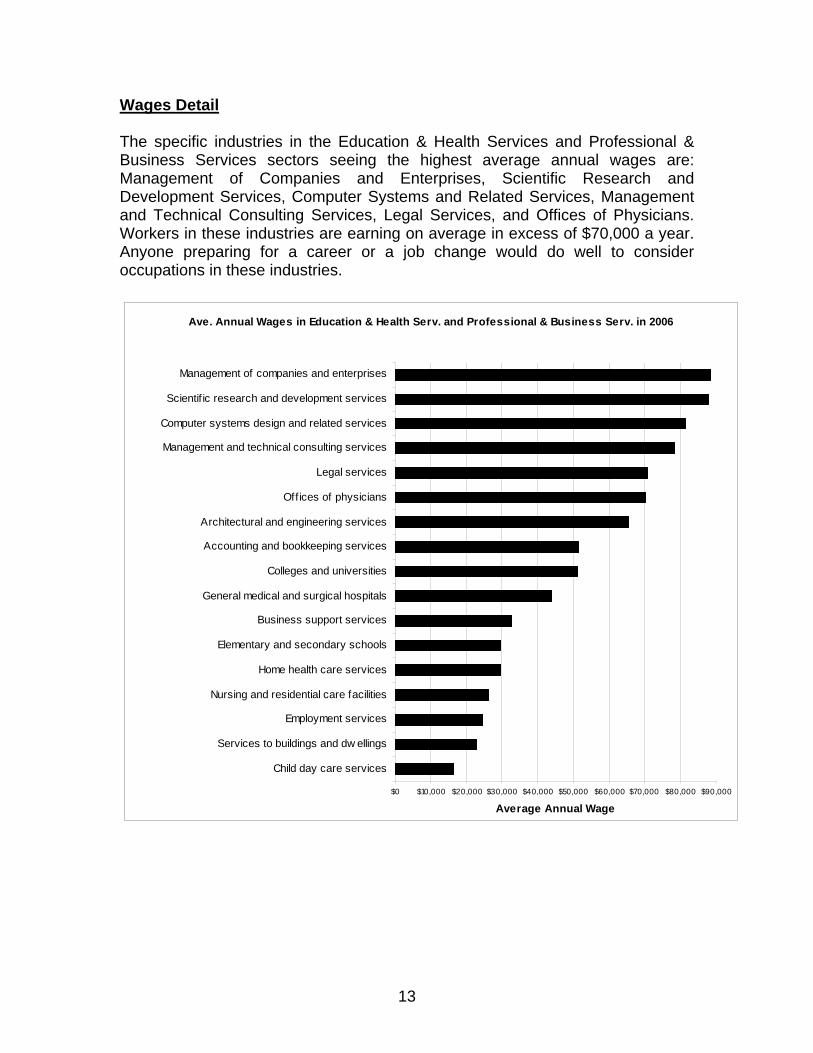
Wages Detail The specific industries in the Education & Health Services and Professional & Business Services sectors seeing the highest average annual wages are: Management of Companies and Enterprises, Scientific Research and Development Services, Computer Systems and Related Services, Management and Technical Consulting Services, Legal Services, and Offices of Physicians. Workers in these industries are earning on average in excess of $70,000 a year. Anyone preparing for a career or a job change would do well to consider occupations in these industries.
Ave. Annual Wages in Education & Health Serv. and Professional & Business Serv. in 2006
$0 $10,000 $20,000 $30,000 $40,000 $50,000 $60,000 $70,000 $80,000 $90,000
Child day care services
Services to buildings and dw ellings
Employment services
Nursing and residential care facilities
Home health care services
Elementary and secondary schools
Business support services
General medical and surgical hospitals
Colleges and universities
Accounting and bookkeeping services
Architectural and engineering services
Off ices of physicians
Legal services
Management and technical consulting services
Computer systems design and related services
Scientif ic research and development services
Management of companies and enterprises
Average Annual Wage
13

Economic Indicators
Weekly Claims Pennsylvania’s average weekly number of continued claims increased for the first time in three years, as the state’s economic expansion came to an end. Thus, when individuals are laid off they are having a harder time finding employment than the previous year. The state’s average weekly number of initial claims increased to its highest level since 2003 as an economic slowdown began.
Weekly Average Initial and Continued Claims for Unemployment Compensation
0
50,000
100,000
150,000
200,000
250,000
1997 1998 1999 2000 2001 2002 2003 2004 2005 2006 2007
Con
tinue
d C
laim
s
0
5,000
10,000
15,000
20,000
25,000
30,000
Initi
al C
laim
s
Continued
Initial
Diffusion Index The Diffusion Index is a measure of the proportion of industries that have higher or lower employment levels over a year period. A value over 50 indicates that the number of industries having higher employment levels is greater than the number of industries having lower employment levels as compared to the previous year. Pennsylvania’s diffusion index was 50 in 2007, its lowest reading since 2002 and down from 55 in 2006. It is likely that the index will continue to trend down, below a reading of 50 as the economic slowdown takes hold, denoting that the number of industries having lower employment levels is greater than the number of industries having higher employment levels, as compared to the previous year.
14

Pennsylvania Diffusion Index, 1997-2007
20
30
40
50
60
70
80
1997 1998 1999 2000 2001 2002 2003 2004 2005 2006 2007
Inde
x
Coincident Index Pennsylvania’s coincident index is a measure of current economic activity. Individual economic indicators often produce conflicting signals on the health of the economy. For example, one indicator can be showing a gain while another reflects a loss. The purpose of the coincident index is to suppress these conflicting signals by combining a set of key measures to reflect the overall economic trend. The index is constructed from three monthly data series (payroll employment, average hours worked in manufacturing, and the unemployment rate) and one quarterly series (wage and salary disbursements). A decline in the index signals a slowdown or possibly a recession. Pennsylvania’s annual average coincident index has shown a steady increase in recent years, reflecting economic health and growth.
Pennsylvania Coincident Economic Indicators: Annual Average
100
110
120
130
140
150
160
1997 1998 1999 2000 2001 2002 2003 2004 2005 2006 2007
Inde
x
Source: Federal Reserve Bank of Philadelphia
15

However, the quarterly average of the coincident index, a more timely reading of the measure, shows a slowing of the state’s economy. The quarterly coincident index declined in the first quarter of 2008; the first time it has done so since the first quarter of 2003. The last time this measure declined after a period of trending up was in the first quarter of 2001.
Pennsylvania Coincident Economic Indicators: Quarterly Average
100
110
120
130
140
150
160
Mar-01
Jul-0
1
Nov-01
Mar-02
Jul-0
2
Nov-02
Mar-03
Jul-0
3
Nov-03
Mar-04
Jul-0
4
Nov-04
Mar-05
Jul-0
5
Nov-05
Mar-06
Jul-0
6
Nov-06
Mar-07
Jul-0
7
Nov-07
Mar-08
Inde
x
Source: Federal Reserve Bank of Philadelphia Leading Index Pennsylvania’s leading index is a forecast of economic activity. The purpose of the index is similar to that of the coincident index (see above) with an added emphasis on reflecting where the economy is headed. The leading index is constructed from the state’s current economic activity index, housing permits, initial unemployment claims, the index of vendor delivery time from the Philadelphia Fed’s Business Outlook Survey, and the spread between the yields on 10-year Treasury bonds and the fed funds rate. In 2002, Pennsylvania’s annual average leading index turned up, signaling that an economic recovery was beginning. While slowing in the last three years, the index has moved steadily upwards from the 2001 trough.
16

Pennsylvania Leading Economic Indicators: Annual Average
200
250
300
350
400
450
500
1997 1998 1999 2000 2001 2002 2003 2004 2005 2006 2007
Inde
x
Source: Federal Reserve Bank of Philadelphia However, the quarterly average of the leading index, a more timely reading of the measure, shows a slowing of the state’s economy. The quarterly leading index declined in the last quarter of 2007; the first time it has done so since the fourth quarter of 2001. The last time this measure declined after a period of trending up was in the third quarter of 2000.
Pennsylvania Leading Economic Indicators: Quarterly Average
200
250
300
350
400
450
500
Mar-01
Jul-0
1
Nov-01
Mar-02
Jul-0
2
Nov-02
Mar-03
Jul-0
3
Nov-03
Mar-04
Jul-0
4
Nov-04
Mar-05
Jul-0
5
Nov-05
Mar-06
Jul-0
6
Nov-06
Mar-07
Jul-0
7
Nov-07
Mar-08
Inde
x
Source: Federal Reserve Bank of Philadelphia
17

Average Weekly Hours in Manufacturing Since bottoming out in 2003, Pennsylvania’s average weekly hours rose for the fourth year in a row. Average weekly hours is a leading indicator, often providing the direction of the state’s economy. As the economy begins to grow out of a recession (in 2004), employers will tend to hold off on hiring new workers until they are more confident that economic growth is improving and will instead have their existing employees work more hours. As the economy continues to improve, eventually businesses will be forced to add more workers, and this increase in employment will reinforce the positive trend in economic growth (in 2005 to 2006). In contrast, if the economy is just beginning to slow down, employers wishing to maintain employee loyalty will try to keep their workers by reducing hours worked, rather than immediately laying-off workers (in 2001). If the slowdown deepens, then eventually businesses are forced to lay off workers, which reinforces the negative trend in economic growth (in 2002 to 2003).
Average Weekly Hours in Manufacturing, 1997 - 2007
39.0
39.5
40.0
40.5
41.0
41.5
42.0
1997 1998 1999 2000 2001 2002 2003 2004 2005 2006 2007
Hou
rs
Minimum Wage Change Pennsylvania increased the minimum wage twice in 2007: from $5.15 an hour to $6.25 on January 1, and to $7.15 on July 1. The two minimum wage increases in 2007 directly affected 132,800 Pennsylvania workers (the difference between those earning below $7.15 in 2006 and 2007), or nearly four percent of those who make hourly rates and over two percent of total employment.
18

Pennsylvania’s earners at or below the minimum wage tend to be from one of the following groups: female, white, 16- to 24-year-olds, high school graduates or less than a high school diploma, or never married. The state’s unemployment rate among females increased 0.2 percentage points from 4.3 percent to 4.5 percent from 2006 to 2007. Likewise, the unemployment rate increased among 16- to 24-year-olds 1.7 percentage points from 7.3 percent to 9.0 percent. For workers with less than a high school diploma, the unemployment rate went up one percentage point from 7.8 percent to 8.8 percent. The industries most likely to employ workers at or below the minimum wage are leisure and hospitality, and retail trade. Part-time workers make up the majority of those hourly workers earning the minimum wage. Pennsylvania industry data shows a less than one percent decline in retail trade and manufacturing employment over the short term (1 to 3 months later) after January and July 2007. Leisure and hospitality employment increased by less than one percent (1 to 3 months later) after January and July 2007. The 1997 Pennsylvania minimum wage increase coincided with very strong total employment growth one-month and three-months later, in excess of the 10-year average changes after the increase. The 1996 minimum wage increase coincided with a small total employment decline after one-month. However, total employment rebounded sharply in excess of the 10-year average change after 3-months. Three months after the final minimum wage increase in July 2007 shows total employment growth in excess of the 10-year average. This suggests that other factors affecting employment may be notably more important than the minimum wage. In 2006, Pennsylvania’s minimum wage was at 26 percent of the average wage, an all-time low. The increase in the minimum wage to $7.15 in 2007 brought the minimum wage up to 34 percent of the average wage. This is below the original level of 50 percent of the average wage set in 1938. Inflation negatively impacts minimum wage. Adjusting for inflation, the state’s 2007 minimum wage increase to $7.15 will be worth $7.00 in 2008, $6.80 in 2009, and $6.60 in 2010. In 2006, 23 states had higher minimum wage rates than Pennsylvania. In 2007 only nine states had higher rates. Thirteen states will have higher minimum wages than Pennsylvania in 2008. Of Pennsylvania’s neighboring states, only West Virginia plans on raising its minimum wage (to $7.25) before the next federal minimum of $7.25 takes effect in 2009.
19

Long-term Trends and Outlook
20

Demographics
Population
Population change is the underlying force that moves the economy. Over the next ten years, Pennsylvania’s population is projected to grow by just two percent. In comparison, the nation’s population will grow by nearly nine percent. While the state’s population growth will be relatively static in the years to come, the demographic changes within Pennsylvania’s population will be dynamic.
Pennsylvania's Projected Population 2007 to 2030
12,300,000
12,400,000
12,500,000
12,600,000
12,700,000
12,800,000
12,900,000
2007 2009 2011 2013 2015 2017 2019 2021 2023 2025 2027 2029
Popu
latio
n
Age Pennsylvania’s population is growing older. The number of Pennsylvanians age 65 and over was 1.9 million in 2007. In fact, the state’s percentage of those age 65 and over is the second highest in the nation (15.3 percent). This is largely a by-product of the aging of the population born during the Baby Boom period after World War II (1946 to 1964). The oldest of the baby boom generation will turn 65 in 2011 (now age 62) and the youngest will turn 65 in 2029 (now age 44). Thus, a large wave of Baby Boomers will be leaving the workforce over the next few decades. Unfortunately, from the mid-1960s until the mid-1980s, the number of births was less than that during the Baby Boom years.
21

Pennsylvania Population: Age 10 to 65 in 2008
0
50,000
100,000
150,000
200,000
250,000
10 13 16 19 22 25 28 31 34 37 40 43 46 49 52 55 58 61 64
Age
Peop
le
Due to this decline in the population, there will not be enough workers (entrants) to replace the Baby Boomers as they leave the workforce (separations). Beginning around 2015, the total working age population (those age 25 to 64) will be less than the year before until at least 2029. Therefore, there will be worker shortages in the coming years and some areas, industries, and occupations will be affected sooner and harder than others.
Pennsylvania Labor Force Entrants and Separations, 1970-2020
50,000
70,000
90,000
110,000
130,000
150,000
170,000
190,000
210,000
230,000
1970
1975
1980
1985
1990
1995
2000
2005
2010
2015
2020
Entrants
Separations
22

The gap between labor force entrants and separations will create a growing demand for labor. Thus the unemployment rate will decline and the size of the labor force will steadily shrink, because more people will be leaving the workforce than entering.
Pennsylvania Labor Force Growth and Unemployment Rate, 1970-2020
-40,000
-20,000
0
20,000
40,000
60,000
80,000
1970
1975
1980
1985
1990
1995
2000
2005
2010
2015
2020La
bor F
orce
Gro
wth
0.0
2.0
4.0
6.0
8.0
10.0
12.0
Une
mpl
oym
ent R
ate
La bor For c e Gr owt h
Une mpl oy me nt Ra t e
Race The proportion of minorities in the labor force will grow because of immigration and higher labor force participation rates. By 2014, the share of minorities in the labor force is expected to grow by approximately three percent, while the white portion will decline by three percent. This is not surprising since, historically, white labor force participants have been older than the rest of the labor force. Hispanics are projected to comprise nearly five percent of the labor force by 2014. The growth in the Hispanic and minority sections in the labor force can largely be attributed to the facts that they are both younger and have higher fertility rates than whites. Gender Women will dominate Pennsylvania’s labor force growth through 2014. The presence of women in the labor force will grow by over eight percent. However, men’s participation in the labor force will remain essentially unchanged. The faster expansion of women into the labor force will also reduce the gap between male and female labor force participation.
23

Projections
Industry Pennsylvania’s Education & Health Services, Professional & Business Services, and Leisure & Hospitality industry sectors will account for nearly 90 percent of all annual employment growth through 2014. The Manufacturing industry sector is forecast to lose over 5,000 jobs annually. These sectors reflect the dynamics of an aging population‘s need for more health care, the gradual transition of the Baby Boom generation out of the workforce and into an active retirement, and the continued transformation of the state’s economy from that of a goods producer to a service provider.
Annual Employment Change by Industry Sector to 2014
-10,000 -5,000 0 5,000 10,000 15,000 20,000 25,000
Manufacturing
Natural Resources and Mining
Government
Information
Construction
Other Services
Financial Activities
Trade, Transportation, and Utilities
Leisure and Hospitality
Professional and Business Services
Education and Health Services
Jobs
24
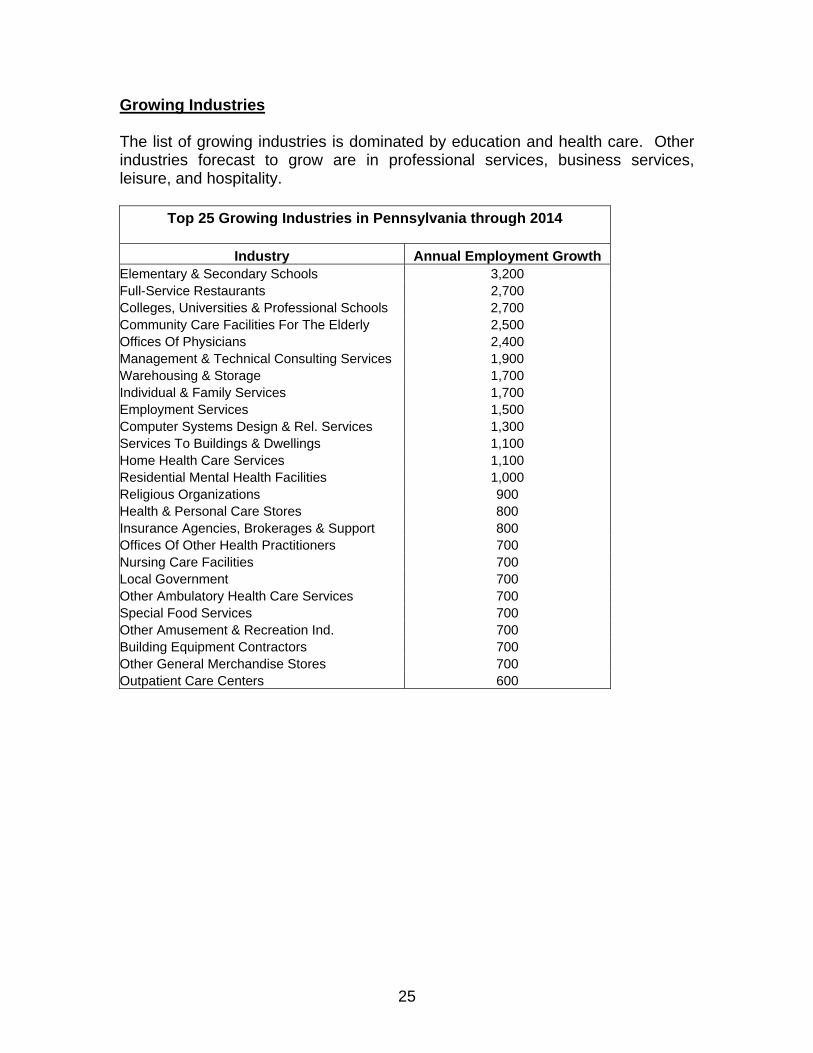
Growing Industries The list of growing industries is dominated by education and health care. Other industries forecast to grow are in professional services, business services, leisure, and hospitality.
Top 25 Growing Industries in Pennsylvania through 2014
Industry Annual Employment Growth Elementary & Secondary Schools 3,200 Full-Service Restaurants 2,700 Colleges, Universities & Professional Schools 2,700 Community Care Facilities For The Elderly 2,500 Offices Of Physicians 2,400 Management & Technical Consulting Services 1,900 Warehousing & Storage 1,700 Individual & Family Services 1,700 Employment Services 1,500 Computer Systems Design & Rel. Services 1,300 Services To Buildings & Dwellings 1,100 Home Health Care Services 1,100 Residential Mental Health Facilities 1,000 Religious Organizations 900 Health & Personal Care Stores 800 Insurance Agencies, Brokerages & Support 800 Offices Of Other Health Practitioners 700 Nursing Care Facilities 700 Local Government 700 Other Ambulatory Health Care Services 700 Special Food Services 700 Other Amusement & Recreation Ind. 700 Building Equipment Contractors 700 Other General Merchandise Stores 700 Outpatient Care Centers 600
25
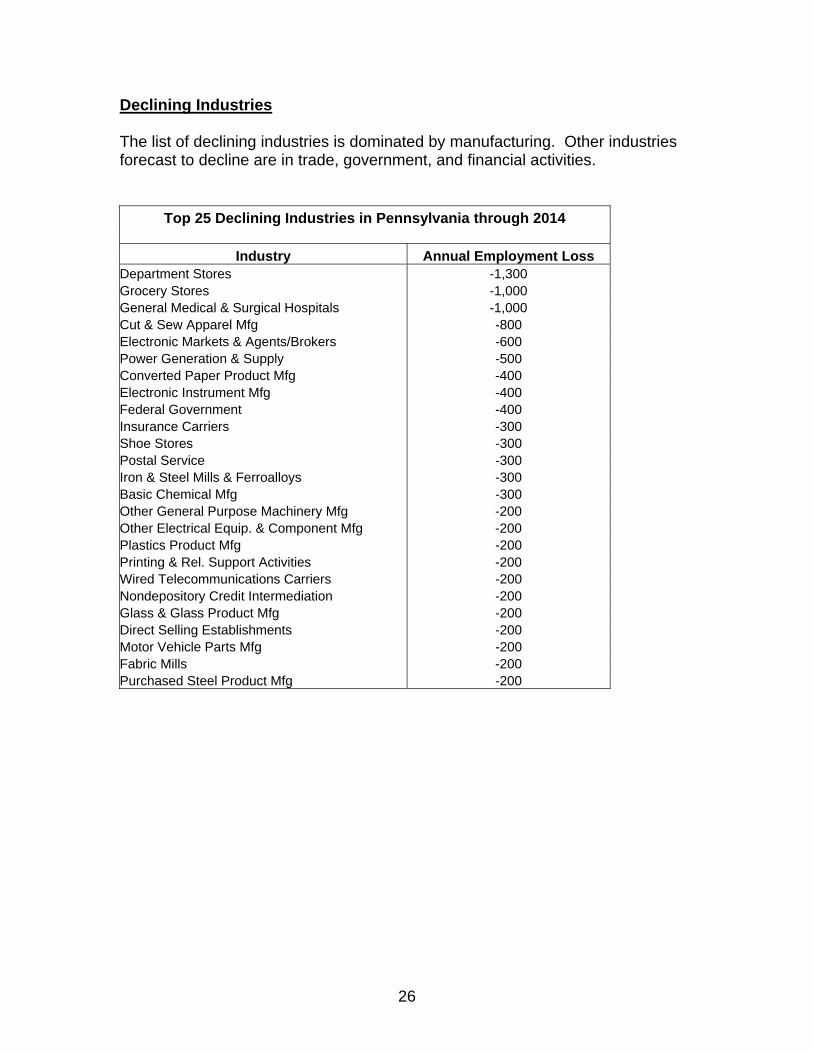
Declining Industries The list of declining industries is dominated by manufacturing. Other industries forecast to decline are in trade, government, and financial activities.
Top 25 Declining Industries in Pennsylvania through 2014
Industry Annual Employment Loss Department Stores -1,300 Grocery Stores -1,000 General Medical & Surgical Hospitals -1,000 Cut & Sew Apparel Mfg -800 Electronic Markets & Agents/Brokers -600 Power Generation & Supply -500 Converted Paper Product Mfg -400 Electronic Instrument Mfg -400 Federal Government -400 Insurance Carriers -300 Shoe Stores -300 Postal Service -300 Iron & Steel Mills & Ferroalloys -300 Basic Chemical Mfg -300 Other General Purpose Machinery Mfg -200 Other Electrical Equip. & Component Mfg -200 Plastics Product Mfg -200 Printing & Rel. Support Activities -200 Wired Telecommunications Carriers -200 Nondepository Credit Intermediation -200 Glass & Glass Product Mfg -200 Direct Selling Establishments -200 Motor Vehicle Parts Mfg -200 Fabric Mills -200 Purchased Steel Product Mfg -200
26

Emerging Industries Pennsylvania has forecast a number of emerging industries through 2014. An emerging industry is defined as having statewide employment less than 10,000 and projected to have at least 100 annual openings through 2014. The emerging industries are spread out across nearly all industry sectors, but the information and leisure sectors have the most.
Top Emerging Industries in Pennsylvania through 2014
Industry Annual Employment Gain Activities Rel. To Credit Intermediation 300 Druggists' Goods Merchant Wholesalers 300 Cable & Other Program Distribution 200 Amusement Parks & Arcades 200 Emergency & Other Relief Services 200 Wireless Telecommunications Carriers 200 Other Schools & Instruction 200 Spectator Sports 100 Museums, Parks & Historical Sites 100 Freight Transportation Arrangement 100 Lawn & Garden Equip. & Supplies Stores 100 Software Publishers 100 Jewelry, Luggage & Leather Goods Stores 100 Specialized Design Services 100 Automotive Equip. Rental & Leasing 100 Grantmaking & Giving Services 100 Used Merchandise Stores 100 Motion Picture & Video Ind. 100 Social Advocacy Organizations 100
27

Occupations Jobs in most major occupational groups will be plentiful in the years to come for current and future labor market participants. As mentioned above, modest economic growth coupled with an aging workforce will create opportunities for anyone seeking a job. However, the best paying jobs will go to those achieving more than a high school education. Major occupational groups seeing the best total opportunities will be in: Office & Administrative Support; Sales & Related Occupations; Food Preparation & Serving Related; Management, Transportation & Material Moving; Education, Training, & Library; and Healthcare Practitioners & Technical. Major occupational groups not already mentioned and having the best opportunities due to growth will be Personal Care & Service and Healthcare Support. Major occupational groups not already listed and having the best opportunities due to replacements (mainly those leaving due to retirement) will be: Production, Construction & Extraction; and Installation, Maintenance & Repair. Annual Change
Occupational Title
Total Due to
ReplacementsDue to Growth
Office & Administrative Support Occupations 2,500 2,300 200 Sales & Related Occupations 2,300 2,100 200 Food Preparation & Serving Related Occupations 2,200 1,700 500 Management Occupations 1,200 800 400 Transportation & Material Moving Occupations 1,200 1,000 300 Education, Training, & Library Occupations 1,000 700 300 Healthcare Practitioners & Technical Occupations 1,000 600 400 Production Occupations 800 1,100 -300 Personal Care & Service Occupations 700 400 300 Construction & Extraction Occupations 700 500 200 Installation, Maintenance, & Repair Occupations 700 500 100 Building & Grounds Cleaning and Maintenance Occupations 600 400 200 Business & Financial Operations Occupations 600 400 200 Healthcare Support Occupations 600 300 300 Protective Service Occupations 400 300 100 Computer & Mathematical Occupations 400 200 200 Community & Social Services Occupations 400 200 200 Architecture & Engineering Occupations 200 200 0 Arts, Design, Entertainment, Sports, & Media Occupations 200 100 100 Life, Physical, & Social Science Occupations 200 100 100 Farming, Fishing, & Forestry Occupations 100 100 0 Legal Occupations 100 100 0
28

Occupations Detail There will be job opportunities in many different occupations across all industries over the next decade as Baby Boomers retire. Seventy-eight percent of all annual job openings will be due to replacements for workers leaving the workforce. Labor market participants will have opportunities to have their pick of jobs and in what occupations they wish to begin or change careers. Annual Change
Occupational Title
TotalDue to
ReplacementsDue to Growth
Retail Sales Workers 1,600 1,500 100 Food & Beverage Serving Workers 1,300 1,100 200 Information & Record Clerks 600 500 200 Material Moving Workers 600 500 0 Cooks & Food Preparation Workers 600 400 200 Health Diagnosing & Treating Practitioners 500 400 100 Construction Trades Workers 500 400 100 Secretaries & Administrative Assistants 500 400 100 Primary, Secondary, & Special Education School Teachers 500 400 100 Motor Vehicle Operators 500 300 200 Other Management Occupations 500 300 200 Material Recording, Scheduling, Dispatching, & Distributing Workers 400 500 -100 Financial Clerks 400 400 100 Other Office & Administrative Support Workers 400 400 0 Building Cleaning & Pest Control Workers 400 300 200 Health Technologists & Technicians 400 200 200 Other Personal Care & Service Workers 400 200 200 Business Operations Specialists 400 200 200 Top Executives 400 200 100 Computer Specialists 400 100 200 Other Installation, Maintenance, & Repair Occupations 300 300 100 Other Food Preparation & Serving Related Workers 300 200 100 Sales Representatives, Wholesale & Manufacturing 300 200 100 Vehicle & Mobile Equipment Mechanics, Installers 300 200 0 Nursing, Psychiatric, & Home Health Aides 300 100 200
29

Conclusion While Pennsylvania’s employment reached an all-time high in 2007 and the unemployment rate decreased to 4.4 percent, its lowest level since 2000, key economic indicators show a slowing of the state’s economy heading into 2008. The Pennsylvania economy continues to adapt and transform itself from one of goods producing to service providing. Workers from the baby-boom generation are moving into their 60s and are retiring in large numbers. They are taking with them key skills that kept industry growing and prosperous. Beginning around 2015, Pennsylvania’s total working age population (those age 25 to 64) will be less than the year before until at least 2029. Far fewer youth will be available to enter the labor market, forcing greater efficiencies and competition for key skills. Therefore, there will be workers shortages in the coming years and some areas, industries, and occupations will be affected sooner and harder than others. Jobs in most major occupational groups will be plentiful in the years to come for current and future labor marker participants. Modest economic growth coupled with an aging workforce will create opportunities for anyone seeking a job. The best paying jobs will go to hose achieving more than a high school education.
30