economic well-being in italy: the role of income insecurity - ecineq
TRANSCRIPT

Working Paper Series
Economic well-being in Italy: The role of income insecurity and intergenerational inequality Gabriella Berloffa Francesca Modena
ECINEQ WP 2010 – 168

ECINEQ 2010-168
April 2010
www.ecineq.org
Economic well-being in Italy: The role of income insecurity and intergenerational
inequality
Gabriella Berloffa Francesca Modena* University of Trento
Abstract This paper provides a measure of economic well-being for the Italian context. In the last two decades Italy experienced a sharp increase in labour market flexibility and a relative loss of command over resources of young generations with respect to older ones. We include new measures of temporary work and intergenerational inequality in the IEWB, and analyse its evolution in Italy and in Lombardy (the leading Italian region) over the 1995-2007 period. We find that well-being advanced at a slower rate than GDP, mainly because of the negative effect of a reduction in employment security and a rise in income inequality, which was more pronounced in Lombardy. Keywords: well-being, inequality, income insecurity. JEL classification: I31, I32, D31.
* Address of correspondence: Department of Economics, University of Trento, Via Inama 5, 38100 Trento, Italy, Phone: +39 0461 282397, Fax: +39 0461 282222, [email protected]

2
1. Introduction
The attempt to measure economic well-being in a broader sense is on the agenda of
many international institutions, and it is a research topic for economists, social scientists
and statisticians. A reliable measure of economic well-being is important to facilitate
public policy discussion and for providing decision-making at all levels with a solid
basis (OECD 2008a; Pulselli et al. 2006). The recognition that GDP is neither a
sufficient nor a proper indicator for the evaluation of the well-being of a complex
society is increasingly widespread among scholars and leading international institutions.
The question is “whether alternative measures of economic well-being are possible,
plausible, and make some difference” (Osberg and Sharpe 2009, p.2).
In order to address this issue, several methodologies have been developed; one of the
most widely-used is the composite indicators approach (Stiglitz Commission 2008;
OECD 2008b). Composite indicators aggregate elementary indexes to encompass
several dimensions of well-being. On the one hand, they allow synthetic analysis of the
phenomenon; on the other hand, they can be broken down, enabling a deeper
examination of the different components. One of the most recent and complete
composite indicators is the Index of Economic Well-Being (IEWB), developed by the
Centre for the Study of Living Standards. This index measures economic well-being in
terms of command over resources. The idea behind it is that the measure of the access to
the resources needed for a decent standard of living should go beyond standard
economic variables and integrate sustainable, distributional and environmental issues
(Osberg and Sharpe 2009).
This paper takes the IEWB as a starting point for the measurement of economic well-
being in Italy. Evaluations of economic well-being in Italy must take into account the
reforms in the labour market and in the pension system that occurred over the 1990s.
These changes negatively affected young generations who face lower entry wages,
lower wage growth and higher income risk over the life cycle, lower protections, lower
expected value and higher uncertainty of future pensions. In this context, we should
include appropriate measures of present and future income insecurity in the evaluation
of a society’s well-being.
Since these changes may have been more pronounced in contexts where the private
sector is more important relatively to public spending, we will compare trends in

3
economic well-being in Italy and in the leading Italian region, Lombardy. The latter is
the most economically advanced region in Italy (it has the highest GDP per-capita
among all Italian regions), with a share of public expenses over GDP that is lower than
the national average (and lower than in other regions of Northern Italy). Furthermore,
the construction of reliable measures of economic well-being at a local level will
become more and more important because local authorities are responsible for the
development of social and economic infrastructures and for the definition of local
policies (Ferrarini et al. 2001; Pulselli et al. 2006.). These measures will therefore assist
the monitoring of local development and the impact of policies.
The paper is organized as follows. Section two illustrates the Italian context in the last
two decades, focusing on the reforms of the labour market and of the pensions system.
Section three discusses the changes that we introduced in the Index of Economic Well-
Being in order to encompass new aspects of the economic security and inequality
dimensions that are relevant for the Italian context. Section four presents the main
results, by comparing trends in the Index and its components with trends in GDP per-
capita. Section five concludes.
2. The Italian context
In the last two decades the Italian economy has been characterized by sluggish growth
(the average annual growth rate over the 1995-2007 period was about 1%, with lower
rates after 2001), various reforms of the labour market and the pension system, and a
sharp increase in both house prices and rents. As regards the labour market, relevant
changes of its institutional framework occurred over the 1990s. In 1992 and 1993 the
abolition of the wage indexation (scala mobile) and the reform of the collective
bargaining system halted the wage inflation spiral and initiated a long period of wage
moderation (Brandolini et al. 2007). At the same time, a reform was implemented that
introduced new forms of temporary labour contracts (those used for the so called
parasubordinati and interinali1). By enhancing flexibility, the use of these contracts
allows firms to adjust the labour input in a context of fierce international competition
and demand uncertainty (Cipollone and Guelfi 2006), and reduces labour costs because
1 Most of parasubordinati are similar to fixed-term employees except for being remunerated less and paid
lower social security contributions, and for not benefiting from employment protection legislation
(Brandolini et al 2007). Interinali are individuals who work through a temporary employment agency.
4
of the lower social security contributions required for them (Brandolini et al. 2007).
However, on the other side, these workers are more vulnerable in the face of economic
crisis: they are more likely to loose the job and at the same time they are less protected
by social security cushion (Brandolini 2009b). Besides increasing job insecurity, the
sharp diffusion of temporary contracts contributed to curb wage dynamics: mean
earnings declined over the 1986-2004 period (Rosolia 2009), with a reduction in entry
wages which was not compensated by faster subsequent wage growth (Rosolia and
Torrini 2007).
These changes determined a segmentation of the Italian labour market with an
increasing proportion of workers (called ‘outsiders’) that are characterized by low
income levels, inadequate social protection and discontinuous careers, and older cohort
of workers (the ‘insiders’) that face higher wages, greater job security, and higher
opportunities for promotions (Brandolini 2009a; Cipollone 2001). This segmentation is
more pronounced when temporary contracts are used as replacements for (or
alternatives to) permanent ones, with the consequence that being precarious becomes a
long term status. Young people and women are more exposed to this risk (Brandolini et
al. 2007). For example, Barbieri and Scherer (2005) find that the proportion of persons
aged 35 with a work history of precariousness increased considerably for the cohorts
born in 1963-1967 relatively to the older cohorts born in 1958-1962 and 1948-1957.
The Italian social protection system is inadequate “to cope with the greater individual
insecurity associated with a more flexible labour market”, because of “the lack of wage
subsidies for the low-paid, and the poor coverage of the unemployment benefits
(Brandolini et al. 2007; p. 63 and 59). This inadequacy leads to an increase in the
probability of being poor for households with non-standard workers; Bank of Italy
(2009) shows that in 2006 the incidence of poverty for households with only atypical
workers was about 47%.
The condition of youths was also negatively affected by the reforms of the pension
system implemented during the 1990s. Three key features of the pension system were
modified: (i) benefit computation rules (from earnings-related to contributions-related
schemes); (ii) indexation rules (benefits are no longer indexed to real wage growth); (iii)
retirement age and eligibility criteria (modified on actuarial bases). The changes
introduced apply differently to individuals, mainly according to their seniority at the

5
time of the 1995 reform. As a result, while old cohorts maintain, at least partially, their
rights according to the old and more favourable rules (generous pension benefits and the
possibility of early retirement), young cohorts will have meagre pension benefits, they
will retire at an older age, and they have to save a larger share of their current labour
income to complement their future pensions benefits with supplementary social security
entitlements (Berloffa and Villa 2007).
Difficulties for young cohorts were also amplified by the evolution of housing costs.
Since the early 1990s, both house prices and rents exhibited a substantial growth (in real
terms). Brandolini et al. (2004) report that the increase in housing prices between 1989
and 2000 exceeded by 40% that of consumer prices. Nomisma (2005) documented that
mean prices of new housing increased by 70.4% over the 1998-2004 period (by 46.1%
in constant prices). Rents increased dramatically between 1989 and 2004 by 58%. The
sharp growth in housing and rental costs was particularly relevant after the introduction
of the Euro currency (Modena and Rondinelli 2010).
The combination of these institutional and market changes had serious negative
consequences for young generations in Italy, while older cohorts where only partially
affected: youths face lower entry wages, lower wage growth over the life cycle, lower
protections, lower expected value and higher uncertainty on future pensions, and higher
housing costs. Given the inadequacy of the Italian social protection system, these
changes make young people more dependent on intergenerational transfers and lead
them to postpone emancipation choices (delay in family formation and fertility
decisions), with clear consequences for the present and future well-being of the society.
In the next section we will discuss how to consider these issues in the measurement of
economic well-being in Italy.
3. Methodology
3.1. Enlarging the economic security and inequality dimensions of the IEWB
The Index of Economic Well-Being was developed by the Centre for the Study of
Living Standards (Osberg 1985; Osberg and Sharpe 2002b, 2005; Smith 2003) and it is
one of the best known indexes used in the estimation of economic well-being (Sharpe
1999). The IEWB follows the “composite indicators approach”, which combines several

6
elementary sub-indexes to cover a broad spectrum of domains affecting well-being
(Stiglitz Commission 2008). The weighting procedure used to aggregate elementary
indexes is arbitrary. Indeed, as suggested by Osberg and Sharpe, a society’s well-being
is not a single, objective number; rather, individuals in a society make subjective
evaluations of objective data (Osberg and Sharpe 2005).
The IEWB measures well-being in terms of command over resources, and it covers four
dimensions: current effective per-capita consumption flows, net societal accumulation
of stocks of productive resources, income distribution and economic security. Each
dimension combines several variables. The four components of IEWB recognize “both
trends in average outcomes and in the diversity of outcomes, both now and in the
future”, as shown in Table 1 (Osberg and Sharpe 2005, p. 314).
Table 1. Dimensions of economic well-being or command over resources
Time period
Concept Present Future
“Typical citizen” or
“representative agent”
Average flow of current
income
Aggregate accumulation of
productive stocks
Heterogeneous citizens Distribution – income
inequality and poverty Insecurity on future income
Source: Osberg and Sharpe (2005)
In the application to the Italian context, some changes to the original index proposed by
Osberg and Sharpe are needed, particularly with respect to the distribution of income
and economic insecurity. As regards the latter, Osberg (2009) underlines the importance
of including the economic security domain in a context where labour market regulation
and social protection have been reduced in order to encourage economic growth. “The
construction of the IEWB was motivated in part by the perception that both costs in
reduced economic security and benefits in aggregate growth should be considered in
any evaluation of trends in aggregate well-being” (Osberg 2009, p.1). The importance
of employment security has been emphasized also by the Stiglitz Commission: “fear of
job loss can have negative consequences for the quality of life of each worker, for firms,
and for society as a whole” (Stiglitz Commission 2009, p. 48). For these reasons, the
Canadian Index of Economic Well-being includes the risk from unemployment

7
measured as the probability of becoming unemployed (proxied by the unemployment
rate, see Osberg 2009 and Osberg and Sharpe 2009).
As we discussed in section 2, economic insecurity has become a real issue in the Italian
context after the labour market reforms of the 1990s, especially for certain subgroups of
the population (those who entered the labour market after the mid 1990s). This
insecurity is mainly linked to the adoption of new forms of temporary labour contracts
with very low social security benefits. For individuals with these contracts, the “fear of
job loss” is replaced by the “fear of not finding a new job” at the end of the current one,
and by the fear of not being able to accumulate enough contribution for future pension
benefits. Therefore, when measuring employment insecurity in Italy it is necessary to
account for the risk associated with being temporary worker, as well as for the risk of
unemployment. As simple way to do this is to consider the share of the labour force that
is represented by unemployed and temporary workers.
Besides employment security, the hazard of poverty in old age is one of the major issues
in the evaluation of economic security. The Canadian IEWB accounts for this issue by
computing the intensity of poverty among seniors. In the Italian context, given the
recent reforms of the pensions system discussed in section 2, this would underestimate
the risk of poverty in old age for young workers because the expected value of their
pensions is lower than current ones, and the degree of uncertainty associated with them
is higher. In this context, it would be necessary to include an appropriate measure of
security in the event of old age by estimating expected pension benefits for young
generations. However, due to the complexity of the issue, we do not elaborate further on
this in the current versions of the Italian Index of Economic Well-being.
Following the IEWB methodology, the equality dimension includes income inequality
and the intensity of poverty. As underlined by Osberg and Sharpe (1998), the inclusion
of the inequality and the poverty dimensions in the IEWB is justified because the level
of social welfare is generally considered a positive function of average incomes and a
negative function of the inequality of incomes. The authors also highlight that “by using
measures of aggregate inequality, and aggregate poverty, we implicitly impose the
ethical value of anonymity, and count the poverty of any person as being of equal social
concern, regardless of their identity or such characteristics as age or gender. Those who
are concerned with norms of equity between groups may in addition wish to consider

8
additional indicators of inequality, such as the earnings gap between men and women”
(Osberg and Sharpe 1998, p. 24).
One issue that is of particular social concern, at least for Italy, is the way in which the
command over resources is distributed between young and more adult people. The
income that a person can rely on in the stage of the life-cycle devoted to household
formation and fertility decisions plays a crucial role, especially with imperfect financial
markets: an income that is too low compared to rents or house prices, or to the average
standard of living may cause a delay in leaving the parental home, a delay in family
formation and a delay in fertility decisions, with clear consequences for the future of the
society itself. For the same average income, if the earnings gap between those in this
stage of the life-cycle and the adults increases, there is an on-going redistributive
process that weakens the position of the young, making them more dependent on
intergenerational transfers, especially if the welfare system does not compensate for this
relative loss.
We therefore argue that the index of economic well-being should explicitly consider the
evolution of the earnings gap between the young (i.e. those who are at the age of
starting to live independently and deciding about having children) and the adults (i.e.
those who have already faced these choices). Clearly the age that distinguishes the two
groups can be different from country to country and over time because of institutional
and cultural differences. As regards the measure to be included in the index, it must be
noted that, since the concern is not about simple inequality between groups but about
the redistribution from the young to the old, we cannot use the between-group
inequality measure of decomposable inequality indices, but we need to use something
that considers explicitly the “direction” of the inequality. For this reason, the more
transparent measure seems the earnings gap between the two groups (see also
Brandolini et al. 2007).
The equality dimension for the Italian IEWB includes therefore three sub-components:
income inequality, intensity of poverty, and a measure of redistribution of resources
from youths to adults. These sub-indexes are aggregated using weights reflecting the
relative importance of one dimension with respect to the others. Following Osberg and
Sharpe (2002a), poverty was given a higher weight than inequality, hence we assigned a

9
weight of 0.5 to poverty and of 0.25 each to income inequality and intergenerational
inequality.
For consumption flows and wealth stocks we follow the traditional approach. In
particular, for consumption flows we include four sub-components: i) consumption of
market goods and services adjusted for variations in household size (economies of
scale) and life expectancy2, ii) current government spending (for staff, goods and
services), iii) unpaid work (charity and housework), and iv) defensive expenditures
(commuting costs and costs of road accidents), which are subtracted from the above
components. For wealth stocks, we include three sub-components3: i) fixed capital
stock, ii) accumulated stock of research and development4 and iii) the stock of human
capital.
The structure of the overall IEWB is illustrated in Figure 1 and more details about its
construction are reported in Appendix A. We want only to recall here that the index is a
weighted average of the four dimensions, with weights subjectively determined
according to the relative importance attached to each dimension. Weighting schemes are
discussed in section 4.2 and 4.3.
2 Final market consumption was multiplied by the index number of the Carbonaro equivalence scale
(1995 is the base year); this measure of corrected consumption was then multiplied by an index
measuring the increase in life expectancy to capture the effect on well-being relative to improvements in
living conditions. 3 Because of the lack of data at a regional level, we do not consider the value of stocks of natural
resources and the costs of environmental degradation due to CO2 emissions, which are included in the
IEWB proposed by Osberg and Sharpe. 4 We included both public and private research expenditures.

10
Figure 1 – The Italian Index of Economic Well-Being
3.2. Data
This section details how we estimated the four dimensions of the index and their data
sources. The first component, consumption flows, was constructed using data from Istat
(mainly National and Regional accounts) for final consumption of goods and services,
the value of housework and charity work services5, and costs related to commuting
activities and road accidents6. Current public expenditures on staff and good and
services were computed through Regional Public Accounts- Finance Minister.
The stock value of fixed capital was provided by ISTAT. The share attributed to
Lombardy was derived from research carried out by CRENoS in 1994 (18.2% of the
national amount). ISTAT data on R&D annual expenses were cumulated over time,
5 The values of both housework and charity work were computed as the product of hourly wages, the
number of average yearly hours devoted to each activity, and the population aged over 15. 6 The cost of commuting was computed by applying to transport expenditures the share that can be
attributed to commuting. The costs of road accidents at the national level where provided by ISTAT. For
Lombardy, they were computed by multiplying these national costs by the share of regional road
accidents (i.e. the number of road accidents in Lombardy over the total number for Italy).

11
considering a depreciation rate of 20%, in order to have a stock measure. Following the
IEWB methodology, human capital was estimated from the cost side using data on
average expenditure per years of schooling (OECD data) and the educational attainment
of the population aged 15 or more (ISTAT, Labour Force).
As regard the employment security domain, first we constructed a measure of
employment insecurity as the ratio between unemployed plus temporary workers and
the labour force. Temporary workers are defined as parasubordinati7, interinali and
irregular workers. Data sources are INPS, EBITEMP and ISTAT respectively. Data on
unemployed are provided by ISTAT (Labour Force). In order to associate a decrease in
employment insecurity to an increase in well-being we then computed changes in 1-
employment insecurity.
Consistently with the IEWB approach, we evaluated income inequality by means of the
Gini coefficient and the intensity of poverty by means of the Sen-Shorrocks-Thon index
(SST). Our estimates were based on the Survey of Household Income and Wealth
(SHIW) conducted by the Bank of Italy.8 We used a broad definition of after-tax
monthly real equivalent incomes9. We followed the methodology adopted by Boeri and
Brandolini (2005) which considers households as the economic units of aggregation,
while individuals are the welfare units. Income inequality among individuals was
measured by attributing to every person his or her household’s equivalent income on the
basis of the OECD equivalence scale. Since a decrease in poverty and inequality
corresponds to an increase in the index of well-being, we converted the Gini and SST
coefficients into “positive” indexes (i.e. 1-Gini and 1-SST, see Appendix A). As a
measure of redistribution of resources from youths to adults we computed earnings
differentials between two groups of workers: those with less and those with more than
7 We considered only the so called “collaboratori”. Parasubordinati have been introduced in 1996; we
compute the 1995 value as a forecast based on data for the of following years. 8 The Historical Archive covers the years 1991, 1993, 1995, 1998, 2000, 2002, 2004 and 2006 and reports
information at the household level. Missing years are estimated as linear interpolations between the two
adjacent years covered by the survey. 9 It comprises wages and salaries, income from self-employment, pensions, public assistance, private
transfers, income from real properties, imputed rental income from owner-occupied dwellings, and yields
on financial assets net of interest paid on mortgages. We obtained real income by dividing self-reported
income by the Household final consumption Expenditure Deflator (HED) available in national accounts.

12
35 years of age. We considered after tax earnings for both employees and self-employed
available from the Bank of Italy’s Survey of Household Income and Wealth (SHIW)10
.
4. Trends in economic well-being in Italy and Lombardy, 1995-2007
In this section we present first the evolution of the four dimensions of the IEWB, and
compare the trend of each dimension and its sub-components in Lombardy and in the
whole country (section 4.1). Second, we show the effect of aggregating the four
components for the changes in economic well-being in the two areas, and compare the
trend of the IEWB with that of GDP (section 4.2).
4.1 The evolution of the four dimensions of the Index of Economic Well-being
Figures 2 and 3 describe the evolution of the four dimensions of the index for Italy (I)
and Lombardy (L). Figure 4 shows the total change of each specific sub-component for
the period 1995-2007. Both consumption flows and the wealth stocks grew in the period
1995-2007, but the magnitude of the increase and the evolution over time differ
significantly for the two dimensions. Consumption growth was significant until 2001,
then it declined with a new upturn in 2004 leading to an overall increase of about 8.4%
in Italy. The same pattern can be observed for Lombardy, but a higher growth rate in the
late 1990s implied a larger total variation of consumption compared to the rest of the
country (11.3%). Looking at the four sub-components of consumption flows, this trend
was mainly driven by the evolution of private consumption which is the largest
contributor to total consumption flows11
. Its positive variation (12.3% and 12.7% in I
and L respectively) was reinforced by the increase in current public expenditure, which
was particularly high in Lombardy (10.7% and 30%, respectively; see Figure 4 and
Tables B.1 and B.2 in Appendix B), and it was slightly reduced by the decrease in
housework and charity work (-6.3% in I and -2.5% in L, with major reductions in 2002-
03 and subsequent recovery) and the increase in the costs related to commuting
10
Average earnings were computed by considering the sample of people reporting to be employed at the
time of the interview. All observations were weighted by the adjusted sampling weights available in the
historical archive. Missing years are estimated as linear interpolation between the two adjacent years
covered by the survey. 11
On average, given the different magnitudes of the sub-components, a 10% increase in personal
consumption translates into a 6.8% increase in the consumption flow index (7.3% in L), whereas the same
variation in public expenditures, household work and voluntary work and defensive expenses leads to a
change of 2%, 1.7%, and -0.6% respectively (2%, 1.2%, -0.5% in L).

13
activities and road accidents (10.6% in I and 21.9% in L, with peaks of 39.1% in I in
2003 and 48.4% in L in 2001).
Per-capita wealth stocks showed an upward trend throughout the whole period with an
overall increase of about 17% and 14% in Italy and Lombardy respectively. The
variation in all the three sub-components (physical and human capital stocks, R&D
expenses stock) was larger in Italy than in Lombardy, but while the difference is quite
small for physical12
and human capital, it is impressive for R&D expenses (see figure
4). The evolution of this component however has little effect on the wealth stocks index
due to the low magnitude of R&D expenses with respect to physical and human capital:
a 10% increase in physical capital, human capital and R&D expenses translates into a
variation of the wealth stocks index of about 7%, 3% and 0.1% in both Italy and
Lombardy.
As illustrated in the previous section, the third component of the Index is a measure of
employment security which is negatively affected by the risk of unemployment and by
the increase in income uncertainty and vulnerability due to the greater reliance on fixed-
term contracts in Italy. The total index of employment security slightly decreased over
the 1995-2007 period in both Italy and Lombardy (about -1.2%). This was the result of
two opposing effects: the incidence of temporary work increased in both areas leading
to a reduction in employment security of 8% and 4.6% in Italy and Lombardy
respectively; the unemployment rate decreased with a positive effect (6.9% in I and
3.4% in L). The evolution of the index was different: Italy experienced a strong
reduction in the first three years (-3.8%) and a subsequent recovery which took the
value of the index in 2007 almost back to the 1995 one; Lombardy, instead, in 2000 had
already recovered more than what was lost in the first three years, but then employment
security declined slightly but steadily until 2007. The reason for the different trends in
employment security in the two areas after 2000 is that, while temporary work increased
in both cases in similar proportions, the fall in the unemployment rate was significantly
larger in Italy (from 10% to 6%) and it compensated the increase in temporary work (it
must be noted that in Lombardy the unemployment rate was quite low, 6% in 1995, and
it declined to 3.4% in 2007). However, it is important to underline that the increase in
12
Due to the lack of data at the regional level, the stock value of physical capital for Lombardy was
computed as a share of the Italian one. Differences in the trends of per-capita physical capital are
therefore due only to different population growth rates.

14
the incidence of temporary work was higher in Italy than in Lombardy (from 15% to
21% in I, from 17.4% to 21% in L), due to a faster growth between 1995 and 200013
.
The fourth dimension of the Index of Economic Well-being captures inequality and
poverty issues. It includes measures of inequality in income distribution (Gini), the
intensity of poverty (SST), and a measure of the relative loss of command over
resources of young generations. Lombardy experienced a higher decrease of overall
income equality than Italy (-4.4% and -0.9% respectively), mainly due to a much larger
increase in the income gap between young and older individuals (see Figure 4). In
Lombardy, the ratio between average earnings of individuals with less than 35 years of
age, and individuals older than 35, decreased from 0.75 to 0.65 over the period
considered, while in Italy the variation was only of 7 percentage points (from 0.78 to
0.71). The larger loss in Lombardy is due to two different phenomena over the sub-
periods 1995-2000 and 2000-2006. In the late 1990s, while adult earnings increased in
similar proportions in Lombardy and in Italy (7% and 9% respectively), young workers
in Lombardy experienced a drop in labour incomes of about 6% compared to a 3%
increase in the whole country14
. In the new Millennium, instead, adult earnings
increased much more in Lombardy than in Italy (13% and 7% respectively), while those
for young people showed a similar negative trend (about -1%).
As regards the other two components of the equality dimension, the intensity of poverty
decreased in both Lombardy and Italy, with a higher reduction for the whole country
(the 1-SST index increased by 2.5% in I and 0.6% in L)15
. Income inequality exhibited
minute positive and negative changes in Lombardy and Italy respectively (the 1-Gini
index changed by less than 1%, see Figure 4).
13
This confirms the regional differences in the Italian labour market, with Southern regions that have a
higher incidence of atypical and irregular workers than the Northern ones. 14
It must be noted, however, that average earnings are higher in Lombardy than in the whole country for
both groups. In 2000, average monthly after-tax labour income in Lombardy was 1095 and 1617 euro for
individuals younger and older than 35 respectively; in Italy these figures were 1038 and 1396 euro. 15
In both areas, the intensity of poverty grew in the first phase, until 1998, and decreased in the following
years. It is worth noting, however, that poverty intensity is double in Italy than in Lombardy, 7.2% and
3.6%, in 2007).

15
Figure 2 – Evolution of the four components of the Index of Economic Well-Being for Italy
0.85
0.90
0.95
1.00
1.05
1.10
1.15
1.20
1995 1996 1997 1998 1999 2000 2001 2002 2003 2004 2005 2006 2007
Consumption flows (per capita) Wealth Stocks (per capita)
Employment Security Equality
Figure 3 – Evolution of the four components of the Index of Economic Well-Being for Lombardy
0.85
0.90
0.95
1.00
1.05
1.10
1.15
1.20
1995 1996 1997 1998 1999 2000 2001 2002 2003 2004 2005 2006 2007
Consumption flows (per capita) Wealth Stocks (per capita)Employment Security Equality

16
Figure 4 – Overall variation of each specific sub-component (1995-2007)
-50.00%
-40.00%
-30.00%
-20.00%
-10.00%
0.00%
10.00%
20.00%
30.00%
40.00%
50.00%
Per ca
pita co
nsum
ptio
n
Volu
nta
ry workin
gP
ublic e
xpense
sD
efensive exp
enses
Cap
ital sto
ck R
&D
expense
s (stock)H
uman ca
pital
Une
mplo
yment ra
teTem
pora
ry em
plo
yment ra
te
Non
poverty
Equa
lity
Inte
rgen
eratio
nal eq
uality
Lombardy Italy
4.2 The evolution of the Index of Economic Well-being
In order to obtain the general Index of Economic Well-Being, all components were
aggregated by using subjective weights. According to Osberg and Sharpe’s approach
(2002a, 2005, 2009), we first assign the same value to all weights16
. As noted
previously, the choice of weights is subjective and reflects the relative importance that
the policy maker or the scholar attaches to each dimension. In section 4.3 we will
discuss weighting issues and provide estimates of the Index with alternative weighting
schemes.
Figure 5 shows the evolution of the Index of Economic Well-Being for Italy and
Lombardy compared with the evolution of per-capita GDP. Consistently with Osberg
and Sharpe (2009), the Index of Economic Well-being advanced at a slower rate than
GDP: the average annual growth in Italy was 0.5% and 1.1% respectively. The gap
between the two measures widened especially in the late 1990s, while it remained quite
stable after 2001. This gap is lower in Lombardy, mainly because per-capita GDP
growth was lower (the overall change was 13.9% in Italy and 9.4% in Lombardy). The
16
In the literature, most composite indexes assign equal weight to each component; the best known
example is the Human Development Index.

17
evolution of well-being followed, instead, very similar patterns: a positive trend
throughout the whole period, with a faster growth between 1998 and 2001, leading to an
overall variation of 5.8% in Italy and 4.8% in Lombardy. The latter area experienced a
slightly faster growth in the first phase due to the robust increase in consumption, while
Italian well-being grew slightly more after 2003.
Figure 5 – Evolution of the Index of Economic Well-Being and per-capita GDP
0.95
1.00
1.05
1.10
1.15
1995 1996 1997 1998 1999 2000 2001 2002 2003 2004 2005 2006 2007
IEWB - Italy IEWB - Lombardy
GDP per-capita - Italy GDP per-capita - Lombardy
The weighted contributions of the four components are presented in Table 2. In Italy,
the total increase in economic well-being is the result of a positive effect of changes in
consumption flows and wealth stocks (6.3%), and a negative effect of the worsening of
employment security and equality (-0.5%). In Lombardy, if there had been no changes
in employment security and equality, the positive variations of consumption and wealth
stocks would have lead to a larger increase in the IEWB (6.2%). However, the negative
changes in equality of income distribution and employment security resulted in a much
smaller growth of economic well-being (the reduction in the IEWB due to these two
components was 1.4%)17
. As regards the different sub-components, from Figure 6 it is
possible to see that changes in per-capita adjusted private consumption and per-capita
physical capital were the major determinants of the evolution of economic well-being.
Public expenses and human capital contributed to the positive variation of IEWB (in
Italy also a slight reduction of poverty intensity), whereas intergenerational inequality,
17
For some years at the beginning of 2000s, employment security and equality increased faster than
GDP. This, together with the increase in the stock of wealth and consumption, leads to IEWB annual
growth rates higher than per-capita GDP ones (in 2003 and 2005).

18
job security, charity work and the increase in defensive expenditures negatively affected
it.
Table 2. Weighted overall growth rates of IEWB components and growth rates of IEWB and GDP
(1995-2007)
GDP IEWB Consumption
flows
Wealth
stocks
Employment
security Equality
Italy 13.9% 5.8% 2.1% 4.2% -0.3% -0.2%
Lombardy 9.4% 4.8% 2.8% 3.4% -0.3% -1.1%
Figure 6 – Weighted overall growth rates of each specific sub-component (1995-2007)
-2.00%
-1.00%
0.00%
1.00%
2.00%
3.00%
4.00%
Per ca
pita
consum
ption
Voluntary w
orking
Public expen
sesD
efe
nsive expenses
Capita
l stock
R&
D expen
ses (stock)
Hum
an cap
italU
nem
ployment ra
teTem
porary em
ploym
ent ra
te
Non pov
erty
Equa
lity
Inte
rgenera
tional e
quality
Lombardy Italy
4.3. Sensitivity analysis
In this section, we provide estimates of the Index using alternative weighting schemes
to explore the sensitivity of the results to the choice of weights. The choice of an equal
weight for the four components (the baseline setting used in the in previous sections),
reflects the idea that the domains are equally important and implies that every variation
of opposite sign and equal magnitude in any component of the index would
automatically cancel out. Do changes in consumption have as much weight as changes
in employment security or income distribution? Which component should be regarded
as the most relevant? There is no prescriptive rule that could provide a univocal answer
to this question: weights are subjective and their identification process may vary

19
according to people’s opinions and policy makers’ particular purposes. As suggested by
the Stiglitz Commission (2008), it would be interesting to identify weights on the basis
of a public survey in which people were asked to order different aspects of well-being
by a personal judgement on their importance. Since such information is currently
unavailable, we decided to adopt the approach suggested by the literature (Osberg and
Sharpe 2002a; Osberg and Sharpe 2009) and consider two other sets of weights. In
simulation 2 we alter the relative importance of consumption flows and wealth stocks,
without changing the one of employment security and equality. More precisely, we
associate a weight of 0.4 to consumption, 0.1 to wealth stocks, and – as in simulation
one – 0.25 to employment security and 0.25 to equality. The increase in weight given to
consumption is reasonable if it is believed that people value current material goods
more than accumulated stocks of wealth (i.e. future consumption), employment security
and income equality; this may lead to a bias against sustainability (Osberg and Sharpe
2009). Simulation 3, instead, assigns much more importance to employment security
and equality compared to consumption and wealth (weights are: 0.2 to consumption
flows, 0.1 to wealth stocks, 0.3 to employment security and 0.4 to income distribution).
This weighting scheme emphasizes the concept of heterogeneous citizens and economic
security for the future, but reduces the importance of economic sustainability granted by
the accumulation of productive stocks (see Table 1).
Figure 7 and 8 show the trend in the Italian and Lombardy Index for the three
simulations. During the 1995-07 period, the IEWB registered a positive overall
variation in both areas in all the three simulations, but the magnitude and the pattern of
evolution were sensitive to the chosen weights.
In Italy consumption flows grew at a similar rate than wealth stocks until 2001, thus
simulation 1 and 2 are substantially aligned. Between 2001 and 2004, instead,
consumption registered a significant reduction, while capital growth rates remained
positive. As a consequence, the overall increase in economic well-being in simulation 2
is smaller than in simulation 1 (4.5% vs. 5.8%). In Lombardy, since physical capital
grew less than in the rest of the country, the shift in weights from wealth to
consumption causes an upward shift of the whole curve until 2001. The positive
difference between the two simulations accumulated in the late ‘90s was more than
offset by the strong decline in consumption in 2002-2004. The gap between the changes

20
in economic well-being under the two weighting schemes slightly decreased in recent
years.
Given the reduction in both economic security and equality illustrated in section 4.1, the
growth of economic well-being is significantly smaller under simulation 3 than under
the other alternatives (only 2.7% in I and 1.5% in L)18
. The gap between the baseline
case and simulation 3 is the same in both Italy and Lombardy.
In order to highlight the importance of the two new sub-components that we included in
the IEWB (namely the variation in employment security due to the adoption of
temporary contracts, and the change in equality due to the increase in the earnings gap
between young and adult workers), we run a final simulation without them. We assign
equal weights to the four dimensions; the change in employment security is now
entirely due to changes in the unemployment rate, while in the equality index the
importance of variations in poverty is three times that of the Gini index. Results are
shown in Figure 9.
As expected, ignoring the risk associated with temporary employment and the
redistribution from younger generations to older ones, leads to a higher growth of
economic well-being (8.2% vs. 5.8% in I, and 7% vs. 4.8% in L). The gap between the
two measures increases over time, and it is always larger in the whole country. As
discussed in section 4.1, in Italy there was a larger increase in temporary work, and a
smaller growth in intergenerational inequality. Clearly, the effect of the former prevails.
Indeed, when ignoring temporary work, the employment security index increased by
5.8% in Italy, and by 2.7% in Lombardy (compared to a loss of 1.2% in both areas in
the baseline scenario), while – when ignoring intergenerational issues – the equality
index increases by 1.9% and 1.4% respectively (compared to a change of 0% and 2% in
I and L in simulation 1).
18
This is in line with the results of Osberg and Sharpe (2009) for OECD countries.

21
Figure 7 – Evolution of the Index of Economic Well-Being for Italy with different weights
0.95
1.00
1.05
1.10
1.15
1995 1996 1997 1998 1999 2000 2001 2002 2003 2004 2005 2006 2007
Equal weights
More weight to cons. - sim.2
More weight to equal. & empl. sec. - s im.3
Figure 8 –Evolution of the Index of Economic Well-Being for Lombardy with different weights
0.95
1.00
1.05
1.10
1.15
1995 1996 1997 1998 1999 2000 2001 2002 2003 2004 2005 2006 2007
Equal weights
More weight to cons. - sim.2
More weight to equal. & empl. sec. - sim.3

22
Figure 9 – Evolution of the Index of Economic Well-Being with and without intergenerational
inequality and temporary employment
0.95
1.00
1.05
1.10
1.15
1995 1996 1997 1998 1999 2000 2001 2002 2003 2004 2005 2006 2007
IEWB Lombardy
IEWB with no temp. work & intergen. ineq. - L
IEWB Italy
IEWB with no temp. work & intergen. ineq. - I
5. Conclusions
The awareness that GDP is neither a sufficient nor a proper indicator for the evaluation
of the well-being of a society has led to the development of several indexes which
combine economic and social trends, and address environmental and sustainability
issues. In this paper we discuss the application to the Italian case of one of the best
known and most important indexes, the Index of Economic Well-Being developed by
Osberg and Sharpe. The IEWB shifts emphasis from production to consumption,
emphasizes the household perspective, measures non-market activities, includes
information on wealth, gives prominence to the distribution of income, and highlights
economic security. We argue that the application of this index to the Italian context
requires some changes in the consideration of the income distribution and economic
security domains.
More precisely, after the labour market reforms of the ‘90s economic insecurity
increased considerably because new forms of labour contracts were introduced, which
were all fixed-term, with very low social security contribution and social protection.
The use of these contracts spread very rapidly in the whole country, replacing the “fear

23
of job loss” with the “fear of not finding a new job” at the end of the current one, and
with the fear of not being able to accumulate enough contribution for future pension
benefits. Therefore, the incidence of this phenomenon is an important component of
employment insecurity in Italy. We account for it by specifying the index of
employment security as the evolution of 1 minus the share of unemployed and
temporary workers over the labour force.
A second issue regards the equality dimension. We argue that the IEWB should
explicitly consider the evolution of the earnings gap between young generations (i.e.
those who are at the stage of the life cycle devoted to household formation and fertility
decisions) and older ones (i.e. those who have already faced these choices). Indeed, if
the earnings gap between these two groups increases, the position of the younger ones
weakens, making them more dependent on intergenerational transfers, especially if the
welfare system does not compensate for this relative loss. This may cause a delay in
leaving the parental home, in family formation and in fertility decisions, with clear
consequences for the future of the society itself. Therefore we add the earnings gap
between the young (less than 35 years of age) and the adults (more than 35), as a sub-
component of the inequality dimension.
We used the revised version of the IEWB to analyse the trends in economic well-being
in Italy and in Lombardy (the leading Italian region) over the 1995-2007 period.
Consistently with the findings of Osberg and Sharpe (2009), the Index of Economic
Well-being advanced at a slower rate than GDP, and the gap between the two measures
widened especially in the late 1990s. This gap is lower in Lombardy, mainly because
per-capita GDP growth was lower, whereas the overall variation of the IEWB was very
similar in the two areas. The rise in economic well-being is the result of an increase in
consumption flows and wealth stocks, and a small reduction in economic security and
equality. The negligible change of the employment security index was the result of an
increase in the incidence of temporary work, which lead to a reduction in employment
security (-8% and -4.6% in Italy and Lombardy respectively), and a decrease in the
unemployment rate which translated into a rise of the index (+6.9% in I and +3.4% in
L). The variation in overall income equality was larger in Lombardy than in the whole
country (-4.4% and -0.9% respectively), mainly due to a much larger increase in the
income gap between young and older individuals.

24
We explored the sensitivity of our results to the choice of weights given to the different
dimensions. We showed that a shift in weights from consumption flows and wealth
stocks to equality and employment security, causes a significantly smaller growth of
economic well-being (only 2.7% in Italy and 1.5% in Lombardy). This is due to the
reduction in both economic security and equality dimensions. Instead, if we ignore the
risk associated with temporary employment and the redistribution from younger
generations to older ones, we obtain a higher growth of economic well-being (8.2% vs.
5.8% in Italy, and 7% vs. 4.8% in Lombardy), and this difference increases over time.
These results highlight the role of the new dimensions that we have introduced in the
Italian version of IEWB. In particular, they suggest that policy makers interested in
improving the economic well-being in Italy should pay careful attention to the
distribution of earnings between generations, and consider the effect of increasing
labour market flexibility on present and future economic insecurity.

25
Appendix A. Methodology
The index has been constructed according to the following formula (consistent with the
IEWB approach):
4
1
( 1)k
t k t k
k
IEWB Iα α=
= =∑ ∑ ,
where kα is the subjective weight attached to dimension k, and
k
tI
is the index number
of dimension k at time t (the basic year is 1995). Each dimension can have more than
one sub-component:
[ ][ ]
1
0 0 0 0
2
0 0 0
3 0 0 0 0 0
0 0 0 0 0 0 0 0 0 0 0 0 0
4
0
&
&
1 ( ) /
1 ( ) /
1 1
1
A
pc t pc t pc t pc t
t A
pc pc pc pc
pc t pc t pc t
t
pc pc pc
t t t t tt
o t t
tt
C G UP DI
C G UP D
K R D HCI
K R D HC
U TW LF LF U LF U TW LF TWI
U TW LF LF U TW LF U LF U TW LF TW LF U TW
SSTI
SSTβ γ
+ + −=
+ + −
+ +=
+ +
− += = − −
− + − − − − − −
− −= +
− 0 0
( / )(1 )
1 ( / )
t Y A t
Y A
Gini Y Y
Gini Y Yβ γ+ − −
−
Where:
Consumption Flows Index:
pcCA = per-capita consumption expenditures on final goods and services (at constant
prices) adjusted for the index of equivalence scales and life expectancy index
pcG = per-capita current public expenditures at constant prices
pcUP = per-capita value of non-paid work (housework and charity work) at constant
prices
pcD = per-capita defensive expenses (costs due to commuting activities and road
accidents) at constant prices
Wealth Stocks Index :
pcK= per-capita physical capital stock at constant prices
pcR&D = per-capita R&D stock at constant prices
pcHC = per-capita human capital stock at constant prices

26
Employment Security Index:
U = unemployed
TW = temporary workers (parasubordinati, interinali and irregular workers)
LF = labour force
Equality Index:
SST = intensity of poverty (Sen–Shorrocks–Thon Index)
Gini = Gini coefficient of income inequality
YY = average earning of young workers (with less than 35 of age)
AY = average earning of adult workers (with more than 35 of age)
β, γ = subjective relative weights associated with poverty and inequality
27
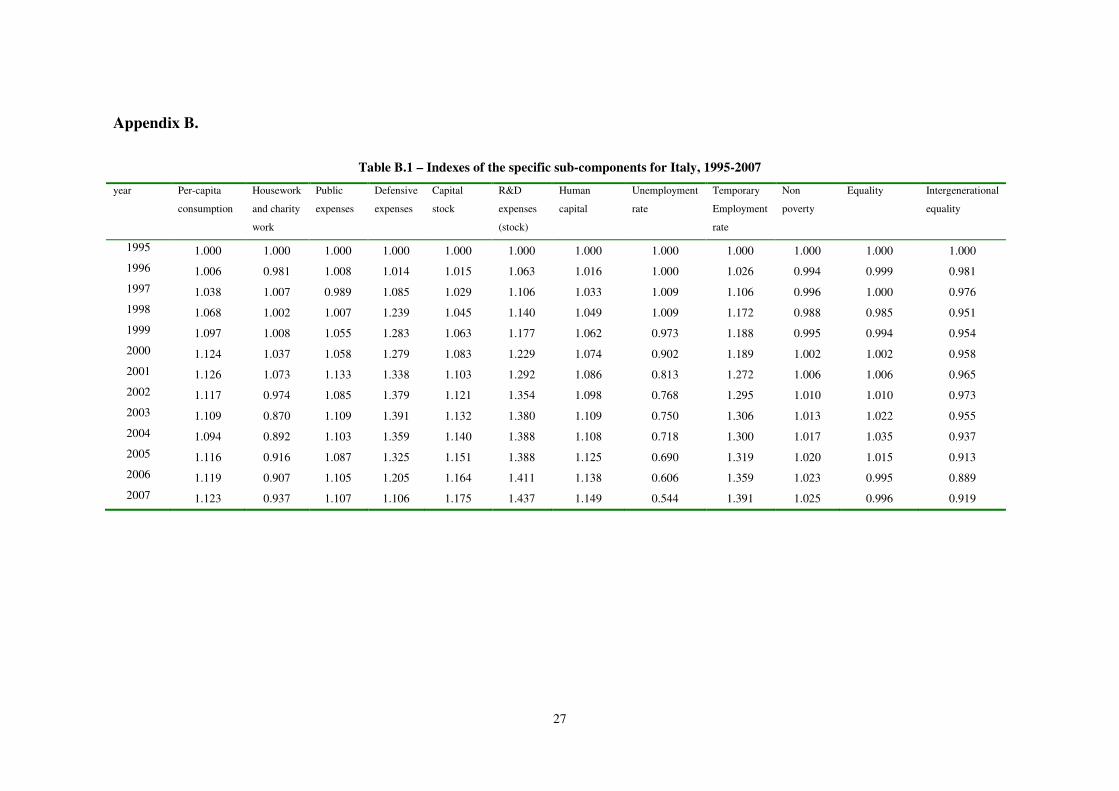
Appendix B.
Table B.1 – Indexes of the specific sub-components for Italy, 1995-2007
year Per-capita
consumption
Housework
and charity
work
Public
expenses
Defensive
expenses
Capital
stock
R&D
expenses
(stock)
Human
capital
Unemployment
rate
Temporary
Employment
rate
Non
poverty
Equality Intergenerational
equality
1995 1.000 1.000 1.000 1.000 1.000 1.000 1.000 1.000 1.000 1.000 1.000 1.000
1996 1.006 0.981 1.008 1.014 1.015 1.063 1.016 1.000 1.026 0.994 0.999 0.981
1997 1.038 1.007 0.989 1.085 1.029 1.106 1.033 1.009 1.106 0.996 1.000 0.976
1998 1.068 1.002 1.007 1.239 1.045 1.140 1.049 1.009 1.172 0.988 0.985 0.951
1999 1.097 1.008 1.055 1.283 1.063 1.177 1.062 0.973 1.188 0.995 0.994 0.954
2000 1.124 1.037 1.058 1.279 1.083 1.229 1.074 0.902 1.189 1.002 1.002 0.958
2001 1.126 1.073 1.133 1.338 1.103 1.292 1.086 0.813 1.272 1.006 1.006 0.965
2002 1.117 0.974 1.085 1.379 1.121 1.354 1.098 0.768 1.295 1.010 1.010 0.973
2003 1.109 0.870 1.109 1.391 1.132 1.380 1.109 0.750 1.306 1.013 1.022 0.955
2004 1.094 0.892 1.103 1.359 1.140 1.388 1.108 0.718 1.300 1.017 1.035 0.937
2005 1.116 0.916 1.087 1.325 1.151 1.388 1.125 0.690 1.319 1.020 1.015 0.913
2006 1.119 0.907 1.105 1.205 1.164 1.411 1.138 0.606 1.359 1.023 0.995 0.889
2007 1.123 0.937 1.107 1.106 1.175 1.437 1.149 0.544 1.391 1.025 0.996 0.919

28
Table B.2 – Indexes of the specific sub-components for Lombardy, 1995-2007
year Per-capita
consumption
Housework
and charity
work
Public
expenses
Defensive
expenses
Capital
stock
R&D
expenses
(stock)
Human
capital
Unemployment
rate
Temporary
Employment
rate
Non
poverty
Equality Intergenerational
equality
1995 1.000 1.000 1.000 1.000 1.000 1.000 1.000 1.000 1.000 1.000 1.000 1.000
1996 1.023 0.965 1.002 1.024 1.014 1.031 1.010 0.983 0.990 0.997 0.971 0.999
1997 1.064 1.002 1.028 1.079 1.026 1.053 1.027 0.933 1.082 0.998 0.974 0.999
1998 1.094 0.999 1.088 1.321 1.040 1.011 1.045 0.883 1.124 0.989 0.935 0.997
1999 1.113 1.031 1.125 1.379 1.055 1.038 1.056 0.767 1.073 0.996 0.962 0.928
2000 1.130 1.079 1.232 1.419 1.071 1.068 1.064 0.667 1.026 1.003 0.990 0.860
2001 1.129 1.117 1.293 1.484 1.088 1.110 1.075 0.567 1.070 1.003 0.989 0.858
2002 1.114 1.015 1.236 1.467 1.103 1.157 1.090 0.583 1.103 1.003 0.988 0.857
2003 1.102 0.908 1.257 1.384 1.109 1.176 1.089 0.600 1.117 1.005 0.992 0.873
2004 1.084 0.922 1.286 1.324 1.112 1.157 1.091 0.671 1.121 1.007 0.996 0.890
2005 1.109 0.960 1.263 1.295 1.116 1.142 1.107 0.679 1.086 1.007 0.983 0.818
2006 1.119 0.952 1.254 1.231 1.126 1.154 1.120 0.617 1.148 1.006 0.971 0.746
2007 1.127 0.975 1.300 1.219 1.136 1.172 1.132 0.571 1.201 1.006 1.004 0.808

29
References
Bank of Italy, 2009. Relazione annuale sul 2008, Rome.
Barbieri, P., Scherer, S., 2005. Le conseguenze sociali della flessibilizzazione del mercato del
lavoro in Italia. Stato e Mercato 74, 291-321.
Berloffa, G., Villa P., 2007. Inequality across cohorts of households: evidence from Italy.
Discussion Paper 11/2007, Department of Economics, University of Trento
Boeri, T., Brandolini, A., 2005. The Age of Discontent: Italian Households at the Beginning of
the Decade. IZA Discussion Paper 1530.
Brandolini A., Cannari L., D’Alessio G., Faiella I., 2004. Household wealth distribution in Italy
in the 1990s. Bank of Italy, Temi di discussione 530.
Brandolini A., Casadio P., Cipollone P., Magnani M., Rosolia A., Torrini R., 2007.
Employment growth in Italy in the 1990s: institutional arrangements and market forces. In
Acocella N., Leoni R. (Eds.), Social Pacts, Employment and Growth, Physica-Verlag,
Heidelberg, 31-68.
Brandolini, A., 2009a. L’evoluzione recente della distribuzione del reddito in Italia. In
Brandolini, A., Saraceno, C., Schizzerotto, A. (Eds). Dimensini della disuguaglianza in Italia:
povertà, salute, abitazione. Il Mulino.
Brandolini, A., 2009b. Indagine conoscitiva sul livello dei reddito di lavoro nonché sulla
redistribuzione della ricchezza in Italia nel periodo 1993-2008. 11a Commissione, Senato
della Repubblica.
Cipollone, P., 2001. Is the Italian labour market segmented?. Bank of Italy, Temi di discussione
400.
Cipollone, P., Guelfi, A., 2006. The value of flexible contracts: evidence from an Italian panels
of industrial firms. Bank of Italy, Temi di discussione 583.
Ferrarini, A., Bodini, A., Becchi, M., 2001. Environmental quality and sustainability in the
province of Reggio Emilia (Italy): using multi-criteria analysis to assess and compare
municipal performance. Journal of Environmental Management, 63(2), 117-131.
Modena, F., Rondinelli, C., 2010. Leaving home and housing costs. The experience of Italian
youth emancipation. Mimeo
Nomisma, 2005. The Italian Property Market in 2004: Trends, Forecasts and Players. Nomisma
Real Estate.
OECD, 2008a. Statistics, Knowledge and Policy 2007: Measuring and Fostering the Progress of
Societies (Complete Edition - ISBN 9264043233). General Economics & Future Studies, 6, 1-
567.
OECD, 2008b. Handbook on Constructing Composite Indicators. Methodology and user guide.
OECD Publications, Paris.
Osberg, L., 1985. The measurement of economic wellbeing. In: Laidler, D. (coordinator),
Approaches to economic well-being, vol. 26 of the Research Program of the Royal
Commission of the Economic Union and Development Prospects for Canada.
Osberg, L., 2009. Measuring Economic Security in Insecure Times: New Perspectives, New
Events, and the Index of Economics Well-Being. CSLS Research Report 2009-12.
Osberg, L., Sharpe, A., 1998. An index of economic well-being for Canada. Applied Research
Branch, Research Paper R-99-3H, Human Resources Development Canada, Ottawa, Ontario.
Osberg, L., Sharpe, A., 2002a. International Comparisons of Trends in Economic Well-being.
Social Indicators Research, 58, 349-382.
Osberg, L., Sharpe, A., 2002b. An Index of Economic Well-being for OECD Countries. Review
of Income and Wealth, 48(3), 291-316.

30
Osberg, L., Sharpe, A., 2005. How Should We Measure the “Economic” Aspect of Well-being?.
Review of Income and Wealth, 51(2), 291-316.
Osberg, L., Sharpe, A., 2009. New Estimates of the Index of Economic Well-being for Selected
OECD Countries, 2980-2007. CSLS Research Report 2009-11.
Pulselli, F.M., Ciampalini, F., Tiezzi, E., Zappia, C. (2006). The index of sustainable economic
welfare (ISEW) for a local authority: A case study in Italy. Ecological Economics, 60(1),
271-181.
Rosolia, A., 2009. L’evoluzione delle retribuzioni in Italia tra il 1986 e il 2004 secondo i dati
dell’archivio WHIP. Lavoro preparatorio per la Commissione interistituzionale di Indagine
sul Lavoro.
Rosolia, A., Torrini, R., 2007. The generation gap: relative earnings of young and old workers
in Italy. Bank of Italy, Temi di discussione 639.
Sharpe, A., 1999. A Survey of Indicators of Economic and Social Well-being. Centre for the
Study of Living Standards.
Smith, J., 2003. Guide to the Construction and Methodology of the Index of Economic Well-
being. Centre for the Study of Living Standards.
Stiglitz Commission, 2008. Survey of Existing Approaches to Measuring Socio-Economic
Progress. Joint Insee-OECD document prepared for the first plenary meeting of CMEPSP by (at
Insee) Afsa, C., Blanchet, D., Pionnier, P.A., Rioux, L., Mira d’Ercole, M., Ranuzzi, G.,
Schreyer, P..
Stiglitz Commission, 2009. Report by the Commission on the Measurement of Economic
Performance and Social Progress. Paris.