economics 2333: topic #8: health and mortality professor robert a. margo spring 2014
TRANSCRIPT
Economics 2333: Topic #8: Health and Mortality
Professor Robert A. MargoSpring 2014

Outline
• Background: Mortality Decline and Anthropometrics
• Almond• Bleakley (student presentation)• Ferrie-Troesken
3
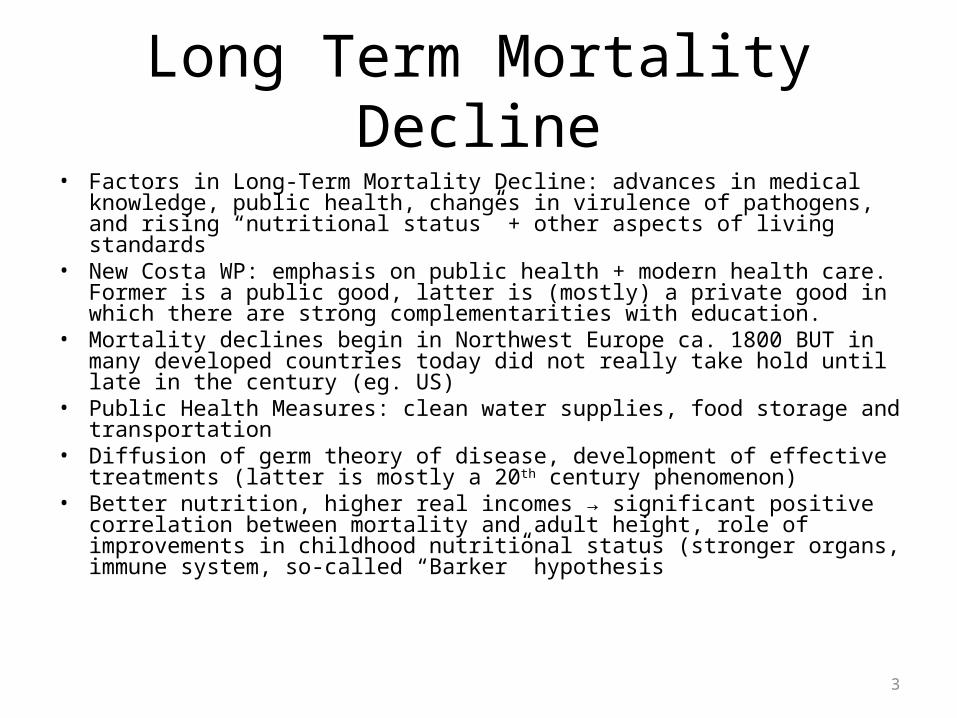
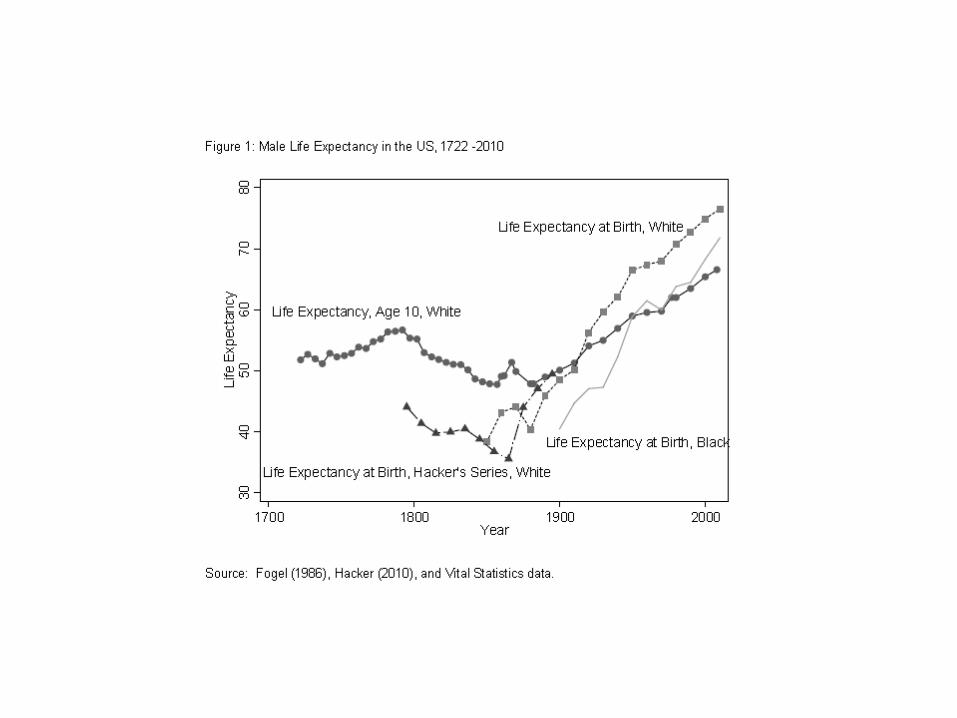
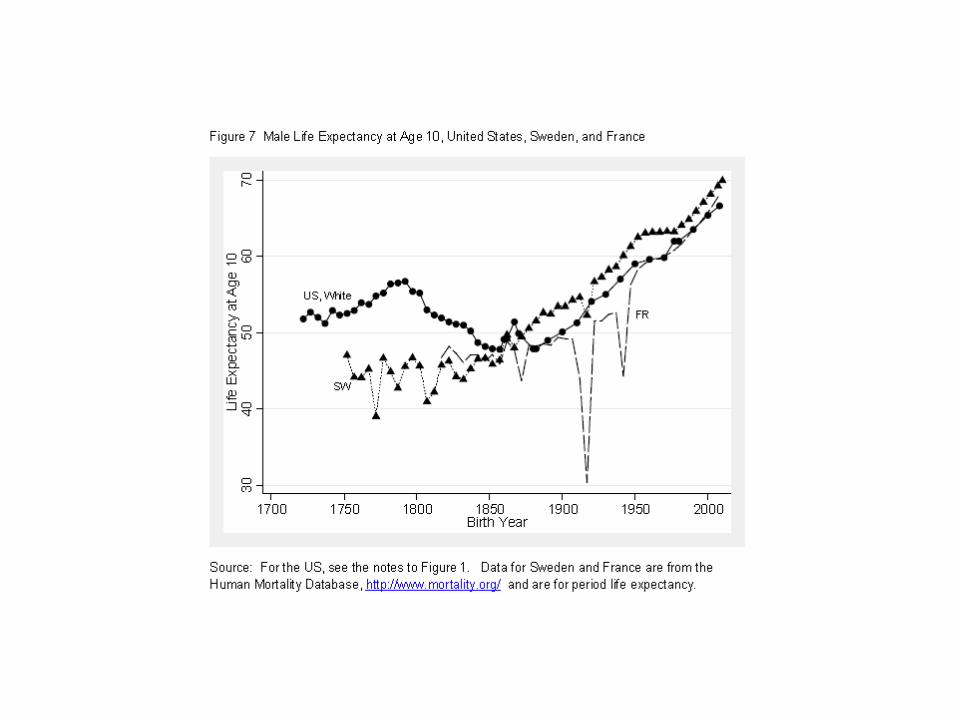
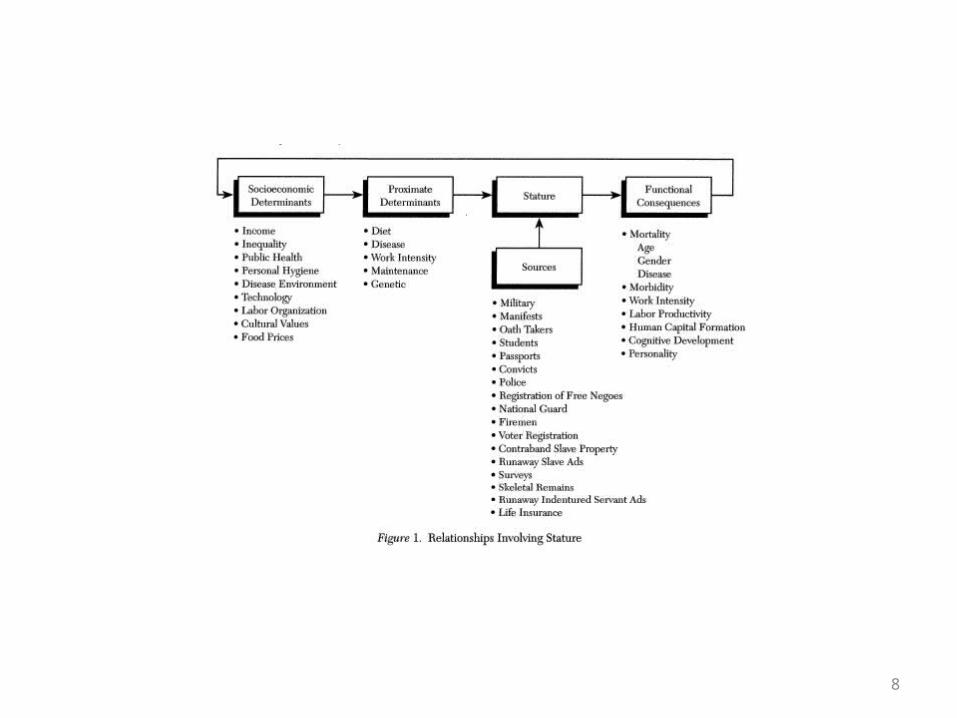
Long Term Mortality Decline• Factors in Long-Term Mortality Decline: advances in medical knowledge,
public health, changes in virulence of pathogens, and rising “nutritional status” + other aspects of living standards
• New Costa WP: emphasis on public health + modern health care. Former is a public good, latter is (mostly) a private good in which there are strong complementarities with education.
• Mortality declines begin in Northwest Europe ca. 1800 BUT in many developed countries today did not really take hold until late in the century (eg. US)
• Public Health Measures: clean water supplies, food storage and transportation• Diffusion of germ theory of disease, development of effective treatments
(latter is mostly a 20th century phenomenon)• Better nutrition, higher real incomes → significant positive correlation
between mortality and adult height, role of improvements in childhood nutritional status (stronger organs, immune system, so-called “Barker” hypothesis

4
7
Anthropometry• Anthropometry: study of human growth: Steckel is a key figure• VERY important subfield in economic history BECAUSE such data informs about “nutritional
status”• Nutritional status is a key determinant of morbidity and mortality AND useful as a indicator
of living standards• Primary concepts: height by age, weight by age, BMI (weight/height2), velocity, age at which
adult height is reached, timing of adolescent growth spurt• Relationship between BMI and relative mortality: Waaler curve• For some population comparisons genetic differences are important but not that important
for US• Key idea: under-nutrition in infancy and early childhood can have long term negative
consequences• Waaler surface: U-shaped relationship between (relative) mortality and BMI (NOTE: U-
shaped pattern, birthweight and infant mortality)• Modern problem: Obesity. BUT in recent decades obesity-mortality relationship has
weakened (but obesity is still a major factor in disability at older ages).• Historical problem: low BMI• Nutrition and Mortality: (a) famine (b) persistent malnutrition• Except for some well-known events (eg. Irish potato famine) (b) much more important in
European history than (a)• Sources of famines: harvest failures versus government policy (Amartya Sen)
8
9
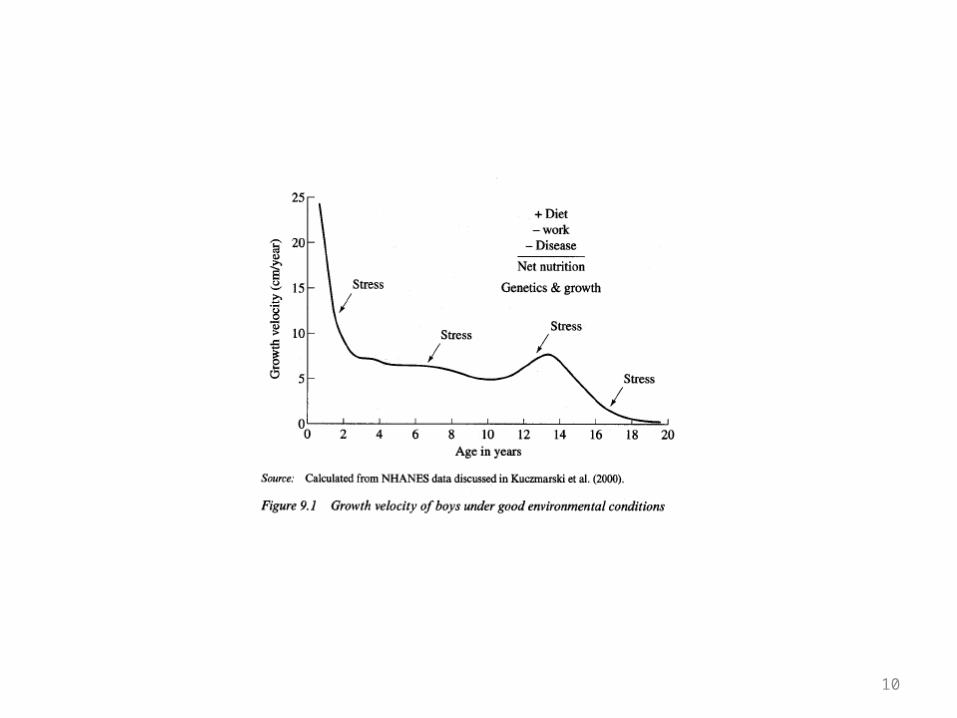
Figures and Tables on Height and BMI
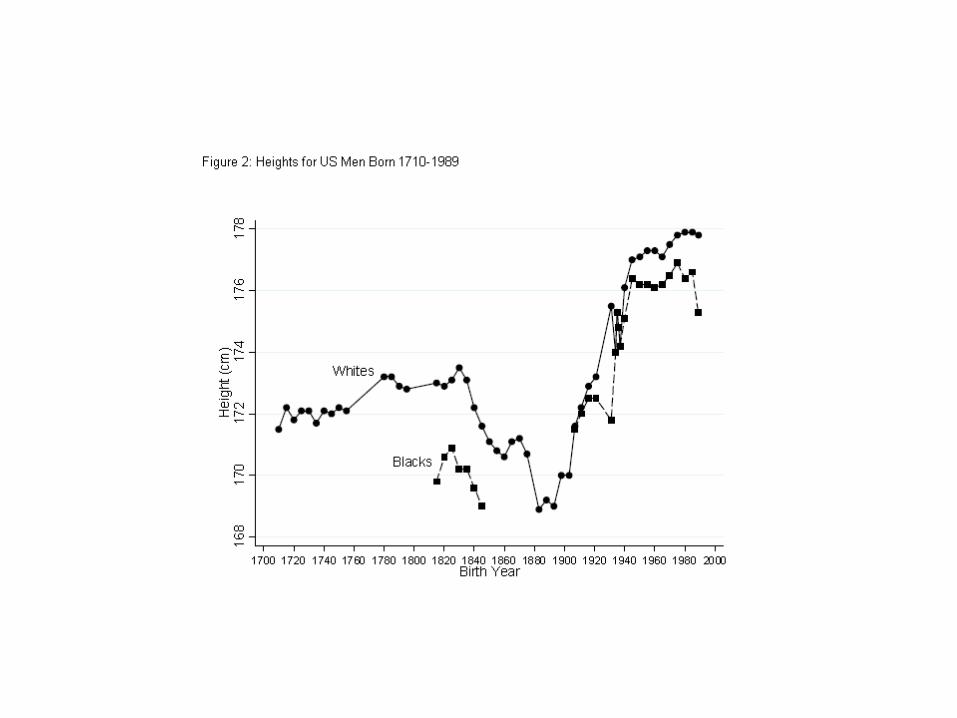
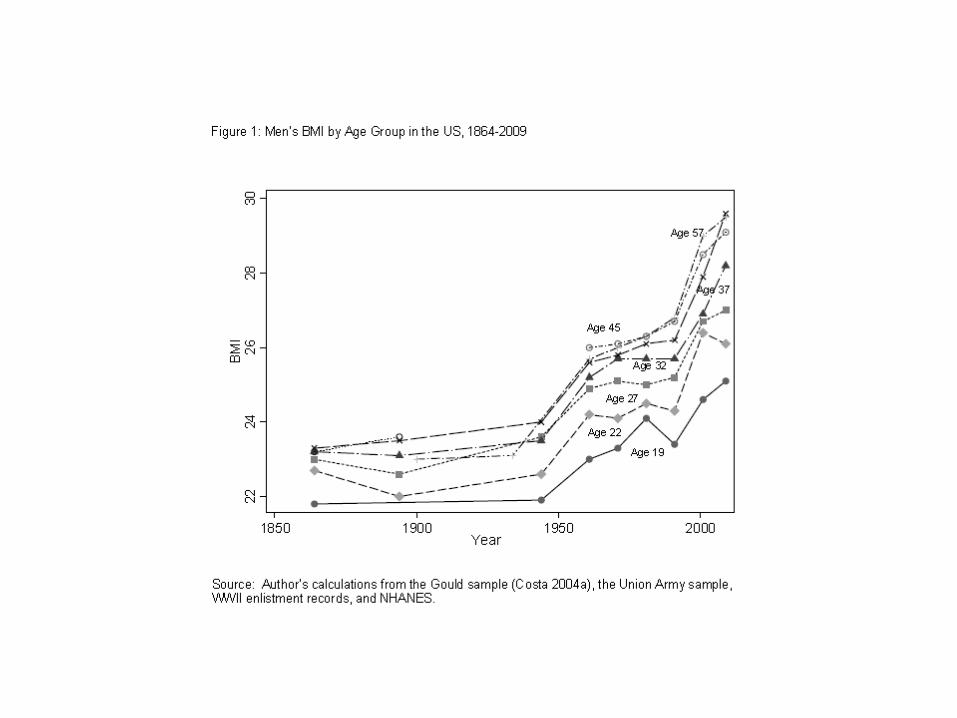
• Modern growth profile under good environmental conditions• Long term trends in height. Substantial gains in stature over time,
particularly in European countries. Early achievement of modern stature in US during colonial period followed by cycles in C19 (“antebellum paradox”).
• Relationship between BMI and mortality, Civil War to present.• Negative relationship between mortality and education.• Important case study of American slaves (Steckel JEH 1986). Extremely
poor nutritional status in infancy and early childhood, followed by catch-up growth.
10


15

16
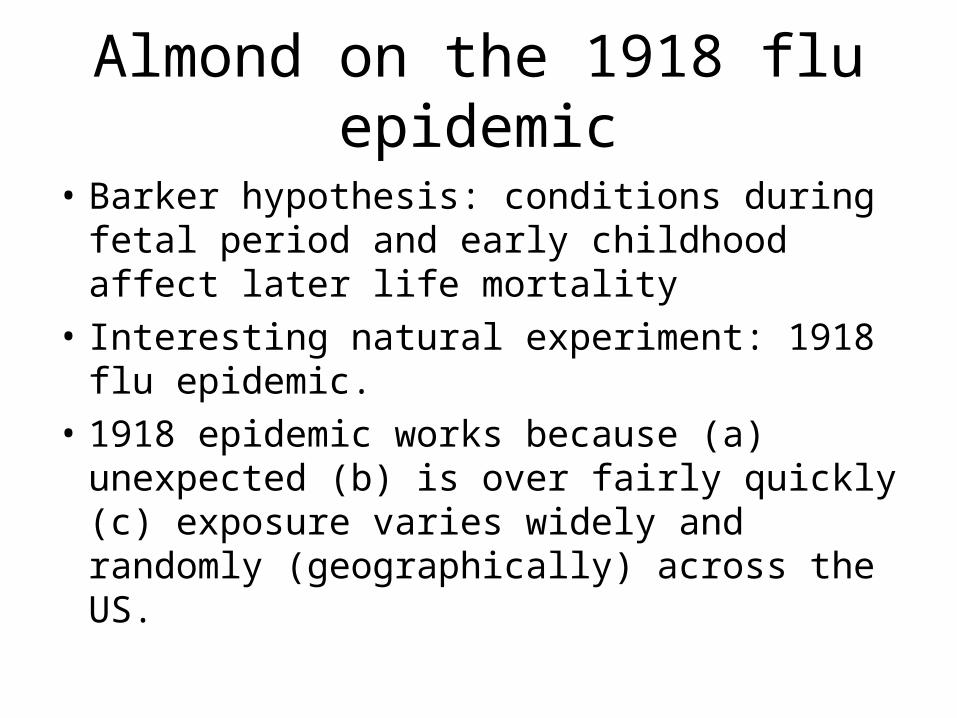
Almond on the 1918 flu epidemic
• Barker hypothesis: conditions during fetal period and early childhood affect later life mortality
• Interesting natural experiment: 1918 flu epidemic.
• 1918 epidemic works because (a) unexpected (b) is over fairly quickly (c) exposure varies widely and randomly (geographically) across the US.

Empirical Strategy• 1960-80 IPUMS records quarter of birth, so look at cohorts
just before and just after. Compare outcomes for cohorts “treated” by the flu. Understates likely impact because of selective attrition.
• Intensity is more difficult to track but based on timing of arrival and the fact that virulence diminished over time, some variation across census divisions. Some evidence that later exposure had smaller long run effects but evidence is fairly weak.


Further decompositions
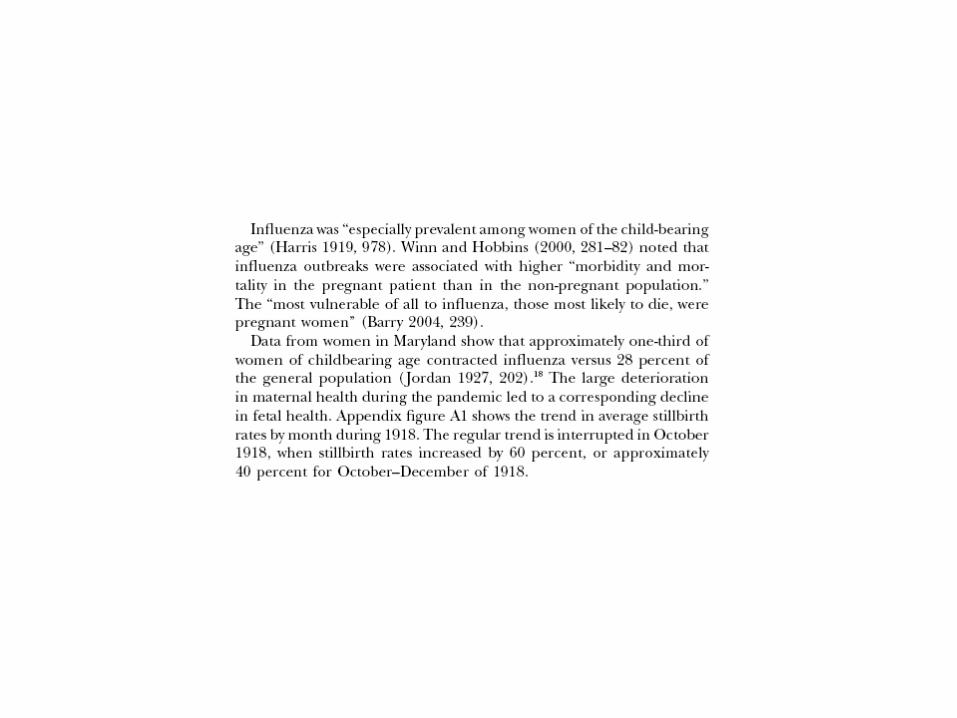
• Effects can operate through different channels: in utero, after birth, and attrition
• Almond attempts to isolate these using measures of maternal infection, and infant mortality, and a measure of attrition.
• Maternal infection effect is strongly negative, consistent with Barker hypothesis.


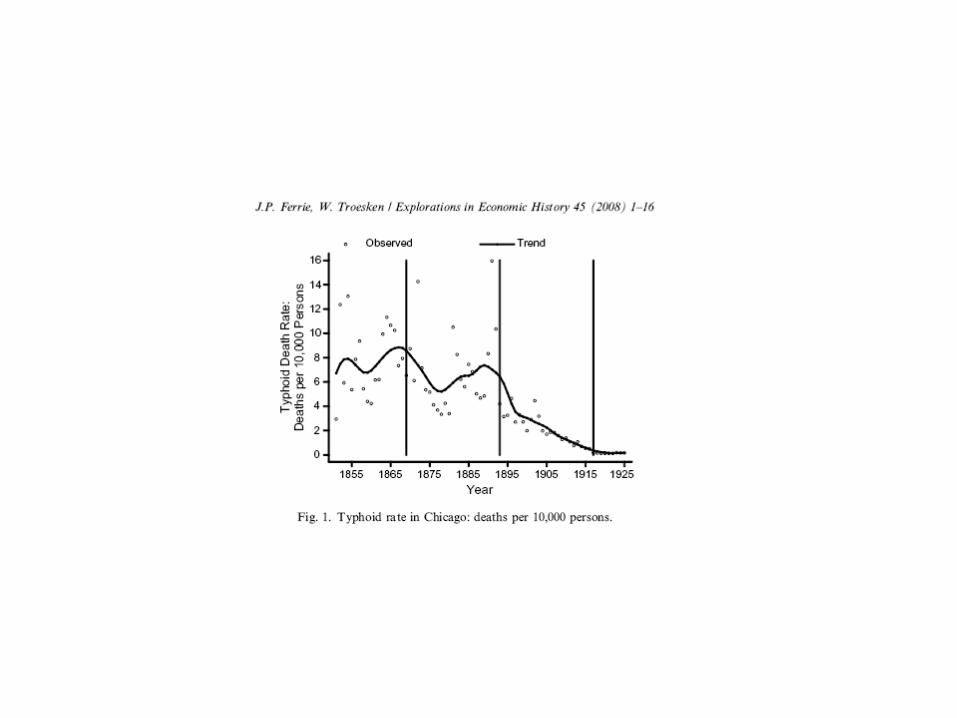
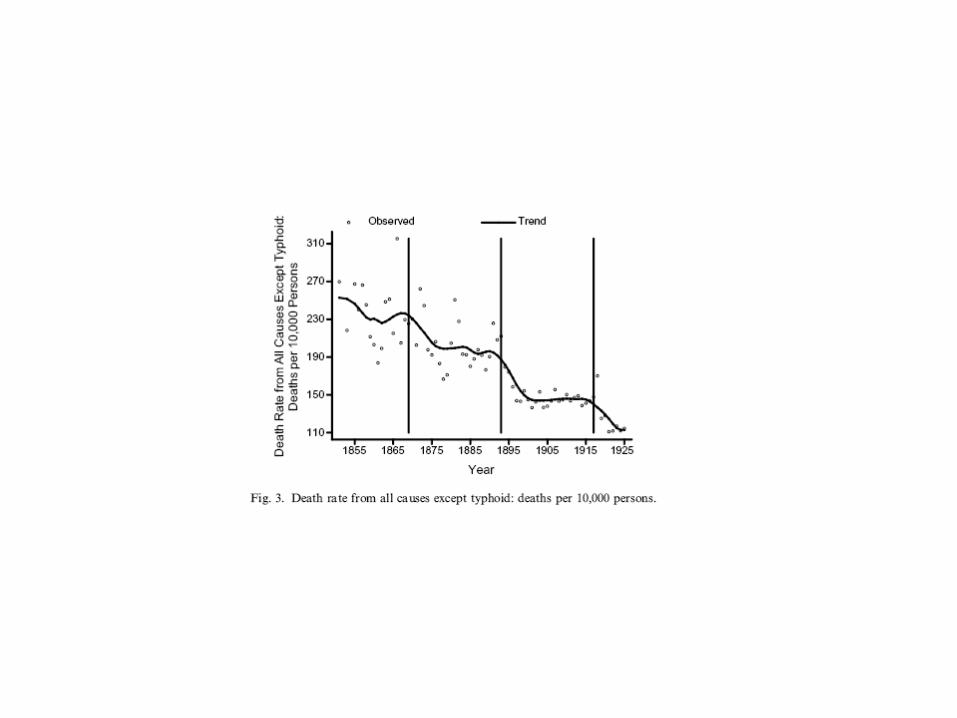
Ferrie and Troesken on Typhoid• Examines effects of clean water on typhoid, case study of Chicago but
results clearly relevant to other major cities.• Over 1880-1925 period CDR in Chicago fell by 60 percent. Up to half,
according to FT, can be attributed to reductions in deaths from water-born diseases, typhoid in particular.
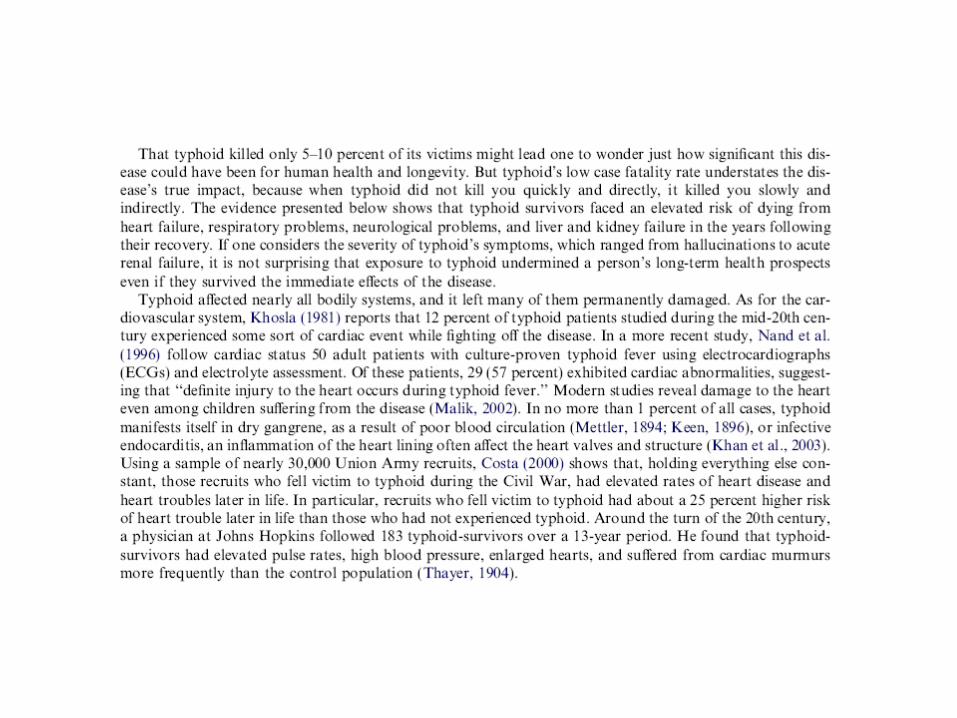
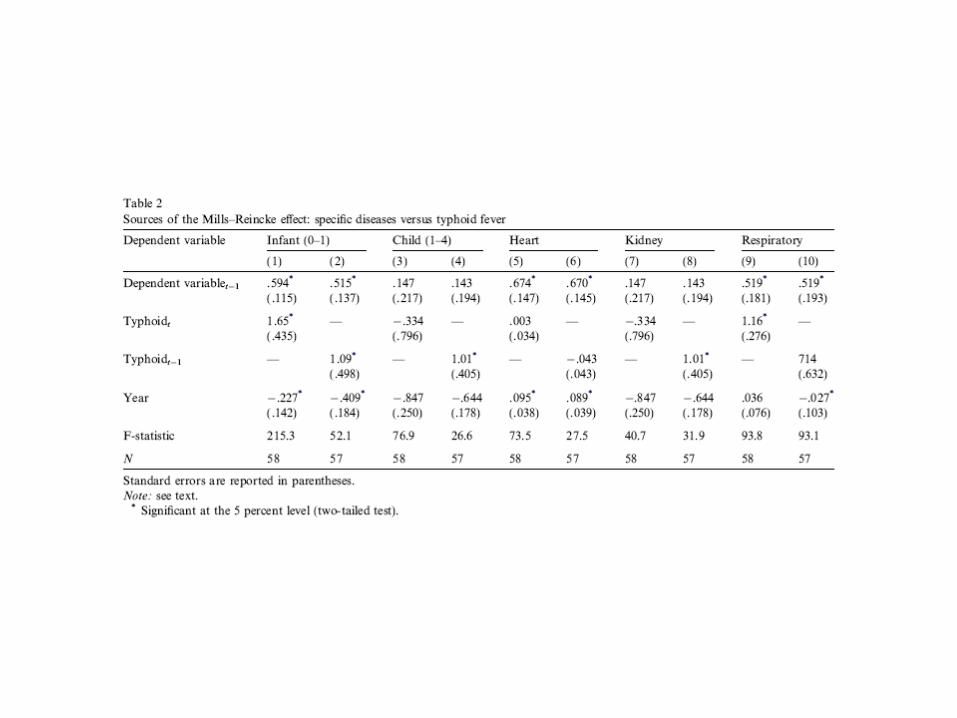
• Effects are direct (typhoid deaths decline) and indirect (typhoid survivors often succumbed to other diseases, so called Mills-Reincke).
• Three major water projects: (1) ca. late 1860s, tunnel under Lake Michigan to bring in water far from polluted shoreline; water tower and pumping station; deepening of Illinois and Michigan canal (2) completion of in-take cribs and closing of shoreline sewage disposal (3) Wilson avenue in-take crib and chlorination of water supply.
• Improvements in water supply seem to coincide with reductions in typhoid but also deaths from other causes: Mills-Reincke.


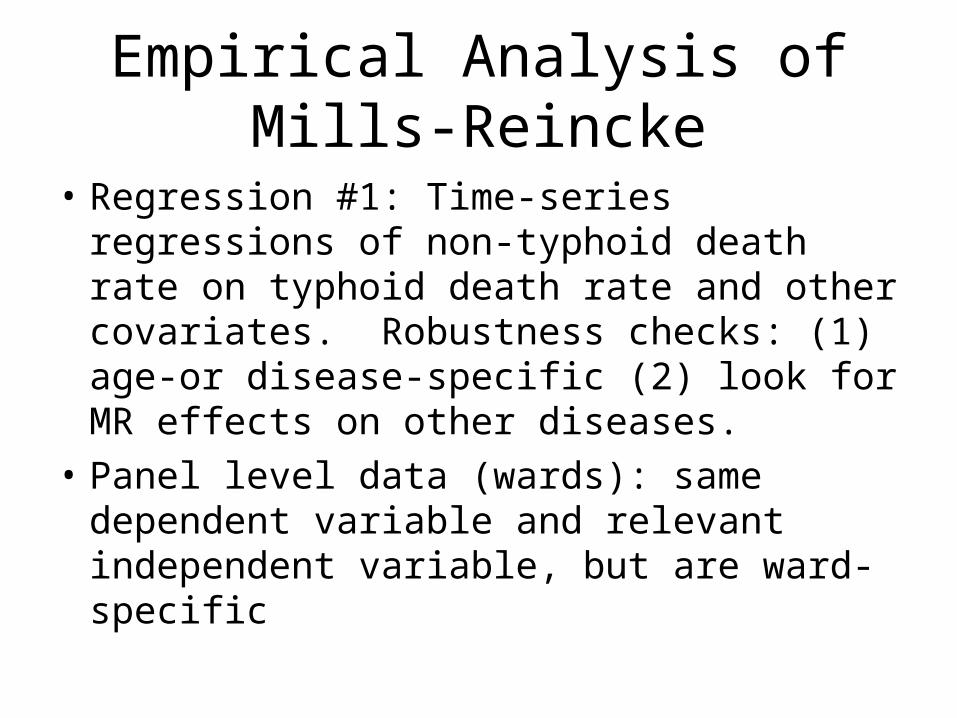
Empirical Analysis of Mills-Reincke
• Regression #1: Time-series regressions of non-typhoid death rate on typhoid death rate and other covariates. Robustness checks: (1) age-or disease-specific (2) look for MR effects on other diseases.
• Panel level data (wards): same dependent variable and relevant independent variable, but are ward-specific


Explanatory power and cost-benefit analysis
• Table 5 evaluates impact of reductions in typhoid, direct and indirect. Effects are quite large, 30-50 percent of total decline in death rate, depends on the assumed MR effect (lower bound is 4 deaths averted per typhoid death, upper bound is 7).
• Table 6: simple cost benefit analysis of lives saved through improvements in water quality. Social rate of return is very high.