economics by jeff rubin & strategy -...
TRANSCRIPT

JeffreyRubin AveryShenfeld BenjaminTal PeterBuchanan WarrenLovely DavidBezic (416)594-7357 (416594-7356 (416)956-3698 (416)594-7354 (416)594-7359 (416)956-3219
CIBC World Markets Inc. • PO Box 500, 161 Bay Street, BCE Place, Toronto, Canada M5J 2S8 • Bloomberg @ WGEC1 • (416) 594-7000C I B C W o r l d M a r k e t s C o r p • 3 0 0 M a d i s o n A v e n u e , N e w Yo r k , N Y 1 0 0 1 7 • ( 2 1 2 ) 8 5 6 - 4 0 0 0 , ( 8 0 0 ) 9 9 9 - 6 7 2 6
Strategecon
Economics & Strategy
http://research.cibcwm.com/res/Eco/EcoResearch.html
JeffreyRubin(416)594-7357
AveryShenfeld(416)594-7356
BenjaminTal(416)956-3698
PeterBuchanan(416)594-7354
MenyGrauman(416)956-6527
KrishenRangasamy(416)956-3219
Recent announcements from OPEC andChinawon’tbesufficienttoholdoilpricesincheck.Theadditional200,000barrelsperdaypledgedfromSaudiArabiaisapittancecomparedtothefourmillionbarrelsperdaythatdepletionwillhiveoffworldproductionthisyear.Whatlittle increaseinproductionSaudi is capable of will probably all begobbledupbythatcountry’sownvoraciousappetite for energy. Nor is the $145 pertonnecut (48centspergallon) inChinesefuelsubsidieslikelytodentdemandmuch.MostNorthAmericanswouldgladlylineupatthepumpsforChina’snow$3.25agallongas,particularlythoseofuswholivenorthoftheborder.
With half of the world’s population neverhaving topayworldoilprices, it shouldn’tcome as a great surprise that $130 perbarrelcrudepriceshaveyettoquashworlddemand. And the only supply response todate has been yet another round of costoverrunsandlengthyprojectdelaysrunningthe gamut from Canadian oil sands todeepwaterGulfofMexicowells.
Withthebasiclawsofsupplyanddemandnolongeroperativeincrudeoilmarkets,wearecompelledtoonceagainraiseourtargetprices for oil.Weare liftingour target forWestTexas Intermediateby$20perbarreltoanaveragepriceof$150nextyearandby $50 per barrel to an average price of$200perbarrelby2010.Underprevailingrefinerymargins, thatshouldtranslate intoanear-$7pergallonpumppricewithintwoyears,a70%increasefromtoday’salreadyrecordlevels.
HigheroilpricesspellstagflationfortheUSeconomy next year, and we have markeddown our GDP growth forecast to barelyover1%for2009(pages9-11).Thebiggestimpactswillbeintransportandnonegreaterthantheadjustmentsontheroad.Afterall,America is the quintessential land of thecar.
Asgasolinepricesclimbinexorably,Americandrivinghabitsaregoingtohavetoundergoa massive change, mimicking the drivinghabitslongadoptedbyEuropeanswhohavefacedmuchhighergasprices.Averagemilesdriven will likely fall by as much as 15%,whilethemarketshareoflighttrucks,SUVsand vans will be literally halved, reversingthe trendof the lastfifteen years.But themost fundamental, and unprecedentedchangewillbeinthenumberofvehiclesontheroad.
Over the next four years, we are likely towitnessthegreatestmassexodusofvehiclesoffAmerica’shighwaysinhistory.By2012,there should be some 10 million fewervehiclesonAmerican roadways than therearetoday—adeclinethatdwarfsallpreviousadjustmentsincludingthoseduringthetwoOPEC oil shocks (see pages 4-8). Many ofthose in the exit lane will be low incomeAmericans from households earning lessthan $25,000 per year. Incredibly, over 10millionofthoseAmericanhouseholdsownmorethanonecar.
Soontheywon’townany.
“Over the next four years, we are likely to witness the greatest mass exodus of vehicles o f f A m e r i c a ’ s h i g h w a y s i n history. By 2012, there should be some 10 million fewer vehicles on American roadways than there are today ...”
Heading for the Exit LanebyJeffRubin
June 26, 2008

CIBC World Markets InC. StrategEcon - June 26, 2008
2
MARKET CALL
INTEREST & FOREIGN EXCHANGE RATES
Upwardrevisionstoourcallforstill-higheroilpriceswilladdtothepressureontheFedtocalminflationexpectationsbyraisingrates.BestbetsforthefirstmovearerightaftertheNovemberelections.Withinflationrunningata4%clip,takingtherealfundsratetozerowillrequirea200-bptighteningbyautumn2009,amovetheFedwillbeforcedintoevenifitmeansleavingtheeconomygrowingataslowcrawl.
TheCanadianyieldcurvepricesinalaterstartforBankofCanadatightening,whichlooksappropriategiventhehigherstartingpointforyieldsandthelowerstartingpointforCPI.ButbothinflationandrateswillbeheadedhigherastheshelteringimpactonCPIfromearlierhugeC$gainsbeginstowane.AsintheUS,ratehikeswillbegetexpectationsformoretocome,puttingpressurefurtheroutthecurve.
TheECBseemsdeterminedtothrowinaquarter-pointratehiketoshowitscoloursasaninflationfighter,amovethatmighttemporarilylifttheeurowhiletheFedbidesitstime.Butoverall,2009willbeabetteryearfortheUSdollarastheFedreducesthedollar’syielddisadvantage.TheBankofCanada’smoremodestratehikeswouldn’tdomuchfortheC$ontheirown,butshouldliftthelooniethroughparitywhenbuttressedbysoaringoilandgaspricesandrelatedM&Ainflows.
•
•
•
2008 2009
END OF PERIOD: 25-Jun Sep Dec Mar Jun Sept Dec
CDA Overnight target rate 3.00 3.00 3.00 3.25 3.50 4.00 4.0098-Day Treasury Bills 2.62 2.70 2.80 3.20 3.35 3.75 3.70Chartered Bank Prime 4.75 4.75 4.75 5.00 5.25 5.75 5.752-Year Gov't Bond (3.75% 6/10) 3.23 3.40 3.60 3.85 3.95 4.30 4.3510-Year Gov't Bond (4% 06/17) 3.71 3.85 3.95 4.00 4.10 4.35 4.4030-Year Gov't Bond (5% 06/37) 4.06 4.20 4.25 4.30 4.30 4.60 4.65
U.S. Federal Funds Target 2.00 2.00 2.25 2.75 3.25 3.75 4.0091-Day Treasury Bills 1.80 1.95 2.10 2.55 2.95 3.50 3.602-Year Gov't Note (2.875% 6/10) 2.82 2.95 3.05 3.10 3.40 3.85 4.0010-Year Gov't Note (3.875% 05/18) 4.11 4.20 4.30 4.35 4.45 4.60 4.6530-Year Gov't Bond (4.375% 02/38) 4.65 4.75 4.80 4.80 4.80 4.80 4.90
Canada - US T-Bill Spread 0.82 0.75 0.70 0.65 0.40 0.25 0.10Canada - US 10-Year Bond Spread -0.40 -0.35 -0.35 -0.35 -0.35 -0.25 -0.25
Canada Yield Curve (30-Year — 2-Year) 0.83 0.80 0.65 0.45 0.35 0.30 0.30US Yield Curve (30-Year — 2-Year) 1.83 1.80 1.75 1.70 1.40 0.95 0.90
EXCHANGE RATES — (US¢/C$) 99.0 100.0 103.1 105.3 101.5 102.0 101.5— (C$/US$) 1.011 1.000 0.970 0.950 0.985 0.980 0.985— (Yen/US$) 108 105 108 102 97 96 94— (US$/euro) 1.57 1.59 1.56 1.50 1.49 1.49 1.50— (US$/pound) 1.98 1.99 1.96 1.90 1.90 1.88 1.90— (US¢/A$) 95.9 96.5 93.0 92.5 91.0 92.0 93.0
CIBC World Markets InC. StrategEcon - June 26, 2008
�
STRATEGY AND EARNINGS OUTLOOK
•
•
•
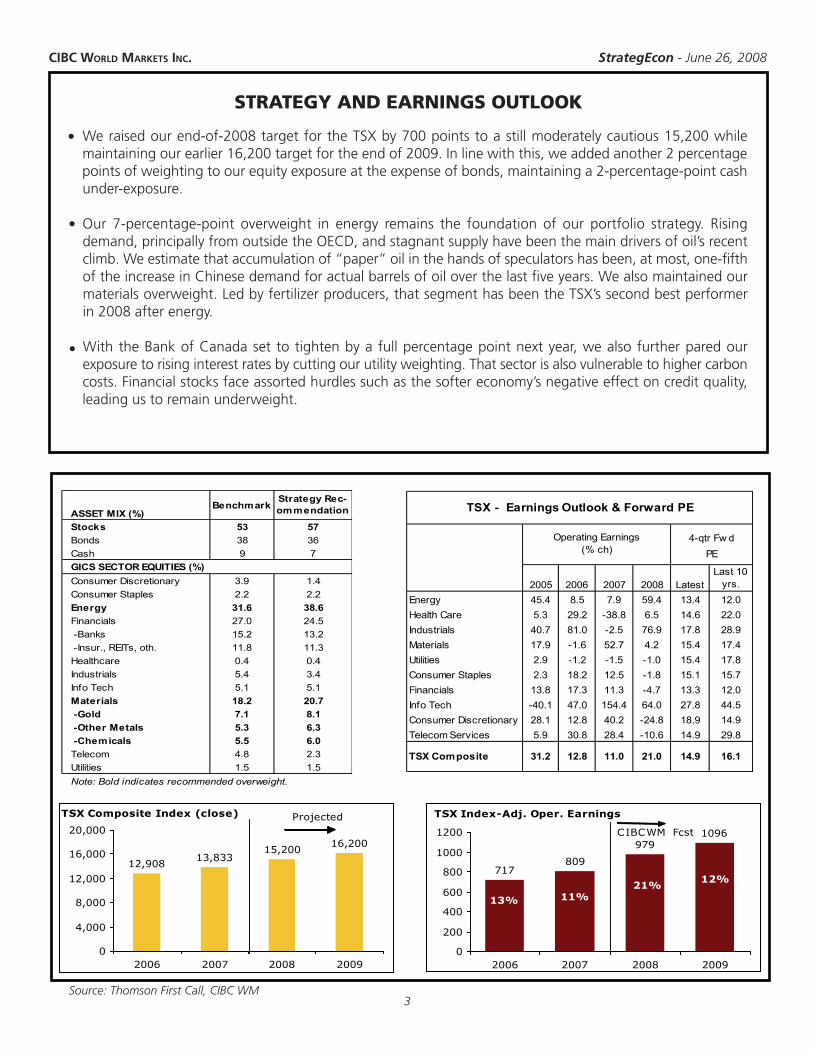
Weraisedourend-of-2008targetfortheTSXby700pointstoastillmoderatelycautious15,200whilemaintainingourearlier16,200targetfortheendof2009.Inlinewiththis,weaddedanother2percentagepointsofweightingtoourequityexposureattheexpenseofbonds,maintaininga2-percentage-pointcashunder-exposure.
Our 7-percentage-point overweight in energy remains the foundation of our portfolio strategy. Risingdemand,principallyfromoutsidetheOECD,andstagnantsupplyhavebeenthemaindriversofoil’srecentclimb.Weestimatethataccumulationof“paper”oilinthehandsofspeculatorshasbeen,atmost,one-fifthoftheincreaseinChinesedemandforactualbarrelsofoiloverthelastfiveyears.Wealsomaintainedourmaterialsoverweight.Ledbyfertilizerproducers,thatsegmenthasbeentheTSX’ssecondbestperformerin2008afterenergy.
WiththeBankofCanadasettotightenbyafullpercentagepointnextyear,wealsofurtherparedourexposuretorisinginterestratesbycuttingourutilityweighting.Thatsectorisalsovulnerabletohighercarboncosts.Financialstocksfaceassortedhurdlessuchasthesoftereconomy’snegativeeffectoncreditquality,leadingustoremainunderweight.
Source: Thomson First Call, CIBC WM
2005 2006 2007 2008 LatestEnergy 45.4 8.5 7.9 59.4 13.4Health Care 5.3 29.2 -38.8 6.5 14.6Industrials 40.7 81.0 -2.5 76.9 17.8Materials 17.9 -1.6 52.7 4.2 15.4Utilities 2.9 -1.2 -1.5 -1.0 15.4Consumer Staples 2.3 18.2 12.5 -1.8 15.1Financials 13.8 17.3 11.3 -4.7 13.3Info Tech -40.1 47.0 154.4 64.0 27.8Consumer Discretionary 28.1 12.8 40.2 -24.8 18.9Telecom Services 5.9 30.8 28.4 -10.6 14.9
TSX Composite 31.2 12.8 11.0 21.0 14.9
Last 10 yrs.
TSX - Earnings Outlook & Forward PE
PE4-qtr Fw dOperating Earnings
(% ch)
12.022.028.917.4
14.929.8
16.1
17.815.712.044.5
717809
9791096
0
200
400
600
800
1000
1200
2006 2007 2008 2009
CIBCWM Fcst
TSX Index-Adj. Oper. Earnings
12%
13%
21%11%
15,20016,200
12,90813,833
0
4,000
8,000
12,000
16,000
20,000
2006 2007 2008 2009
TSX Composite Index (close) Projected
ASSET MIX (%)Benchmark
Strategy Rec-ommendation
Stocks 53 57Bonds 38 36Cash 9 7GICS SECTOR EQUITIES (%)Consumer Discretionary 3.9 1.4Consumer Staples 2.2 2.2Energy 31.6 38.6Financials 27.0 24.5 -Banks 15.2 13.2 -Insur., REITs, oth. 11.8 11.3Healthcare 0.4 0.4Industrials 5.4 3.4Info Tech 5.1 5.1Materials 18.2 20.7 -Gold 7.1 8.1 -Other Metals 5.3 6.3 -Chemicals 5.5 6.0Telecom 4.8 2.3Utilities 1.5 1.5Note: Bold indicates recommended overweight.
CIBC World Markets InC. StrategEcon - June 26, 2008
�
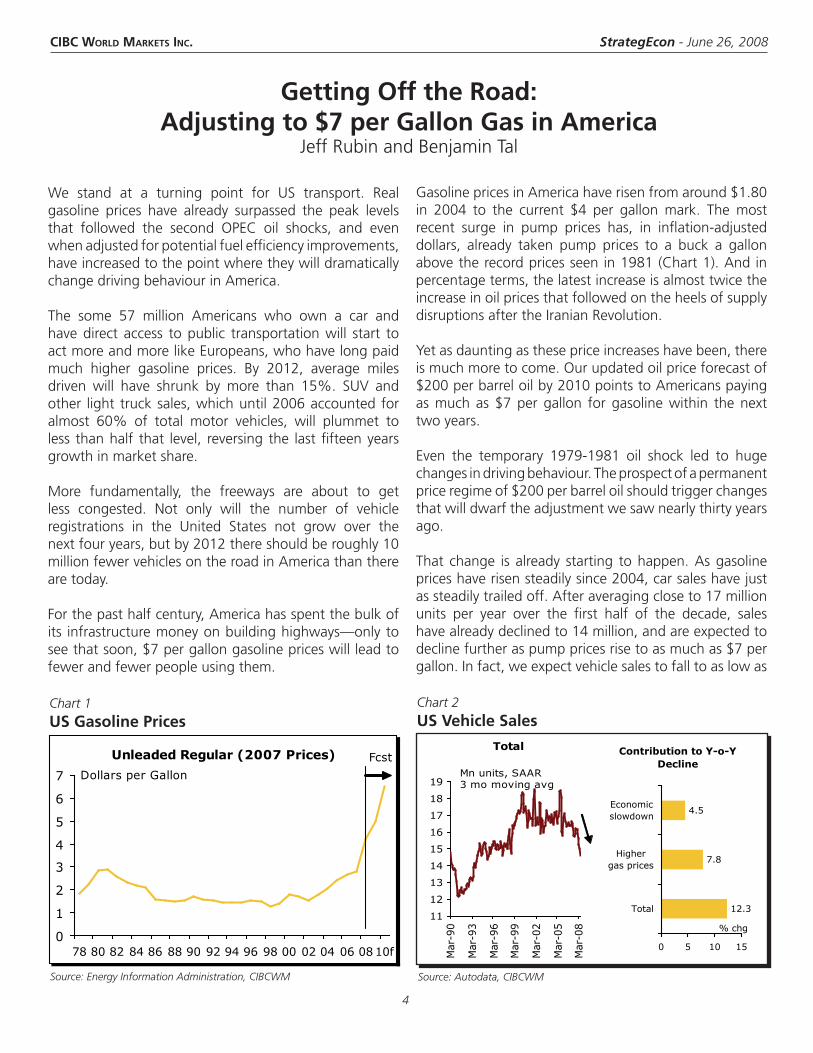
We stand at a turning point for US transport. Realgasoline prices have already surpassed the peak levelsthat followed the second OPEC oil shocks, and evenwhenadjustedforpotentialfuelefficiencyimprovements,haveincreasedtothepointwheretheywilldramaticallychangedrivingbehaviourinAmerica.
The some 57 million Americans who own a car andhavedirect access topublic transportationwill start toactmoreandmorelikeEuropeans,whohavelongpaidmuch higher gasoline prices. By 2012, average milesdriven will have shrunk by more than 15%. SUV andother light trucksales,whichuntil2006accountedforalmost 60% of total motor vehicles, will plummet toless thanhalf that level, reversing the lastfifteenyearsgrowthinmarketshare.
More fundamentally, the freeways are about to getless congested. Not only will the number of vehicleregistrations in the United States not grow over thenextfouryears,butby2012thereshouldberoughly10millionfewervehiclesontheroadinAmericathantherearetoday.
Forthepasthalfcentury,Americahasspentthebulkofits infrastructuremoneyonbuildinghighways—onlytoseethatsoon,$7pergallongasolinepriceswillleadtofewerandfewerpeopleusingthem.
GettingOfftheRoad:Adjustingto$7perGallonGasinAmerica
JeffRubinandBenjaminTal
GasolinepricesinAmericahaverisenfromaround$1.80in 2004 to the current $4 per gallon mark. The mostrecent surge in pump prices has, in inflation-adjusteddollars, already taken pump prices to a buck a gallonabovetherecordpricesseenin1981(Chart1).Andinpercentageterms,thelatestincreaseisalmosttwicetheincreaseinoilpricesthatfollowedontheheelsofsupplydisruptionsaftertheIranianRevolution.
Yetasdauntingasthesepriceincreaseshavebeen,thereismuchmoretocome.Ourupdatedoilpriceforecastof$200perbarreloilby2010pointstoAmericanspayingasmuchas$7pergallon forgasolinewithin thenexttwoyears.
Even the temporary 1979-1981 oil shock led to hugechangesindrivingbehaviour.Theprospectofapermanentpriceregimeof$200perbarreloilshouldtriggerchangesthatwilldwarftheadjustmentwesawnearlythirtyyearsago.
That change isalready starting tohappen.Asgasolinepriceshaverisensteadilysince2004,carsaleshavejustassteadilytrailedoff.Afteraveragingcloseto17millionunits per year over the first half of the decade, saleshavealreadydeclinedto14million,andareexpectedtodeclinefurtheraspumppricesrisetoasmuchas$7pergallon.Infact,weexpectvehiclesalestofalltoaslowas
Chart 2USVehicleSales
Chart 1USGasolinePrices
Source: Energy Information Administration, CIBCWM Source: Autodata, CIBCWM
Unleaded Regular (2007 Prices)
0
1
2
3
4
5
6
7
78 80 82 84 86 88 90 92 94 96 98 00 02 04 06 08 10f
Dollars per Gallon
FcstTotal
11
12
13
14
15
16
17
18
19
Mar
-90
Mar
-93
Mar
-96
Mar
-99
Mar
-02
Mar
-05
Mar
-08
Mn units, SAAR3 mo moving avg
Contribution to Y-o-Y Decline
12.3
7.8
4.5
0 5 10 15
Total
Highergas prices
Economicslowdown
% chg

CIBC World Markets InC. StrategEcon - June 26, 2008
�
Chart �SurgingGasolineCosts
11millionunitsby2012,thelowestlevelsincetheearly1980s.While someof the currentweakness in vehiclesalescanbeattributedtotheeconomicslowdown,weestimate that higher gasoline prices have had almosttwicetheeffect(Chart2).
Tumblingcarsalesandmoreprudentdrivinghabitsarealready starting to hit fuel demand. Overall gasolinedemandintheUnitedStateshasfallensharplysincethebeginningoftheyearandisheadedforthefirstannualdrop in 17 years. Per capita consumption has fallenby close to5%since2004 (Chart 3), and, like vehiclesales,willcontinuetodeclineaslongasgasolinepricescontinuetorise.
WhileAmericansarebuyinglessgasoline,unfortunately,the reduction in quantity is not keeping up with theincrease in price. Hence, even with chastened drivinghabits, most Americans are spending more on fillingtheirtanksandlessoneverythingelse.Overthelastfouryears,gasolinesaleshavegrownfivetimesasmuchasthe rest of retail sales in the United States (Chart 4)1.And at that rate, gasoline will take over grocery storespending2asthelargestiteminhouseholds’non-vehicleretailspendingbylatenextyear(Chart5).
USversusEurope
Atthesoon-to-be$6to$7pergallonrangeforgasolinepriceswecanexpecttoseesomequantumshiftsindrivingbehaviourinAmerica.Andtoseewherethoseshiftswillbegoing is relativelyeasy.Allwehavetodo is lookat
Chart �GasolineConsumptionPerCapita
Europe,whereevenattoday’sworldoilprices,driversarealreadypayingtheequivalentofthosegasolinepricesormore.Infact,inmanyplacesinEurope,theyarepayingwellabovethatandhavebeenforsometime.
Compare for example, drivingbehaviour in theUnitedKingdom with driving behaviour in the United States.Over90%ofAmericanhouseholdsuseacartogettowork,whileover60%ofUShouseholdsowntwocarsor more (Table 1). By comparison, just 60% of Britishhouseholdsuseacartogettowork,whilelessthan25%owntwoormorecars.Moreover,Americansdrivetheircarsmore.TheymakefourdrivingtripsadaywhileBrits
Source: Consumer Federation of America, CIBCWM
Source: US Census Bureau, Federal Highway Administration, CIBCWM
1st Quarter
96
100
104
108
112
97 98 99 00 01 02 03 04 05 06 07 08
Index 1997=100
Retail Sales
90
110
130
150
170
190
04 05 06 07 08
Gasoline Others
Index 2004=100
Spending on Gasoline Per Vehicle
0.4
0.9
1.4
1.9
2.4
2.9
3.4
92 94 96 98 00 02 04 0608f10f
$000s
Fcst
Chart �GasolineSpendingWillSoonOvertakeGroceries(monthlyaverages)
Source: US Census Bureau, CIBCWM
10
20
30
40
50
60
70
80
03 04 05 06 07 08 09f 10f 11f 12f
Gasoline Stations Food & Beverage Stores
$ Billion

CIBC World Markets InC. StrategEcon - June 26, 2008
6
Source: EMBARQ, CIBCWM
makehalf of thatperday.And last, butbynomeansleast,some30%ofBritsdon’tevenhaveacar.IntheUSlessthan10%ofhouseholdsdon’townacar.
Gasoline consumption is ultimately about how manypeople drive, the distance they drive and the type ofvehiclestheydrive.OnallthreecountsAmericanfaceamassivechange.
Adding the first two factors we get an index of milesdriven.Andpercapita,Americansdrive twiceasmuchasdrivers inSweden,UK,Germany,andFrance,wheregasolinepricesarenowover$8pergallon(Chart6).
Ofcoursetheflipsideofthisequationispublictransit.America’s obsession with the car is mirrored in itsavoidanceofpublictransit.Whenitcomestotakingthetrain,bus,orsubway,theUSranksthelowestamongOECDcountries, just as it ranks the highest among the samegroupwhenitcomestotheuseofthecar(Chart7).
DrivingLessinSmallerVehicles
Higher oil prices will make drivers use their cars less.While Americans are already driving 11 billion fewermiles than they did last year, a decline of 4.3%, theystilldrive todayabout30%more thantheydidbeforetheOPECoilshocks.Theelasticityofdrivingtogasolinepricesisestimatedtobearoundthe0.06.Thatmeansa10%riseingasolinepriceswilleventuallyleadtoa0.6%reductioninmilesdriven.Usingthatruleofthumb,the280%cumulativerise ingasolinepricesbetween2004andourtarget$7pergallontargetpriceshouldinducemorethan15%reduction inmilesdrivenonAmericanroads(Chart8).Thatwillturnbacktheclocktothemid1980sasfarasaveragemileagedrivenisconcerned.
Not only will Americans drive less but they will startto drive very different vehicles from the ones they arecurrently driving. Light trucks, which include vans andtheubiquitousSUV,accountedforasmuchas60%oftotalvehiclesalesinAmericabackin2006.That’salmosta doubling in its market share since the early 1990s(Chart9).Butevenat$4pergallongasoline,SUVsalesareplunging.At$7pergallonpumpprices,theirshareoftotalvehiclesales,alongwithother lighttrucks,will
Chart 7PrivateVehiclesversusPublicTransit
Chart 6GasPricesandDriving—AnInternationalPerspective
Table 1DailyTravelCharacteristics
Source: Giuliano & Dargay (200�), CIBCWM
United States
United Kingdom
Used car to get to work (%) 90.4 61.8
Total distance travelled (miles) 20.9 7.0
Number of trips 4.0 2.0
No cars in household (%) 8.0 30.6
2 cars or more in household (%) 61.9 24.7
0
2
4
6
8
10
12
14
4 5 6 7 8 9 10 11
Gasoline Prices ($/Gallon)
Avera
ge T
ravel Per
Vehic
le
(mile
s)
US
Canada
Australia
Germany/UK
Sweden
France
Source: OECD, US Census Bureau, CIBCWM
Rail, Buses & Coaches
-50 50 150 250
Japan
Italy
Sweden
France
Germany
Spain
UK
US
mn passenger
miles/100,000 Persons
Private Vehicles
0 500 1000 1500
US
Italy
France
UK
Sweden
Germany
Spain
Japan
mn passenger
miles/100,000 Persons
1,338

CIBC World Markets InC. StrategEcon - June 26, 2008
7
haveevenfallenbelowlevelsseenoverfifteenyearsago.While therewill stillbehouseholdswhowillbuy thesevehicles,allof thegains inmarketshareseenover thelastdecadewillhavebeenfullyreversed.
GettingOfftheRoad
Inpart,Americanswillrespondtorecordhighgasolinepricesbydriving lessandbydrivingmorefuelefficientvehicles.Butthemostdramaticresultwillbethatroughlytenmillionvehicleswillcomerightofftheroad.
Aswithoil,thereisadepletionrateinautos.It’scalledthe scrappage rate, and it refers to the percentage ofexistingvehiclesthateveryyearareretiredfromservice.
Lastyearthescrappageratewas5.2%3,resultinginsome12millionvehiclescomingofftheroad.Thatmeansnewvehiclesaleshadtoriseby12millionunitsjusttokeepthe stock of passenger vehicles unchanged. We knowfrom history that the scrappage rate rises with surgesinoilprices,becauseoldercars typicallyaveragemuchpoorerfueleconomythannewercarsandthusbecomeincreasinglyexpensivetorunaspumppricesrise.At$7pergallongasolinewehaveassumedthatthescrapraterisesmodestlyto6%.
A 6% scrappage rate would take roughly 14 millionvehicles off the road every year. For the number ofvehicle registrations to remain constant in the faceof that decline, there would have to be an offsettingnumberofnewvehicle sales that year. Butgiven theirlinktofuelprices,newvehiclesaleswillbeatleastthreemillionbelow thatnumberby2012.Ourprojected11mnvehicle sales in2012will be the lowest level sincetheearly1980s.Summingupthecumulativedifferencebetween new sales and scrappage over that periodsuggeststhatsomewhere intheneighbourhoodoftenmillionAmericanswillbecomingofftheroadoverthenext4½years(Chart10).
Isthisarealisticestimate?While$7pergallongasolineprices certainly took people off the road in Europe,you cannot simply impose Europe on America. MostEuropeanshave access topublic transport by virtueofthe broad infrastructure policies European countrieshavepursued.Inmarkedcontrast,Americabuiltmassivehighwaysandfreewaysforapopulationthatownedandusedtheirowncarstogetaround.
Chart 10NumberofVehiclesToFallby10Millionby2012
Chart 9PlungingSUVSales
Source: R.L. Polk Co., Federal Highway Administration, CIBCWMSource: Autodata Corporation, CIBCWM
Chart 8AmericansWillSoonDriveLess
Source: Federal Highway Administration, CIBCWM
8.0
8.5
9.0
9.5
10.0
10.5
11.0
11.5
12.0
12.5
70 76 82 88 94 00 06 12f
Fcst
Average travel per vehicle('000 miles)
Auto Scrapping vs. Sales
8
10
12
14
16
18
05 07 09f 11f
Number of cars scrappedNew auto sales
million
cumulativegap = 10 mn cars
Number of Vehicles
120
140
160
180
200
220
240
80 84 88 92 96 00 04 08 12f
million
Fcst
Light truck as a share of Total Vehicle Sales
2630343842465054586266
92 94 96 98 00 02 04 06 08 10f 12f
%

CIBC World Markets InC. StrategEcon - June 26, 2008
8
Chart 12CarOwnershipandSpendingByIncome
Source: Consumer Federation of America, BTS, CIBCWM
Chart 11AccessToPublicTransportation
Hencewemustnarrowour focuson thoseAmericanswhereaEuropeanstyleshiftindrivinghabitsiscurrentlyfeasible.Peoplecan’t simplyabandon theircars if theyhavenoothermeansofgettingaround,particularly intermsofgettingwork.Theremustbeat leastapublictransportalternative.
Asitturnsout,roughly57millionAmericanhouseholdsthat own a vehicle have reasonable access to publictransit4, slightly more than half of the number ofhouseholdswhoownavehicle(Chart11)5.Andapplyingthe80%vehicleownershiprateseen inEuropetothistarget group suggests a 10 million reduction in thenumberofregisteredvehiclesintheUS.
Wherewillthisdeclinecomefrom?Thefocusisonthosewho can least afford to operate a car when gasolinecosts $7per gallon.No less than80%of low incomeAmericans (or roughly24millionhouseholds)with lessthan$25,000annual incomeownacar.Withgasolinebillssurgingtorecordhighs,theywillbethefirsttocomeofftheroad.
OneinfiveofthoselowincomeAmericans,orroughlyfivemillionhouseholds,willprobablystopdrivingorgiveupthesecondvehicle6.Andagoodpartofthepreviouslynotedincreaseinthescrappagerateislikelytocomefromthis group, particularly the 30% of households under$25,000annual incomewhoownasecondcar,whichis likelyagas-guzzlingnear-wreck.Thevastmajorityof
these individualswill live in thecityasopposed to thesuburbs,giventheirmuchgreateraccesstopublictransit(Chart12)7.
Ouranalysissuggeststhatabouthalfofthenumberofcarscomingoff theroad in thenext fouryearswillbefromlowincomehouseholdswhohaveaccesstopublictransit.Attheircurrentdrivinghabits,fillingupthetankwillhaverisenfromabout7%oftheirincometo20%,anincreasethatwillseemanystarttakingthebus.
Note:
1. The AAA 2007 edition of “Your Driving Cost” concluded that the cost of owning a car has reached a record high in 2007. Given that this estimate was based on a cost of only $2.9� per gallon, the current figure is most likely higher.
2. Food and beverage stores only.
�. Source: R. L. Polk & Co. “The Vehicle Population Report 2007”. Note that the median age of a passenger car is currently 9 years—tying a record high in 2006.
�. Usually a reasonable access is defined as less than half a mile distance from a bus or train station.
�. Based on statistics obtained from the US Census Bureau, METRANS and Bureau of Transportation Statistics.
6. These estimates are consistent with survey-based findings published by METRANS regarding the role of public transportation in the mobility of low income households.
7. Based on US Census Bureau. Also see The Center on Urban and Metropolitan Policy discussion regarding “The State of Low-Wage Workers”.
Spending on Gasoline BY Household Income
0
5
10
15
20
25
99 01 03 05 07 09e
<$25k $100k+
Fcst% of income
No. of vehicles <$25k $100k+
% %
0 19.5 1.3
1 47.9 9.6
2 22.2 48.2
3 or more 10.4 40.9
Household Income
Source: US Census Bureau, METRANS, Bureau of Transportation Statistics, CIBCWM
%withAccessto
PublicTransport
75%
50%
25%
No. of Households with Cars
0 20 40 60
Metro
Suburb
Rural
mn
Totalno.of
Households
withCars
andAccess
toPublic
Transport
=57.4mn

CIBC World Markets InC. StrategEcon - June 26, 2008
9
It’s hard to be sanguine about America’s economicoutlook in the faceof ever increasing fuel costs.Afterall, nine out of the last 10 US recessions have beenaccompaniedby sharp spikes in thepriceof crudeoil.True,theeconomydidmanagetoweatherthestormofrisingoilpricesfrom2001to2005,aperiodinwhichthepriceofpetroleumshotupbyroughly180%evenastheUSeconomygrewbycloseto3%ayear.Somesawthisasasignofalastingbreakdowninoil’sthreattogrowth,citingthemoreefficientuseofenergyresources,deeperfinancialmarkets,andmoreflexiblelaboragreements.
Butthemorerecentoilupturn,inwhichcrudepriceshaveclimbedbyover130%sincethebeginningof2007,lookstobetakingavisiblebiteoutofgrowth(Chart1).Andamorecarefulanalysisofthepastrelationshipbetweenoil andgrowth suggests that thereweregood reasonsfortheeconomy’sinitialresilience,andthatmostoftheeconomicshockliesahead,puttingtheUSeconomyontrackforacaseofstagflationin2009evenasthehousingshockpetersout.
RedefininganOilShock
Oilpricesandeconomicgrowtharenotpartofasimpleone-way causal relationship. As was true of the largeoilspikesofthe1970sandearly1980s,thetimingand
OilandGrowth:That70sShowRe-RunAveryShenfeldandMenyGrauman
Chart 1OilPricesHelpSlowUSRealGDPGrowth
magnitudeoftheshocktogrowthisaffectedbythestateoftheeconomyatthetimeithits,themonetarypolicyresponse,thepaceofoil’sclimb,andasnotedbyenergyeconomist JamesHamilton, thedegreetowhichpricesbegintoeclipsepeaklevelsoverthepriorthreeyears.
Hamiltonshowedthatincreasesinoilpricesthatsimplyreversepreviousdeclinesdonothavethesameeconomicimpact as identical price gains from already elevatedlevels.Bythisstandard,someverylargespikesinoilpricesoverthelast50yearsdonotreallyqualifyasoilshocksatall (Chart2),beingsimplyreboundsfromtemporarycrudepricedipsthathadyettofiltertheirwayintotheeconomyatlarge.Forexample,althoughoilpricesshotupmorethan25%inthefirstquarterof1989,theywerestillbelowtheirpreviousthree-yearhigh.
Similarly, the economic hit during oil’s rise in the firsthalf of2007wasminimizedas crude’s climb from thenear$50/bbllevelsimplyreverseditsearlierdip.Instead,Hamilton’smodelsuggeststhatgiventhetypicalresponselags,thegreater impactongrowthliesaheadin2009.Theselagscapturenotonlythespreadingimpactoftheinitialshocktoothersectorsashigheroilcostsaffectjobcreationinthemostsensitivesectors,butalsotheimpactofthesubsequentinterestratehikesasthecentralbankrespondstotheinflationthreatbyraisinginterestrates.
Recessions are shaded.
Chart 2SomeOilPriceGainsDidn'tSetNewHighs
-30
-20
-10
0
10
20
30
2Q1982 1Q1989 2Q1994 1Q2003
Unadjusted (q/q % change)Adjusted (% change versus previous 3-year high)
WTI oil prices
0.0
1.0
2.0
3.0
4.0
04 05 06 07 08 090
20
40
60
80
100
120
140
160
Real GDP Growth, % (LHS)
Avg WTI Oil, $US/bbl (RHS)

CIBC World Markets InC. StrategEcon - June 26, 2008
10
the $150 bn in planned direct consumer stimulus willhavegonetopayforhighercosts for fuel, ratherthanincreasesinoverallspendingvolumes(Chart5).
Moreover,oneoftheearlierargumentsforwhyoilmightmatter less these days is rapidly disappearing. Untilrecently, it was commonplace to dismiss the oil shockby pointing to the fact that the US economy, with itsshift intoservices,hadbecomesignificantly lessenergyintensivethanitwasinthe1970s,whenoilshocksdidsomuchdamage.ButalthoughUScrudeoilexpendituresmadeuponly4%ofGDPlastyear,thissharewillgrowto9.5%overthenextthreeyearsascrudepriceshitanaverageof$200/bblin2010(Chart6).Intermsofoil’sshare of spending, we’re right back where we startedfrom.
As a result, applying that model shows that after aminimalshockto2008growth,ourforecastforafurtherclimbtoanaverage$150/bblnextyearwillpare2009realGDPgrowthby2.0-2.5%points,relativetoabasecaseofflatoilpricesandaresultingmoremoderatecourseforinterestrates.Thatwillturnwhatmighthavebeenabrisk3%+recovery fromthisyear’shousing-related troublesintoananemicexpansion.
It’snot that thishasbeen the steepest shock to crudeoilonrecord.Indeed,measuredagainstarollingthree-year high, so far this year oil prices have not climbedat anywhere near the speed that they did during theearly 1970s (Chart 3). But past shocks were oftenshort-lived, as they related to temporary disruptions insupply,includingthoseengineeredbyOPEC.Thismorefundamentally driven oil upsurge should prove to bemuchmorepersistentthanatanyothertimeinhistoryasbothrealandnominaloilpricescontinuetobreakalltimerecords(Chart4).ThelongestrunningcontinuousoilspikeinUShistorylastedsevenquarters,whileweexpectoilprices,atleastonatrendbasis,tobeheadedhigherrightthrough2012.
BehindtheMath
While the model’s forecast of a 2-2.5%-point growthshock simply reflects past sensitivities, on the groundrealitiesalsoareconsistentwithsluggishgrowthaheadfor 2009. Note that this year, consumer spending isbeingtemporarilyproppedupbybillionsintaxrebates.Butdon’texpectthatone-offmeasuretohavealastingimpactongrowth,inpartbecauseit’sbeingcannibalizedbyrisinggasolineprices.Alreadythisyear,nearlyhalfof
Chart �GasolineSpendingTakesHalfofStimulusFunds
0
20
40
60
80
100
120
140
160
Jan.
08
Feb.
08
Mar.0
8
Apr.0
8
May.0
8
June
.08
Stim
ulus
Pac
kage
$ bn, cummulative increase in gasoline spending
Chart �OilPriceSetsRecordinRealTerms(2008$s)
-
20
40
60
80
100
120
140
160
Q1.60 Q1.67 Q1.74 Q1.81 Q1.88 Q1.95 Q1.02
Real WTI oil Nominal WTI oil
$US/bbl, quarterly avg.
$92
Q2f:$122
Chart �ALongerRunofNewHighsinOilthisTime
-
5
10
15
20
25
30
35
40
Q1.70 Q1.77 Q1.84 Q1.91 Q1.98 Q1.05
chg in WTI oil price from 3-yr high, %
Fcst90
85

CIBC World Markets InC. StrategEcon - June 26, 2008
11
Chart 6OilIntensityisOntheRise
Indeed, it’s not just how much oil drains initially fromconsumerorbusinessfinancesorreducesenergyuse,buttheadjustmentcoststotheeconomyfromtheresultingsharpchangesinbehavior.That’salreadybeingseenashundreds of thousands of auto-related jobs disappearwiththemeltdowninlighttrucksales, longbeforetheeconomy can replace them with activity in producingmoreenergy-efficienttransportationalternatives.Theoilshockwillsimilarlyhaverippleeffectsonairlines,tourismandothersectors.
Another‘thistimewillbedifferent’argumentnotesthatthe1970soilshockswerecausedbysupplydisruptionsthathurtglobalgrowth,whilethepresentcrudeoilrun-upwasinitiallydrivenbyhealthyglobalgrowththatisinitselfabenefittotheUSeconomy.Todate,thathasforthemostpartbeenthecase,andhasbeenreflectedinabullmarketforUSexports.
But in addition to rapid economic growth in thedeveloping world, recent crude prices also capture anoutrightdeclineincrudeoilsupplyfrom2005to2007,and much more limited medium term supply growthprospects than were available in earlier decades (seeOccasional Report #6�).SupplydisruptionsinNigeriaanddecliningRussianproductionwill easilyoutweighwhatSaudiArabiaplans toadd in thenear term.Moreover,whileweexpectgrowthtoholdupwellinthedevelopingworld,theoilshockwill,withsimilarlags,takeabiteoutofactivityinUStradingpartnersinEurope.
OilTakesHousing’sPlace
Butthemostimportantreasonforthinkingthatthemajorhittogrowthliesaheadrestsontheresponseinmonetarypolicy.Asanumberofprominenteconomists,includingBen Bernanke himself, have pointed out, the impactof some of the biggest oil shocks were exacerbatedby aggressive Fed tightening. The 1973-74 oil shock,inparticular,wasmadeworseby the Fed’sdecision tobelatedly raise the fed funds rateby830bpsover thespanoflessthanthreeyears(Chart7,left).Thelast30yearslargelycoincidedwithstableinflationexpectations,whichmeantthatcentralbankerscouldavoidaggressivelyraising rates in the face of climbing energy prices.Unfortunately,forthefirsttimesincetheearly1980s,thatappearstobechanging,asconsumerinflationcontinuestoheatupandtheFedcomesunderincreasingpressuretoact.
At a minimum, once the worst of the housing shockpasses,theFedwillbeforcedtoraiserealinterestratesbacktozeroinordertopreventanimprovingeconomyfromallowingwagesandotherpricestocatchuptooil.With CPI trending at an energy- and food-driven 4%,thatwillentail200basispointsintighteningtogettoa4%fundsratebytheendofnextyear.Asaresultofourupwardrevisedcallforbothoilandinterestrates,we’vechoppedourUSgrowthforecastfor2009fromjustover2%asoftwomonthsago,tolittleover1%,nobetterthan this year’shousing-bluntedperformance. TheUSeconomyhasmanagedtoavoidfeelingthefullbruntofoilpricesoverthelastfewyears,but2009willbetheyearthatitsluckrunsout(Chart7,right).
Chart 7OilShocksPushInterestRatesHigher
0%
2%
4%
6%
8%
10%
1973 1977 1981 1985 1989 1993 1997 2001 2005 2009
Fcst
US oil expenditures as share of GDP
2
4
6
8
10
12
14
Q4.70
Q3.71
Q2.72
Q1.73
Q4.73
Q3.74
Effective fed funds rate
WTI oil, $US qtly avg
%
0
1
2
3
4
5
Q1.08 Q3.08 Q1.09 Q3.0980
100
120
140
160
180
Target fed funds rate (LHS)
WTI oil, $US qtly avg (RHS)
%

CIBC World Markets InC. StrategEcon - June 26, 2008
12
CANADA
ECONOMIC UPDATE
UNITED STATES
ConflictsofInterest:CIBCWorldMarkets’analystsandeconomistsarecompensatedfromrevenuesgeneratedbyvariousCIBCWorldMarketsbusinesses,includingCIBCWorldMarkets’InvestmentBankingDepartment.CIBCWorldMarketsmayhavealongorshortpositionordealasprincipalinthesecuritiesdiscussedherein,relatedsecuritiesorinoptions,futuresorotherderivativeinstrumentsbasedthereon.Thereadershouldnotrelysolelyonthisreportinevaluatingwhetherornottobuyorsellthesecuritiesofthesubjectcompany.LegalMatters:Thisreportisissuedandapprovedfordistributionby(i)inCanadabyCIBCWorldMarketsInc.,amemberoftheIDAandCIPF,(ii)intheUK,CIBCWorldMarketsplc,whichisregulatedbytheFSA,and(iii)inAustralia,CIBCWorldMarketsAustraliaLimited,amemberoftheAustralianStockExchangeandregulatedbytheASIC(collectively,“CIBCWorldMarkets”).ThisreportisdistributedintheUnitesStatesbyCIBCWorldMarketsInc.andhasnotbeenreviewedorapprovedbyCIBCWorldMarketsCorp.,amemberoftheNewYorkStockExchange(“NYSE”),NASDandSIPC.ThisreportisintendedfordistributionintheUnitedStatesonlytoMajorInstitutionalInvestors(assuchtermisdefinedinSEC15a-6andSection15oftheSecuritiesExchangeActof1934,asamended)andisnotintendedfortheuseofanypersonorentitythatisnotamajorinstitutionalinvestor.MajorInstitutionalInvestorsreceivingthisreportshouldeffecttransactionsinsecuritiesdiscussedinthereportthroughCIBCWorldMarketsCorp.Thisreportisprovided,forinformationalpurposesonly,toinstitutionalinvestorandretailclientsofCIBCWorldMarketsinCanada,anddoesnotconstituteanofferorsolicitationtobuyorsellanysecuritiesdiscussedhereininanyjurisdictionwheresuchofferorsolicitationwouldbeprohibited.ThisdocumentandanyoftheproductsandinformationcontainedhereinarenotintendedfortheuseofprivateinvestorsintheUnitedKingdom.SuchinvestorswillnotbeabletoenterintoagreementsorpurchaseproductsmentionedhereinfromCIBCWorldMarketsplc.ThecommentsandviewsexpressedinthisdocumentaremeantforthegeneralinterestsofclientsofCIBCWorldMarketsAustraliaLimited.Thisreportdoesnottakeintoaccounttheinvestmentobjectives,financialsituationorspecificneedsofanyparticularclientofCIBCWorldMarketsInc.Beforemakinganinvestmentdecisiononthebasisofanyinformationcontainedinthisreport,therecipientshouldconsiderwhethersuchinformationisappropriategiventherecipient’sparticularinvestmentneeds,objectivesandfinancialcircumstances.CIBCWorldMarketsInc.suggeststhat,priortoactingonanyinformationcontainedherein,youcontactoneofourclientadvisersinyourjurisdictiontodiscussyourparticularcircumstances.Sincethelevelsandbasesoftaxationcanchange,anyreferenceinthisreporttotheimpactoftaxationshouldnotbeconstruedasofferingtaxadvice;aswithanytransactionhavingpotentialtaximplications,clientsshouldconsultwiththeirowntaxadvisors.Pastperformanceisnotaguaranteeoffutureresults.Theinformationandanystatisticaldatacontainedhereinwereobtainedfromsourcesthatwebelievetobereliable,butwedonotrepresentthattheyareaccurateorcomplete,andtheyshouldnotberelieduponassuch.Allestimatesandopinionsexpressedhereinconstitutejudgementsasofthedateofthisreportandaresubjecttochangewithoutnotice.AlthougheachcompanyissuingthisreportisawhollyownedsubsidiaryofCanadianImperialBankofCommerce(“CIBC”),eachissolelyresponsibleforitscontractualobligationsandcommitments,andanysecuritiesproductsofferedorrecommendedtoorpurchasedorsoldinanyclientaccounts(i)willnotbeinsuredbytheFederalDepositInsuranceCorporation(“FDIC”),theCanadaDepositInsuranceCorporationorothersimilardepositinsurance,(ii)willnotbedepositsorotherobligationsofCIBC,(iii)willnotbeendorsedorguaranteedbyCIBC,and(iv)willbesubjecttoinvestmentrisks,includingpossiblelossoftheprincipalinvested.TheCIBCtrademarkisusedunderlicense.(c)2008CIBCWorldMarketsInc.Allrightsreserved.Unauthorizeduse,distribution,duplicationordisclosurewithoutthepriorwrittenpermissionofCIBCWorldMarketsInc.isprohibitedbylawandmayresultinprosecution.
AnearlierprojectedstarttoNorthAmericanratehikeshasustrimmingourCanadianrealgrowthoutlookfor2009,withsomewhatlessgrowthcomingfromrealexports(althoughnominalexportswillremainhealthy)andinterestsensitivebusinessandresidentialinvestment.Inflationhasmovedontothesharplyclimbingtrackthatwehavebeenanticipatingforseveralmonths,andweaddedabittotheheadlineratefor2009inlinewithanupgradedoilpricecall.
We’ve raised our economic growth forecast for the remainder of the year to reflect a more resilient USconsumer,andtocapturethepositiveimpactof$150bninfederaleconomicstimulus.Lookingtonextyearthough,wehavetakendownourrealGDPforecastbyroughly1%-ptasaresultofourhigheroutlookforoilpricesandamorehawkishFed.AsinCanada,ourinflationforecasthasbeenedgedhigheronthebackofanupwardrevisiontoourforecastclimbinenergyprices.
CANADA 08Q1A 08Q2F 08Q3F 08Q4F 2007 2008F 2009F
Real GDP Growth (AR) -0.3 0.7 1.2 3.0 2.7 1.1 1.9
Real Final Domestic Demand (AR) 2.3 2.7 2.8 3.0 4.2 3.7 3.0
All Items CPI Inflation (Y/Y) 1.8 2.2 3.0 3.5 2.1 2.6 3.3
Core CPI Ex Indirect Taxes (Y/Y) 1.4 1.5 1.6 2.3 2.1 1.7 2.1
Unemployment Rate (%) 5.9 6.2 6.4 6.3 6.0 6.2 6.3
Merchandise Trade Balance (C$ Bn) 52.8 53.8 35.1 34.7 48.8 44.1 40.9
U.S.
Real GDP Growth (AR) 0.9 -0.2 -0.4 2.9 2.2 1.3 1.3
Real Final Sales (AR) 0.7 -1.0 -0.5 2.2 2.5 1.2 1.3
All Items CPI Inflation (Y/Y) 4.1 4.1 4.7 4.8 2.9 4.4 4.1
Core CPI Inflation (Y/Y) 2.4 2.3 2.2 2.3 2.3 2.3 2.8
Unemployment Rate (%) 4.9 5.3 5.5 5.6 4.6 5.3 5.3