economics of a linear network october 2007. 2 executive summary launch major linear channel network...
TRANSCRIPT
Economics of a Linear Network
October 2007
2
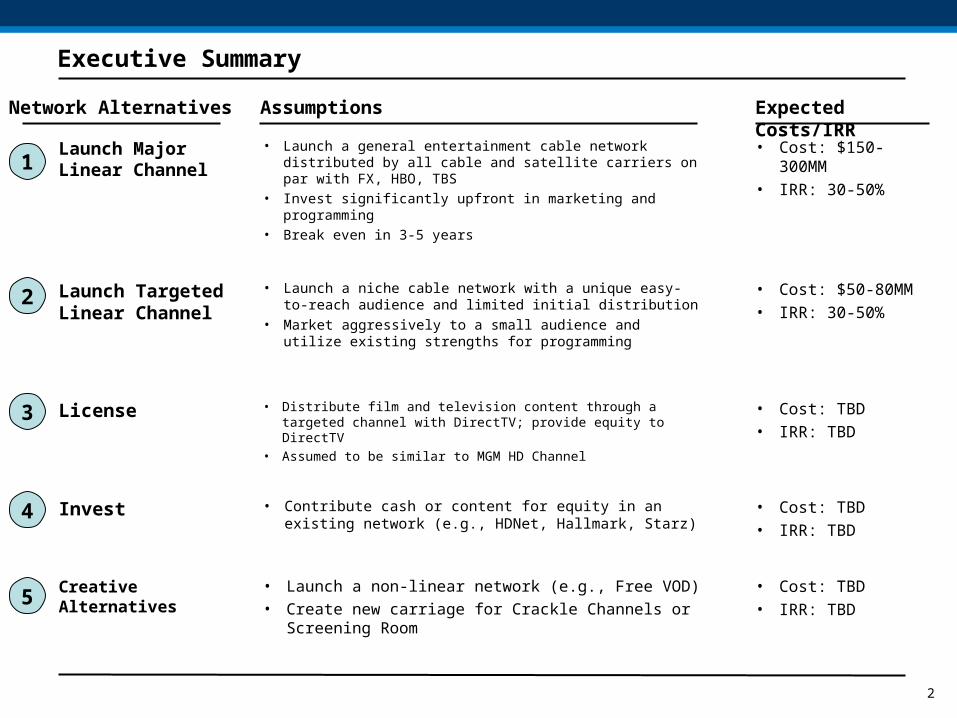
Executive Summary
Launch Major Linear Channel
Network Alternatives Assumptions Expected Costs/IRR
• Launch a general entertainment cable network distributed by all cable and satellite carriers on par with FX, HBO, TBS
• Invest significantly upfront in marketing and programming• Break even in 3-5 years
• Cost: $150-300MM• IRR: 30-50%
Launch Targeted Linear Channel
• Launch a niche cable network with a unique easy-to-reach audience and limited initial distribution
• Market aggressively to a small audience and utilize existing strengths for programming
• Cost: $50-80MM• IRR: 30-50%
Invest • Contribute cash or content for equity in an existing network (e.g., HDNet, Hallmark, Starz)
• Cost: TBD• IRR: TBD
Creative Alternatives • Launch a non-linear network (e.g., Free VOD)• Create new carriage for Crackle Channels or Screening
Room
• Cost: TBD• IRR: TBD
License • Distribute film and television content through a targeted channel with DirectTV; provide equity to DirectTV
• Assumed to be similar to MGM HD Channel
• Cost: TBD• IRR: TBD
1
2
3
4
5

3
-30%
-20%
-10%
0%
10%
20%
30%
40%
50%
60%
70%
0 2 4 6 8 10 12 14
Yrs to turn cash flow positive
IRR*
Two Traditional Approaches to Network Launches
Tennis Channel
GSN
FOX News
FX
Hallmark Channel
G4
*IRR Assumes 8x cash flow multiple exit in 2008Source: Kagan, SPT Analysis
FUSE
Size of bubble represents total cash investment
Slow-growth networks
Fast-growth networks
• Size: $61MM• IRR: 55%
• Size: $107MM• IRR: 42%
• Size: $391MM• IRR: 30%
• Size: $288MM• IRR: 4%
• Size: $132MM• IRR: 10%
• Size: $93MM• IRR: 9%
• Size: $87MM• IRR: -12%
4
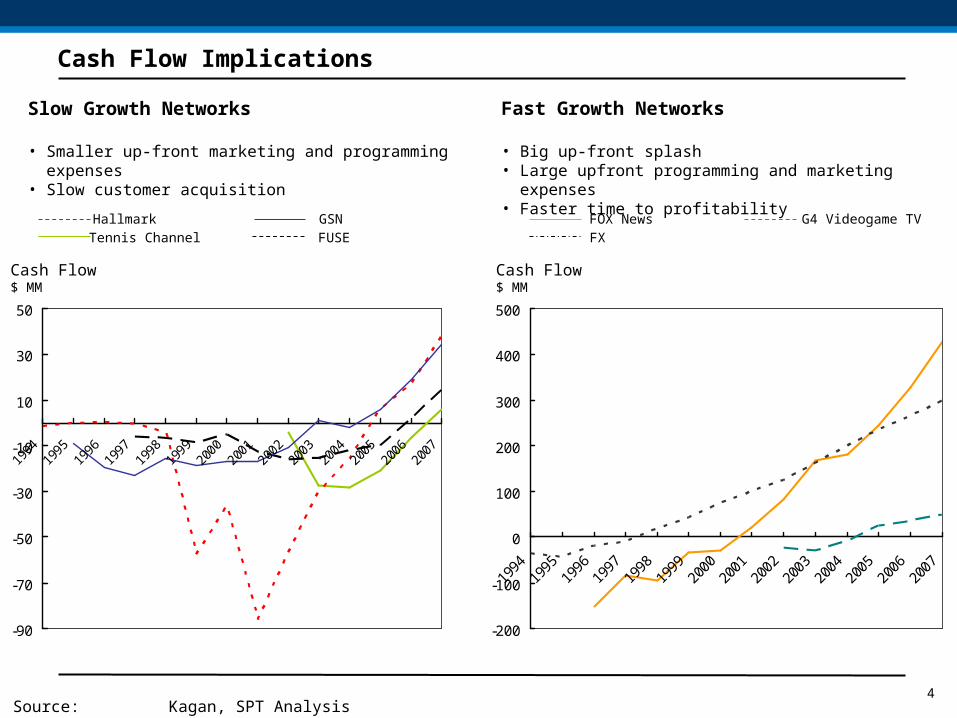
Cash Flow Implications
-90
-70
-50
-30
-10
10
30
50
1994
1995
1996
1997
1998
1999
2000
2001
2002
2003
2004
2005
2006
2007
-200
-100
0
100
200
300
400
500
1994
1995
1996
1997
1998
1999
2000
2001
2002
2003
2004
2005
2006
2007
Slow Growth Networks
• Smaller up-front marketing and programming expenses• Slow customer acquisition
Fast Growth Networks
• Big up-front splash• Large upfront programming and marketing expenses• Faster time to profitability
Hallmark
Tennis Channel
GSN
FUSE
FOX News
FX
G4 Videogame TV
Source: Kagan, SPT Analysis
Cash Flow$ MM
Cash Flow$ MM

5
17
37
100
3
51
46
46
Net Ad Revenue
License Fee Revenue
Total Revenue
Program-ming Expense
Free Cash Flow
Revenue and Cost Breakdown of an Average Cable Network
Revenues/Costs %
Source: Kagan, SPT Analysis
Other Revenue
SG&A
Original Programming
AcquiredProgramming
6
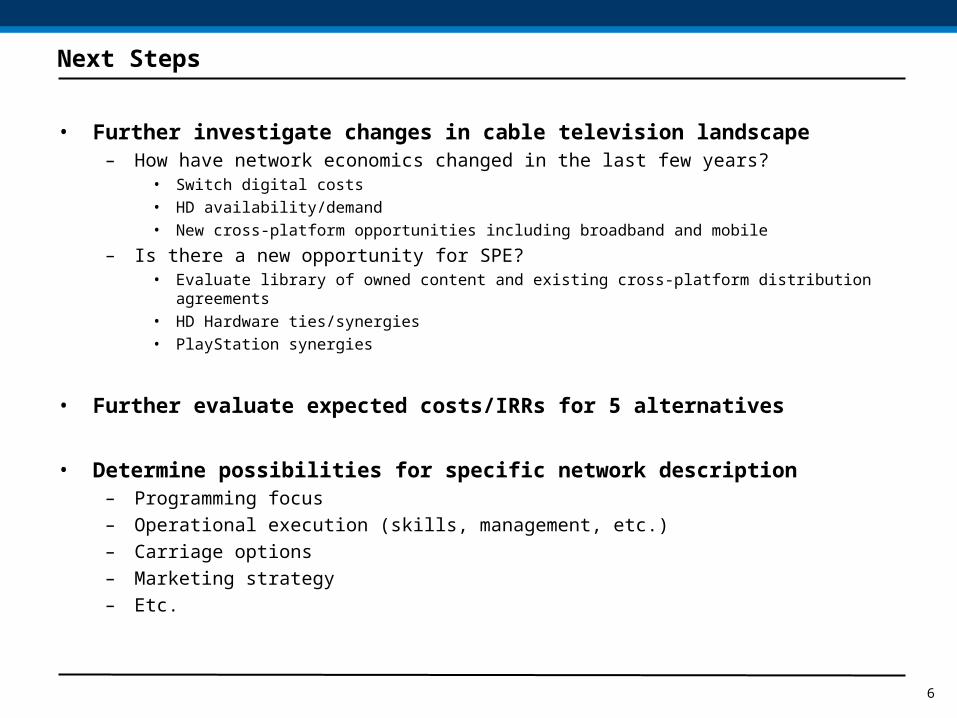
Next Steps
• Further investigate changes in cable television landscape– How have network economics changed in the last few years?
• Switch digital costs• HD availability/demand• New cross-platform opportunities including broadband and mobile
– Is there a new opportunity for SPE?• Evaluate library of owned content and existing cross-platform distribution agreements• HD Hardware ties/synergies• PlayStation synergies
• Further evaluate expected costs/IRRs for 5 alternatives
• Determine possibilities for specific network description– Programming focus
– Operational execution (skills, management, etc.)
– Carriage options
– Marketing strategy
– Etc.

7
APPENDIX

8
Deepwater Investments and IRR by Network
A large investment doesn’t necessarily correspond to a big IRR
Deepwater Investment
$ MM
IRR*
%
*IRR Assumes 8x cash flow multiple exit in 2008Source: Kagan, SPT Analysis

9
G4 Videogame TV Economics
2002 2003 2004 2005 2006 2007 ExitYear-end subs (mil.) 9.0 14.0 49.8 53.5 58.1 62.3
Avg. subs (mil.) 4.5 11.5 31.9 51.6 55.8 60.2Avg. License Fee/Sub/Mo. ($) 0.05 0.07 0.05 0.06 0.06 0.07Gross Ad Revenue ($ mil.) 1.3 5.5 31.9 57.7 72.2 88.5Net Ad Revenue ($ mil.) 1.1 4.7 27.1 49.1 61.4 75.2License Fee Revenue ($ mil.) 2.7 9.0 19.1 34.1 40.2 47.0Other Revenue ($ mil.) 0.5 0.6 0.7 0.8 0.9 1.0
Total Net Revenue ($ mil.) 4.3 14.3 46.9 84.0 102.5 123.2SG&A ($ mil.) 9.0 19.9 20.1 21.2 23.1 25.0Programming Expenses ($ mil.) 19.5 23.2 35.2 38.7 44.5 49.0
Total Expenses ($ mil.) 28.5 43.1 55.3 59.9 67.6 74.0Cash Flow ($ mil.) (24.2) (28.8) (8.4) 24.1 34.9 49.2 393.6
Total Investment to Profitability ($ mil.) (61.4)IRR 55% Cash Flow Curve
(40.0)
(30.0)
(20.0)
(10.0)
0.0
10.0
20.0
30.0
40.0
50.0
60.0

10
FX Economics
1994 1995 1996 1997 1998 1999 2000 2001 2002 2003 2004 2005 2006 2007 ExitYear-end subs (mil.) 18.0 24.6 30.5 33.2 38.1 45.3 57.0 75.3 79.6 83.0 85.1 87.9 90.5 93.7
Avg. subs (mil.) 9.0 21.3 27.6 31.9 35.6 41.7 51.1 66.1 77.4 81.3 84.1 86.5 89.2 92.1Avg. License Fee/Sub/Mo. ($) 0.03 0.20 0.22 0.23 0.24 0.26 0.28 0.27 0.27 0.30 0.32 0.34 0.35 0.36Gross Ad Revenue ($ mil.) 0.4 15.8 41.2 51.3 70.0 88.2 81.7 120.6 167.1 192.5 240.8 278.5 319.0 363.6Net Ad Revenue ($ mil.) 0.3 13.4 35.0 43.6 59.5 75.0 69.4 102.5 142.0 163.6 204.7 236.8 271.2 309.1License Fee Revenue ($ mil.) 3.7 52.2 73.0 87.9 102.7 130.0 171.8 214.3 246.3 292.7 322.9 353.0 374.7 397.9Other Revenue ($ mil.) 0.1 2.6 2.9 3.4 9.4 9.4 8.9 8.4 8.2 8.0 7.6 7.2 7.3 7.4
Total Net Revenue ($ mil.) 4.1 68.2 110.9 134.9 171.6 214.4 250.1 325.2 396.5 464.3 535.2 597.0 653.2 714.4SG&A ($ mil.) 10.7 5.8 15.0 42.0 44.9 48.1 50.5 58.1 55.7 53.0 54.8 56.2 57.9 59.6Programming Expenses ($ mil.) 29.2 105.0 115.0 102.1 107.2 123.3 124.6 166.9 217.0 249.5 280.7 306.0 330.4 356.9
Total Expenses ($ mil.) 39.9 110.8 130.0 144.1 152.1 171.4 175.1 225.0 272.7 302.5 335.5 362.2 388.3 416.5Cash Flow ($ mil.) (35.8) (42.6) (19.1) (9.2) 19.5 43.0 75.0 100.2 123.8 161.8 199.7 234.8 264.9 297.9 2383.2
Total Investment to Profitability ($ mil.) (106.7)IRR 42% Cash Flow Curve
(50.0)
0.0
50.0
100.0
150.0
200.0
250.0
300.0
1994

11
FOX News Economics
1996 1997 1998 1999 2000 2001 2002 2003 2004 2005 2006 2007 ExitYear-end subs (mil.) 17.0 24.0 36.4 44.0 57.5 77.2 82.0 85.0 86.6 87.9 91.5 94.7
Avg. subs (mil.) 8.5 20.5 30.2 40.2 50.7 67.3 79.6 83.5 85.8 87.2 89.7 93.1Avg. License Fee/Sub/Mo. ($) 0.00 0.08 0.13 0.15 0.20 0.17 0.17 0.19 0.22 0.24 0.27 0.30Gross Ad Revenue ($ mil.) 1.8 10.6 15.3 34.4 60.2 70.5 129.2 245.4 302.4 406.2 533.6 677.7Net Ad Revenue ($ mil.) 1.5 9.0 13.0 29.3 51.2 59.9 109.8 208.6 257.0 345.3 453.6 576.1License Fee Revenue ($ mil.) 0.0 20.0 45.3 72.4 120.0 140.0 162.0 195.0 226.5 251.3 285.3 329.5Other Revenue ($ mil.) 0.0 0.5 1.0 2.0 4.0 8.0 9.6 12.0 13.2 14.3 15.1 15.7
Total Net Revenue ($ mil.) 1.5 29.5 59.3 103.7 175.2 207.9 281.4 415.6 496.7 610.9 754.0 921.3SG&A ($ mil.) 139.5 59.0 89.4 58.0 67.0 58.0 72.5 97.9 132.1 145.3 157.0 168.7Programming Expenses ($ mil.) 13.0 54.0 64.8 77.8 138.0 130.0 127.4 149.1 184.4 221.3 271.1 325.3
Total Expenses ($ mil.) 152.5 113.0 154.2 135.8 205.0 188.0 199.9 247.0 316.5 366.6 428.1 494.0Cash Flow ($ mil.) (151.0) (83.5) (94.9) (32.1) (29.8) 19.9 81.5 168.6 180.2 244.3 325.9 427.3 3418.4
Total Investment to Profitability ($ mil.) (391.3)IRR 30% Cash Flow Curve
(200.0)
(100.0)
0.0
100.0
200.0
300.0
400.0
500.0

12
FUSE Economics
1997 1998 1999 2000 2001 2002 2003 2004 2005 2006 2007 ExitYear-end subs (mil.) 2.0 4.0 8.0 12.0 18.3 29.5 35.2 36.8 39.7 48.4 54.8
Avg. subs (mil.) 1.0 3.0 6.0 10.0 15.2 23.9 32.3 36.0 38.2 44.0 51.6Avg. License Fee/Sub/Mo. ($) 0.02 0.04 0.06 0.08 0.06 0.06 0.05 0.07 0.07 0.07 0.07Gross Ad Revenue ($ mil.) 0.1 0.5 1.4 2.9 7.1 9.6 15.7 23.5 30.0 32.4 45.5Net Ad Revenue ($ mil.) 0.1 0.5 1.2 2.5 6.1 8.2 13.3 20.0 25.5 27.5 38.7License Fee Revenue ($ mil.) 0.2 1.4 4.3 9.6 10.9 17.9 20.2 29.1 32.1 38.1 46.0Other Revenue ($ mil.) 0.2 0.3 0.4 0.6 0.8 1.9 3.8 4.6 5.7 6.8 8.2
Total Net Revenue ($ mil.) 0.5 2.2 5.9 12.7 17.8 28.0 37.3 53.7 63.3 72.4 92.9SG&A ($ mil.) 4.0 5.0 8.5 10.0 20.6 32.0 36.1 41.5 44.0 40.1 42.1Programming Expenses ($ mil.) 2.5 4.0 6.0 8.0 10.0 12.0 16.8 24.5 29.1 30.1 36.1
Total Expenses ($ mil.) 6.5 9.0 14.5 18.0 30.6 44.0 52.9 66.0 73.1 70.2 78.2Cash Flow ($ mil.) (6.0) (6.8) (8.6) (5.3) (12.8) (16.0) (15.6) (12.3) (9.8) 2.2 14.7 117.6
Total Investment to Profitability ($ mil.) (93.2)IRR 6% Cash Flow Curve
(20.0)
(15.0)
(10.0)
(5.0)
0.0
5.0
10.0
15.0
20.0

13
GSN Economics
1995 1996 1997 1998 1999 2000 2001 2002 2003 2004 2005 2006 2007 ExitYear-end subs (mil.) 1.5 5.0 12.0 18.5 25.4 31.2 42.2 50.4 53.6 56.6 57.9 60.5 62.4
Avg. subs (mil.) 0.8 2.5 8.5 15.3 22.0 28.3 36.7 46.3 52.0 55.1 57.2 59.2 61.7Avg. License Fee/Sub/Mo. ($) 0.00 0.03 0.03 0.03 0.03 0.04 0.04 0.04 0.04 0.05 0.06 0.07 0.08Gross Ad Revenue ($ mil.) 0.0 0.4 5.1 12.2 18.9 22.0 21.4 33.3 55.1 62.9 67.1 76.5 88.5Net Ad Revenue ($ mil.) 0.0 0.3 4.3 10.4 16.1 18.7 18.2 28.3 46.8 53.5 57.0 65.0 75.2License Fee Revenue ($ mil.) 0.0 0.9 3.0 5.9 9.1 12.6 17.4 23.3 27.8 32.7 40.9 50.7 60.8Other Revenue ($ mil.) 0.1 0.0 0.0 0.0 0.0 0.0 1.5 1.6 1.8 1.9 2.0 2.1 2.2
Total Net Revenue ($ mil.) 0.1 1.2 7.3 16.3 25.2 31.3 37.1 53.2 76.4 88.1 99.9 117.8 138.2SG&A ($ mil.) 7.9 15.2 24.0 27.6 33.6 35.3 37.5 40.1 40.3 50.0 52.0 54.6 57.3Programming Expenses ($ mil.) 1.3 5.6 6.2 4.6 10.1 13.0 16.3 24.0 35.1 40.4 42.2 44.3 46.5
Total Expenses ($ mil.) 9.2 20.8 30.2 32.2 43.7 48.3 53.8 64.1 75.4 90.4 94.2 98.9 103.8Cash Flow ($ mil.) (9.1) (19.6) (22.9) (15.9) (18.5) (17.0) (16.7) (10.9) 1.0 (2.3) 5.7 18.9 34.4 275.2
Total Investment to Profitability ($ mil.) (131.9)IRR 10% Cash Flow Curve
(30.0)
(20.0)
(10.0)
0.0
10.0
20.0
30.0
40.0
14
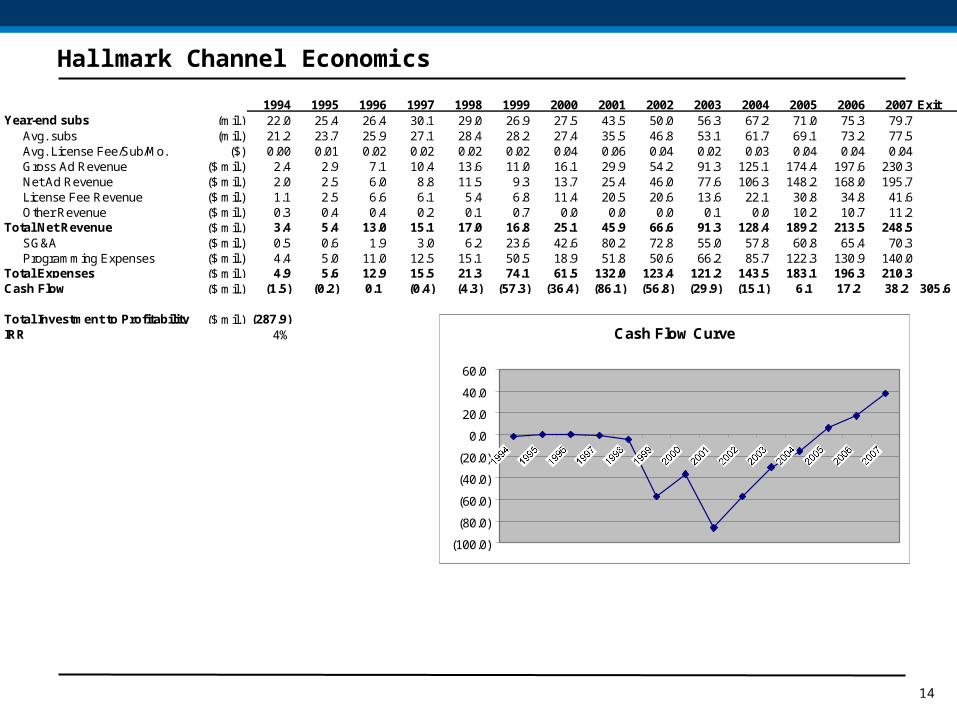
Hallmark Channel Economics
1994 1995 1996 1997 1998 1999 2000 2001 2002 2003 2004 2005 2006 2007 ExitYear-end subs (mil.) 22.0 25.4 26.4 30.1 29.0 26.9 27.5 43.5 50.0 56.3 67.2 71.0 75.3 79.7
Avg. subs (mil.) 21.2 23.7 25.9 27.1 28.4 28.2 27.4 35.5 46.8 53.1 61.7 69.1 73.2 77.5Avg. License Fee/Sub/Mo. ($) 0.00 0.01 0.02 0.02 0.02 0.02 0.04 0.06 0.04 0.02 0.03 0.04 0.04 0.04Gross Ad Revenue ($ mil.) 2.4 2.9 7.1 10.4 13.6 11.0 16.1 29.9 54.2 91.3 125.1 174.4 197.6 230.3Net Ad Revenue ($ mil.) 2.0 2.5 6.0 8.8 11.5 9.3 13.7 25.4 46.0 77.6 106.3 148.2 168.0 195.7License Fee Revenue ($ mil.) 1.1 2.5 6.6 6.1 5.4 6.8 11.4 20.5 20.6 13.6 22.1 30.8 34.8 41.6Other Revenue ($ mil.) 0.3 0.4 0.4 0.2 0.1 0.7 0.0 0.0 0.0 0.1 0.0 10.2 10.7 11.2
Total Net Revenue ($ mil.) 3.4 5.4 13.0 15.1 17.0 16.8 25.1 45.9 66.6 91.3 128.4 189.2 213.5 248.5SG&A ($ mil.) 0.5 0.6 1.9 3.0 6.2 23.6 42.6 80.2 72.8 55.0 57.8 60.8 65.4 70.3Programming Expenses ($ mil.) 4.4 5.0 11.0 12.5 15.1 50.5 18.9 51.8 50.6 66.2 85.7 122.3 130.9 140.0
Total Expenses ($ mil.) 4.9 5.6 12.9 15.5 21.3 74.1 61.5 132.0 123.4 121.2 143.5 183.1 196.3 210.3Cash Flow ($ mil.) (1.5) (0.2) 0.1 (0.4) (4.3) (57.3) (36.4) (86.1) (56.8) (29.9) (15.1) 6.1 17.2 38.2 305.6
Total Investment to Profitability ($ mil.) (287.9)IRR 4% Cash Flow Curve
(100.0)
(80.0)
(60.0)
(40.0)
(20.0)
0.0
20.0
40.0
60.0
15
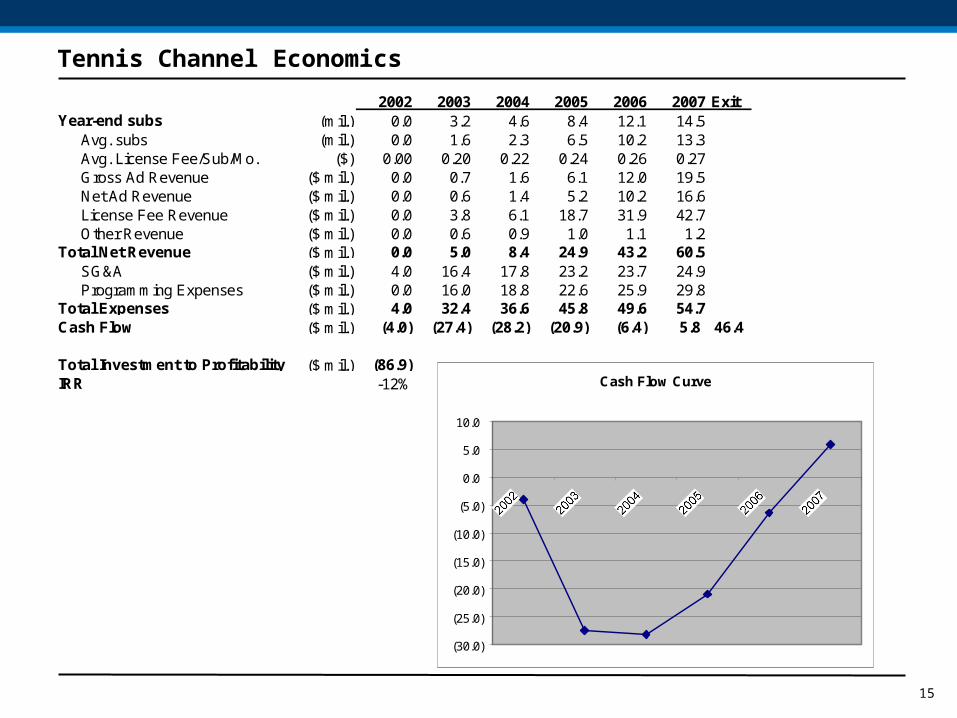
Tennis Channel Economics
2002 2003 2004 2005 2006 2007 ExitYear-end subs (mil.) 0.0 3.2 4.6 8.4 12.1 14.5
Avg. subs (mil.) 0.0 1.6 2.3 6.5 10.2 13.3Avg. License Fee/Sub/Mo. ($) 0.00 0.20 0.22 0.24 0.26 0.27Gross Ad Revenue ($ mil.) 0.0 0.7 1.6 6.1 12.0 19.5Net Ad Revenue ($ mil.) 0.0 0.6 1.4 5.2 10.2 16.6License Fee Revenue ($ mil.) 0.0 3.8 6.1 18.7 31.9 42.7Other Revenue ($ mil.) 0.0 0.6 0.9 1.0 1.1 1.2
Total Net Revenue ($ mil.) 0.0 5.0 8.4 24.9 43.2 60.5SG&A ($ mil.) 4.0 16.4 17.8 23.2 23.7 24.9Programming Expenses ($ mil.) 0.0 16.0 18.8 22.6 25.9 29.8
Total Expenses ($ mil.) 4.0 32.4 36.6 45.8 49.6 54.7Cash Flow ($ mil.) (4.0) (27.4) (28.2) (20.9) (6.4) 5.8 46.4
Total Investment to Profitability ($ mil.) (86.9)IRR -12% Cash Flow Curve
(30.0)
(25.0)
(20.0)
(15.0)
(10.0)
(5.0)
0.0
5.0
10.0