ecosystem effects of reduction fisheries• ~30 mt of ~ 80 mt of fish landed annually are small...
TRANSCRIPT

Ecosystem Effects of Reduction Fisheries
Jackie AlderSea Around Us Project
18 November 2005
Fisheries Centre
Sea Around Us Project

Outline
• Aquaculture Production• Small Pelagic Fisheries• Direct Impacts• Pollutants• Sustainability• Ecosystem Structure• Rebuilding
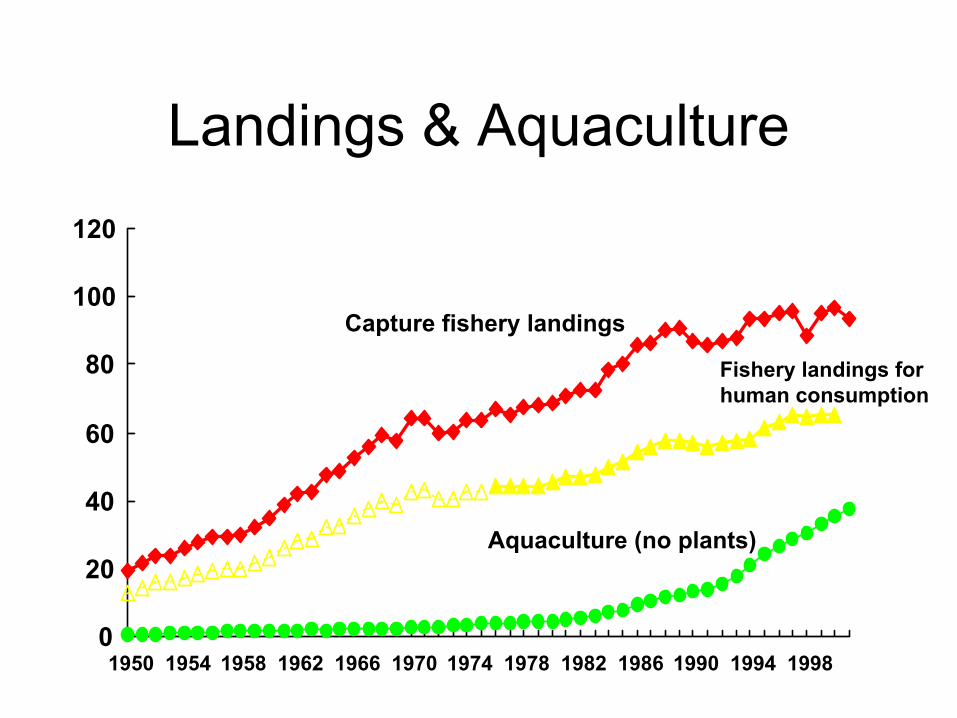
Landings & Aquaculture
0
20
40
60
80
100
120
1950 1954 1958 1962 1966 1970 1974 1978 1982 1986 1990 1994 1998
Capture fishery landings
Aquaculture (no plants)
Fishery landings for human consumption


Small Pelagic Fisheries(various species - SAUP defined)
Marine MammalsSeabirds Direct HumanConsumption(canned, frozen blocks )
Indirect Use
Fishoil Fishmeal
aquaculture feed industrial Aquaculture Other AnimalFeed
Fertilizer
• ~30 Mt of ~ 80 Mt of fish landed annually are small pelagic
• 20-30 Mt of fish and invertebrates used for meals and oils
• other fish products used in fishmeal and oil
• 5.6 mMt of meal and 1.0 mMt of oil produced
• Currently 48% of fishmeal and 81% of fish oil to aquaculture
Source Tacon 2005

Trends in Landings% Small
0
5
10
15
20
25
30
35
1950 1955 1960 1965 1970 1975 1980 1985 1990 1995 2000
Year

Reduction Fishery Landings 2003

Imports/Exports
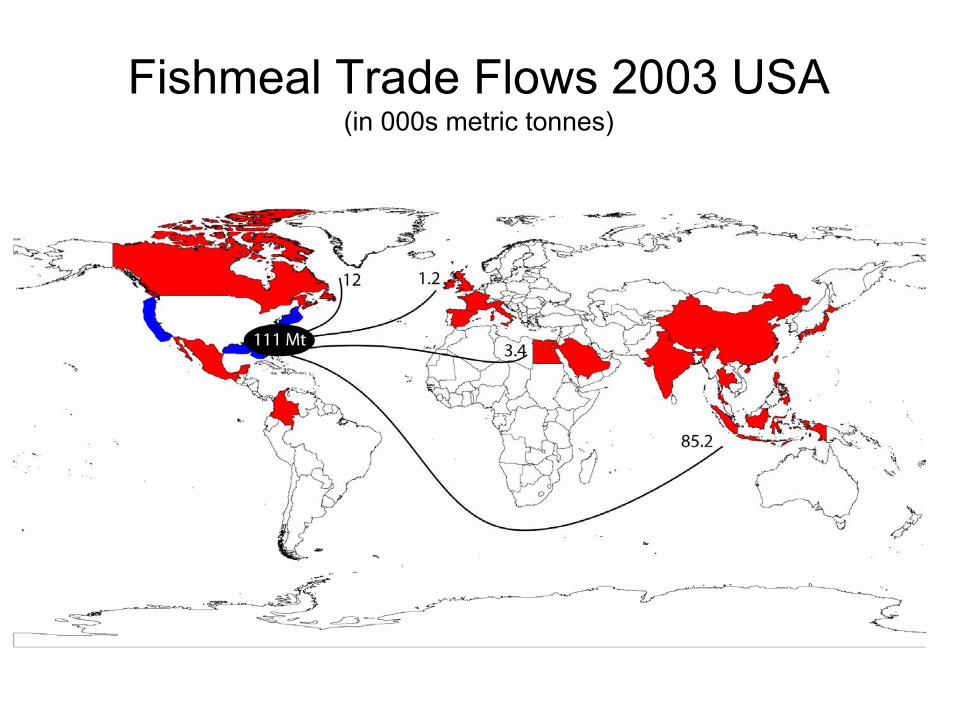
Fishmeal Trade Flows 2003 USA (in 000s metric tonnes)

Fish Oil Trade Flow 2003 USA(in 000s metric tonnes)
10

Fishmeal Trade Flow 2003 Latin America
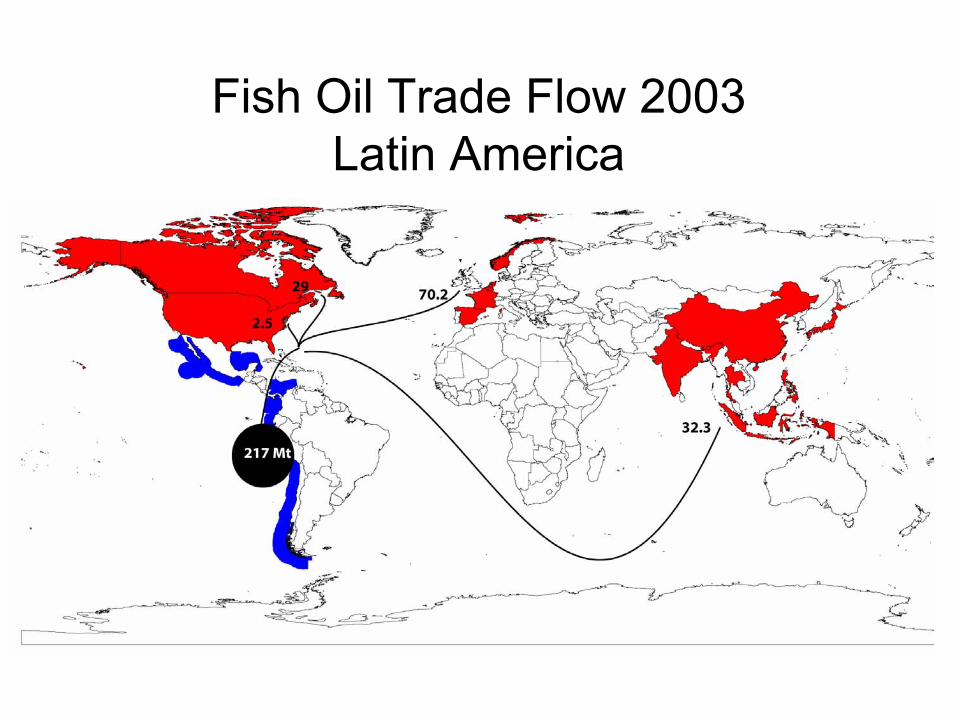
Fish Oil Trade Flow 2003 Latin America

Fishmeal Trade Flow 2003 Northern Europe

Fish Oil 2003 Northern Europe

2002 Fishmeal Imports to China value
• Peru (61.9)• Chile (17.7)• USA (8.9)
Potential Effects of Reduction of Fisheries
• Direct effects - marine & coastal systems• Transfer of pollutants• Sustainability• Ecosystem Components• Rebuilding stocks

Direct effects
• Fishing gear – purse seines for most species (e.g.
anchovy, blue whiting) – Bottom trawlers also used (e.g. herring)
• Bycatch• Coastal water quality

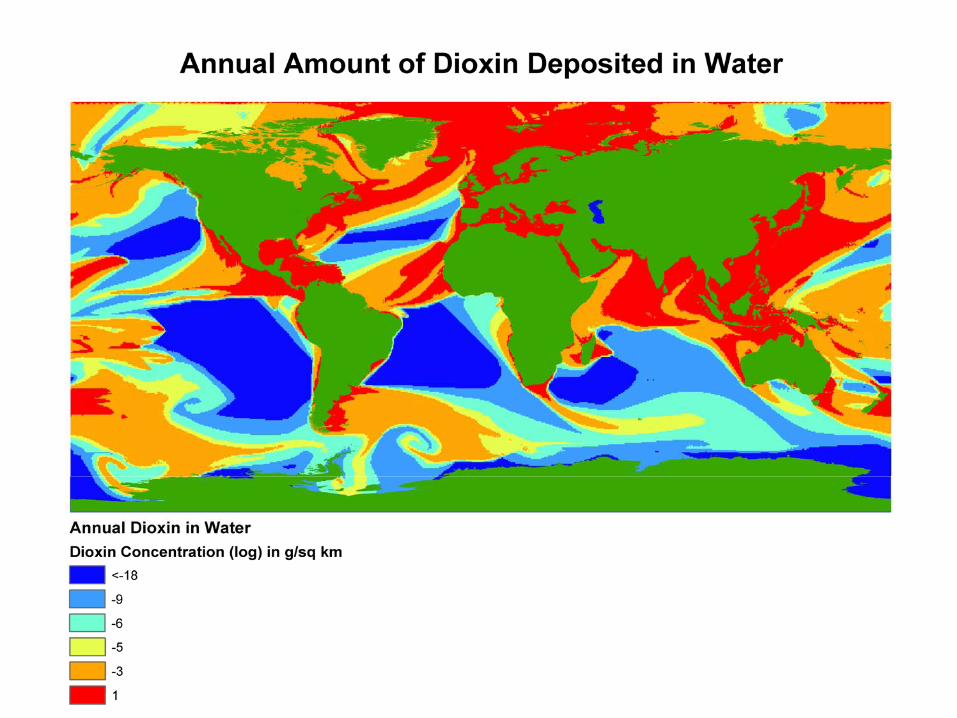
Pollutants
• Persistent Organic Pollutants – Dioxins and Furans
• Heavy Metals– Mercury, cadmium, lead
Sustainability

IFFO Fisheries Sustainability Criteria

Fishery StatusAlmost all stocks are at least fully exploited:• Latin America
– Anchoveta, pilchards, jack mackerel - fully to over-exploited
• North America– Menhaden - fully exploited
• Europe– Blue whiting over-exploited, sandeels possibly over-
exploited• Pacific
– NW pollock fully to over-exploited; NE overexploitedFAO 2005

Ecosystems

Trophic Level & Fishing Down

Trophic Level Change
• The trophic level of marine capture fish is declining while
• the trophic level of fish from aquaculture is increasing
• (Based on FAO production data and trophic levels in FishBase www.fishbase.org)

2
2.2
2.4
2.6
2.8
1970 1973 1976 1979 1982 1985 1988 1991 1994 1997 2000
Mean Functional Trophic Level of Aquaculture
Trop
hic
Leve
l
Asian
Non-Asian
Mean Functional Trophic Level of Aquaculture

Marine Mammal & Seabird Overlap in the 1990s
• Seabirds consume 8.22 million tonnes small pelagics– 8.53% of total consumption
• Marine mammals consume 28 million tonnesof small pelagics– 19 to 4% of total consumption

Food consumption rates 1990s [tonnes * km-2 * year-1]
0.250 – 0.500
0.075 – 0.100
0.050 – 0.075
0.025 – 0.050
0.015 – 0.250
0.010 – 0.015
> 0.5
0.100 – 0.250
0.005 – 0.010
0.001 – 0.050
Marine Mammal Consumption

Rebuilding
• Fish for reduction also prey for commercially important fish
• If exploitation levels too high prey availability is an issue
• Marine mammal and seabird populations affected by changes in small pelagic abundance

Future Actions & Research• Fishmeal & Oil Certification - possible but
major changes in the industry needed in terms of tracking
• Continued research into feed and oil alternatives; feeding efficiencies
• Tradeoff analysis between wild capture and culturing; risk analysis of potential developments
• Climate change impacts on stocks and interactions with other ecosystem components as well as on aquaculture production
Acknowledgements
• Pew Institute for Ocean Science• Pew Charitable Trusts of Philadelphia• SAUP colleagues• Peter Tyedmers, Dalhousie University